11email: ranjankmr488@gmail.com 22institutetext: Department of Physics and Astronomy, National Institute of Technology, Rourkela - 769008, Odisha, India 33institutetext: Nicolaus Copernicus Astronomical Center, Polish Academy of Sciences, ul. Rabiańska 8, 87-100 Toruń, Poland 44institutetext: Sternberg Astronomical Institute of the Lomonosov Moscow State University, University av. 13, 119234 Moscow, Russia 55institutetext: Nicolaus Copernicus Astronomical Centre, Polish Academy of Sciences, ul. Bartycka 18, 00-716 Warsaw, Poland 66institutetext: Department of Astronomy and Astrophysics, Tata Institute of Fundamental Research, Mumbai - 400005, India
Discovery of a hot post-AGB star in Galactic globular cluster E3
Abstract
Context. The visually brightest stars in globular clusters (GCs) are the post-asymptotic giant branch (PAGB) stars. They are rare in GCs due to their short lifespan (0.5 Myr). We report a new hot-PAGB star identified in the Galactic GC E3, which is one of the first to show a binary signature among the identified PAGB stars of GCs.
Aims. We present a detailed photometric and spectroscopic analysis to study the evolutionary status of the newly identified hot-PAGB star.
Methods. We use Gaia EDR3 proper motion (PM) and parallax measurements to confirm the cluster membership. We supplement the photometric observations with radial velocities (RVs) from multi-epoch high resolution (R28000) spectroscopic observations. We fitted the spectral energy distribution of 30 photometric fluxes of the PAGB star from ultraviolet to infra-red passbands with the TLUSTY BSTAR2006 stellar atmosphere model to derive its physical parameters, , , , and R. We derive the chemical abundances of nine elements (He, C, N, O, Ne, Al, Si, S, and Fe) using spectroscopic measurements. The derived chemical abundances, kinematic information, and stellar parameters are used to study the evolution history of the star.
Results. The PM and parallax of the identified PAGB star match well with cluster parameters, which confirms its cluster membership. We find that the RVs vary over 6 km s-1 between the two epochs. This is an indication of the star being in a binary orbit. A simulation of possible binary systems with the observed RVs suggests a binary period of either 39.12 days or 17.83 days with mass ratio, q1.0. The [Fe/H] derived using the high-resolution spectra is 0.7 dex matches well with the cluster metallicity. Various PAGB evolutionary tracks on the H-R diagram suggest a current mass of the identified PAGB star in the range 0.510.55 . The star is enriched with C and O abundances, showing similar CNO abundances compared to the other PAGB stars of GCs with the evidence of 3rd dredge-up on the AGB phase.
Key Words.:
Stars: AGB and post-AGB – (Galaxy:) globular clusters: individual: E31 Introduction
Post-AGB (PAGB) stars are the most luminous objects in globular clusters (GCs) that have evolved from the top of the asymptotic giant branch (AGB) and moved leftward in the HR diagram at almost constant luminosity (Kwok, 1982, 1993). They are rare in GCs (expected to be one/two per cluster) due to the fact that PAGB stars have a very short lifetime ( Moehler et al., 2019) compared to the age of GCs ( Harris, 1996). Nevertheless, a handful of PAGB stars have been detected in more than 150 Galactic GCs (for detail see Moehler et al., 2019; Davis et al., 2022; Dixon, 2024).
There are three major categories of PAGB stars observed in GCs based upon the evolution of their progenitors on the horizontal branch (HB, the core He burning phase). HB stars, with H-rich envelope, ascend towards AGB, having several thermal pulses at the tip of the AGB, and their post-AGB phase is treated as the normal PAGB phase (Greggio & Renzini, 1990; Dorman et al., 1993; Moehler et al., 2019). HB stars with H-poor envelope but H-envelope ¿ 0.02 ascend towards AGB but never reach the AGB-tip and leave the AGB phase early111either having one or two thermal pulses or without experiencing any thermal pulse (Moehler et al., 2019) and their post-AGB phase is known as post-early-AGB (PEAGB) phase (Greggio & Renzini, 1990; Dorman et al., 1993; Moehler et al., 2019). They are less luminous than the normal PAGB stars (Dorman et al., 1993; Moehler et al., 2019). The third category of PAGB stars are evolved from HB stars with H-envelope ¡ 0.02 (extreme-HB stars) (Dorman et al., 1993; Moehler et al., 2019). They never reach the AGB phase; rather, they remain hot and luminous during their post-HB evolution and, ultimately, cool down through the white dwarf (WD) phase. Such PAGB stars are known as AGB-manqué stars (Dorman et al., 1993; Gratton et al., 2010; Moehler et al., 2019).
In a cluster with a large binary fraction, few RGB stars in a binary system lose enough mass to their companion. They become inefficient in igniting He during the RGB phase and evolve off the RGB at the luminosity comparable to their RGB tip. Such stars are called post-RGB stars (Lei et al., 2015; Kamath et al., 2016). They have similar luminosities to PEAGB stars and ignite He either on their post-RGB phase or white dwarf cooling track (Cassisi et al., 2003; Miller Bertolami et al., 2008; Lei et al., 2015).
Moehler et al. (2019) did a comprehensive analysis of 78 Galactic GCs to identify the hot PAGB stars. They found 19 new PAGB stars in addition to 12 previously known PAGB/PEAGB stars. Prabhu et al. (2021) have detected five PAGB stars in the NGC 2808 using ultraviolet (UV) images of Ultraviolet Imaging Telescope (UVIT) onboard AstroSat (Tandon et al., 2017, 2020). Davis et al. (2022) studied 97 Galactic GCs using optical filters and found 13 cooler (F and G type) PAGB stars among them. Dixon (2024) studied CNO and s-process abundances of previously known 17 PAGB stars in the Galactic GCs to find evidence of the 3rd dredge-up (3DU) among GC PAGB stars. Considering all the above surveys, a total of 42 unique PAGB/PEAGB/AGB-manqué stars have been observed so far in more than 150 Galactic GCs. None of them has shown any binary signature (neither photometric nor spectroscopic). However, the low mass PAGB stars, V29 in cen and K648 in M15, indicate that they have evolved in a binary system (Dixon, 2024).
In this paper, we report the discovery of a new hot-PAGB star in Galactic GC E3 (ESO 37-1; Lauberts, 1976) using UV images of UVIT and Gaia EDR3 data. E3 (RAJ2000 = 09:20:57.07, DEJ2000 = 77:16:54.8; Harris, 1996, 2010) is one of the faintest GCs in the Milky Way and likely to be the least massive one (; Sollima & Baumgardt, 2017). It is a metal rich cluster (; de la Fuente Marcos et al., 2015; Salinas & Strader, 2015; Monaco et al., 2018) with a moderate reddening (; Schlafly & Finkbeiner, 2011). The cluster has the largest binary fraction (72%) among Galactic GCs (Milone et al., 2012).
2 Photometric and Spectroscopic Observation
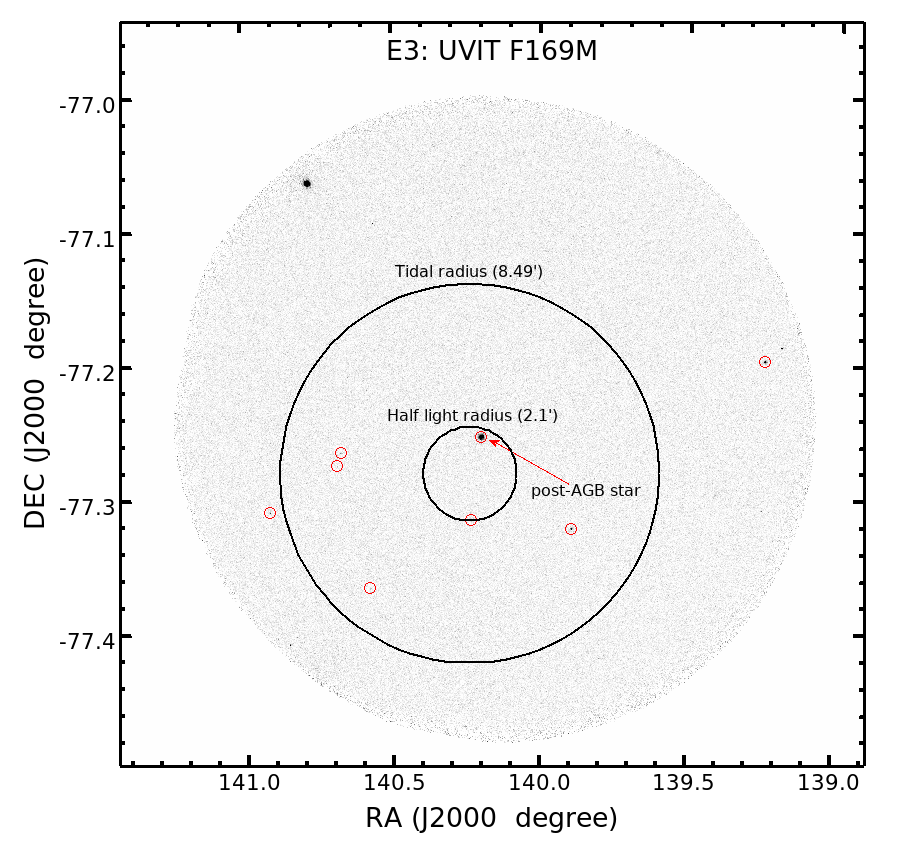
E3 was observed in two far-UV (FUV: 13001800 Å) filters, F154W and F169M, of UVIT. The total exposure times of F169M and F154W filters are 6047 sec and 3546 sec, respectively. The field of view (FoV) of UVIT is sufficient enough to cover the entire cluster (tidal radius = 8.49 arcmin, Harris, 1996). However, we see only two FUV bright sources within FoV of UVIT; One is within the half-light radius of the cluster, and the other is at the edge of the image (Fig. 1). The sources at the edges of the UVIT FoV are unreliable due to edge artefacts; hence, they were excluded during photometry. Finally, we detect eight sources in the FUV, as shown in red circles in Fig. 1.
RA (J2000) DEC (J2000) Parallax PMRA PMDEC Gaia/G UVIT/F154W UVIT/F169M GAIA ID (hh:mm:ss.ss) (dd:mm:ss.ss) (mas) (mas/yr) (mas/yr) 09:20:48.02 -77:15:15.36 0.1501 0.0127 -2.6651 0.0155 7.0414 0.0155 13.576 14.700 14.670 5203319520096719360
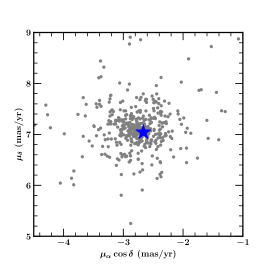
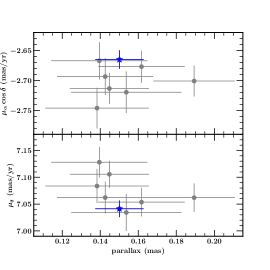
We have used the GC catalogue of Gaia EDR3 (GCG21; Vasiliev & Baumgardt 2021) for cluster membership analysis and optical colour-magnitude diagram (CMD). GCG21 provides information about the source positions (RA, DEC), proper motions (PMRA, PMDEC), parallax222The catalogue provides zero point corrected parallax values as suggested by Lindegren et al. (2021)., cluster membership probability, and photometric magnitudes in G, BP, and RP filters for sources observed in the 170 Galactic GCs. We found 479 Gaia observed sources of E3 within the UVIT FoV having cluster membership probability 90%. We cross-matched the eight UVIT observed sources with the Gaia catalogue and found only one source to be a cluster member, which is indicated by the red arrow in Fig. 1. The source is bright in FUV and optical bands (FUVmag = 14.70 and Gaia Gmag = 13.70) and lies well within the half-light radius of the cluster. In Fig. 2, we have shown all the Gaia observed cluster member sources (grey solids) and the UVIT observed cluster member source (blue asterisk) on the vector-point diagram (left panel) and the parallax vs. PMRA (middle upper panel) and parallax vs. PMDEC (middle lower panel). For parallax information, we have selected only those cluster member sources with good parallax (SNR ¿ 5) and found only 8 out of 479 cluster member sources. The mean proper motions and parallax of the cluster estimated by Vasiliev & Baumgardt (2021) are PMRA () (mas/yr), PMDEC () = 7.083 0.027 (mas/yr), and parallax () = 0.146 0.013, respectively. We find that the proper motion and the parallax values of the UVIT observed source are in good agreement with the Gaia observed cluster member sources (Fig. 2). The details of the UVIT and the Gaia observations of the source are given in Table 1.
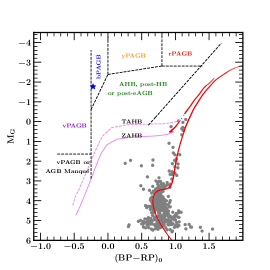
In the right panel of Fig. 2, we have shown the optical CMD of the cluster member sources (grey solids) in the absolute magnitude plane. The colours and magnitudes of Gaia filters are dereddened using E(BV) = 0.29 (Schlafly & Finkbeiner, 2011) and Cardelli et al. (1989) extinction law. The Gaia G magnitudes are scaled to the absolute magnitudes using distance modulus, mM = 14.50 (Baumgardt & Vasiliev, 2021). The UVIT observed source (blue asterisks) is 2.0 mag brighter than the other cluster member sources and appears bluer in colour (BPRP 0.2 mag), which is the location of the blue evolved stars of GCs (Zinn et al., 1972; Moehler et al., 2019; Bond, 2021). We have marked various regions of PAGB stars, defined by Bond (2021) as red-PAGB (rPAGB), yellow-PAGB (yPAGB), blue-PAGB (bPAGB), and AGB manqué stars, on the Gaia BPRP vs. G CMD (right panel of Fig. 2). The UVIT observed cluster member source can be found in the bPAGB region. Hence, we confirm that the source is an evolved PAGB star and a bonafide member of the GC E3.
2.1 Spectroscopic observations of the PAGB star
The spectroscopic observations of the identified PAGB star were obtained at two epochs (17 February 2023 and 26 March 2023) with a high resolution (R28000) CHIRON333http://www.astro.yale.edu/smarts/1.5m.html spectrograph (Tokovinin et al., 2013) installed on the SMARTS-1.5 m telescope at CTIO observatory, Chile. The observation details are given in Table 3, and the reduction procedure of the spectra is explained in Appendix A.
2.1.1 Radial Velocities
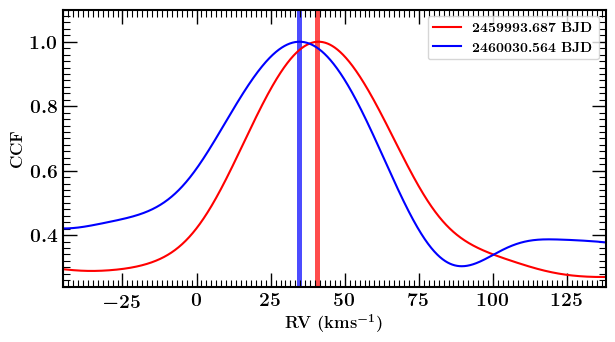
We measured the radial velocities (RVs) using our own implementation (Hełminiak et al., 2019) of the todcor technique (Zucker & Mazeh, 1994). The procedure is described in Appendix B. The RVs were estimated as 40.200.57 km s-1 and 34.660.85 km s-1 for the spectra observed at the first and second epochs, respectively. These values are quite high with respect to the mean RV of the cluster (12.6 km s-1; Monaco et al., 2018). However, the change in velocities between two epochs is quite substantial; this signals the possible binarity of the star. Since the cluster has a large binary fraction (Milone et al., 2012), it is possible that the identified PAGB star is evolving in a binary system. In Appendix C, we have performed simulations for possible binary configurations of the identified PAGB star with constraints from the RVs. The simulations create binary models with different primary mass values in the range 0.20.8 . We find the period of the binary models is spread around 39.12 days (51% of the models) and 17.83 days (16.4% of the models) (Fig. 7). This suggests a close orbit of the system. The mass ratio444the ratio between the companion mass and the PAGB mass (q) of the system lies in the range of 0.21.5. Milone et al. (2012) calculated photometric binary fractions for E3 and found that around 40% of the cluster members have a binary with q¿0.5. We do not see another companion in the spectra, so q¿1.5 (a conservative upper limit) is unlikely. Since the source is close to the half-light radius, it is likely to have a heavier companion. Hence, we suggest q1.0 for the binary system. However, Further spectroscopic monitoring is required to confirm the binarity and characterise the companion.
2.1.2 Atmospheric parameters and abundances
The atmospheric parameters ( and ) of the PAGB star were derived from CHIRON spectra using a relation involving the ionization balance between Si ii and Si iii, for a set of and pairs from TLUSTY model grid BSTAR2006 (Lanz & Hubeny, 2007). The procedure of atmospheric parameters estimation is described in Appendix D. We find T K, and from the spectral analysis of the identified PAGB star.
Using the above parameters derived from the spectra of the PAGB star, we derive abundances () of all elements detected in the spectrum. These values are collected in Table 2 along with the standard deviations of the abundances, measured on individual lines. The chemical composition analysis of the individual elements is given in Appendix E. The derived individual abundances of metals in the star are 2 to 5 times lower than in the Sun (Table 2), suggesting that the star is metal-poor. The [Fe/H] abundance (0.70.2 dex) matches with the cluster metalicity (Monaco et al., 2018).
| [X/H] | N | |||||
|---|---|---|---|---|---|---|
| He | 10.93 | 11.00 | 0.07 | 0.03 | 0.08 | 4 |
| C | 8.43 | 7.70 | 0.73 | 0.03 | 0.07 | 2 |
| N | 7.83 | 7.56 | 0.27 | 0.29 | 0.3 | 9 |
| O | 8.69 | 8.43 | 0.26 | 0.04 | 0.07 | 4 |
| Ne | 7.84 | 7.57 | 0.27 | 0.02 | 0.03 | 3 |
| Al | 6.45 | 5.61 | 0.84 | 0.18 | 0.19 | 2 |
| Si | 7.51 | 7.31 | 0.20 | 0.03 | 0.05 | 5 |
| S | 7.12 | 6.59 | 0.53 | 6 | ||
| Fe | 7.50 | 6.80 | 0.70 | 0.2 | 1 |
2.2 Spectral energy distribution of the PAGB star
We have performed the spectral energy distribution (SED) fitting of the PAGB star using 30 photometric fluxes observed in different filters ranging from UV to IR bands (Table 4) and the theoretical fluxes from the TLUSTY non-LTE O/B stellar atmosphere model555http://tlusty.oca.eu/Tlusty2002/tlusty-frames-cloudy.html (TLUSTY model; Hubeny & Lanz, 1995; Lanz & Hubeny, 2007; Hubeny et al., 2021). The SED fitting procedure was performed in VO SED analyzer666http://svo2.cab.inta-csic.es/theory/main/ (VOSA; Bayo et al., 2008). We fitted the observed photometric fluxes with TLUSTY model grids and found that the best-fitted model grid has =18,000 K and =2.25. The best-fitted model and observed fluxes are shown in Fig. 3. We find IR access in the WISE W3 and W4 fluxes, which may indicate the circumstellar/circumbinary disc around the star (van Winckel, 2003).
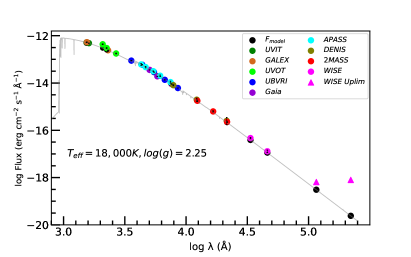
VOSA also provides bolometric luminosity () and radius of the star (R) from their best-fitted stellar atmosphere model grid based on the distance of the star and the total observed fluxes from the UV to IR bands. We find and of the identified PAGB star as 2136 150 (), and 4.610.14 , respectively.
3 Evolutionary Status of the identified PAGB star
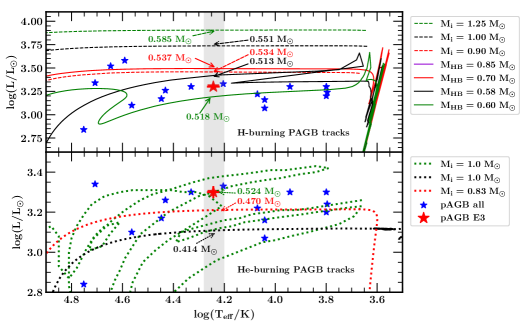

In Fig. 4, we show all the previously observed PAGB stars (blue asterisks) in GCs with known , and values. The newly identified PAGB star in this paper is shown in red asterisk. We find that the luminosity of the identified PAGB star is similar to most of the GC PAGB stars (; Dixon, 2024). We have shown all the latest available PAGB evolutionary tracks with H-burning (upper left panel) as well as He-burning (lower left panel) prescriptions. The H-burning evolutionary tracks of initial masses 0.9, 1.0, and 1.25 (dashed red, black, and green lines, respectively) were taken from Miller Bertolami (2016). The PAGB evolutionary tracks of Moehler et al. (2019) (solid lines) were generated from an initial mass of 0.85 , but they differ in their post-HB evolution based upon their location and mass on the HB phase. We find that the luminosity of evolutionary tracks varies upon their initial and/or final mass. The current mass of the identified PAGB star could be 0.51 based upon the H-burning evolutionary tracks (upper left panel of Fig. 4).
The derived value of the star is relatively lower than the other PAGB stars observed in Galactic GCs (right panel of Fig. 4). The evolutionary tracks on vs. log plane suggest a present mass of the identified PAGB star to be 0.55 , which is evolved from an initial mass of 1.0 (Miller Bertolami, 2016).
Hence, various evolutionary tracks on the , and plane suggest a present mass of the identified PAGB star in the range 0.510.55 which has spent 1000 yrs in the PAGB phase (1.0 track; Miller Bertolami, 2016). This mass range of the identified PAGB star suggests that the companion is also an evolved post-main sequence (of 0.50.8 for q1.0).
4 Evidence of 3DU in the identified PAGB star
PAGB stars, which undergo thermal pulsation at the AGB-tip, bring up the processed materials to the surface (3DU process); as a result, the enhanced C, O, and other s-process elements could be found on the surface of PAGB stars. Recently, Dixon (2024) studied the CNO abundances of 11 PAGB stars observed in the Galactic GCs and found four of them have enhanced CNO abundances compared to the CNO abundance of their respective host cluster. They concluded that the increased C and O abundances during their 3DU enhanced the overall CNO abundance in those PAGB stars.
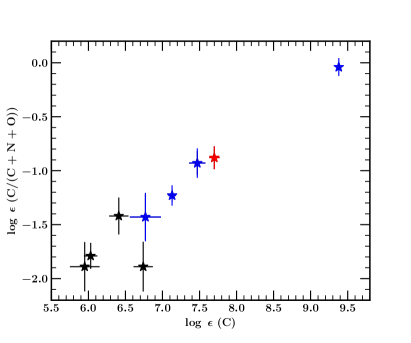
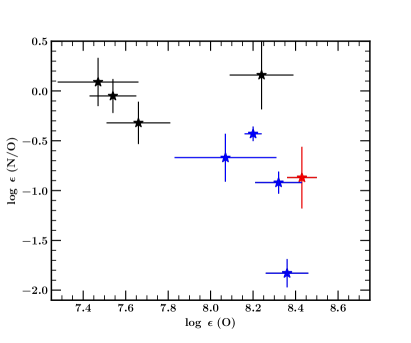
In Fig. 5, we have plotted the C/CNO ratio vs. C (left panel) and N/O vs. O (right panel) abundances of the eight PAGB stars for which C abundances were estimated by Dixon (2024) (blue asterisks for the PAGB stars having 3DU and black asterisks for those PAGB stars having no sign of 3DU) along with the abundances of the identified PAGB star in this paper (red asterisk). We find that the identified PAGB star has similar C and O abundances to those PAGB stars of other GCs that have undergone the 3DU. This suggests the identified PAGB star also went to the 3DU while on its AGB evolution.
5 Conclusion
We explore all the photometric and spectroscopic details of the new hot-PAGB star discovered in GC E3. The proper motion and parallax of the star from Gaia EDR3 support its membership, and the location of the star in the absolute CMD suggests that the star is in the PAGB phase. The radial velocities show a variation of 6 km s-1 between the two epochs, suggesting a binary nature of the star. A simulation of possible binary systems with the observed RV values of the identified PAGB star and the cluster mean RV suggest that the binary period of the star is around 39 days (51% of models) or 18 days (16% of models). The abundances were derived for the He, C, N, O, Ne, Al, Si, S, and Fe lines. The metalicity of the star ([Fe/H]=0.7 dex) agrees with the cluster metalicity. We find the , , , and Radius of the identified PAGB star to be 175001000 K, 2.370.20, 3.330.03, and 4.610.14 , respectively, using SED fitting of 30 photometric fluxes from UV to IR bands. A comparison of various PAGB evolutionary tracks with the observed star on the H-R diagram suggests the present mass of the identified PAGB star is in the range 0.510.55 . A comparison of the observed C, N, and O abundances of the star with the abundances of the PAGB stars of other GCs that show 3DU suggest that the identified PAGB star has undergone the 3DU and enriched in its C and O abundances. Future multi-epoch spectroscopic observations are necessary to constrain the period and better understand the binary nature of the identified hot-PAGB star.
Acknowledgements.
We thank Prof. M. Parthasarathy for his valuable discussion during the initial phase of the project. The CHRION spectra were obtained with the help of the National Science Center (NCN), Poland, using grant no. 2021/41/N/ST9/02746. AM is also supported by this NCN grant. ACP and SP acknowledge the support of the Indian Space Research Organisation (ISRO) under the AstroSat archival Data utilization program (No. DS_2B-13013(2)/1/2022-Sec.2). MG was partially supported by the NCN through the grant UMO-2021/41/B/ST9/01191. DKO acknowledges the support of the Department of Atomic Energy, Government of India, under Project Identification No. RTI 4002. The research work at the Physical Research Laboratory is funded by the Department of Space, Government of India. This publication uses the data from the AstroSat mission of the ISRO, archived at the Indian Space Science Data Center (ISSDC).References
- Asplund et al. (2009) Asplund, M., Grevesse, N., Sauval, A. J., & Scott, P. 2009, ARA&A, 47, 481
- Baumgardt & Vasiliev (2021) Baumgardt, H. & Vasiliev, E. 2021, MNRAS, 505, 5957
- Bayo et al. (2008) Bayo, A., Rodrigo, C., Barrado Y Navascués, D., et al. 2008, A&A, 492, 277
- Bloecker (1995) Bloecker, T. 1995, A&A, 299, 755
- Bond (2021) Bond, H. E. 2021, AJ, 161, 204
- Cardelli et al. (1989) Cardelli, J. A., Clayton, G. C., & Mathis, J. S. 1989, ApJ, 345, 245
- Cassisi et al. (2003) Cassisi, S., Schlattl, H., Salaris, M., & Weiss, A. 2003, ApJ, 582, L43
- Conroy et al. (2020) Conroy, K. E., Kochoska, A., Hey, D., et al. 2020, ApJS, 250, 34
- Cutri et al. (2021) Cutri, R. M., Wright, E. L., Conrow, T., et al. 2021, VizieR Online Data Catalog, II/328
- Davis et al. (2022) Davis, B. D., Bond, H. E., Siegel, M. H., & Ciardullo, R. 2022, ApJ, 926, 99
- de la Fuente Marcos et al. (2015) de la Fuente Marcos, R., de la Fuente Marcos, C., Moni Bidin, C., Ortolani, S., & Carraro, G. 2015, A&A, 581, A13
- Denis (2005) Denis, C. 2005, VizieR Online Data Catalog, B/denis
- Dixon (2024) Dixon, W. V. 2024, ApJ, 961, 24
- Dorman et al. (1993) Dorman, B., Rood, R. T., & O’Connell, R. W. 1993, ApJ, 419, 596
- Driebe et al. (1998) Driebe, T., Schoenberner, D., Bloecker, T., & Herwig, F. 1998, A&A, 339, 123
- Gratton et al. (2010) Gratton, R. G., D’Orazi, V., Bragaglia, A., Carretta, E., & Lucatello, S. 2010, A&A, 522, A77
- Greggio & Renzini (1990) Greggio, L. & Renzini, A. 1990, ApJ, 364, 35
- Harris (1996) Harris, W. E. 1996, AJ, 112, 1487
- Harris (2010) Harris, W. E. 2010, arXiv e-prints, arXiv:1012.3224
- Hełminiak et al. (2012) Hełminiak, K. G., Konacki, M., Różyczka, M., et al. 2012, MNRAS, 425, 1245
- Hełminiak et al. (2019) Hełminiak, K. G., Tokovinin, A., Niemczura, E., et al. 2019, A&A, 622, A114
- Henden et al. (2015) Henden, A. A., Levine, S., Terrell, D., & Welch, D. L. 2015, in American Astronomical Society Meeting Abstracts, Vol. 225, American Astronomical Society Meeting Abstracts #225, 336.16
- Hubeny et al. (2021) Hubeny, I., Allende Prieto, C., Osorio, Y., & Lanz, T. 2021, arXiv e-prints, arXiv:2104.02829
- Hubeny & Lanz (1995) Hubeny, I. & Lanz, T. 1995, ApJ, 439, 875
- Kamath et al. (2016) Kamath, D., Wood, P. R., Van Winckel, H., & Nie, J. D. 2016, A&A, 586, L5
- Kwok (1982) Kwok, S. 1982, ApJ, 258, 280
- Kwok (1993) Kwok, S. 1993, ARA&A, 31, 63
- Lanz & Hubeny (2007) Lanz, T. & Hubeny, I. 2007, ApJS, 169, 83
- Lauberts (1976) Lauberts, A. 1976, A&A, 52, 309
- Lei et al. (2015) Lei, Z., Chen, X., Zhang, F., & Han, Z. 2015, MNRAS, 449, 2741
- Leinert, Ch. et al. (1998) Leinert, Ch., Bowyer, S., Haikala, L. K., et al. 1998, Astron. Astrophys. Suppl. Ser., 127, 1
- Lindegren et al. (2021) Lindegren, L., Bastian, U., Biermann, M., et al. 2021, A&A, 649, A4
- Mello et al. (2012) Mello, D. R. C., Daflon, S., Pereira, C. B., & Hubeny, I. 2012, A&A, 543, A11
- Miller Bertolami (2016) Miller Bertolami, M. M. 2016, A&A, 588, A25
- Miller Bertolami et al. (2008) Miller Bertolami, M. M., Althaus, L. G., Unglaub, K., & Weiss, A. 2008, A&A, 491, 253
- Milone et al. (2012) Milone, A. P., Piotto, G., Bedin, L. R., et al. 2012, A&A, 540, A16
- Moehler et al. (2019) Moehler, S., Landsman, W. B., Lanz, T., & Miller Bertolami, M. M. 2019, A&A, 627, A34
- Moharana et al. (2023) Moharana, A., Hełminiak, K. G., Marcadon, F., et al. 2023, MNRAS, 521, 1908
- Monaco et al. (2018) Monaco, L., Villanova, S., Carraro, G., Mucciarelli, A., & Moni Bidin, C. 2018, A&A, 616, A181
- Nelder & Mead (1965) Nelder, J. A. & Mead, R. 1965, The Computer Journal, 7, 308
- Prabhu et al. (2021) Prabhu, D. S., Subramaniam, A., & Sahu, S. 2021, ApJ, 908, 66
- Rucinski (1999) Rucinski, S. 1999, in Astronomical Society of the Pacific Conference Series, Vol. 185, IAU Colloq. 170: Precise Stellar Radial Velocities, ed. J. B. Hearnshaw & C. D. Scarfe, 82
- Salinas & Strader (2015) Salinas, R. & Strader, J. 2015, ApJ, 809, 169
- Schiavon et al. (2012) Schiavon, R. P., Dalessandro, E., Sohn, S. T., et al. 2012, AJ, 143, 121
- Schlafly & Finkbeiner (2011) Schlafly, E. F. & Finkbeiner, D. P. 2011, ApJ, 737, 103
- Skrutskie et al. (2006) Skrutskie, M. F., Cutri, R. M., Stiening, R., et al. 2006, AJ, 131, 1163
- Sollima & Baumgardt (2017) Sollima, A. & Baumgardt, H. 2017, MNRAS, 471, 3668
- Stetson et al. (2019) Stetson, P. B., Pancino, E., Zocchi, A., Sanna, N., & Monelli, M. 2019, MNRAS, 485, 3042
- Tandon et al. (2020) Tandon, S. N., Postma, J., Joseph, P., et al. 2020, AJ, 159, 158
- Tandon et al. (2017) Tandon, S. N., Subramaniam, A., Girish, V., et al. 2017, AJ, 154, 128
- Tokovinin et al. (2013) Tokovinin, A., Fischer, D. A., Bonati, M., et al. 2013, PASP, 125, 1336
- van Winckel (2003) van Winckel, H. 2003, ARA&A, 41, 391
- Vasiliev & Baumgardt (2021) Vasiliev, E. & Baumgardt, H. 2021, MNRAS, 505, 5978
- Zinn et al. (1972) Zinn, R. J., Newell, E. B., & Gibson, J. B. 1972, A&A, 18, 390
- Zucker & Mazeh (1994) Zucker, S. & Mazeh, T. 1994, ApJ, 420, 806
Appendix A Reduction of CHIRON spectra of the identified PAGB star
| Epoch | Date of Observation | Exposure Time | SNR |
|---|---|---|---|
| 1 | 17th February 2023 | 4 1600 sec. | 40.6 |
| 2 | 26th March 2023 | 4 1600 sec. | 25.6 |
We reduce the spectra with the pipeline developed at Yale University (Tokovinin et al. 2013). Wavelength calibrations were performed using the ThAr lamp exposures taken during the scheduled calibration runs. We applied barycentric corrections separately using calculations from IRAF with bcvcor task. We calculated the signal-to-noise (S/N) of the two spectra using snr777https://specutils.readthedocs.io/en/stable/analysis.html module in specutils. We found the SNR as 40.6 and 25.6 for the spectra at the first and second epochs, respectively.
The optical spectrum of the star in the spectral ranges 45056602 Å shows about 50 stellar absorption lines. The identification of the lines are based on the National Institute of Standards and Technology (NIST) Atomic Spectra Database888https://www.nist.gov/pml/atomic-spectra-database.
Absorption lines of neutral species including H i (H and H), He i, C I, N I, O I and Ne I were identified. Singly-ionized species including C II, N II, O II, Si II, S II, Mg II and Fe II were detected. Higher ionization is seen in Al III, Fe III, Si III and S III.
The spectrum of the star also contains absorption features that have interstellar origin. There are Na I doublet (5889.951, 5895.924) and several very weak Diffuse Interstellar Bands (DIBs). Emission lines are not detected in the spectrum of the star, in contrast to many hot post-AGB stars, whose spectra consist of two components: the star’s absorption spectrum and an overlain emission spectrum from a low-excitation gas envelope (Mello et al. 2012). Comparing the spectra at the two epochs, we notice static O I emission lines at 5577 Å, 6300 Å, and 6364 Å, which are most probably due to air-glow (Leinert, Ch. et al. 1998) and therefore, we do not consider them for our analysis.
The complete continuum-normalised spectrum of the star in the spectral ranges 45056602 Å is presented at http://lnfm1.sai.msu.ru/davnv/E3/atlas_E3.pdf.
Appendix B RV estimation from the spectra of the identified PAGB star
The RVs were measured on prominent absorption lines, including He lines, but avoiding H and H as they had broad absorption lines (FWHM km s-1) affecting precise RV estimate. We used a template with = 20000 K, = 4.5 dex, and solar metallicity to create the cross-correlation functions (CCF; Figure 6) using the todcor technique (Zucker & Mazeh 1994). Uncertainties were calculated using a bootstrap procedure (Hełminiak et al. 2012), which is sensitive to the SNR of a component and velocity of rotation. The RVs were estimated as 40.200.57 km s-1 and 34.660.85 km s-1 for the spectra observed at the first and second epochs, respectively. We also check for consistency of RV measurements using broadening functions (BF; Rucinski 1999). The RVs were calculated by using a rotational broadening model as described in Moharana et al. (2023). The BF-RVs were consistent with the todcor-RVs within the errors. The final RVs were taken from todcor due to their high precision.
Appendix C Simulation of binary configurations
To check the possible binary configurations of the identified PAGB star, we make a grid of models constrained by the observed radial velocities. We use the binary modelling code phoebe2 (Conroy et al. 2020 and references therein). Since we have two epochs of RV observations only, we consider the following assumptions for a simplified modelling
-
1.
The binary is edge-on. The inclination of the orbital plane is fixed at 87 degrees, and the orbital period is constrained to be less than 1000 days. For a wider orbit, we expect a high RUWE parameter in Gaia EDR3; however, the RUWE value of the identified PAGB star is 1.022 (¡ 1.4).
-
2.
Models with orbit smaller than the radius of the PAGB star (4.61 ) or reaching the Roche limit will be rejected. We assume the secondary radius to be 1.00 .
-
3.
The centre-of-mass (COM) or the gamma velocity of the binary is fixed at 12.6 km/s (the cluster mean).
The model generation follows the following steps:
-
1.
Setting up an initial model with random draws from a set of masses (Mpri = 0.2, 0.5, 0.6, and 0.8 ), eccentricities (e = 0.0, 0.2, 0.5, and 0.8), mass-ratios (q = 0.5, 1.0, and 1.5), and binary period (P; randomly between 090 days). Mass ratios and binary periods are guess values which we need to initialize the phoebe2 setup. We generate an initial setup of 480 models.
-
2.
We apply the constraints and then q, P and time of periastron passage () to best fit the observed RV values. The optimization was done using the Nelder-Mead method (Nelder & Mead 1965) for 500 iterations.
-
3.
The optimization discarded a few models if they failed to adhere to any pre-defined constraints. This gave us the final 396 models with possible q and P values.
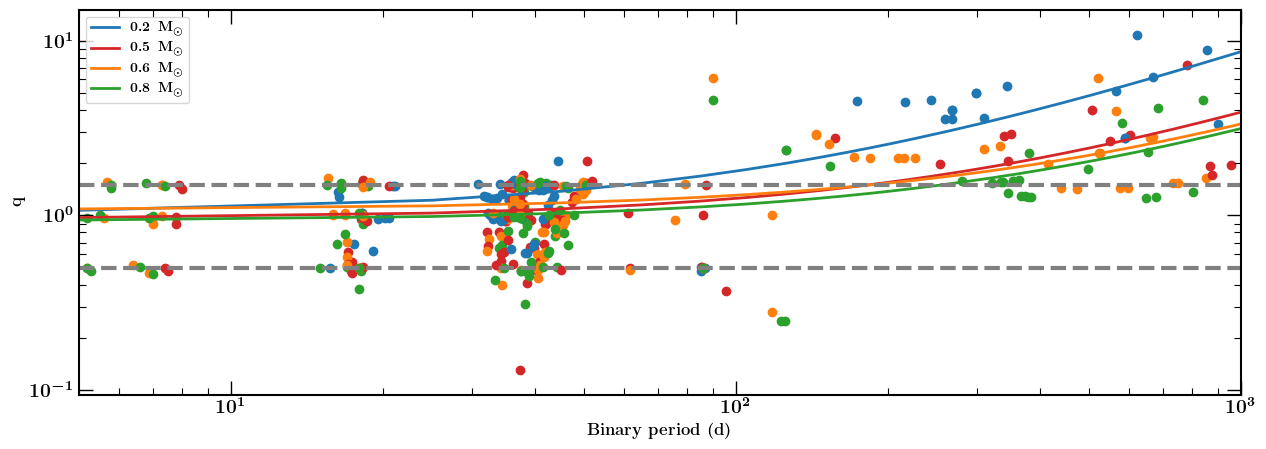
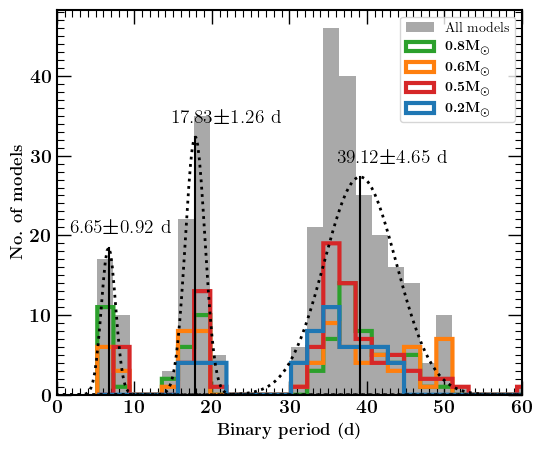
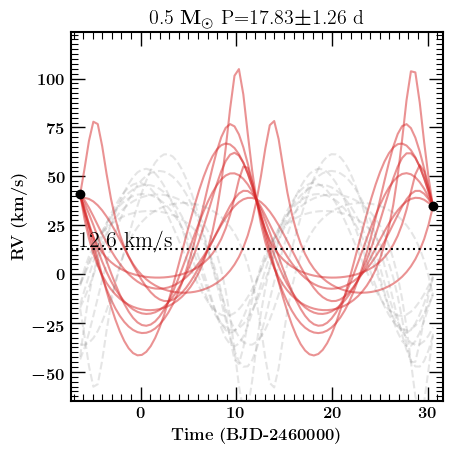
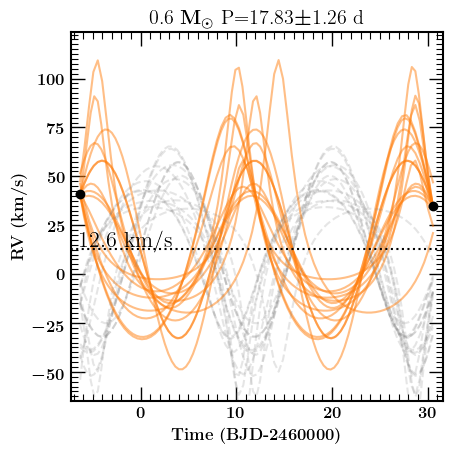
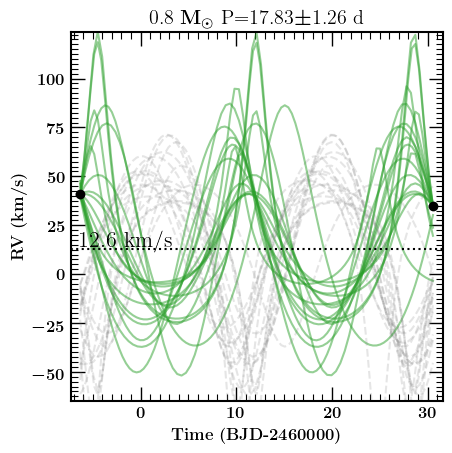
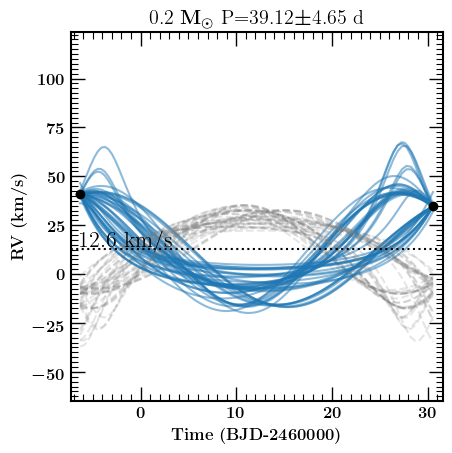
The possible q and P values for our final binary models are shown in the left panel of Fig. 7. The best-fitted binary periods are clustered around three values, 39.124.65 days (51.26 % models), 17.831.26 days (16.4 % models), and 6.650.92 days (6.8% models) (right panel of Fig. 7). The mass ratio, q, varies between 0.2 and 1.5 (56 % models) (grey dashed lines); however, the average values are lying around 1.0 for periods ¡ 100 days (blue, red, orange, and green solid lines for masses 0.2, 0.5, 0.6, and 0.8 , respectively). We do not see any favourable eccentricity but it is anyway hard to constrain it with two epochs of observations.
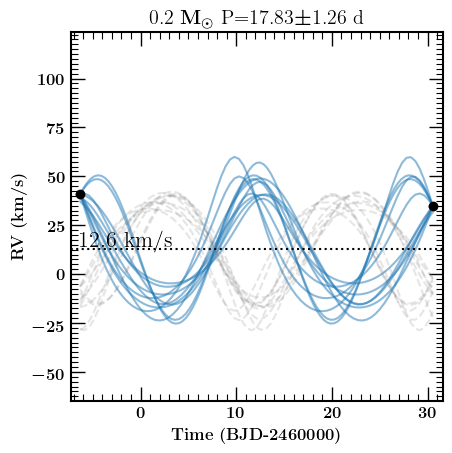
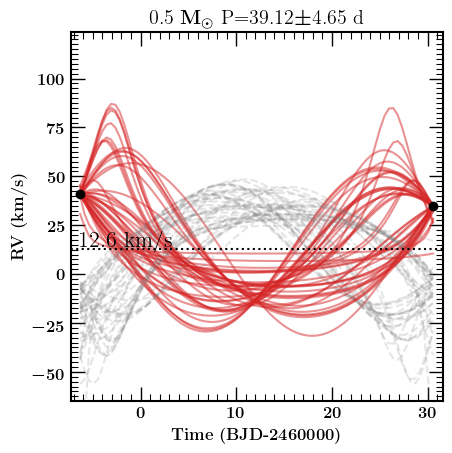
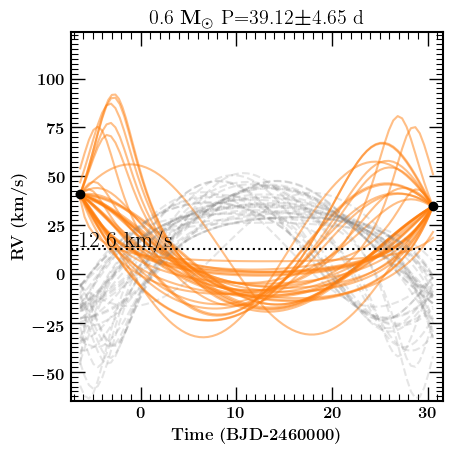
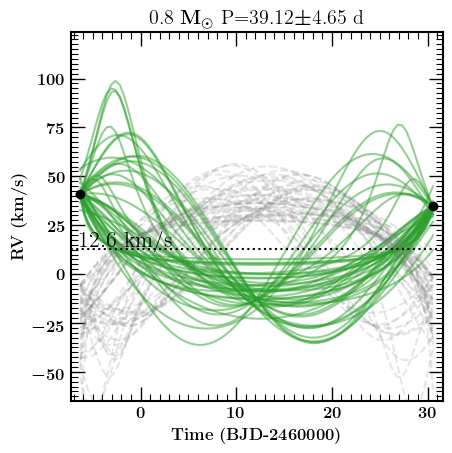
In Fig. 8, we provide the possible RV values for the primary (coloured solid lines) and companion stars (grey solid lines) for a period of 17.83 days (upper panels) and 39.12 days (lower panels). The maximum RV can reach 100 km/s for the identified PAGB star with masses 0.6 (period = 17.83 days) and 0.8 (period = 39.12 days) (Figure 8).
Appendix D Atmospheric parameter estimation from the high resolution spectra
To derive parameters of the stellar atmosphere from CHIRON spectra, we used tlusty model grid BSTAR2006 (Lanz & Hubeny 2007) and accompanied programs for calculating synthetic spectra (synspec, rotin, see Hubeny et al. (2021)).
Synthetic profiles of the Balmer lines fit the observations only at a certain relation between and In the case of H and H lines, these relations are similar in shape but occur to be shifted by 0.4 dex: The higher members of the Balmer series do not fall in the observed range (45056602 Å). Therefore, as the final relation for –, we took the average between H and H with an uncertainty of 0.2 dex.
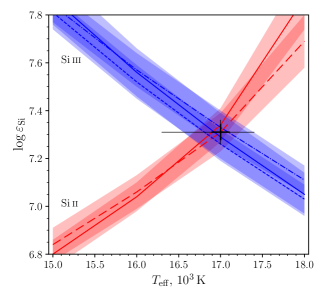
The observations allow us to construct a second relation involving the ionization balance between Si ii and Si iii, lines of which are quite strong in the spectrum. We adjusted the silicon abundance () for each line of Si ii 6347, 6371 and Si iii 4552, 4567, 4572 for a set of pairs (, ) along the found relation (). For the true values of and , the abundances derived from Si ii and Si iii must coincide. We find that the coincidence of over all lines Si iii/Si ii occurs at = K, and km s-1, see Fig. 9. A big uncertainty of the corresponding value of leads to an increase in the temperature uncertainty, making it asymmetric K. All calculations were made with the BSTAR2006 models with scaled solar abundances (BL models) and km s-1. We also redone all calculations with the (BS models) and km s-1 in order to know the effect of variations in the chemical composition in the models. We find that it does not affect the relation but it reduces by 300 K in the diagram and increases by 0.04 dex. Thus, the final results are K,
Appendix E Chemical composition of the individual elements
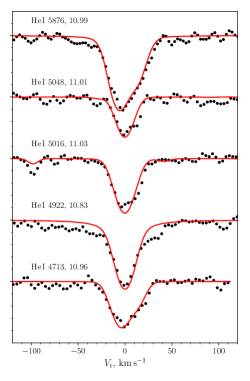
Helium. He i 4713, 4922, 5016, 5048, 5876 lines are considered. We remove from the averaging He i 4922 line, which is blended with some broad absorption feature and shows lower by 0.2 dex in comparison with other lines. The rest of the lines agree well with each other. Fig 10 shows the He i lines profiles and fragments of the synthetic spectrum.
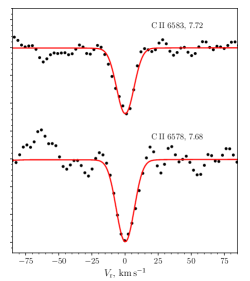
Carbon. The abundance is derived from two strong lines C ii 6578, 6583. Fig. 11 shows the C ii lines profiles are superposed on model spectra.
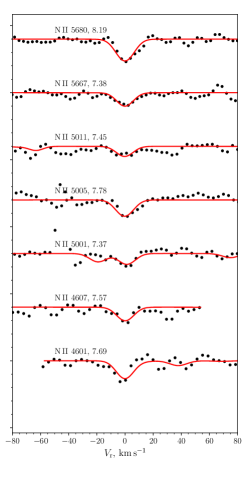
Nitrogen. The observed spectrum contains a number of weak lines N ii 4601, 4607, 4630, 5000, 5001, 5005, 5011, 5667, 5680. Abundances derived from various lines are poorly agreed with each other; stronger lines require a higher abundance than weaker ones. It indicates a high microturbulence velocity km s-1, but the observed width of the lines is small and almost completely determined by the instrumental profile that puts a limit on km s-1. Fig 12 shows the N ii line profiles are superposed on model spectra.
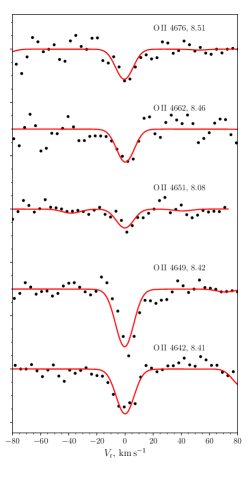
Oxygen. A few weak lines of O ii are seen in the spectrum, we used O ii 4642, 4649, 4662, 4676. Fig 13 shows the O ii lines profiles are superposed on model spectra.
Neon. The abundance is derived from Ne i 6143, 6402, 6507, which agree well with each other. There are two weaker lines Ne i 6266, 6599, but they show by 0.3 dex less and by 0.3 dex higher than the rest lines.
Aluminium. Two lines are used Al iii 5697, 5723.
Silicon. The silicon abundance is determined simultaneously with the atmospheric parameters; see above.
Sulfur. We considered lines S ii 5014, 5032, 5432, 5454, 5640, 5647, although only the lines 5014, 5640, 5647 are reliably present in the observed spectrum. These lines give 6.51, 6.26, and 6.59, respectively. The line S ii 5032 is relatively weak and can be agreed with the above-mentioned However, at such abundance the lines S ii 5432, 5454 must be present in the observations. The absence of these lines puts a limit In any case, there is a sulfur deficiency ([S/H]).
Iron. Only one Fe line Fe iii 5156 is visible in the spectrum and gives More weaker lines Fe ii 5018, 5169 and Fe iii 5127 are predicted by the model and agree with the observations within the uncertainties at the found abundance. The Fe-lines are very weak in the spectra of early-type stars, making the estimate of metallicity based on iron a very difficult task. Therefore, we must rely on the CNO abundances as metallicity proxies (Mello et al. 2012). For the star, we found that Z(CNO) is equal to 0.005, compared to the solar value of 0.012.
The final uncertainty we estimate as where are uncertainties in related to the uncertainties of and correspondingly. The quantity is an estimate of the uncertainty associated with the difference between the real metallicity and the given metallicity of the BL models.
Appendix F SED fitting of the PAGB star
The details of filters used in the SED fitting are given in Table 4.
Telescope/Survey Filters Wavelength range Reference UVIT BaF2, Sapphire 13501800 Å This paper GALEX FUV, NUV 13503000 Å Schiavon et al. (2012) Swift/UVOT UVW2, UVM2, UVW1 16004700 Å HEASARC Archive Gaia G, BP, RP 330010600 Å Vasiliev & Baumgardt (2021) CTIO-4m U, B, V, R, I 300011800 Å Stetson et al. (2019) APASS B, V, g, r, i 43007457 Å Henden et al. (2015) DENIS I, J, Ks 786121453 Å Denis (2005) 2MASS J, H, Ks 1200021500 Å Skrutskie et al. (2006) WISE W1, W2, W3, W4 34000220000 Å Cutri et al. (2021)