Optical properties of Y dwarfs observed with the Gran Telescopio Canarias ††thanks: Based on observations made with the Gran Telescopio Canarias (GTC), installed in the Spanish Observatorio del Roque de los Muchachos of the Instituto de Astrofísica de Canarias, on the island of La Palma (programmes GTC27-13B and GTC49-14B – P.I. N. Lodieu – GTCMULTIPLE2B-21A and GTC133-21A – P.I. E. L. Martín)
Abstract
Aims. Our science goals are to characterise the optical properties of Y dwarfs and to study their consistency with theoretical models.
Methods. A sample of five Y dwarfs was observed with three optical and near-infrared instruments at the 10.4 m Gran Telescopio Canarias. Deep near-infrared (- or -band) and multicolour optical images (-, -, -, -, -bands) of the five targets and a low-resolution far-red optical spectrum for one of the targets were obtained.
Results. One of the Y dwarfs, WISE J173835.53+273258.9 (Y0), was clearly detected in the optical (- and -bands) and another, WISE J182831.08+265037.7 (Y2), was detected only in the -band. We measured the colours of our targets and found that the and colours of the Y dwarfs are bluer than those of mid- and late-T dwarfs. This optical blueing has been predicted by models, but our data indicates that it is sharper and happens at temperatures about 150 K warmer than expected. The culprit is the K I resonance doublet, which weakens more abruptly in the T- to Y-type transition than expected. Moreover, we show that the alkali resonance lines (Cs I and K I) are weaker in Y dwarfs than in T dwarfs; the far-red optical spectrum of WISE J173835.53+273258.9 is similar to that of late-T dwarfs, but with stronger methane and water features; and we noted the appearance of new absorption features that we propose could be due to hydrogen sulphide. Last but not least, in 2014, WISE J173835.53+273258.9 presented a bluer colour than in 2021 by a factor of 2.8 (significance of 2.5). Thanks to our deep optical images, we found that the 2014 -band spectrum was contaminated by a galaxy bluer than the Y dwarf.
Conclusions. The optical properties of Y dwarfs presented here pose new challenges to the modelling of grain sedimentation in extremely cool objects. The weakening of the very broad K I resonance doublet due to condensation in dust grains is more abrupt than theoretically anticipated. Consequently, the observed blueing of the and colours of Y dwarfs with respect to T dwarfs is more pronounced than predicted by models and could boost the potential of upcoming deep large-area optical surveys regarding their ability to detect extremely cool objects.
Key Words.:
Stars: low-mass — Stars: brown dwarfs — techniques: photometric — techniques: spectroscopic1 Introduction
With the discovery of an object with an effective temperature (Teff) below 700 K in the Canada France Brown Dwarf survey, it was proposed that a new spectral class, dubbed Y, was needed to classify objects cooler than T (Delorme et al. 2008). Spectral subclasses for Y dwarfs began to be defined after the discovery of seven objects with the Wide-field Infrared Survey Explorer (WISE) by Cushing et al. (2011), who proposed that WISE J173835.53+273258.9 (hereafter W1738) be considered as the Y0 spectral standard. The effective temperatures of the Y dwarfs reported by those authors range from 450 K to 300 K.
| ID | R.A. | Dec. | epoch | d | Teff | ||||||
|---|---|---|---|---|---|---|---|---|---|---|---|
| hh:mm:ss.ss | ∘:′:′′ | MJD | mag | mag | mag | mag | arcsec/yr | arcsec/yr | pc | K | |
| W1405 | 14:05:16.95 | 55:34:22.43 | 57249.47 | 23.85 | 21.060.06 | 21.410.08 | 2.33 | 0.23 | 6.3 | 411 | |
| W1738 | 17:38:35.66 | 27:32:57.13 | 57094.49 | 25.30 | 22.800.09 | 19.580.04 | 20.340.08 | 0.34 | 0.34 | 7.6 | 450 |
| W1828 | 18:28:31.46 | 26:50:38.65 | 57094.09 | 24.46 | 23.480.30 | 22.730.13 | 1.02 | 0.17 | 10.0 | 406 | |
| W1935 | 19:35:18.64 | 15:46:20.51 | 57939.58 | 23.930.33 | 0.29 | 0.04 | 14.4 | 367 | |||
| W2354 | 23:54:03.00 | 02:40:11.63 | 57860.05 | 22.72 0.13 | 22.530.28 | 0.50 | 0.40 | 7.7 | 388 |
It has been predicted that the colour of ultracool dwarfs with Teff in the range 2000–400 K is extremely sensitive to grain sedimentation in the atmosphere (Marley et al. 2002) and, to a lesser extent, is also sensitive to metallicity (Leggett et al. 2012). Recent work indicates that the combination of optical and infrared colours can provide sensitive diagnostics to break the degeneracy between metallicity and temperature in ultracool dwarfs (Zhang et al. 2023).
In view of the upcoming new generation of deep large-area optical surveys, such as those to be carried out with Euclid and the Vera Rubin Legacy Survey of Space and Time, it is a timely moment to improve the characterisation of benchmark Y dwarfs at optical wavelengths in order to improve our understanding of these elusive objects and guide the search for new ones using the resources just mentioned. So far, just four Y dwarfs have been detected in the optical (-band) with the 10.4 m Gran Telescopio Canarias (GTC) by Lodieu et al. (2013), and only one far-red optical spectrum has been presented as a Y dwarf, which was obtained with Gemini Multi-Object Spectrograph (GMOS) at the 8.1 m Gemini North telescope (Leggett et al. 2013).
In this paper, we present a study of the optical properties of Y dwarfs based on new GTC observations. In Section 2, our sample of five Y dwarfs is described, and the imaging and spectroscopic observations using the GTC are presented. Section 3 provides our photometric and spectroscopic results and puts them in context with other ultracool dwarfs. Section 4 includes a discussion of our results and critical comparisons with theoretical models. Section 5 summarises our main conclusions.
2 Observations
A sample of five Y dwarfs was selected for observations with the GTC. The list of targets and their basic parameters are presented in Table 1. Astrometric data, trigonometric distances, and temperature estimates were taken from table 5 of Kirkpatrick et al. (2021). The -band and -band photometry were obtained by Lodieu et al. (2013) using GTC/OSIRIS with Sloan filters under the AB system, and the near-infrared photometry under the MKO system was taken from table 10 of Leggett et al. (2021).
| ID | R300R | |||||||
|---|---|---|---|---|---|---|---|---|
| s | s | s | s | s | s | s | s | |
| W1405 | 3858 | 3858 | 3858 | 3858 | 3858 | 2000 | ||
| W1738 | 7488 | 7488 | 7488 | 7488 | 7488 | 360 | 32400 | |
| W1828 | 7716 | 7716 | 7716 | 7716 | 7716 | 2400 | ||
| W1935 | 5787 | 5787 | 5787 | 5787 | 5787 | 2400 | ||
| W2354 | 7716 | 7716 | 7716 | 7716 | 7716 | 2100 |
2.1 Direct imaging and photometry
Direct images of the sample of five Y dwarfs were obtained with two different instruments at the GTC in service mode for the programme GTCMULTIPLE2B-21A (PI E.L. Martín). The total amount of telescope time, including overheads, was 18 hours. Total on-source exposure times per filter are listed in Table 2. The data were collected from 2021 May 11 to 2021 August 29.
The Espectrógrafo Multiobjeto Infra-Rojo (EMIR) is a common user near-infrared imager and spectrograph located at the Nasmyth focus of the GTC (Garzón et al. 2022). It has a plate scale of 0.1945 arcsec/pix and a field of view (FOV) of 6.676.67 square arcmin in the imaging mode. The Y dwarfs were observed using the EMIR imaging mode in the -band or -band filters. Standard data reduction was carried out using the PyEMIR pipeline. The final EMIR image of W1738 is shown in Figure 1.
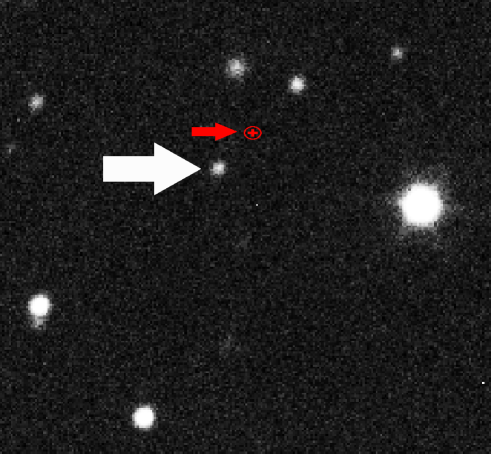
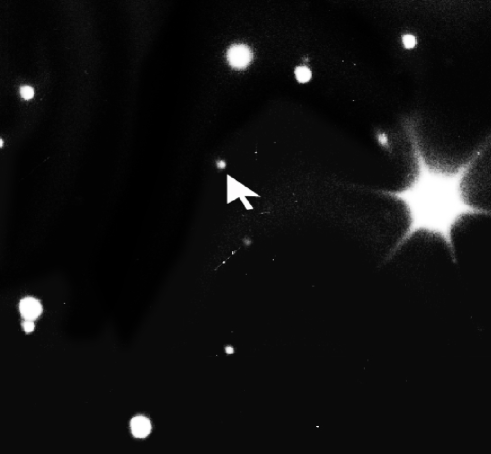
At the time of our observations, HiPERCAM was a visiting instrument at the GTC (Dhillon et al. 2021) with a plate scale of 0.081 arcsec/pix and an FOV of 2.83.1 square arcmin. Its capable of obtaining simultaneous images in five different filters across the optical range () using dichroics and five different detectors. Standard data reduction was carried out using the HiPERCAM pipeline. The final HiPERCAM images of W1738 in the and filters are shown in Figure 2.
Photometric measurements of the images were performed in the Image Reduction and Analysis Facility (IRAF) environment (Tody 1986, 1993).111IRAF is distributed by the National Optical Astronomy Observatory, which is operated by the Association of Universities for Research in Astronomy (AURA) under cooperative agreement with the National Science Foundation. For HiPERCAM images, aperture photometry was carried out with the phot task using a fixed aperture of 4 pixels and a variable aperture of 2.5 times the full width half maximum (FWHM). The FWHM values measured in the HiPERCAM W1738 images ranged from 7.9 to 8.4 pixels (0.64–0.68 arcsec). The sky contribution was measured in an annulus 10 pixels away from the source and 10 pixels wide in radius. The point spread function (PSF) photometry was computed with the allstar task. The results obtained with the PSF photometry had slightly smaller error bars than (but consistent with) those obtained with aperture photometry. Hence, we adopted the PSF photometric results. Five reference stars in the FOV of W1738 were used for establishing the zero point. These stars have photometric data in the catalogue released by the Panoramic Survey Telescope and Rapid Response System (Pan-STARRS; Chambers et al. 2016). For EMIR images, we also performed PSF photometry, and the zero point was established using five or six reference stars with photometry measured by the Two Micron All Sky Survey (2MASS; Cutri et al. 2003).
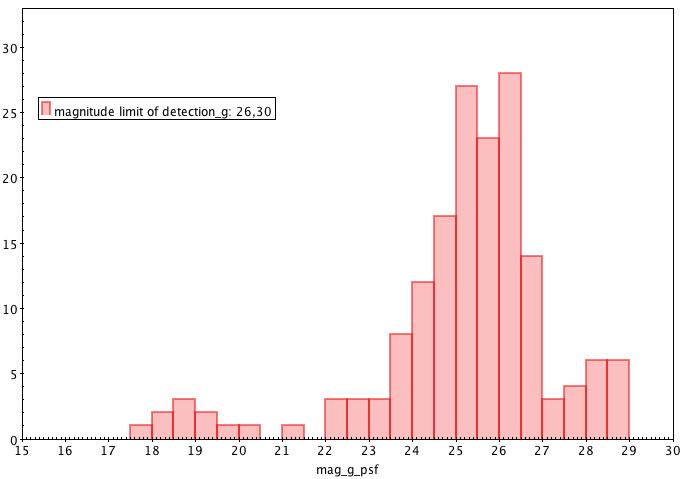
A histogram showing the number of sources detected with the IRAF daofind routine in the -band is shown in Figure 3. From this histogram, we estimated the magnitude limit of detection of W1738 in the -band. A similar procedure was followed for W1738 in the -band and for W1828 in the -band and the -band. The results obtained are either consistent or more conservative than the 5 limiting magnitudes published on the HiPERCAM GTC website222 http://www.gtc.iac.es/instruments/hipercam/hipercam.php. For the rest of the targets and filters, upper limits for the non-detections were derived using the sensitivities provided in the HiPERCAM GTC website. The adopted photometric measurements and upper limits are listed in Table LABEL:mag.
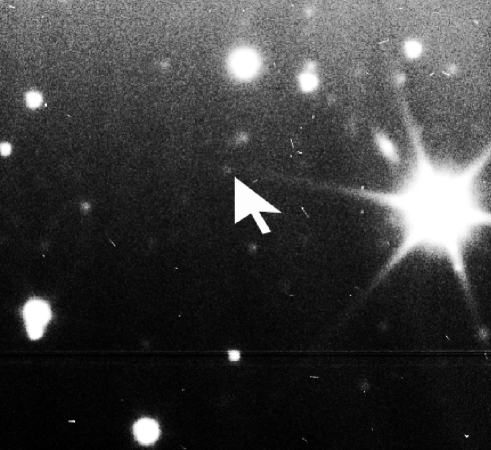
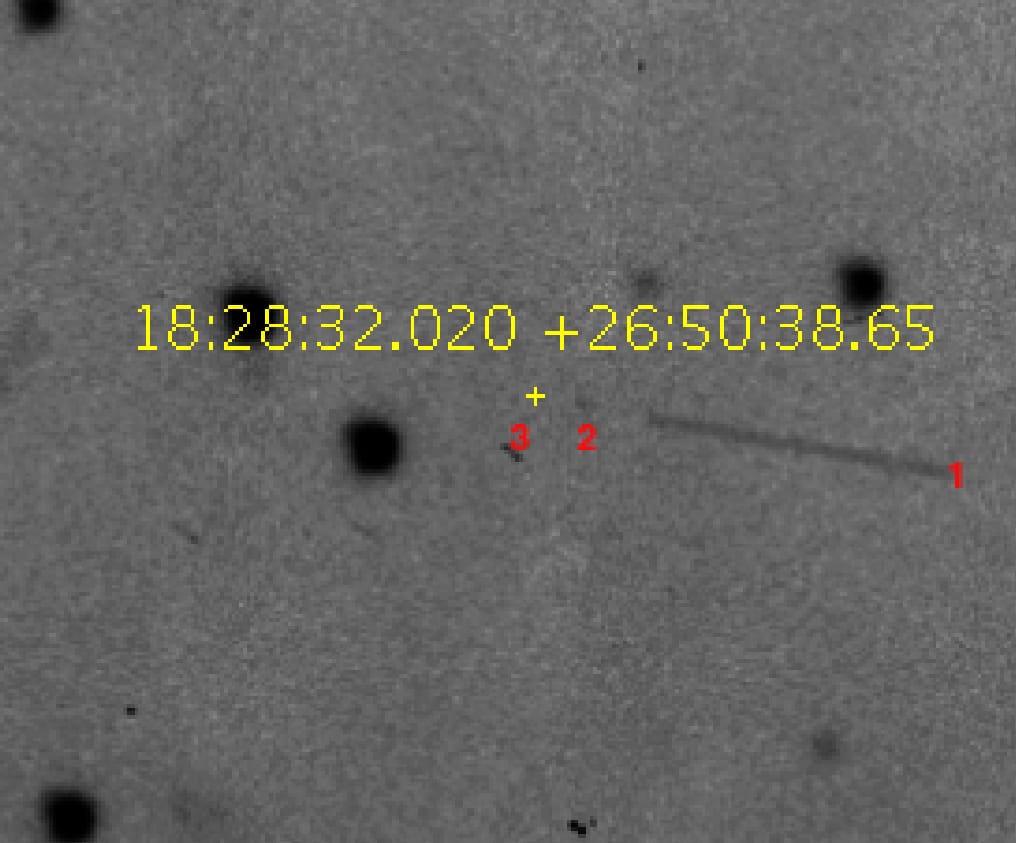
The detection of W1828 in the -band is shown in Figure 4. The value of -band photometry for this object measured in our GTC/HiPERCAM image is brighter than the photometry obtained from JWST in the F090W filter ( mag) by De Furio et al. (2023). This can be explained by the different passbands of these two filters. The F090W filter has a sharp cut-off at 1.00 micron, while the filter of HiPERCAM still has significant transmission up to about 1.06 microns. The very steep optical spectrum of Y dwarfs implies that there is a significant contribution to the photometric magnitude in the spectral range between 1.00 and 1.06 microns.
| ID | |||||||
|---|---|---|---|---|---|---|---|
| mag | mag | mag | mag | mag | mag | mag | |
| W1405 | 25.5 | 26.0 | 25.5 | 25.5 | 25.0 | 20.2 | |
| W1738 | 25.5 | 26.3 | 25.1 | 25.590.16 | 22.630.12 | 19.480.04 | |
| W1828 | 25.5 | 26.6 | 25.5 | 25.2 | 25.200.20 | 19.8 | |
| W1935 | 25.5 | 26.0 | 26.0 | 26.0 | 25.5 | 21.0 | |
| W2354 | 25.5 | 26.5 | 26.0 | 26.0 | 25.5 | 23.110.38 |
2.2 Spectroscopy
Far-red optical spectra of W1738 were obtained with the Optical System for Imaging and low Resolution Integrated Spectroscopy (OSIRIS; Cepa et al. 2000) instrument at the GTC over two semesters in 2014 (GTC49-14B; PI N. Lodieu) and 2021 (GTC133-21A; PI E.L. Martín). The OSIRIS detector consists of two 20484096 Marconi CCD42-82 with an 8 arcsec gap between them and operates at optical wavelengths from 365 to 1000 nm. The unvignetted instrument FOV is about 77 arcmin2 with a pixel scale of 0.125 arcsec.
The GTC49-14B observations consisted of six observing blocks, each of them made of four 1800 s long exposures shifted along the slit in a AABB pattern. They were obtained on three consecutive nights in visitor mode: 2014 August 23, 24, and 25. The GTC133-21A data were collected in service mode from 2021 June 3 to 2021 July 7. These observations were divided into three observing blocks that employed two on-source integrations of 1800 s each with two repeats shifted along the slit by 15 arcsec (AABB pattern). Each block was observed on a different night. The nights were dark and the seeing was better than 0.9 arcsec. The FOV was identified and the target was centered on the slit using two exposures of 60 s in the Sloan -band filter for each observing block. All the spectra were acquired in the parallactic angle. The total on-source exposure time of the 2014 plus the 2021 observations is provided in Table LABEL:texpsample.
For both the 2014 and the 2021 observations, the R300R grating and a CCD binning of 22 were used. In 2014, the slit width was set at 1.5 arcsec, while in 2021 it was set at 1.0 arcsec. These configurations yielded a spectral resolving power of and 280 at the wavelength of 900 nm. Bias, flats, and arc lamps were obtained during the afternoon or morning of the respective nights. We also observed the spectro-photometric standard star, Ross 640 (DZA5.5; Greenstein & Trimble 1967; Harrington & Dahn 1980; Wesemael et al. 1993), with the same OSIRIS configuration and the filter to correct for the second-order contamination and calibrate our target as far to the red as possible.
The OSIRIS spectroscopic data were reduced with the PypeIt pipeline (Prochaska et al. 2020, 2020). The PypeIt pipeline automatically calibrates the frame and subtracts the sky, extracts the object spectra, and performs the wavelength and flux calibrations in a standard manner. The sensitivity function for the instrumental response correction was generated from the standard star spectra observed in the morning of 2012 July 8 with the same grism but with a slitwidth of 2.5 arcsec, with and without the -band filter. We spliced the part before Å of the non -filtered standard spectrum and the part after Å of the -filtered standard spectrum to obtain the standard spectrum covering the whole wavelength range without second-order contamination. We note that the spectrum of the target W1738 is red enough to be free of second-order contamination; hence no splicing was needed. The pipeline co-added all the spectra. We asked the pipeline to mask the water absorption region from Å to Å and to fit a low-order polynomial to the co-added spectrum. The pipeline then used the Mauna Kea telluric grids to correct the spectra for the telluric contribution.
3 Results
3.1 Photometric results
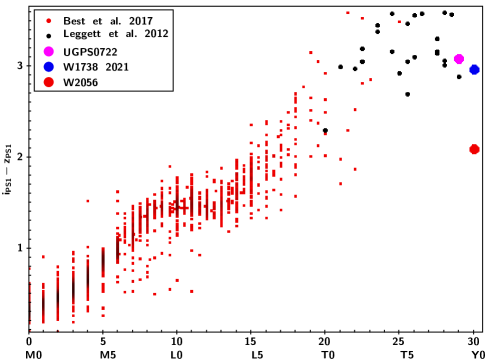
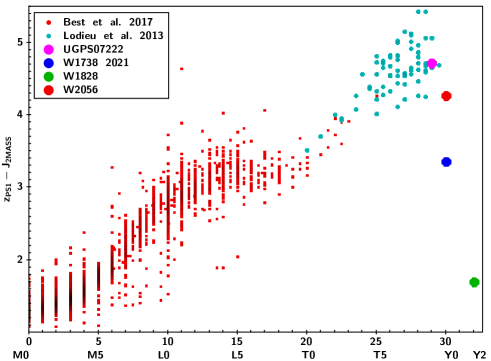
Our GTC/HiPERCAM photometry for the two detected Y dwarfs was put into the context of cool and ultracool dwarfs from the literature. The and colours versus spectral type diagrams are shown in Figure 5. The magnitudes were corrected for the PS1 AB system according to Zhang et al. (2023). Specifically, the corrections for W1738, W2056, and UGPS0722 were done using their spectra directly. According to Leggett et al. (2006), the correction of the magnitude from the MKO system to the 2MASS system is not significant in our plots. In both colours, the Y dwarfs tend to be similar to or bluer than the T dwarfs. This is particularly noticeable in the trend of the colour with respect to spectral type. The colour of W1828 is much bluer than that of T dwarfs. We note that the colour of W1738 in Figure 5 was obtained photometrically in 2021, and we noticed a variability in the colour using multiple-epoch spectroscopy, which we discuss in Section 4 and Figure 13.
3.2 Spectroscopic results
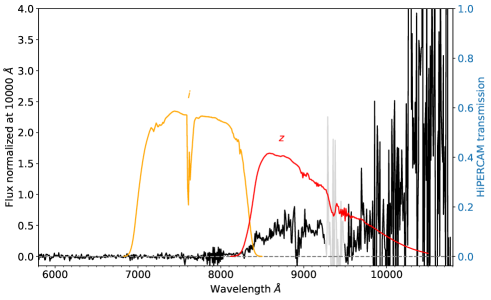
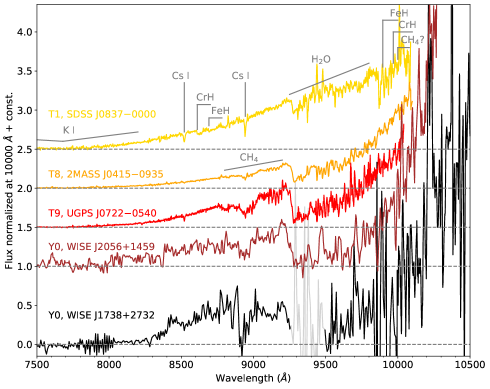
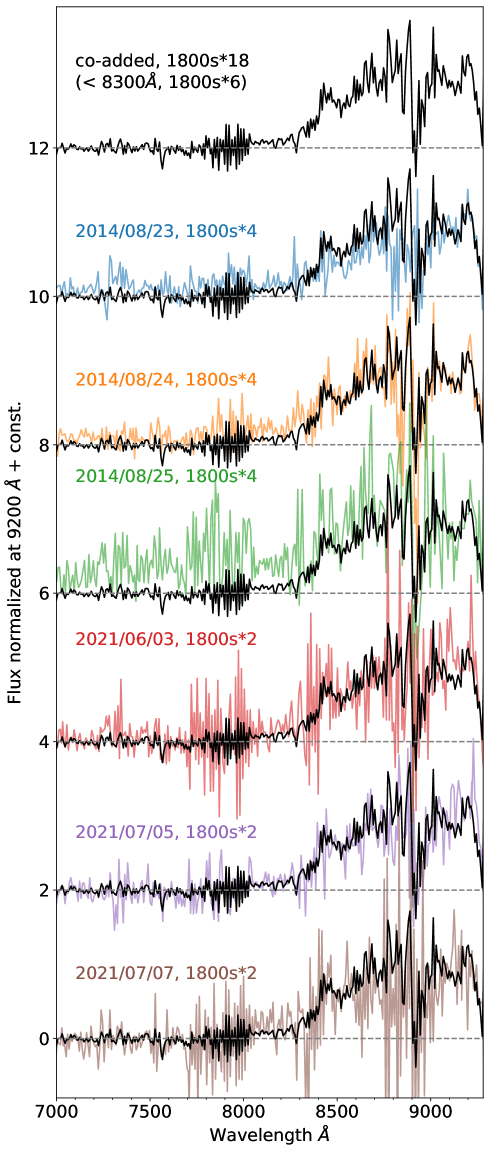
Figure 6 shows our final GTC spectrum combining all six of the observing epochs. The part below 8300 Å was co-added using only three epochs in 2021 because in 2014 the object was contaminated by a blue background galaxy that can be seen in the -band but not in the -band. We discuss this in detail in Section 5. The spectrum will be made available via the GTC public archive. The far-red optical spectrum of W1738 is shaped by molecular absorption bands and the extremely broad wings of the K I (7667/7701 Å) resonance doublet. Figure 7 shows a comparison of our GTC spectrum with those of T and Y dwarfs. The wide water band (9300–9400 Å) can be easily recognised as the strongest feature in the far-red optical spectrum of W1738. It increases in strength towards later T-type dwarfs and continues to get stronger in our Y dwarf spectrum. The methane feature (8800–9100 Å) is also stronger in W1738 than in the T8 standard. There is a hint of a detection of an absorption feature around 1 micron, possibly owing to methane (Yurchenko et al. 2017), that has also been noted in the HST spectrum of W1828 (Cushing et al. 2021), and in this paper we suggest it could be ascribed to hydrogen sulphide.
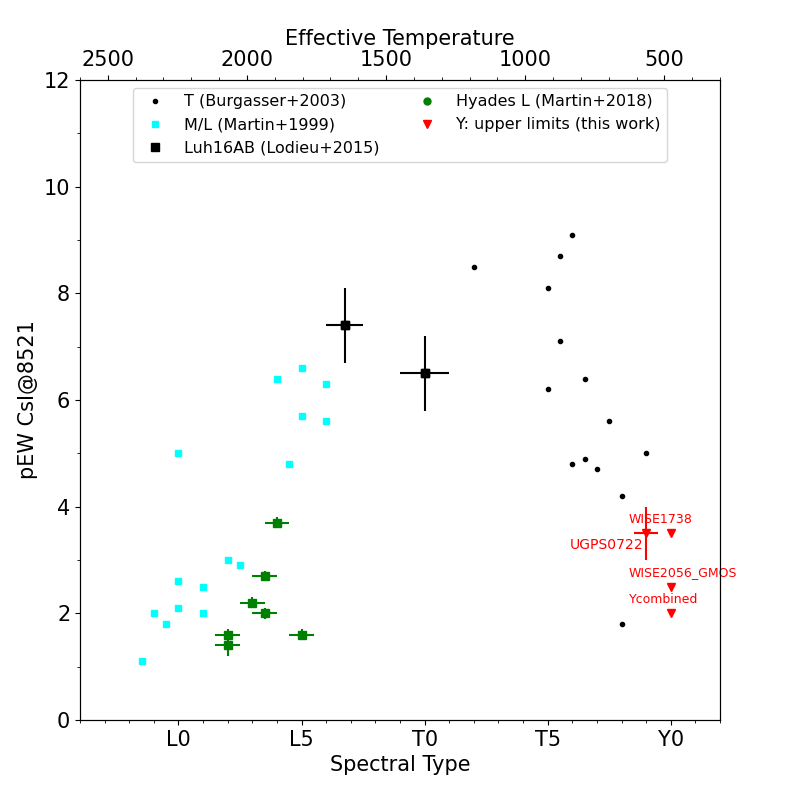
The Cs I doublet (8521/8965 Å) that is prominent in L and T dwarfs (Martín et al. (1997, 1999); Burgasser et al. (2003b); Lodieu et al. (2015, 2018)) could not be detected in our GTC spectrum of W1738. Using the IRAF splot task to estimate the signal-to-noise ratio and applying the equation provided in Martín et al. (2018), an upper limit was estimated for the pEW of the Cs I line at 8521 Å. This result is shown in Figure 8 together with measurements and upper limits for L and T dwarfs from the literature. W1738 follows the trend of decreasing Cs I strength already seen in late-T dwarfs. In the figure, additional data points for Y dwarfs observed with OSIRIS at GTC and available in the public archive are shown, and the point labelled as Y combined is the upper limit of the pEW obtained by combining all the Y dwarf optical spectra observed with the GTC. The upper limit labelled WISE2056-GMOS was derived by us using the Gemini spectrum published by Leggett et al. (2013) and was kindly provided to us by Sandy Leggett.
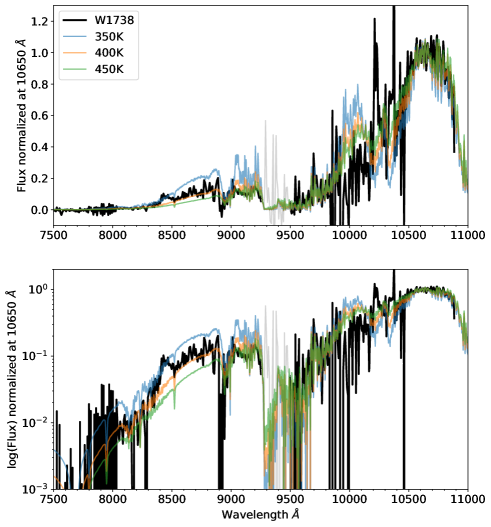
A comparison of our OSIRIS spectrum of W1738 with theoretical spectra from Morley et al. (2014) is shown in Figure 9. A best fit between our GTC optical spectrum and theoretical spectra was found for K, which is slightly lower than recent estimates by Kirkpatrick et al. (2021) and Leggett et al. (2021), who obtained K. All of these comparisons were made under the assumption of solar metallicity and high gravity because W1738 is a standard Y0 dwarf. The absolute Sloan magnitude of W1738, 23.23 mag, matches a higher temperature (475 K) in the SONORA evolutionary model provided by Marley et al. (2021) despite the fact that the gravity value changes from to 5.5. The minimisation technique to obtain the agreement between the observational and theoretical spectra was the same as in Pavlenko & Jones (2002). The overall agreement between the spectrum of W1738 and the synthetic spectra with in the range 400–450 K is fairly reasonable, although the breadth and depth of the K I resonance doublet is clearly overestimated in the 450 K theoretical spectrum. It is a well-recognised challenge to model the extremely strong pressure-broadened shape of the K I and Na I resonance doublets in ultracool dwarfs (Marley et al. 2002; Burrows & Volobuyev 2003; Allard et al. 2005, 2016; Pavlenko et al. 2007; Phillips et al. 2020), and it continues to be a matter of ongoing theoretical research (Allard et al. 2023). Our results for W1738 indicate that the theoretical treatment of K I resonance line formation in the models of Y dwarfs needs to be revised.
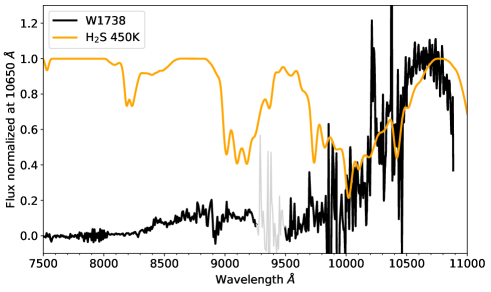
There is a noteworthy presence of certain absorption features in W1738 between 8000 and 8600 Å that are not seen in either the T dwarf spectra or in the synthetic spectra of Morley et al. (2014). Hydrogen sulphide (H2S) has recently been detected in the near-infrared spectrum of a T6 dwarf (Tannock et al. 2022). To check whether or not there could be an absorption band from H2S between 8000 and 8600 Å, we made a 1D-slab simulation with a temperature of 450 K and a column density of , where and are the molecular density of H2S and the geometrical size of the slab, respectively. The step in wavelength was 0.05 Å, the resolving power was 200, and the partition function was . The list of the H2S lines were taken from the EXOMOL database (Azzam et al. 2016). The results are shown in Figure 10. There are absorption features of H2S between 8000 and 8600 Åand also between 9000 and 10 500 Å.
4 Discussion
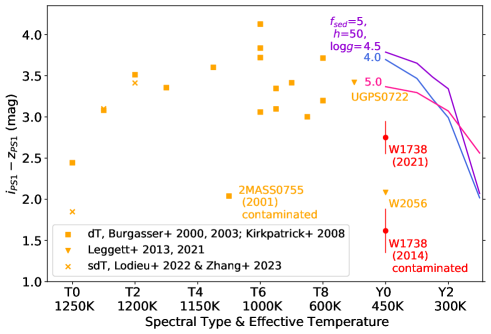
In Figure 11, we show the mean values of the colours that we obtained from observational spectra for T and Y dwarfs and from theoretical spectra for Y dwarfs and the colour derived from our GTC observations of W1738. The colours of the Y dwarfs are bluer than those of mid- and late-T dwarfs.
We synthesised the PS1 photometry of W1738 from multiple-epoch spectra. The colour is 1.62 mag for the co-added spectrum in 2014. We could not synthesize -band photometry for the co-added spectrum in 2021 because of the low signal-to-noise ratio. Instead, we used the HiPERCAM photometry in 2021 and then applied a correction for the filter profiles (the main difference is the two filters). The error bar of W1738 in 2021 was estimated based on photometric errors, and that of 2014 was scaled based on the difference of the efficiency between GTC/OSIRIS and GTC/HiPERCAM, on-source exposure time, and magnitudes in the - and -bands in two epochs. As a result, in 2021 mag, indicating a 1.13 mag change in colour between the 2014 and 2021 epochs of observation, with a significance of 2.5. As explained below, this is probably the result of contamination by a galaxy in the 2014 spectrum.
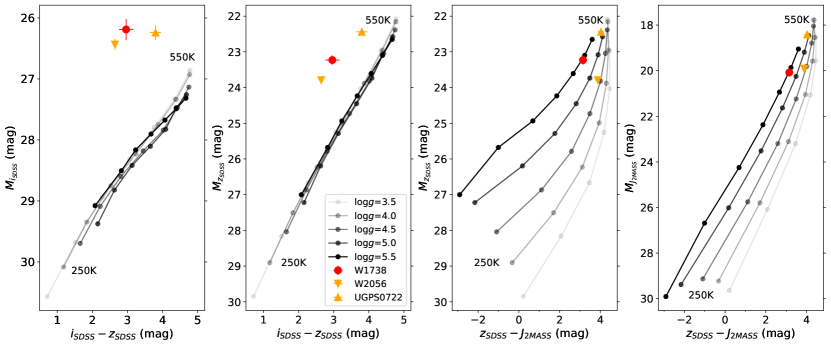
The blueing of the colours in the Y dwarfs is predicted by the models because of diminished absorption of the huge Na I and K I resonance doublets caused by grain sedimentation Marley et al. (2002). Alkali elements have low condensation temperatures, and in the atmospheres of Y dwarfs, they become locked into molecules, such as KCl Marley et al. (2002), which can condense out from the gas phase into solid dust grains. A confirmation of the weakening of the resonance lines of alkali elements in the atmospheres of Y dwarfs comes from the non-detection of the Cs I resonance features in our optical spectrum of W1738. An independent confirmation also comes from the fact that the disagreement between the model predictions and observations occurs when using the -band, but not when using and , as shown in Figure 12.
The information obtained from the GTC spectrum of W1738 presented in this paper shows that optical ground-based spectroscopy can complement space-based infrared spectroscopy. This is particularly timely, as detailed spectroscopic studies of Y dwarfs are starting to be carried out with JWST (Beiler et al. 2023).
Our upper limits on the optical emission of Y dwarfs (-,-, - bands) are the deepest ever published for these objects and set constraints on exotic sources of non-thermal optical light emission that could arise from phenomena such as aurorae, bioluminescence, and lightning. Y dwarfs are expected to be extremely faint in the filter. Using the models of (Morley et al. 2014), we estimate the predicted colour from photospheric emission to be for Y dwarfs. Our colour limit for W1738 sets a constraint on the presence of non-photospheric visible light emission in this object. It might be worthwhile to reach deeper than our GTC limit in order to detect the photospheric emission contribution in the -band.
After W1738 was observed at multiple epochs with the long-slit mode of OSIRIS at the GTC, the spectra were compared to check for the possibility of variability. This object has been reported to be photometrically variable at 1 and 4 microns (Leggett et al. 2016). As shown in Figure 13, in 2014 W1738 showed more flux in the -band, and in 2021 it had more flux around 9100 Å. The colour in 2014 indeed was 1.13 mag bluer than that in 2021. However, this bluer colour is spurious, owing to contamination by a galaxy at 17h38m35.69s427∘32’57.8” in 2014. The galaxy is not visible in the deep -band images nor in the GTC/OSIRIS data obtained in 2012 by Lodieu et al. (2013) or the GTC/HiPERCAM data obtained by us in 2021, but it is clearly visible in our GTC/HiPERCAM -, -, -, and -bands. We also checked the anomalous blue optical colour of 2MASS J07554795+2212169 for its spectral class (T5–T6) in Figure 11, and we found that the optical spectrum was also probably contaminated by a blue galaxy when its spectrum was taken in 2001. The issue of line-of-sight coincidences between extremely faint ultracool dwarfs and galaxies deserves further investigation, and we plan to study it in the near future. The upper bound of peak-to-peak variation at the day and month level from the synthesised photometry is of 0.53 mag for the -band, including any possible instrumental variations or changes in weather conditions.
5 Final remarks
In this paper, we have presented optical imaging observations of five Y dwarfs and a long-slit far-red spectrum for one of the dwarfs obtained at the GTC. One of our targets, W1738, was clearly detected in the -band, the first such detection of a Y dwarf. We obtained photometric measurements of W1738 in the - and -bands, a low-resolution far-red optical spectrum, and upper limits to the emission in the -, -, and -bands. The and colours of W1738 are bluer than for most T dwarfs. The colour of W1828 is even bluer than that of W1738. The most likely explanation for the colours of W1738 and W1828 is that they are relatively blue because of the weakening of the very broad K I resonance doublet. The K I resonance feature of the synthetic spectra is too strong and makes the predicted -band flux and colour fainter and redder, respectively, than the observations of Y dwarfs. The theoretical broadening and depth of the alkali lines needs to be revised. The presence of methane and water was detected in the spectrum of W1738 but not in that of Cs I. This is consistent with the weakening of Cs I features observed in other Y dwarfs. There are absorption features (8000–8600 Å) in our GTC spectrum of W1738 that are not seen in the far-red spectra of T dwarfs. The 1D-slab simulations suggest that H2S has absorption features in this spectral range; hence, hydrogen sulphide could be responsible for those features in our optical spectrum of W1738. We found a change in the colour of W1738 between the 2014 and 2021 OSIRIS observations that we attribute to contamination of the -band long-slit spectrum by a galaxy in 2014. Care must be exercised because line-of-sight chance alignments with background galaxies could be quite common. We have shown that the -band flux of Y dwarfs is brighter than expected based on theory, and we note that this finding could help detect this type of object in upcoming large-area surveys such as the Euclid space mission and the Vera C. Rubin Legacy Survey of Space and Time, which will obtain deep observations at optical wavelengths. The number of Y dwarfs that will be detected by Euclid at near-infrared wavelengths is not expected to be large (Martín et al. 2021; Solano et al. 2021), and in the optical, this number has not been estimated.
Acknowledgements.
The anonymous referee is gratefully acknowledged for three insightful reports that greatly improved the contents and presentation of this paper. Funding for this work was provided by the European Union (ERC, SUBSTELLAR, project number 101054354) and the Agencia Estatal de Investigación del Ministerio de Ciencia e Innovación (AEI-MCINN) under grant PID2019-109522GB-C53. YP’s work has been carried out within the framework of the MSCA4Ukraine program, project number 1.4-UKR-1233448-MSCA4Ukraine. This paper is based on observations made with the Gran Telescopio Canarias (GTC), installed at the Spanish Observatorio del Roque de los Muchachos of the Instituto de Astrofísica de Canarias, on the island of La Palma. This work is (partly) based on data obtained with the OSIRIS instrument, built by a Consortium led by the Instituto de Astrofísica de Canarias in collaboration with the Instituto de Astronomía of the Universidad Autónoma de México. OSIRIS was funded by GRANTECAN and the National Plan of Astronomy and Astrophysics of the Spanish Government. This research has made use of the Simbad and Vizier databases, operated at the centre de Données Astronomiques de Strasbourg (CDS), and of NASA’s Astrophysics Data System Bibliographic Services (ADS). The Pan-STARRS1 Surveys (PS1) and the PS1 public science archive have been made possible through contributions by the Institute for Astronomy, the University of Hawaii, the Pan-STARRS Project Office, the Max-Planck Society and its participating institutes, the Max Planck Institute for Astronomy, Heidelberg, and the Max Planck Institute for Extraterrestrial Physics, Garching, The Johns Hopkins University, Durham University, the University of Edinburgh, the Queen’s University Belfast, the Harvard-Smithsonian Center for Astrophysics, the Las Cumbres Observatory Global Telescope Network Incorporated, the National Central University of Taiwan, the Space Telescope Science Institute, the National Aeronautics and Space Administration under Grant No. NNX08AR22G issued through the Planetary Science Division of the NASA Science Mission Directorate, the National Science Foundation Grant No. AST-1238877, the University of Maryland, Eotvos Lorand University (ELTE), the Los Alamos National Laboratory, and the Gordon and Betty Moore Foundation.References
- Allard et al. (2005) Allard, N. F., Allard, F., & Kielkopf, J. F. 2005, A&A, 440, 1195
- Allard et al. (2023) Allard, N. F., Myneni, K., Blakely, J. N., & Guillon, G. 2023, A&A, 674, A171
- Allard et al. (2016) Allard, N. F., Spiegelman, F., & Kielkopf, J. F. 2016, A&A, 589, A21
- Azzam et al. (2016) Azzam, A. A. A., Tennyson, J., Yurchenko, S. N., & Naumenko, O. V. 2016, MNRAS, 460, 4063
- Beichman et al. (2013) Beichman, C., Gelino, C. R., Kirkpatrick, J. D., et al. 2013, ApJ, 764, 101
- Beiler et al. (2023) Beiler, S., Cushing, M., Kirkpatrick, D., et al. 2023, arXiv e-prints, arXiv:2306.11807
- Best et al. (2017) Best, W. M. J., Liu, M. C., Magnier, E. A., et al. 2017, 837, 95
- Burgasser et al. (2003a) Burgasser, A. J., Kirkpatrick, J. D., Burrows, A., et al. 2003a, 592, 1186
- Burgasser et al. (2003b) Burgasser, A. J., Kirkpatrick, J. D., Liebert, J., & Burrows, A. 2003b, 594, 510
- Burgasser et al. (2013) Burgasser, A. J., Melis, C., Zauderer, B. A., & Berger, E. 2013, 762, L3
- Burgasser et al. (2000) Burgasser, A. J., Wilson, J. C., Kirkpatrick, J. D., et al. 2000, 120, 1100
- Burrows & Volobuyev (2003) Burrows, A. & Volobuyev, M. 2003, 583, 985
- Cepa et al. (2000) Cepa, J., Aguiar, M., Escalera, V. G., et al. 2000, in Society of Photo-Optical Instrumentation Engineers (SPIE) Conference Series, Vol. 4008, Society of Photo-Optical Instrumentation Engineers (SPIE) Conference Series, ed. M. Iye & A. F. Moorwood, 623–631
- Chambers et al. (2016) Chambers, K. C., Magnier, E. A., Metcalfe, N., & 103 co-authors. 2016
- Cushing et al. (2011) Cushing, M. C., Kirkpatrick, J. D., Gelino, C. R., et al. 2011, 743, 50
- Cushing et al. (2021) Cushing, M. C., Schneider, A. C., Kirkpatrick, J. D., et al. 2021, ApJ, 920, 20
- Cutri et al. (2003) Cutri, R. M., Skrutskie, M. F., van Dyk, S., et al. 2003, 2MASS All Sky Catalog of point sources, 2246
- De Furio et al. (2023) De Furio, M., Lew, B., Beichman, C., et al. 2023, ApJ, 948, 92
- Delorme et al. (2008) Delorme, P., Delfosse, X., Albert, L., et al. 2008, 482, 961
- Dhillon et al. (2021) Dhillon, V. S., Bezawada, N., Black, M., et al. 2021, MNRAS, 507, 350
- Garzón et al. (2022) Garzón, F., Balcells, M., Gallego, J., et al. 2022, A&A, 667, A107
- Greenstein & Trimble (1967) Greenstein, J. L. & Trimble, V. L. 1967, 149, 283
- Harrington & Dahn (1980) Harrington, R. S. & Dahn, C. C. 1980, 85, 454
- Kirkpatrick et al. (2008) Kirkpatrick, J. D., Cruz, K. L., Barman, T. S., et al. 2008, 689, 1295
- Kirkpatrick et al. (2021) Kirkpatrick, J. D., Gelino, C. R., Faherty, J. K., et al. 2021, ApJS, 253, 7
- Leggett et al. (2006) Leggett, S. K., Currie, M. J., Varricatt, W. P., et al. 2006, 373, 781
- Leggett et al. (2016) Leggett, S. K., Cushing, M. C., Hardegree-Ullman, K. K., et al. 2016, ApJ, 830, 141
- Leggett et al. (2013) Leggett, S. K., Morley, C. V., Marley, M. S., et al. 2013, 763, 130
- Leggett et al. (2012) Leggett, S. K., Saumon, D., Marley, M. S., et al. 2012, 748, 74
- Leggett et al. (2021) Leggett, S. K., Tremblin, P., Phillips, M. W., et al. 2021, ApJ, 918, 11
- Lodieu et al. (2013) Lodieu, N., Béjar, V. J. S., & Rebolo, R. 2013, 550, L2
- Lodieu et al. (2018) Lodieu, N., Rebolo, R., & Pérez-Garrido, A. 2018, 615, L12
- Lodieu et al. (2022) Lodieu, N., Zapatero Osorio, M. R., Martín, E. L., Rebolo López, R., & Gauza, B. 2022, A&A, 663, A84
- Lodieu et al. (2015) Lodieu, N., Zapatero Osorio, M. R., Rebolo, R., et al. 2015, 581, A73
- Marley et al. (2021) Marley, M. S., Saumon, D., Visscher, C., et al. 2021, ApJ, 920, 85
- Marley et al. (2002) Marley, M. S., Seager, S., Saumon, D., et al. 2002, 568, 335
- Martín et al. (1997) Martín, E. L., Basri, G., Delfosse, X., & Forveille, T. 1997, 327, L29
- Martín et al. (1999) Martín, E. L., Delfosse, X., Basri, G., et al. 1999, 118, 2466
- Martín et al. (2018) Martín, E. L., Lodieu, N., Pavlenko, Y., & Béjar, V. J. S. 2018, 856, 40
- Martín et al. (2021) Martín, E. L., Zhang, J. Y., Esparza, P., et al. 2021, A&A, 655, L3
- Morley et al. (2014) Morley, C. V., Marley, M. S., Fortney, J. J., et al. 2014, 787, 78
- Pavlenko & Jones (2002) Pavlenko, Y. V. & Jones, H. R. A. 2002, A&A, 396, 967
- Pavlenko et al. (2007) Pavlenko, Y. V., Zhukovska, S. V., & Volobuev, M. 2007, Astronomy Reports, 51, 282
- Phillips et al. (2020) Phillips, M. W., Tremblin, P., Baraffe, I., et al. 2020, A&A, 637, A38
- Prochaska et al. (2020) Prochaska, J. X., Hennawi, J., Cooke, R., et al. 2020, pypeit/PypeIt: Release 1.0.0
- Prochaska et al. (2020) Prochaska, J. X., Hennawi, J. F., Westfall, K. B., et al. 2020, Journal of Open Source Software, 5, 2308
- Solano et al. (2021) Solano, E., Gálvez-Ortiz, M. C., Martín, E. L., et al. 2021, MNRAS, 501, 281
- Tannock et al. (2022) Tannock, M. E., Metchev, S., Hood, C. E., et al. 2022, MNRAS, 514, 3160
- Tinney et al. (2018) Tinney, C. G., Kirkpatrick, J. D., Faherty, J. K., et al. 2018, ApJS, 236, 28
- Tody (1986) Tody, D. 1986, in Society of Photo-Optical Instrumentation Engineers (SPIE) Conference Series, Vol. 627, Society of Photo-Optical Instrumentation Engineers (SPIE) Conference Series, ed. D. L. Crawford, 733
- Tody (1993) Tody, D. 1993, in Astronomical Society of the Pacific Conference Series, Vol. 52, Astronomical Data Analysis Software and Systems II, ed. R. J. Hanisch, R. J. V. Brissenden, & J. Barnes, 173
- Wesemael et al. (1993) Wesemael, F., Greenstein, J. L., Liebert, J., et al. 1993, 105, 761
- Yurchenko et al. (2017) Yurchenko, S. N., Amundsen, D. S., Tennyson, J., & Waldmann, I. P. 2017, A&A, 605, A95
- Zhang et al. (2023) Zhang, J. Y., Lodieu, N., & Martín, E. L. 2023, A&A, 678, A105