Eye-gaze Guided Multi-modal Alignment Framework for Radiology
Abstract
In multi-modal frameworks, the alignment of cross-modal features presents a significant challenge. The predominant approach in multi-modal pre-training emphasizes either global or local alignment between modalities, utilizing extensive datasets. This bottom-up driven method often suffers from a lack of interpretability, a critical concern in radiology. Previous studies have integrated high-level labels in medical images or text, but these still rely on manual annotation, a costly and labor-intensive process. Our work introduces a novel approach by using eye-gaze data, collected synchronously by radiologists during diagnostic evaluations. This data, indicating radiologists’ focus areas, naturally links chest X-rays to diagnostic texts. We propose the Eye-gaze Guided Multi-modal Alignment (EGMA) framework to harness eye-gaze data for better alignment of image and text features, aiming to reduce reliance on manual annotations and thus cut training costs. Our model demonstrates robust performance, outperforming other state-of-the-art methods in zero-shot classification and retrieval tasks. The incorporation of easily-obtained eye-gaze data during routine radiological diagnoses signifies a step towards minimizing manual annotation dependency. Additionally, we explore the impact of varying amounts of eye-gaze data on model performance, highlighting the feasibility and utility of integrating this auxiliary data into multi-modal pre-training.
Index Terms:
Medical Multi-modal Alignment, Eye-gaze, Radiology.I Introduction
With the development of multi-modal learning, models in the pre-training phase can now utilize large amounts of paired multi-modal data, such as image-text pairs, audio-text pairs, etc., to optimize the multi-modal feature extraction and alignment capabilities. With the emergence of the CLIP [1] model, contrastive learning has become the prominent framework of multi-modal learning. The advantage of this framework lies in its simplicity of structure and it does not require sample-level annotations. However, the main drawback is its heavy reliance on the scale of training data. When trained on smaller-scale data, the model cannot accurately learn the alignment relationship between multi-modal features. Subsequent works have sought to optimize this framework. For instance, GLIP [2] and RegionCLIP [3] utilized pre-predicted annotation information to perform fine-grained region-level pre-training. They used detection networks firstly to predict image regions relevant to the text prompt, and then trained the model to align these image regions with their corresponding text descriptions. However, these models heavily rely on the performance of the ROI detector and have high computational complexity. FILIP [4] proposed a refined multi-modal alignment method using image patches and text tokens, choosing to perform this operation after the encoder. This significantly reduces the burden on training the model and enhances the flexibility of the architecture.
In the medical domain, there are also datasets available for training multi-modal models, such as MIMIC-CXR [5] containing 377,110 chest images and 227,827 corresponding diagnostic reports, and CheXpert [6] containing 224,316 chest images with semantic labels. While these datasets are smaller in scale compared to natural image datasets, models pretrained on them are better suited for medical tasks like classification, retrieval, and VQA. To address the scarcity of medical data, studies [7, 8] have introduced self-supervised training into the CLIP framework to further enhance encoder performance. Additionally, weak labels between images and texts have been incorporated during pretraining to aid multi-modal alignment [9]. Some studies [10, 11] utilized fine-grained alignment between chest image patches and text tokens for pretraining, similar to approaches [4] in natural image domains. However, unlike natural images, the relationship between medical images and diagnostic texts is often more complex and challenging to learn, and in some domains, the available datasets for training remain small in scale. Consequently, models trained in the pretraining phase are prone to over-fitting, learning non-essential shortcut [12] features, thereby diminishing the model’s generalization and interpretability.
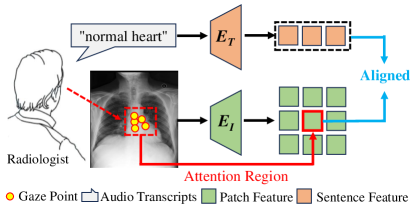
In this study, we fully explore the auxiliary role of eye-gaze data from radiologists. Eye-gaze data can intuitively reflect the image regions radiologists focus on, providing insights into their cognitive behavior during diagnosis. When collecting eye-gaze data simultaneously with radiologists’ observation of images and verbalization of diagnostic results, it serves as a bridge for aligning images and text, as radiologists tend to examine relevant image areas when providing diagnoses (as illustrated in Fig. 1). Therefore, we believe this data can serve as an auxiliary role in aligning textual and visual features. For the data collection, study [13] developed an eye-tracking system that allows radiologists to interact freely with images, departing from the fixed-image acquisition mode, thereby offering a feasible solution for data collection in routine work settings. Moreover, such a system significantly reduces the time radiologists spend annotating data, laying the groundwork for future data expansion. And there already exists a publicly available medical multi-modal dataset called MIMIC-EYE [14]. Thus, considering the utilization of eye-tracking data to assist in multi-modal model training, we propose the Eye-gaze Guided Multi-modal Alignment framework (EGMA). Our model first segments the transcribed text into individual sentences and obtains radiologists’ attention heatmaps. Subsequently, we obtain encoded features of image patches and sentences through image and text encoders, generating instance-level similarity matrix. Then, we compute the loss between this matrix and the attention heatmaps, integrating refined feature representations for subsequent contrastive loss. To further leverage the assisting role of eye-gaze data in aligning images and texts, we combine the eye-gaze heatmaps with the similarity matrix derived from model, serving as weights to calculate cross-modal mapping loss. Experimental results on zero-shot classification and retrieval tasks reveal that our framework surpasses other leading methods in performance across diverse datasets and under multiple dataset size scenarios. Specifically, the EGMA framework yielded a remarkable 3.9% improvement in image-to-text matching tasks and an impressive 19.75% increase in text-to-image matching tasks. These results underscore the cutting-edge and efficacious nature of our approach, highlighting its substantial advancements over existing methodologies. We also explore the auxiliary effect of using eye-gaze data of different scales on the model, finding that even a small portion of eye-gaze data can enhance the model’s multi-modal processing capability. Moreover, our framework performs feature alignment after the encoders, enhancing flexibility while reducing reliance on annotated data, laying a foundation for the future application of eye-tracking data in the medical domain. The code of this work will be available on Github111https://github.com/Momarky/EGMA.
In summary, the main contributions of this work are as follows:
-
•
We propose EGMA, a novel framework for medical multi-modal alignment, marking the first attempt to integrate eye-gaze data into vision-language pre-training.
-
•
EGMA outperforms existing state-of-the-art medical multi-modal pre-training methods, and realizes notable enhancements in image-text retrieval tasks.
-
•
EGMA demonstrates that even a small amount of eye-gaze data can effectively assist in multi-modal pre-training.
II Related Works
II-A Medical Vision-language Pre-training (Med-VLP)
In the pursuit of Artificial General Intelligence (AGI), Vision-language Pre-training (VLP) has emerged as a pivotal area in AI research.
The advent of the transformer architecture [15] has not only initiated a new chapter in the integration of vision and language but has also significantly accelerated the progress in the multi-modal domain. During this phase, VLP frameworks predominantly focused on the development of fusion encoders. These frameworks employed cross-attention mechanisms to amalgamate visual and textual features [16, 17], commonly adopting a dual-stream architecture. The introduction of CLIP [1] marked a significant breakthrough in the VLP field, leading to the genesis of a plethora of CLIP-based VLP frameworks. These frameworks integrate contrastive loss as a fundamental component [4, 2], thereby enriching the scope and effectiveness of VLP methodologies.
In the medical field, rapid advancements have also been made in multi-modal pre-training. ConVIRT [18] serves as an equivalent to CLIP [1] in the medical domain. MedCLIP [9] ingeniously addressed the challenge of insufficient paired image-text data in healthcare by integrating knowledge extraction techniques to decouple image-text pairs. Similarly, BioViL [19] demonstrates enhanced performance through the training of specialized biomedical text BERT encoders in contrastive learning tasks. In terms of multi-level alignment, GLoRIA [10] proposed multi-modal global-local representation learning of instance-level and token-level. MGCA [11] introduced alignment at three levels: pathological region, instance, and disease. Furthermore, study [20] incorporated knowledge bases to infuse expert knowledge from the medical domain into the system.
II-B Eye-tracking Technology in Radiology
In the realm of medical imaging diagnostics, the visual analysis performed by professional radiologists plays a decisive role. A key technique in this domain is eye-tracking, which has demonstrated its value in radiological research over the past several decades [21]. Early investigations have found that experienced radiologists are able to quickly identify hidden lesions through comprehensive observation, a process that relies on their broader field of view and extensive professional knowledge [22, 23]. For instance, Ellen et al. [24] have revealed how seasoned radiologists systematically examine standard chest X-rays, in stark contrast to novice doctors.
In the field of medical deep learning, the integration of radiologists’ eye-gaze data has been a significant advancement. Khosravan et al. [25] successfully merged this data with Convolutional Neural Networks (CNNs) for enhanced lesion detection accuracy. Exploring further, Mall et al. [26] delved into the visual search patterns in mammography, establishing a crucial link between human visual attention and CNN performance in detecting mammogram lesions. Karargyris et al. [27] contributed by developing a comprehensive dataset that includes both eye-gaze data and disease diagnosis, facilitating multi-task processing in this domain. In a similar vein, Wang et al. [28] innovated by introducing an attention consistency module, which harnessed radiologists’ visual attention to improve the accuracy of CNNs in diagnosing osteoarthritis from knee X-ray images. Building on these advancements, Ma et al. [13] recently explored the integration of eye-gaze data with advanced Vision Transformer (ViT) models, pushing the boundaries of medical image processing even further.
In the exploration of multi-modal tasks, Men et al. [29] innovatively crafted a multi-modal guidance system. This system adeptly replicates the combined dynamics of eye tracking and probe manipulation as performed by sonographers in obstetric ultrasound examinations. By effectively mirroring the expertise of medical professionals, the system significantly elevates the accuracy and efficiency of ultrasound scanning. Nonetheless, the integration of these eye-gaze data with image-text alignment strategies for enhancing the effectiveness of medical vision-language models represents an ongoing area of research yet to be fully resolved.
III Method
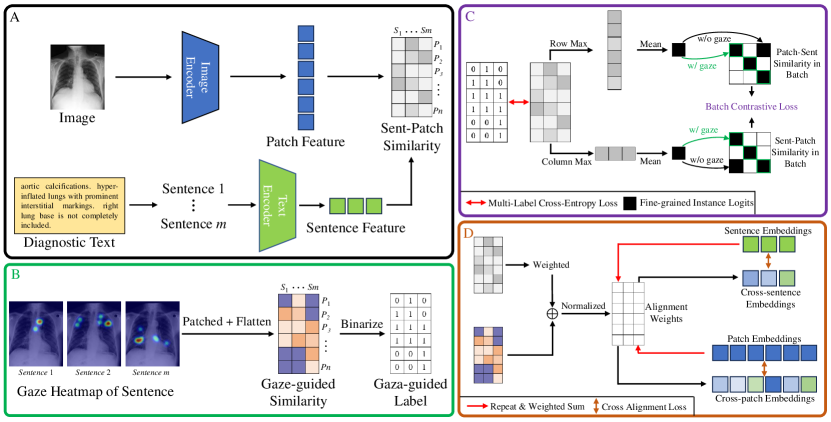
As shown in Fig. 2, the framework of our proposed method consists of four main components. Firstly, we extract features from image and text in part to obtain a refined instance-level similarity matrix. Secondly, in part , we integrate textual transcripts derived from radiologists’ audio, images, and eye-gaze data, to visualize and map radiologists’ attention onto specific regions of images during diagnosis. This process establishes alignment between texts and images, facilitating model training. The detailed gaze data processing methods are described in Sec. III-A. Given that eye-gaze data tightly links textual and localized visual information, after obtaining auxiliary information from part , we introduce eye-gaze guided refined alignment training strategies, as depicted in Parts and of Fig. 2. Specifically, we introduce the optimization algorithm for eye-gaze guided fine-grained text-image similarity matrix in Part in Sec. III-B. Finally, in Sec. III-C, we present the algorithm for eye-gaze guided cross-modal mapping.
III-A Multi-modal Data Processing
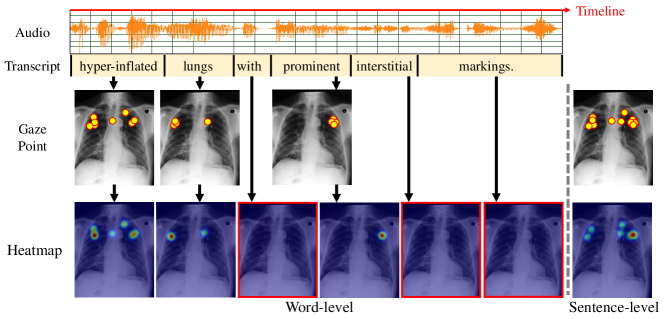
With the development of data collection technologies such as eye-tracking and speech recognition, it has become possible to collect and process multi-modal interaction data of radiologists during the diagnostic process. As illustrated in Fig. 3, the presentation of multi-modal data in the MIMIC-EYE [14] dataset includes radiologists’ audio, text transcript, eye-gaze data, and image. Since each modality is synchronized, the audio data is aligned with the eye-gaze data in time. By segmenting the audio based on the time before and after the pronunciation of each word, we can align the transcripts with the audio, thereby aligning word-level text with eye-gaze data. Subsequently, we generate attention heatmap based on eye-gaze data and images to represent the image regions the radiologist focuses on. Through the aforementioned data processing steps, we achieve precise alignment between word-level text and image regions. It is noteworthy that due to the rapid speech rate of radiologists, there may be no available eye-gaze data within the time interval corresponding to a single word. In Fig. 3, the word “with” in the transcript has no corresponding gaze data. Another common and unavoidable issue is the loss of eye-gaze data caused by blinking and intense head movement of radiologist, as seen in the last two words of the transcript. Due to these technical challenges, achieving perfect pairing between words and image regions is difficult. However, as shown in the right side of Fig. 3, adjusting the text to the sentence level largely mitigates the issue of missing word-level heatmap (Heatmap with red edge), and the semantic information of the entire sentence also encompasses the information of each word. Therefore, in this work, we process text features at the sentence level.
III-B Eye-gaze Guided Fine-grained Alignment
The core idea of contrastive learning is to bring the features of related samples closer while pushing away the features of unrelated samples. During the training progress of CLIP model, assuming a batch size of and input data () representing image-text pairs, global features and are obtained through image encoder and text encoder . Subsequently, the cosine similarity and between the two modalities is computed, with the following formula:
| (1) |
where is the image-to-text similarity, is the text-to-image similarity, and is the index number of the another modality. Then, the image-to-text contrastive loss for can be formulated as:
| (2) |
where is learned temperature. Similarly, the text-to-image contrastive loss for is:
| (3) |
It is worth noting that in the calculation of the loss mentioned above, both the image and text utilize global-level features, while the auxiliary information generated from eye-gaze data emphasizes the local-level features between modalities. Therefore, based on [4], we replace instance feature and with and , where () is the -th patch feature of and () is the -th sentence feature of , and are the image patch number and the sentence number of report. Then we calculate the similarities of sentence-to-patch and patch-to-sentence in one instance:
| (4) |
For each heatmap corresponding to a sentence, we initially divide it into patches similar to the image. Subsequently, we concatenate the heatmaps of sentences to obtain the Gaze-guided Similarity matrix for input (as illustrated in Fig. 2.B). In this matrix, non-zero elements indicate the semantic correlation between the corresponding sentences and image patches. Thus, we binarize , setting non-zero regions to 1, resulting in the Gaze-guided Label matrix . After this step, we compute the multi-label cross-entropy (MLCE) loss for and , completing the optimization for fine-grained alignment between positive sample pairs , as follows:
| (5) |
where is the multi-label cross-entropy loss. Subsequently, we calculate the fine-grained features and . Then, we replace the with the updated in Eq. 1. Finally, the fine-grained image-to-text loss and text-to-image loss are computed based on Eq. 2 and Eq. 3. The formula for our Eye-gaze Guided Fine-grained (EGF) alignment loss is as follows:
| (6) |
III-C Eye-gaze Guided Cross-model Mapping
In the previous section, we replaced the global instance logits in the traditional batch clip loss with fine-grained instance logits that consider local features and optimized the alignment between these local features using gaze information. The text in our work is recorded by radiologists while observing images, implying a close semantic relationship between the focus region and the corresponding text. To further optimize the alignment between modalities, we continue to incorporate eye-gaze data assistance into the cross-modal mapping process. In this work, we first utilize matrices and to generate the image-to-text alignment weight matrix . The calculation formula is as follows:
| (7) |
where is normalization and consists of sparse and binarize operations. Similarly, the text-to-image alignment weight matrix is:
| (8) |
After obtaining the weight matrix, we perform the mapping from text features to image features and from image features to text features according to the following formula:
| (9) |
where is the -th patch feature of and is the -th sentence feature of . Subsequently, we use the mapped features along with the target features as inputs to compute the alignment contrastive loss defined in Eq. 2, obtaining the image mapping loss and the text mapping loss . The formula for our Eye-gaze Guided cross-model Mapping (EGM) loss is as follows:
| (10) |
Finally, the total loss of our model within a batch is . In our training process, considering the proportion of eye-gaze data, batches may contain both types of data. When encountering samples without eye-gaze data, the EGF module does not compute the loss from Eq. 5, and the weight matrix in the Eq. 7 and Eq. 8 of EGM module also excludes the .
IV Experiments
In this study, we conduct zero-shot classification on multiple datasets, as well as image-to-text and text-to-image retrieval tests. In the following subsections, we first introduce the implementation details in Section IV-A. Then, we compare our proposed framework with state-of-the-art medical vision-language pre-training methods and show the comparison results in Section IV-B. Further, we analyze different components in our framework through ablation study in Section IV-C. Finally, the feature representation is visualized in Section IV-D.
IV-A Implementation Details
We utilize MIMIC-EYE [14] datasets as our training set. It contains 3689 images, each associated with corresponding eye-gaze data and transcripts text. Additionally, we evaluate the model’s zero-shot classification and zero-shot retrieval capabilities using the CheXpert [6], RSNA [30], and SIIM-ACR [31] datasets individually. Detailed descriptions of the datasets can be found in the supplementary materials. We use SwinTransformer [32] as the image encoder, BioClinicalBERT [33] as the text encoder, and initialized the model parameters using pre-training parameters provided by the MedCLIP model, which were trained on CheXpert [6] and MIMIC-CXR [5] datasets. It’s worth noting that the two CheXpert subsets used in our test set are not included in the aforementioned training set, thus avoiding any data leakage issues. Subsequently, we continued training the model on MIMIC-EYE. For the transcribed text in the data, we first split it into individual sentences. After passing through the text encoder, we concatenated the features of sentences belonging to the same report and computed the similarity with image features. As images need to correspond to the positions of gaze attention maps, we only employed contrast-related image augmentation methods during training. And we train our model with 50 epochs with an initial learning rate and weight decay and 10 epochs of warm-up. All eye-gaze heatmaps and images are simply resized to pixels.
IV-B Comparison with State-of-the-Arts
IV-B1 Zero-shot Classification
In this section, we compare the diagnostic performance and generalization of our EGMA model with other prominent models across three datasets CheXpert 5x200 [6], RSNA [30], and SIIM-ACR [31] for zero-shot classification. These models include the universal image-text contrastive model CLIP [1] and three SOTA multi-modal methods in the medical domain: GLoRIA [10], MedCLIP [9], and MGCA [11]. In our testing, the textual queries we used are all derived from [10], written by a board-certified radiologist. We evaluate the common metrics of accuracy (Acc.) and F1 score (F1) for the classification task.
| Method | CheXpert 5x200 [6] | RSNA [30] | SIIM-ACR [31] | |||
|---|---|---|---|---|---|---|
| Acc. | F1 | Acc. | F1 | Acc. | F1 | |
| CLIP [1] | 20.10 | 9.12 | 25.03 | 22.07 | 49.39 | 47.98 |
| GLoRIA [10] | 53.30 | 48.99 | 29.15 | 28.54 | 22.57 | 22.57 |
| MedCLIP [9] | 57.50 | 55.97 | 43.09 | 31.01 | 58.40 | 57.85 |
| MGCA [11] | 43.60 | 41.37 | 60.83 | 57.77 | 30.03 | 25.45 |
| EGMA(Ours) | 60.50 | 58.44 | 57.81 | 36.70 | 63.62 | 61.46 |
The experimental results are presented in Tab. I, demonstrating competitive performance of our model. For the CLIP model in the first row of Tab. I, its training data mainly consist of natural images, hence its processing capability for medical images is relatively poor. Conversely, models in rows two to four utilize encoders pre-trained on medical datasets, thus, they are expected to outperform CLIP, as evident in the results on the CheXpert 5x200 and RSNA datasets. And our model achieves the best performance on the CheXpert 5x200 and SIIM-ACR datasets, and the second-best performance on the RSNA dataset. This could be attributed to significant differences between the RSNA dataset and CheXpert 5x200/SIIM-ACR in terms of pathological features related to pneumonia, image characteristics, and annotation methods. Additionally, the RSNA dataset may suffer from class imbalance issues, which adversely affect model performance. MGCA exhibits the best performance in pneumonia diagnosis on the RSNA dataset. This could be attributed to its large training dataset, MIMIC-CXR, which contains a significant number of pneumonia-related cases. However, as indicated in the visualization analysis in Sec. IV-D, the feature representation of MGCA is inferior to that of our model. Interestingly, both the GLoRIA and MGCA models show lower diagnostic performance for pneumothorax disease on the SIIM-ACR dataset compared to the CLIP model. This could be attributed to the influence of the training data distribution during the pre-training of these models, leading to the learning of irrelevant shortcut features [12] in the dataset and resulting in over-fitting and decreased generalization ability. Consequently, when testing with datasets that differ from the pre-training data, such as the SIIM-ACR dataset, performance degradation is observed, as shown in Tab. I. In contrast, our model does not experience this phenomenon in these datasets. This is attributed to the introducing of eye-gaze data, which contains prior information from radiologists. Guided by this information, our model can learn the universal features of texts and images truly relevant to the disease in the data, enabling effective discrimination between normal and diseased samples even when applied to different datasets. Specifically, our model achieves the best performance on the CheXpert 5x200 and SIIM-ACR datasets, and the second-best performance on the RSNA dataset.
IV-B2 Image-text Retrieval
| Method | Image-to-text | Text-to-image | ||||
|---|---|---|---|---|---|---|
| P@1 | P@5 | P@10 | P@1 | P@5 | P@10 | |
| CLIP [1] | 12.75 | 12.48 | 10.03 | 5.00 | 12.50 | 12.50 |
| GLoRIA [10] | 38.75 | 31.62 | 24.51 | 52.50 | 49.00 | 50.25 |
| ConVIRT [18] | - | - | - | 60.25 | 60.00 | 57.50 |
| MedCLIP [9] | 14.50 | 15.98 | 15.86 | 12.50 | 12.50 | 15.00 |
| MGCA [11] | 35.00 | 27.80 | 23.33 | 45.00 | 47.50 | 44.00 |
| EGMA(Ours) | 42.65 | 37.50 | 28.84 | 80.00 | 74.50 | 69.50 |
To further validate the alignment capability of our model between texts and images, we compare the zero-shot retrieval performance of EGMA with other models on CheXpert 8x200 dataset [18]. Following [10], for each disease category in this dataset, we have five corresponding textual prompts. It is worth noting that the prompts for retrieval tasks are different from those for classification tasks in the previous section, but all are written by board-certified radiologists. In the image-to-text retrieval task, we first compute the similarity between the image and all candidate texts, and then rank the retrieved results. Similarly, in the text-to-image task, we compute the similarity between the textual prompts and all images, and rank the retrieval results. We report Precision at Top-1, Top-5, and Top-10, which reflect how many relevant examples are retrieved. As shown in Tab. II, our model achieves the best results in both retrieve tasks. Our model outperforms the second-best model in the image-to-text and text-to-image retrieval tasks by 3.9%, 5.88%, and 4.33%, and 19.75%, 14.50%, and 12% in terms of P@1, P@5, and P@10 metrics, respectively. This indicates that our model has fully learned the relationship between images and texts, achieving better alignment effects.
IV-C Ablation Study
| Method | CheXpert5x200 | RSNA | SIIM-ACR | |||
|---|---|---|---|---|---|---|
| Acc. | F1 | Acc. | F1 | Acc. | F1 | |
| Baseline | 57.50 | 55.97 | 43.09 | 31.01 | 58.40 | 57.85 |
| MLCE | 60.90 | 59.59 | 47.06 | 33.04 | 27.43 | 22.81 |
| EGF | 60.30 | 58.44 | 53.81 | 35.52 | 63.54 | 65.70 |
| EGM | 59.30 | 57.74 | 54.68 | 35.80 | 52.61 | 47.85 |
| Unified(Ours) | 60.50 | 58.48 | 57.81 | 36.70 | 63.62 | 61.46 |
| 1% Gaze | 59.00 | 56.68 | 40.39 | 29.74 | 57.65 | 57.09 |
| 5% Gaze | 59.00 | 56.76 | 52.94 | 35.13 | 59.33 | 58.62 |
| 10% Gaze | 58.70 | 56.32 | 44.19 | 31.57 | 58.40 | 57.85 |
| 30% Gaze | 59.70 | 58.80 | 51.46 | 34.61 | 58.76 | 58.46 |
| 50% Gaze | 59.60 | 58.83 | 58.01 | 36.82 | 61.38 | 58.85 |
To further validate the model’s performance, we conducted ablation experiments on the proposed EGF and EGM modules, while also assessing the impact of the proportion of eye-gaze data on the model results. As shown in the upper half of Tab. III, the first row represents our Baseline model, where we utilize the initialized weights from the MedCLIP model. The second row “MLCE” indicates that within our EGF module, the EGF loss is not further computed beyond the Eq. 5, instead, only the multi-label cross-entropy (MLCE) loss between the eye-gaze guided similarity matrix and the model’s output similarity matrix is calculated. The third row “EGF” utilizes the Eye-gaze Guided Fine-grained loss described in Eq. 6. The fourth row “EGM” indicates that the model is trained solely through the Eye-gaze Guide cross-model Mapping method. Finally, the fifth row presents our proposed EGMA model, which integrates the aforementioned modules guided by eye-gaze data. In Tab. III, it can be observed that the method using only gaze-guided MLCE loss significantly improves performance compared to the baseline on CheXpert 5x200 dataset, with a slight improvement on RSNA but a severe decline on SIIM-ACR dataset. However, models using EGF or EGM show significant improvements on SIIM-ACR. This indicates that while MLCE improves performance on some datasets, it simultaneously reduces the model’s generalization ability. Thus, relying solely on simple loss for similarity matrix is insufficient. In this work, by combining eye-gaze guided image-text relationships with fine-grained feature alignment, although the model’s performance slightly decreases on CheXpert 5x200, its overall generalization improves. Similarly, to enhance the model’s multi-modal alignment ability, introducing eye-gaze guided cross-modal mapping results in improved performance and generalization, with EGM achieving optimal performance on RSNA dataset. Finally, when optimizing both fine-grained alignment and cross-modal alignment using eye-gaze, the model achieves optimal performance on all three datasets, demonstrating further enhancement in generalization.
Numerous studies [25, 28, 13, 34] have demonstrated that training models using eye-gaze data can achieve comparable performance to models trained with fine-grained manual annotations. Meanwhile, the cost of collecting fine-grained manual annotations is significantly higher than that of collecting eye-gaze data. Therefore, incorporating eye-gaze into pre-training tasks is a feasible approach to enhancing model performance. To further validate the efficiency of our model using eye-gaze data, we conduct ablation experiments on the proportion of it in the training set. Our training dataset, MIMIC-EYE, consists of a total of 3695 samples. We perform five experiments using 1%, 5%, 10%, 30%, and 50% of the eye-gaze data, resulting in 37, 185, 370, 1108, and 1848 samples with prior information from radiologists, respectively. As shown in the lower part of Tab. III, the model’s performance on the CheXpert 5x200 dataset improved when trained with 1% of eye-gaze data. However, due to the limited data volume, the model’s performance on other datasets is inferior to the baseline. When increasing the eye-gaze data to 5%, the model shows significant improvements on all three datasets. With the continuous increase in eye-gaze data, the performance of the model also improves. Therefore, even with a small amount of eye-gaze data, our framework can effectively guide the model’s multi-modal processing capability, ensuring performance enhancement. This further illustrates the reliability and applicability of our model.
IV-D Visualization of Feature Representation
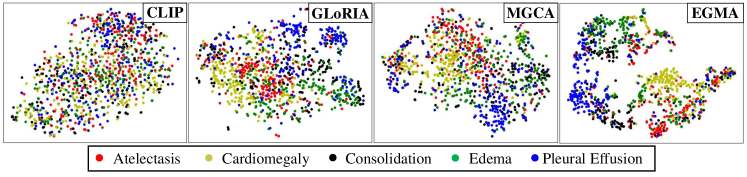
In Fig. 4, we visualize the feature representations of CLIP [1], GLoRIA [10], MGCA [11], and our EGMA model on images of CheXpert 5x200 dataset using the t-SNE [35]. It can be observed that our model exhibits better clustering representation. The CLIP model, which was not trained on medical data, is unable to effectively differentiate these diseases. Additionally, while the representation capability of GLoRIA and MGCA has improved noticeably, their clustering performance still inferior to our EGMA.
V Limitation
The collection of eye-gaze data has long been a challenging task in the medical domain. Previous collection systems [36, 37, 28] suffered from limitations such as restricting head movement of radiologists and the inability to manipulate medical images (e.g., adjust contrast, scale size), resulting in low efficiency in data collection. However, recent efforts [38, 13] have introduced more flexible collection systems, allowing radiologists to manipulate images as they would in their routine work, minimizing the impact of data collection on them. Therefore, we believe that eye-gaze data collection can achieve a certain scale in the future and effectively alleviate the pressure of manual annotation. Furthermore, due to the limited availability of multi-modal data containing eye-gaze information, we plan to compare it with fine-grained annotated datasets from more sources in the future to further validate the auxiliary role of eye-gaze data.
VI Conclusion
In this work, we reveal the significant role of radiologists’ eye-gaze data in multi-modal alignment and propose an Eye-gaze Guided Multi-modal Alignment framework called EGMA. Our framework first processes eye-gaze data into token-level relation matrices, then utilizes these matrices to optimize fine-grained alignment between image patches and text tokens. Furthermore, the framework integrates cross-modal mapping, leveraging eye-gaze data to guide feature mapping between images and texts bidirectionally, thereby enhancing the model’s ability to handle multi-modal data. We evaluate EGMA’s zero-shot capabilities on multiple datasets and observe significant performance improvements in classification and retrieval tasks. Additionally, we investigate the impact of eye-gaze data scale on performance, finding that even small amounts of eye-gaze data can enhance the model’s multi-modal alignment capabilities during pretraining. Our future work will continue to explore auxiliary information in eye-gaze data, such as temporal features, and further optimize their role in multi-modal feature alignment. We believe this work can serve as a valuable reference for the application of eye-gaze data in multi-modal frameworks and promote its development in the field of medical multi-modality.
References
- [1] A. Radford, J. W. Kim, C. Hallacy, A. Ramesh, G. Goh, S. Agarwal, G. Sastry, A. Askell, P. Mishkin, J. Clark et al., “Learning transferable visual models from natural language supervision,” in International conference on machine learning. PMLR, 2021, pp. 8748–8763.
- [2] L. H. Li, P. Zhang, H. Zhang, J. Yang, C. Li, Y. Zhong, L. Wang, L. Yuan, L. Zhang, J.-N. Hwang et al., “Grounded language-image pre-training,” in Proceedings of the IEEE/CVF Conference on Computer Vision and Pattern Recognition, 2022, pp. 10 965–10 975.
- [3] Y. Zhong, J. Yang, P. Zhang, C. Li, N. Codella, L. H. Li, L. Zhou, X. Dai, L. Yuan, Y. Li et al., “Regionclip: Region-based language-image pretraining,” in Proceedings of the IEEE/CVF Conference on Computer Vision and Pattern Recognition, 2022, pp. 16 793–16 803.
- [4] L. Yao, R. Huang, L. Hou, G. Lu, M. Niu, H. Xu, X. Liang, Z. Li, X. Jiang, and C. Xu, “Filip: Fine-grained interactive language-image pre-training,” in International Conference on Learning Representations, 2021.
- [5] A. E. Johnson, T. J. Pollard, N. R. Greenbaum, M. P. Lungren, C.-y. Deng, Y. Peng, Z. Lu, R. G. Mark, S. J. Berkowitz, and S. Horng, “Mimic-cxr-jpg, a large publicly available database of labeled chest radiographs,” arXiv preprint arXiv:1901.07042, 2019.
- [6] J. Irvin, P. Rajpurkar, M. Ko, Y. Yu, S. Ciurea-Ilcus, C. Chute, H. Marklund, B. Haghgoo, R. Ball, K. Shpanskaya et al., “Chexpert: A large chest radiograph dataset with uncertainty labels and expert comparison,” in Proceedings of the AAAI Conference on Artificial Intelligence, vol. 33, 2019, pp. 590–597.
- [7] W. Chen, X. Li, L. Shen, and Y. Yuan, “Fine-grained image-text alignment in medical imaging enables cyclic image-report generation,” arXiv preprint arXiv:2312.08078, 2023.
- [8] K. Zhang, Y. Yang, J. Yu, H. Jiang, J. Fan, Q. Huang, and W. Han, “Multi-task paired masking with alignment modeling for medical vision-language pre-training,” IEEE Transactions on Multimedia, 2023.
- [9] Z. Wang, Z. Wu, D. Agarwal, and J. Sun, “Medclip: Contrastive learning from unpaired medical images and text,” arXiv preprint arXiv:2210.10163, 2022.
- [10] S.-C. Huang, L. Shen, M. P. Lungren, and S. Yeung, “Gloria: A multimodal global-local representation learning framework for label-efficient medical image recognition,” in Proceedings of the IEEE/CVF International Conference on Computer Vision, 2021, pp. 3942–3951.
- [11] F. Wang, Y. Zhou, S. Wang, V. Vardhanabhuti, and L. Yu, “Multi-granularity cross-modal alignment for generalized medical visual representation learning,” arXiv preprint arXiv:2210.06044, 2022.
- [12] R. Geirhos, J.-H. Jacobsen, C. Michaelis, R. S. Zemel, W. Brendel, M. Bethge, and F. A. Wichmann, “Shortcut learning in deep neural networks,” Nature Machine Intelligence, vol. 2, no. 11, pp. 665–673, 2020.
- [13] C. Ma et al., “Eye-gaze-guided vision transformer for rectifying shortcut learning,” IEEE Transactions on Medical Imaging, vol. 42, no. 11, pp. 3384–3394, Nov 2023.
- [14] C. Hsieh, C. Ouyang, J. C. Nascimento, J. Pereira, J. Jorge, and C. Moreira, “Mimic-eye: Integrating mimic datasets with reflacx and eye gaze for multimodal deep learning applications,” 2023.
- [15] A. Vaswani, N. Shazeer, N. Parmar, J. Uszkoreit, L. Jones, A. N. Gomez, Ł. Kaiser, and I. Polosukhin, “Attention is all you need,” Advances in neural information processing systems, vol. 30, 2017.
- [16] J. Lu, D. Batra, D. Parikh, and S. Lee, “Vilbert: Pretraining task-agnostic visiolinguistic representations for vision-and-language tasks,” in Advances in Neural Information Processing Systems, 2019, pp. 13–23.
- [17] H. Tan and M. Bansal, “Lxmert: Learning cross-modality encoder representations from transformers,” in Proceedings of the 2019 Conference on Empirical Methods in Natural Language Processing and the 9th International Joint Conference on Natural Language Processing (EMNLP-IJCNLP). Association for Computational Linguistics, 2019.
- [18] Y. Zhang, H. Jiang, Y. Miura, C. D. Manning, and C. P. Langlotz, “Contrastive learning of medical visual representations from paired images and text,” in Machine Learning for Healthcare Conference. PMLR, 2022, pp. 2–25.
- [19] B. Boecking, N. Usuyama, S. Bannur, D. C. Castro, A. Schwaighofer, S. Hyland, M. Wetscherek, T. Naumann, A. Nori, J. Alvarez-Valle et al., “Making the most of text semantics to improve biomedical vision–language processing,” in Computer Vision–ECCV 2022: 17th European Conference, Tel Aviv, Israel, October 23–27, 2022, Proceedings, Part XXXVI. Springer, 2022, pp. 1–21.
- [20] C. Wu, X. Zhang, Y. Zhang, Y. Wang, and W. Xie, “Medklip: Medical knowledge enhanced language-image pre-training,” medRxiv, pp. 2023–01, 2023.
- [21] E. A. Krupinski, “Current perspectives in medical image perception,” Attention, Perception, & Psychophysics, vol. 72, no. 5, pp. 1205–1217, Jul 2010.
- [22] H. L. Kundel, C. F. Nodine, E. F. Conant, and S. P. Weinstein, “Holistic component of image perception in mammogram interpretation: Gaze-tracking study,” Radiology, vol. 242, no. 2, pp. 396–402, Feb 2007.
- [23] T. Drew, K. Evans, M. L.-H. Võ, F. L. Jacobson, and J. M. Wolfe, “Informatics in radiology: What can you see in a single glance and how might this guide visual search in medical images?” RadioGraphics, vol. 33, no. 1, pp. 263–274, Jan 2013.
- [24] E. M. Kok and H. Jarodzka, “Before your very eyes: The value and limitations of eye tracking in medical education,” Med. Educ., vol. 51, no. 1, pp. 114–122, Jan 2017.
- [25] N. Khosravan et al., “Gaze2segment: A pilot study for integrating eye-tracking technology into medical image segmentation,” in Medical Computer Vision and Bayesian and Graphical Models for Biomedical Imaging. Cham, Switzerland: Springer, 2016, pp. 94–104.
- [26] S. Mall, E. A. Krupinski, and C. R. Mello-Thoms, “Missed cancer and visual search of mammograms: What feature based machine-learning can tell us that deep-convolution learning cannot,” in Proc. SPIE, Mar 2019, pp. 281–287.
- [27] A. Karargyris et al., “Creation and validation of a chest x-ray dataset with eye-tracking and report dictation for ai development,” Sci. Data, vol. 8, no. 1, pp. 1–18, Mar 2021.
- [28] S. Wang, X. Ouyang, T. Liu, Q. Wang, and D. Shen, “Follow my eye: Using gaze to supervise computer-aided diagnosis,” IEEE Trans. Med. Imag., vol. 41, no. 7, pp. 1688–1698, Jul 2022.
- [29] Q. Men, C. Teng, L. Drukker et al., “Gaze-probe joint guidance with multi-task learning in obstetric ultrasound scanning,” Medical Image Analysis, vol. 90, p. 102981, 2023.
- [30] G. Shih, C. C. Wu, S. S. Halabi, M. D. Kohli, L. M. Prevedello, T. S. Cook, A. Sharma, J. K. Amorosa, V. Arteaga, M. Galperin-Aizenberg et al., “Augmenting the national institutes of health chest radiograph dataset with expert annotations of possible pneumonia,” Radiology: Artificial Intelligence, vol. 1, no. 1, 2019.
- [31] “SIIM-ACR pneumothorax segmentation,” 2020, [online] Available: https://www.kaggle.com/c/siim-acr-pneumothorax-segmentation.
- [32] Z. Liu, Y. Lin, Y. Cao, H. Hu, Y. Wei, Z. Zhang, S. Lin, and B. Guo, “Swin Transformer: Hierarchical vision transformer using shifted windows,” in Proceedings of the IEEE/CVF International Conference on Computer Vision, 2021, pp. 10 012–10 022.
- [33] E. Alsentzer, J. R. Murphy, W. Boag, W.-H. Weng, D. Jin, T. Naumann, and M. McDermott, “Publicly available clinical bert embeddings,” arXiv preprint arXiv:1904.03323, 2019.
- [34] C. Ma, L. Zhao, Y. Chen, L. Guo, T. Zhang, X. Hu, D. Shen, X. Jiang, and T. Liu, “Rectify vit shortcut learning by visual saliency,” IEEE Transactions on Neural Networks and Learning Systems, 2023.
- [35] L. Van der Maaten and G. Hinton, “Visualizing data using t-sne.” Journal of machine learning research, vol. 9, no. 11, 2008.
- [36] J. N. Stember, H. Celik, E. Krupinski, P. D. Chang, S. Mutasa, B. J. Wood, A. Lignelli, G. Moonis, L. Schwartz, S. Jambawalikar et al., “Eye tracking for deep learning segmentation using convolutional neural networks,” Journal of digital imaging, vol. 32, no. 4, pp. 597–604, 2019.
- [37] J. N. Stember, H. Celik, D. Gutman, N. Swinburne, R. Young, S. Eskreis-Winkler, A. Holodny, S. Jambawalikar, B. J. Wood, P. D. Chang et al., “Integrating eye tracking and speech recognition accurately annotates mr brain images for deep learning: proof of principle,” Radiology: Artificial Intelligence, vol. 3, no. 1, p. e200047, 2020.
- [38] N. Khosravan, H. Celik, B. Turkbey, E. C. Jones, B. Wood, and U. Bagci, “A collaborative computer aided diagnosis (c-cad) system with eye-tracking, sparse attentional model, and deep learning,” Medical image analysis, vol. 51, pp. 101–115, 2019.
- [39] A. Johnson, L. Bulgarelli, T. Pollard, S. Horng, L. A. Celi, and R. Mark, “Mimic-iv,” PhysioNet. Available online at: https://physionet. org/content/mimiciv/1.0/(accessed August 23, 2021), 2020.
- [40] D. M. Hansell, A. A. Bankier, H. MacMahon, T. C. McLoud, N. L. Muller, and J. Remy, “Fleischner society: glossary of terms for thoracic imaging,” Radiology, vol. 246, no. 3, pp. 697–722, 2008.
- [41] K. Saab, S. M. Hooper, N. S. Sohoni, J. Parmar, B. P. Pogatchnik, S. Wu, J. Dunnmon, H. Zhang, D. L. Rubin, and C. Ré, “Observational supervision for medical image classification using gaze data.” in Medical Image Computing and Computer-Assisted Intervention, 2021.
- [42] J. L. Kröger, O. H.-M. Lutz, and F. Müller, “What does your gaze reveal about you? on the privacy implications of eye tracking,” in IFIP International Summer School on Privacy and Identity Management. Springer, 2020, pp. 226–241.
- [43] C. Katsini, Y. Abdrabou, G. E. Raptis, M. Khamis, and F. Alt, “The role of eye gaze in security and privacy applications: Survey and future hci research directions,” in Proceedings of the 2020 CHI Conference on Human Factors in Computing Systems, 2020, pp. 1–21.
Appendix A Supplementary Materials
The supplementary document is organized as follows:
-
•
Additional Experiments: In Sec. B, we provide additional experiments of zero-shot classification task after continue pre-training using the backbones of other SOTA models in our EGMA framework.
-
•
Experimental Details: In Sec. C, we provide more experimental settings, including training parameters, detailed parameters of image and text encoders.
-
•
Dataset Descriptions: In Sec. D, we introduce the detailed information of the datasets used in this work.
-
•
Potential Negative Impact: In Sec. E, we discuss the potential negative impacts of this work.
Appendix B Additional Experiments
To further validate the generality of our framework, we utilize the encoders and pre-training weights provided by CLIP [1], GLoRIA [10], and MGCA [11] in our EGMA framework. Subsequently, we continue training on the MIMIC-EYE [14] dataset and present the zero-shot classification results on the CheXpert 5x200 [6], RSNA [30], and SIIM-ACR [31] datasets in Tab. IV.
| Method | CheXpert 5x200 [6] | RSNA [30] | SIIM-ACR [31] | |||
|---|---|---|---|---|---|---|
| Acc. | F1 | Acc. | F1 | Acc. | F1 | |
| CLIP [1] | 20.30(0.2) | 10.73(1.61) | 34.04(9.01) | 33.68(11.61) | 50.19(0.8) | 49.03(1.05) |
| GLoRIA [10] | 54.40(1.1) | 49.31(0.32) | 49.11(19.96) | 38.82(7.81) | 31.07(8.5) | 31.10(8.53) |
| MGCA [11] | 50.20(6.6) | 48.29(6.92) | 57.08(-3.75) | 40.40(-17.37) | 32.65(2.62) | 27.78(2.33) |
| EGMA(Ours) | 60.50 | 58.44 | 57.81 | 36.70 | 63.62 | 61.46 |
We present accuracy Accuracy and F1 score metrics on three datasets. The values in parentheses indicate the improvement over the baseline metrics (as shown in Table 1 of main manuscript). It can be observed that, all models show improvement after training with our EGMA framework, except for the decrease in metrics for the trained MGCA model on the RSNA dataset. For MGCA, when tested with its provided pre-trained weights, it performs the best on the RSNA dataset (as shown in Table 1 of main manuscript), but after training with the EGMA framework, its performance improves on CheXpert 5x200 and SIIM and decreases on RSNA dataset. This may reflect that the features extracted by MGCA on RSNA dataset are not truly disease-related features but rather shortcut features, indicating that the high baseline metrics were based on easily distinguishable shortcut features. Furthermore, after training with EGMA, the performance of other models significantly improves on all three datasets.
Appendix C Experimental Details
C-A Training Settings
In our study, all chest X-ray images and eye-gaze heatmaps are padded to square then scaled to . In the training process, we utilize the following image augmentations to the chest X-ray images: scale to images to ; color jittering with brightness and contrast ratios from [0.8, 1.2]; randomly change the contrast(). And our batch size is 100.
C-B Image/Text Encoder
Similar to [9], we use SwinTransformer [32] as the image encoder, BioClinicalBERT [33] as the text encoder. Specifically, we use a 4 stages SwinTransformer, including 2, 2, 6, and 2 SwinTransformer blocks. Other parameters are: patch size 4; window size 7. And we use a 6 layers BioClinicalBERT with 12 attention heads. In our EGMA framework, we add a linear projection layer after both the image encoder and text encoder to map the embeddings’ dimension to 512, and we use a learnable temperature in contrastive loss calculation initialized on 0.07.
Appendix D Dataset Descriptions
D-A MIMIC-EYE
The MIMIC-EYE [14] dataset includes a comprehensive range of patient information, including medical images and reports, clinical data, patient’s hospital journey, and eye-tracking data and audio of radiologists during diagnosis. The dataset comprises a total of 3689 images from the MIMIC-IV v1.0 dataset [39], each accompanied by transcripts text from audio and eye-tracking data of radiologists. In this work, we use this dataset as our training set. As described in Figure 3 of our main manuscript, we first segment the transcribed text at the sentence level. After determining the start and end time points for each sentence, we obtain eye-gaze information corresponding to the respective time intervals. Subsequently, we generate sentence-level heatmaps, which are then fed into our EGMA framework for training.
D-B CheXpert
CheXpert [6] is a large-scale public dataset for chest radiograph interpretation, developed by a team from Stanford University. The dataset comprises 224,316 chest radiographic images involving 65,240 patients, annotated for the presence of 14 common chest radiographic findings [40]. These annotations are categorized into three types: positive, negative, or uncertain. In our study, we follow [10] and [18], using two subsets of this dataset, namely CheXpert 5x200 and CheXpert 8x200, for our zero-shot classification and zero-shot retrieval testing tasks. The CheXpert 5x200 dataset [10] comprises five common chest diseases, , , , , and , each with 200 chest X-rays. In [10], a radiologist provided possible sub-types, severities, and locations for these five diseases. As depicted in Tab. V, all combinations of these three types of information form the text queries for CheXpert 5x200 dataset. In the zero-shot classification task, image embeddings are compared with the embeddings of these text queries, and the class with the highest similarity is assigned as the predicted classification for the image. The CheXpert 8x200 dataset [18] comprises eight categories, , , , , , , , and , each with 200 images. In [18], a radiologist expert was also invited to compose five expert queries for each category, used for image-text retrieval tasks. Specific queries are detailed in Tab. VI.
| Atelectasis | Consolidation | Pleural Effusion | |
| severity | increased | ||
| mild | improved | small | |
| minimal | apperance of | stable | |
| subtype | subsegmental atelectasis | bilateral consolidation | bilateral pleural effusion |
| linear atelectasis | reticular consolidation | subpulmonic pleural effusion | |
| trace atelectasis | patchy consolidation | bilateral pleural effusion | |
| bibasilar atelectasis | airspace consolidation | ||
| retrocardiac atelectasis | partial consolidation | ||
| bandlike atelectasis | |||
| location | at the mid lung zone | at the lower lung zone | left |
| at the upper lung zone | at the upper lung zone | right | |
| at the right lung zone | at the left lower lobe | tiny | |
| at the left lung zone | at the right lower lobe | ||
| at the lung bases | at the left upper lobe |
| Categories | Text Query |
|---|---|
| No Finding | The lungs are clear. |
| No abnormalities are present. | |
| The chest is normal. | |
| No clinically significant radiographic abormalities. | |
| No radiographically visible abnormalities in the chest. | |
| Cardiomegaly | The heart is mildly enlarged. |
| Cardiomegaly is present. | |
| The heart shadow is enlarged. | |
| The cardiac silhouette is enlarged. | |
| Cardiac enlargement is seen. | |
| Edema | Mild interstitial pulmonary edema is present. |
| The presence of hazy opacity suggests interstitial pulmonary edema. | |
| Moderate alveolar edema is present. | |
| Mild diffuse opacity likely represents pulmonary edema. | |
| Cardiogenic edema likely is present. | |
| Pneumonia | A consolidation at the base likely represents pneumonia. |
| Pneumonia is present. | |
| The presence of air bronchograms suggest pneumonia. | |
| A fluffy opacity suggests pneumonia. | |
| A pulmonary opacity with ill defined borders likely represents pneumonia. | |
| Atelectasis | Platelike opacity likely represents atelectasis. |
| Geometric opacity likely represents atelectasis. | |
| Atelectasis is present. | |
| Basilar opacity and volume loss is likely due to atelectasis. | |
| Patchy atelectasis is seen. | |
| Pneumothorax | An apical pneumothorax is present. |
| A basilar pneumothorax is seen. | |
| A medial pneumothorax is present adjacent to the heart. | |
| A lateral pleural line suggests pneumothorax. | |
| Pleural air is present. | |
| Pleural Effusion | A pleural effusion is present. |
| Blunting of the costophrenic angles represents pleural effusions. | |
| Trace pleural fluid is present. | |
| The pleural space is partially filled with fluid. | |
| Layering pleural effusions are present. | |
| Fracture | An angulated fracture is present. |
| An oblique radiolucent line suggests a fracture. | |
| A cortical step off indicates the presence of a fracture. | |
| A communuted displaced fracture is present. | |
| A fracture is present. |
D-C RSNA
The RSNA Pneumonia Detection Dataset [30], encompasses a comprehensive set of medical imaging data types, including X-rays, CT (Computed Tomography), and MRI (Magnetic Resonance Imaging) images. In this work, we utilized the stage 2 version of this dataset, comprising 29,700 chest X-ray images categorized into and positive category. Following [10], we allocated 15% of this dataset for our zero-shot classification testing set. And we utilize the text queries from the “no finding” and “Pneumonia” categories in the CheXpert 8x200 dataset as the text queries for zero-shot classification in this data.
D-D SIIM-ACR
The SIIM-ACR [31] dataset is a chest dataset used for classification and segmentation. It consists of 2379 images with pneumothorax and 8300 images without pneumothorax. In this study, we utilized a subset of the dataset filtered by Saab et al. [41] as the test data to evaluate the zero-shot classification performance of the model for pneumothorax disease. And we utilize the text queries from the “no finding” and “Pneumothorax” categories in the CheXpert 8x200 dataset as the text queries for zero-shot classification in this data.
Appendix E Potential Negative Impact
Our EGMA framework explores the feasibility of incorporating eye-gaze data from radiologists to assist in multi-modal feature alignment during model training, laying the foundation for the application of eye-gaze data in the medical domain. Although the eye-gaze data we used is publicly available and we have permission to use it, some studies [42, 43] have indicated that private information such as gender, age, and mental state of observers can be extracted from eye-gaze data. Therefore, privacy concerns have always been a focal point in eye-gaze data collection. Our suggestion is not to public the raw eye-gaze data but to release heatmaps generated from gaze points, significantly reducing the privacy risks associated with the data while still enabling its application in subsequent training strategy.