Transfer Learning for T-Cell Response Prediction
Abstract
Motivation: We study the prediction of T-cell response for specific given peptides, which could, among other applications, be a crucial step towards the development of personalized cancer vaccines. It is a challenging task due to limited, heterogeneous training data featuring a multi-domain structure; such data entail the danger of shortcut learning, where models learn general characteristics of peptide sources, such as the source organism, rather than specific peptide characteristics associated with T-cell response.
Results: Using a transformer model for T-cell response prediction, we show that the danger of inflated predictive performance is not merely theoretical but occurs in practice.
Consequently, we propose a domain-aware evaluation scheme.
We then study different transfer learning techniques to deal with the multi-domain structure and shortcut learning. We demonstrate a per-source fine tuning approach to be effective across a wide range of peptide sources and further show that our final model outperforms existing state-of-the-art approaches for predicting T-cell responses for human peptides.
Availability: Source code for all studies, compiled data, and final model are available under github.com/JosuaStadelmaier/T-cell-response-prediction
Contact: josua.stadelmaier@uni-tuebingen.de
1 Introduction
The human immune system consists of humoral and cell-mediated mechanisms, with T cells playing a significant role in the latter. T cells recognize and eliminate cancerous or infected cells by detecting peptides presented on the cell surface by major histocompatibility complex (MHC) molecules, which can be grouped into two classes, MHC I and MHC II (Murphy and Weaver, 2017).
Peptide-based vaccines are a promising approach for the personalized treatment of cancer (Sahin and Türeci, 2018) and might allow more precise vaccines against infectious diseases (Heitmann et al., 2022). Such vaccines can be developed by selecting peptides that are specific to a pathogen or tumor. Since only a limited number of peptides can be included in the vaccine, their selection should be based on their probability of inducing a T-cell response. Predicting this probability is an important task in the development of peptide vaccines (Sahin and Türeci, 2018).
From a computational perspective, this task can be separated into two sub-tasks: first predicting whether a peptide is presented on the cell surface by an MHC molecule and afterwards predicting whether a presented peptide induces a T-cell response. For the first task, a large amount of available experimental data has led to accurate machine learning-based predictions (Reynisson et al., 2020; O’Donnell et al., 2020; Cheng et al., 2021). The second task can, despite some attempts (Gfeller et al., 2023; Dhanda et al., 2018), still be considered as an open problem, in part due to fewer experimental data from T-cell assays (Vita et al., 2018).
Aside from small sample sizes, another challenge arises from peptides in T-cell response data originating from different sources, such as viruses, bacteria, or human proteins. Moreover, peptides feature patterns that are specific to the allele of the MHC molecule they are presented by (Rammensee et al., 1995). Both factors lead to data heterogeneity, which is either unaccounted for by existing approaches (Dhanda et al., 2018; Ogishi and Yotsuyanagi, 2019) or handled by limiting the model to selected MHC alleles and considering small peptides, such that positions that are affected by MHC allele-specific patterns can be identified (Gfeller et al., 2023; Calis et al., 2013).
To leverage all the available data, we investigate more flexible approaches that do not limit the selection of peptides based on their source, length, and presenting MHC allele. Based on our data analysis, we show how the heterogeneity of the resulting data set can be viewed as a multi-domain structure, which motivates the application of different transfer learning techniques in combination with the flexible transformer architecture (Vaswani et al., 2017). We further investigate how the prediction performance on individual domains is affected by including data from the other domains in the training process, where improved performance is denoted as positive transfer and reduced performance as negative transfer (Rosenstein, 2005).
For all empirical studies it is critical to keep in mind that having several underlying domains with varying fractions of positives entails the risk of shortcut learning (Geirhos et al., 2020), that is, using domain-specific features to classify peptides based on their domain identity instead of T-cell response-specific patterns. To obtain shortcut-invariant model performance estimates, we thus propose a domain-aware evaluation scheme.
Our results indicate that shortcuts based on peptide sources and MHC alleles are indeed learned by the transformer and lead to inflated performance estimates when the domain-aware evaluation is not applied. We further observe that per-source fine-tuning is effective in enabling positive transfer across a wide range of peptide sources and show that our final model outperforms existing state-of-the-art approaches for predicting T-cell responses for human peptides.
2 Materials and Methods
We first describe the T-cell response data set construction and analyze the domain structure in the data. Then follows an introduction of the baseline transformer model for T-cell response prediction. To account for the identified domain structure, we describe two transfer learning model variants and a special evaluation scheme.
2.1 Construction of a T-cell response data set
We use the Immune Epitope Database111https://www.iedb.org (IEDB) (Vita et al., 2018) to construct a T-cell response data set. A data point consists of the amino acid sequence of the peptide, a binary label representing the T-cell response in the form of IFN, the allele of the MHC molecule that presented the peptide to a T cell, the class of the MHC allele (I or II), and the source of the peptide. The source can be an organism or a virus.
For some peptides in the data set, the MHC alleles are not specified in the IEDB. Additionally, the MHC allele information is incomplete since one peptide can often be presented on several MHC alleles. However, not all combinations of peptides and MHC alleles are tested. Since the existing MHC information in the IEDB is mostly based on predictions, we use existing models to obtain a list of MHC alleles for each peptide in a consistent way. NetMHCpan 4.1 (Reynisson et al., 2020) serves as a predictor for peptides with MHC class I alleles and NetMHCIIpan 4.0 (Reynisson et al., 2020) for peptides with MHC class II alleles. We select the 100 most frequent alleles, which account for 98.7% of peptide-MHC combinations in the IEDB data set, and use all MHC class-matched combinations of peptides and MHC alleles as input for the two predictors.
We assign an allele to a peptide if it is predicted to be a weak binder. NetMHCpan 4.1 and NetMHCIIpan 4.0 define a peptide as weak binder if its prediction score is within the top 2% of prediction scores for random natural peptides. Peptides that are predicted to not bind to any of the alleles get assigned a default allele for the respective MHC class. This applies to 29.7% of class I peptides and 66.5% of class II peptides. Since the MHC alleles are only relevant for us to identify MHC allele-specific patterns in peptides, the relatively large fraction of default alleles is not problematic because peptides with a default allele likely have no strong allele-specific patterns. Table 1 shows the resulting statistics about the MHC classes, T-cell response labels, and peptide lengths of the T-cell response data.
| MHC alleles | Positives | Negatives | Pep. lengths | |
|---|---|---|---|---|
| MHC class I | 54 | 4,460 | 12,697 | 8-15 |
| MHC class II | 46 | 10,247 | 8207 | 9-25 |
| Total | 100 | 14,707 | 20,904 | 8-25 |
2.2 Domain structure in T-cell response data
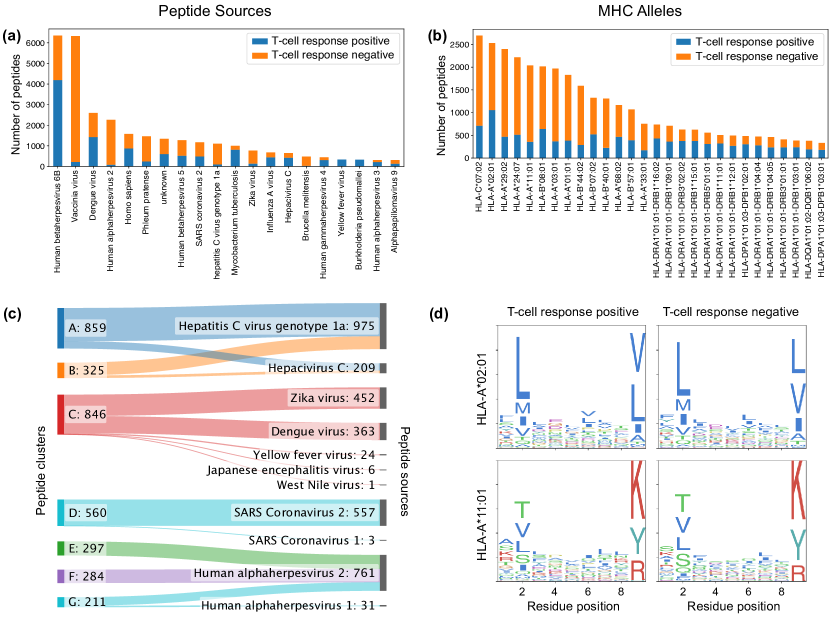
Based on the data analysis presented in Figure 1, we identify two domain structures in the T-cell response data set, peptide sources (left column) and MHC alleles (right column). The next paragraphs describe these two domain structures in more detail.
Figure 1a shows that the peptides in the T-cell response data set originate from several sources and that the fraction of T-cell response positives varies strongly between sources. When studying T-cell responses for one peptide source, a protein of that source is often screened by testing a set of largely overlapping peptides that originate from the protein. These overlaps lead to clusters of peptides that make peptides within one source more similar than peptides from a different source.
Motivated by the size of the binding core in peptides (Nielsen et al., 2007), we define that peptides correspond to the same cluster if they share a sub-sequence of length nine. Using this definition, the Sankey diagram in Figure 1c confirms that the seven largest peptide clusters typically consist of peptides from only a few sources.
In analogy to the distribution of peptide sources in Figure 1a, Figure 1b shows the distribution of MHC alleles. As peptides can be associated with several MHC alleles, we show a subset of MHC alleles that together cover a large fraction of peptides. Compared to peptide sources, there is a lower variability in the fraction of T-cell response positives between MHC alleles.
The distinct binding motifs of MHC alleles (Rammensee et al., 1995) introduce an MHC-based domain structure in T-cell response data. We visualize the sequence logos for two exemplary MHC alleles and peptides of length nine, separately for T-cell response positives and negatives, in Figure 1d. At the anchor positions two and nine, there are obvious differences between the MHC alleles in the sequence logos. However, comparing sequence logos between T-cell response positives and negatives does not reveal obvious differences.
Since studies of T-cell responses often focus on just one peptide source and one MHC class or only consider peptides that are presented on certain MHC alleles, the joint distribution of peptide sources and MHC alleles is not uniform (see Supplement S1). Consequently, peptide sources can also feature the patterns of the MHC alleles with which they co-occur.
2.3 Transformer model
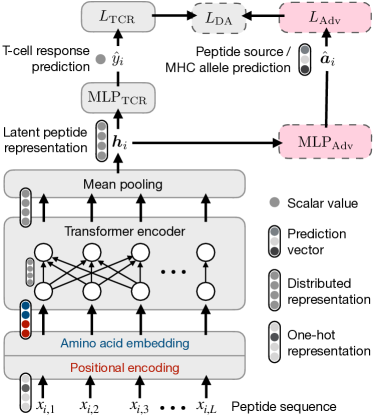
We use the transformer architecture (Vaswani et al., 2017), as shown in Figure 2, to capture T-cell response-specific patterns in peptide sequences. To apply the transformer, we formalize the data set to consist of data points , where is the -th peptide sequence with each of the representing one of 20 amino acids or a padding token. The padding token allows the sequences to all have the same length , which corresponds to the maximal peptide length. We denote the binary label indicating whether the peptide leads to a T-cell response with .
Our model gets a one-hot representation of the peptide sequence as input. Then the model maps each amino acid or padding token of the peptide sequence to a learned embedding . To tell the transformer the positions at which the amino acids occur in the peptide, we define a learned embedding for each position . Additionally, we use positional encodings based on sine functions with varying frequencies (see Vaswani et al. (2017) for more details). We then add the two variants of positional vectors and concatenate them with the amino acid embeddings to obtain a vector representation for each element of the peptide sequence .
The resulting sequence of vector representations is the input of a transformer encoder layer, which updates the vector representations based on interactions between amino acids using a mechanism called multi-head self-attention (see Vaswani et al. (2017) for more details).
As the output of the transformer encoder is again a sequence of vector representations, we apply mean pooling to obtain a single vector , which is a latent representation of the -th peptide. In a similar way as described here, the transformer architecture has been used in earlier work to learn representations of peptides (Cheng et al., 2021) and proteins (Rao et al., 2019).
Using the latent peptide representation as input, a multilayer perceptron (MLP) with one hidden layer of size computes the T-cell response prediction .
All described components are trained to minimize the loss
| (1) |
with the binary cross-entropy between T-cell response labels and predictions being defined as
| (2) |
2.4 Adversarial domain adaptation
As described in Section 2.2, the T-cell response data set has an underlying domain structure of peptide sources and MHC alleles. This heterogeneity suggests that predictions might be biased by the class imbalance (see Figures 1a 1b). Additionally, domain-specific features might be used by a machine learning model instead of features that generalize over MHC alleles and peptide sources.
To address these issues, we apply a transfer learning technique called adversarial domain adaptation (Tzeng et al., 2017), to encourage the model to perform predictions independently of the domain identity of a peptide. Unlike the typical domain adaptation setting with a large amount of training data for a source domain and no or little training data for the target domain (Pan and Yang, 2009), in our setting, there are more than two domains and all domains can act as target and source domain at the same time. We use a variant of adversarial domain adaptation that is adapted to our setting. This variant is very similar to multi-domain adversarial learning (Schoenauer Sebag et al., 2019).
The model components for implementing adversarial domain adaptation are marked with dashed borders in Figure 2. To encourage domain invariance, we define a new training objective:
| (3) |
As before, minimizing is necessary for performing the main task, T-cell response prediction. The term measures how much information about the domain identities is encoded in the latent peptide representations . The strength of domain adaptation is determined by the hyperparameter . In the following, we explain adversarial domain adaptation considering peptide sources as domains. To capture how much information about peptide sources is encoded in , we train an adversarial with input and output to predict how likely peptide originates from each of the peptide sources.
is trained concurrently with the other parts of the T-cell response model using the following multi-label classification objective , where are the ground truth peptide source labels:
| (4) |
While the parameters of are trained to minimize the peptide source classification error, is re-used with a negative sign in . This means that latent peptide representations produced by the transformer are encouraged to confuse by making latent representations from different domains more similar, suggesting the name adversarial domain adaptation. The above explanations for peptide sources can be directly generalized to MHC alleles.
2.5 Per-source fine-tuning
When one machine learning model is trained on data from several domains, the performance on individual domains can be reduced compared to models that are trained on data from one domain only. Such instances of negative transfer are more likely to occur if domains are too dissimilar (Rosenstein, 2005). Negative transfer is also possible when applying adversarial domain adaptation because there is only one model for all domains. Additionally, data points from all domains are encouraged to be represented similarly in the model. To avoid negative transfer, a transfer learning technique is needed that provides more flexibility to adapt to individual domains, while still allowing positive transfer from other domains.
As an alternative to adversarial domain adaptation, we propose to pre-train a T-cell response model until convergence on all domains and then continue training on only one domain. This second step is also called fine-tuning. We allow all model parameters to be updated during fine-tuning such that the model has the necessary flexibility to correct instances of negative transfer. This transfer learning technique is commonly applied in combination with the transformer and proteins (Rao et al., 2019) or peptides (Cheng et al., 2021).
2.6 Bag of amino acids baseline
To allow a direct comparison of our proposed transformer-based models to a simpler model that is trained on the same data set, we define the bag of amino acids (Bag-Of-AA) baseline, which can be seen as a simplified version of PRIME (Gfeller et al., 2023).
The Bag-Of-AA baseline counts how often each of the 20 amino acids occurs in a given peptide and puts the frequencies into a 20-dimensional vector. An MLP with one hidden layer receives these vectors as input and is trained to predict the T-cell responses. As with the transformer models, we use the binary cross-entropy as training objective. The Bag-Of-AA model does not consider positional information, that is, it does not see at which positions the amino acids occur in the peptide. The amino acid frequencies allow the model to capture possible preferences for certain amino acids that T cells might have.
2.7 Model evaluation
We measure the model performance with the area under the ROC curve (AUC) based on the ground-truth T-cell response labels and the predictions .
We partition the data set into five disjoint subsets , and then permute and re-combine them into training, validation, and test sets. This setting ensures that the partitions are large enough to each have a representative distribution of the domains.
Within a peptide cluster, sequences can be nearly identical (cf. Section 2.2). Splitting the data completely at random could lead to such near identical sequences being distributed among training, validation, and test sets. This can potentially cause inflated generalization estimates. To prevent this, we assign peptide clusters as a whole (instead of single peptides) to a randomly selected partition (Nielsen et al., 2007).
Throughout this manuscript, we carry out all method development and hyperparameter tuning on the union of the first four data subsets. Using as input for a four-fold cross validation, we refer to the resulting mean AUC over the four folds as validation performance. This leaves as unseen, independent test data set for evaluating generalization capabilities in the final study, where we refer to the evaluation of the predictions on while training on as test performance.
In order to obtain an uncertainty quantification of the test performance, we additionally carry out a test evaluation for each of the other subsets for . Training on always involves the re-tuning of numeric hyperparameters via four-fold cross-validation, so the procedure can be regarded as a nested cross validation. We note, however, that more general choices regarding the model architecture and the range of tunable hyperparameters originate from the the primary validation study carried out on .
2.8 Detection of shortcut learning
The domain structure with different T-cell response positive/negative ratios per domain (see Section 2.2) suggests that shortcuts can be learned to predict T-cell responses by first picking up domain-specific features to identify domains and then outputting the majority class within the domain.
In our analysis, we evaluate model performance to account for such shortcuts. In particular, we group the evaluation data into subsets such that each subset contains peptides from only one combination of peptide source and MHC allele. We further weight by subset size and peptide:MHC assignments to ensure each peptide contributes equally to the overall performance (see Supplement S2 for details).
Since this evaluation setting ensures that performance estimates are not inflated by the use of shortcuts, we refer to this strategy as shortcut adjusted evaluation.
3 Results
We first evaluate the practical impact of shortcut learning and study the behavior of the adversarial domain adaptation method. Afterwards, we demonstrate the effectiveness of the per-source fine-tuning. Finally, we evaluate that method on independent test data and compare with existing models from the literature. We provide details on the implementation and the model hyperparameters in the Supplement S3.
3.1 Shortcut learning in practice
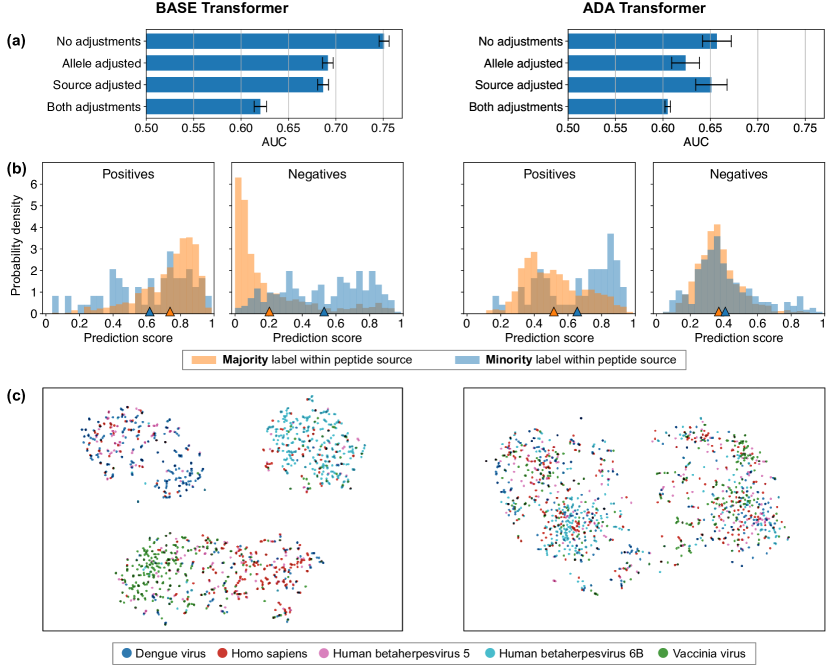
We investigate the prevalence of shortcut learning in T-cell response prediction models trained on the full T-cell response data set, that is, on all peptide sources and MHC alleles (MHC I+II) combined. For this purpose, we use the shortcut detection method described in Section 2.8. In order to study whether shortcut learning can be prevented by encouraging domain invariance in the model architecture and whether this constraint could serve as regularizer to improve the model performance, we compare two different models: BASE-T, the baseline transformer of Section 2.3, and ADA-T, the adversarial domain adaptation approach of Section 2.4 with domain adaptation strength set to . The results for both models are summarized side by side in Figure 3.
The prediction performance in terms of AUC with and without shortcut adjustment in the evaluation is shown in Figure 3a. For BASE-T we observe that the shortcut adjustment w.r.t. alleles and peptide sources leads to an absolute AUC decrease of 0.06 when applied separately, and a further decrease by 0.07 when combined, which indicates that the model learns shortcuts based on both MHC allele-specific and peptide source-specific features. In contrast, for ADA-T the performance without adjustments and with source shortcut adjustment is nearly identical, which demonstrates that adversarial domain adaptation is effective in reducing shortcut learning based on peptide sources. When adjusting for both possible shortcuts in the evaluation, ADA-T leads to slightly reduced predictive performance compared to BASE-T, though.
To verify that shortcuts are actually based on the label imbalance within different domains (see Figures 1a and 1b), we plot the prediction scores of peptides from the two most frequent peptide sources, Human betaherpesvirus 6B (mostly positives) and Vaccinia virus (mostly negatives) as histograms, separated according to the true response labels in Figure 3b. For BASE-T, we find that the distribution of prediction scores is always shifted towards the majority class within the peptide source: Human betaherpesvirus 6B peptides with a positive label tend to get higher prediction scores than Vaccinia virus peptides with a positive label. For negatives, the Vaccinia virus peptides get lower prediction scores than Human betaherpesvirus 6B peptides. ADA-T overcorrects the bias towards the majority label within sources for the T-cell response positives, as the Vaccinia virus peptides (mostly negatives) now get even higher prediction scores than Human betaherpesvirus 6B peptides. For the T-cell response negatives, the distributions of prediction scores corresponding to the two peptide sources are now well aligned, indicating that no source shortcuts are used. These findings may also explain the slight drop in overall prediction accuracy of ADA-T observed in Figure 3a, as the number of correct predictions in the minority classes are increased at the expense of additional errors in the majority classes.
In addition to the analysis of model outputs, we investigate the internal representations of the models regarding indications of shortcut learning and the effect of ADA-T. To use shortcuts based on peptide sources, we expect BASE-T to learn source-related features in the latent peptide representations .
To test whether this is the case, we use t-stochastic neighborhood embedding (t-SNE) by Van der Maaten and Hinton (2008) to project the high-dimensional latent peptide representations to two-dimensional points. We here use the t-SNE implementation of the TensorFlow embedding projector with the default parameters for learning rate and perplexity.
The cluster structure in the t-SNE plot of latent peptide representations in Figure 3c provides indeed further evidence that features related to peptide sources are learned by BASE-T. For example, the Human betaherpesvirus 6B peptide representations (cyan) concentrate mostly in the top right corner while the Vaccinia virus peptides (green) can be found mostly in the lower left corner. Conversely, the t-SNE plot is less clustered for ADA-T, demonstrating that source-related features are removed from the peptide representations.
3.2 Negative transfer between domains
Next, we investigate why applying adversarial domain adaptation to peptide sources does not improve performance despite encouraging transfer between the sources. One hypothesis is that peptide sequences from different sources are too dissimilar, which leads to negative transfer.
To test this hypothesis, we compare BASE-T, being trained all peptide sources and MHC alleles (multi-domain setting), with a combination of BASE-T models that eliminate transfer between sources and alleles respectively. All evaluations apply the full shortcut adjustment.
In a per-source setting, we train separate BASE-T models for every peptide source, each of which contains peptides from several MHC alleles. To make the performance of the models in the per-source setting directly comparable to the multi-domain setting, we first aggregate the predictions for the each source (performed by different models) into one data set again. Then we apply the evaluation on groups of peptide source/MHC allele combinations (see Section 2.8) exactly as in the multi-domain setting. This evaluation also ensures that only predictions coming from the same per-source model are compared to each other because AUC values are computed per peptide source/MHC allele combination. Conversely, the per-allele setting is a combination of separate BASE-T models for each MHC allele, each of which is trained on data from several peptide sources.
The corresponding validation study (Supplement S4) shows that the AUC of the multi-domain model is reduced by 0.05 compared to the per-source models and by 0.02 compared to the per-allele models, confirming our hypothesis that there is negative transfer between peptide sources and, to a smaller degree, between MHC alleles.
3.3 Improved predictions by per-source fine-tuning
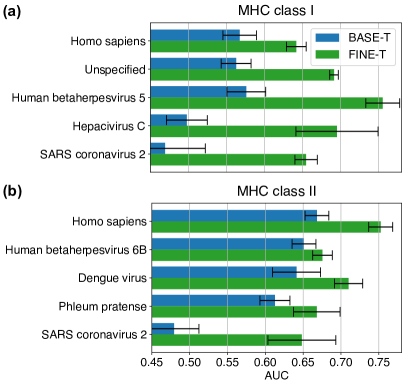
Since negative transfer mainly occurs between sources and since per-source models achieve the highest accuracy in predicting T-cell responses, we explore another transfer learning technique. We initially train BASE-T on all sources and subsequently fine-tune per-source models with model parameters initialized using BASE-T. With this per-source fine-tuning approach, which we refer to as FINE-T, we aim to combine the advantages of per-source models with the possibility of positive transfer between sources. Since some peptide sources have only relatively few data points, we limit the experiment to the five most frequent peptide sources. The results are shown, separated according to MHC class, in Figure 4.
FINE-T achieves higher AUC values than BASE-T for all ten source/MHC combinations. We also observe that the difference is stronger for MHC I peptides than for MHC II peptides, which may be due to more room for improvement as BASE-T performs worse for MHC I compared to MHC II peptides. We also studied the performance of separate per-source models without fine-tuning. The resulting AUC values (see Supplement S5) are overall in between BASE-T and FINE-T, suggesting that the combination of both ideas, per source models and fine-tuning, are responsible for the superior performance of FINE-T.
By generating many random permutations of the T-cell response labels, we also verify that FINE-T learns a signal that cannot be explained by random structure in the data (see Supplement S6).
3.4 Comparison to other tools for human peptides
T-cell response predictions for peptides from human proteins are of special interest for the development of personalized cancer vaccines since neo-antigens also originate from human proteins (Lang et al., 2022). Thus, we focus our analysis on human peptides and compare the performance of FINE-T, which was the best model in the validation study, to existing pre-trained models from the literature.
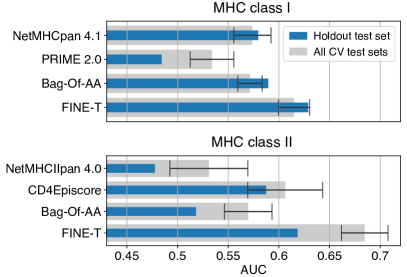
NetMHCpan 4.1 and NetMHCIIpan 4.0 (Reynisson et al., 2020) have been trained to predict the presentation of peptides on MHC molecules. Despite not being trained on T-cell response data, we include these models since they are commonly used in the context of personalized cancer vaccines. PRIME 2.0 (Gfeller et al., 2023) has been trained on T-cell response data with MHC I neo-antigens, whereas CD4Episcore (Dhanda et al., 2018) has been trained on MHC II T-cell response data from several peptide sources. Since the training data for all pre-trained models deviates from our training data, we also include the Bag-Of-AA baseline, trained on the same data set as FINE-T, in the comparison. In contrast to all previous study, we now train a model on the union of the first four data subsets, and evaluate on the previously unused data subset . In addition, we also carry out a full nested cross validation. The results are shown in Figure 5.
For MHC I peptides, FINE-T achieves with a value of 0.615 the highest AUC among all models. PRIME 2.0 yields the lowest performance, which is likely due to the differences in the training data. For MHC II peptides, FINE-T also outperforms the existing approaches, and the AUC is, with a value 0.68 even slightly better than in the validation study. While Paul et al. (2015) have observed that combining MHC binding predictions from several alleles has a predictive value for immunogenicity, on the data set we use this applies only to MHC I (NetMHCpan 4.1) but not to MHC II (NetMHCIIpan 4.0). The large performance difference between the Bag-Of-AA model and FINE-T suggests that the possibility to use positional information of amino acids in the peptide sequence is indeed beneficial, and more so for MHC class II compared to MHC class I.
4 Discussion
Predicting T-cell responses to peptides is a challenging problem not only due to the limited sample size, but also since the data features a multi-domain structure, which entails, as illustrated in this article, the danger of shortcut learning.
To ensure that performance estimates are not inflated by the use of shortcuts, we have defined a domain-aware evaluation scheme. We have then demonstrated that shortcut learning can be effectively reduced by applying adversarial domain adaptation. Shortcut reduction did, however, not directly improve predictive performance, which is likely due to large domain differences and negative transfer between domains.
To enable positive while preventing negative transfer, we have pre-trained a transformer model on all data domains and then created fine-tuned models for individual domains. This approach improved predictive performance considerably and outperformed several existing methods, although the overall performance of all models still leaves room for improvement.
Since modeling the binding of individual T-cell receptors (TCRs) and peptide:MHC complexes is difficult and does not directly capture the T-cell response (Hudson et al., 2023; Yin et al., 2022; Fischer et al., 2020), many prediction models, including ours, assume general patterns in peptide sequences that make peptide recognition more likely in many individuals (Wells et al., 2020; Ogishi and Yotsuyanagi, 2019). This assumption is based on the public TCR repertoire concept of antigen-recognizing TCRs being likely shared among individuals (Chen et al., 2017).
Once more data of paired TCR and peptide-MHC complexes become available and protein structure predictions are further improved, the public TCR repertoire assumption might be relaxed. Modeling the interaction between individual TCRs and peptide-MHC complexes has the potential to improve T-cell response prediction in principle.
In a broader context, the present study demonstrates the importance of knowing possibly hidden underlying structures in the training data for two reasons. First, the risk of shortcut learning is well known in domains like image recognition or natural language processing (Geirhos et al., 2020). However, in biological sequence data, invalid features might be harder to discover since they can be encoded in more complex patterns spanning only specific positions in sequences, as it is for anchor positions in peptides (see Figure 1b). Second, knowing about the heterogeneity of a data set and viewing it as a multi-domain structure can motivate the use of transfer learning techniques. However, as we have observed with ADA-T and as it is also reported for other tasks such as classification of images, texts, or molecules (Sagawa et al., 2022), transfer learning methods like adversarial domain adaptation can sometimes decrease the classification performance. Similarly, caution has to be applied in the data selection process since increasing a data set at the cost of more heterogeneity can also lead to instances of negative transfer.
In a similar direction it is noteworthy that to this date, all approaches for T-cell response prediction use their own specific data selection criteria, differing, for example, in the selected assays, measured cytokines, or the considered peptide sources (Müller et al., 2023; Gfeller et al., 2023; Dhanda et al., 2018). We think that a benchmark data set that is well characterized in terms of its underlying structure, together with an evaluation scheme that is invariant to possible instances of shortcut learning, would be beneficial to facilitate objective development and a fair comparison of T-cell response prediction methods.
Funding
This work used the computational infrastructure of the ’Training Center Machine Learning (TCML), Tübingen’ grant number 01IS17054.
References
- Calis et al. (2013) Calis, J. J. et al. (2013). Properties of MHC class I presented peptides that enhance immunogenicity. PLoS computational biology, 9(10).
- Chen et al. (2017) Chen, G. et al. (2017). Sequence and structural analyses reveal distinct and highly diverse human CD8+ TCR repertoires to immunodominant viral antigens. Cell Reports, 19(3), 569–583.
- Cheng et al. (2021) Cheng, J. et al. (2021). BERTMHC: improved MHC–peptide class II interaction prediction with transformer and multiple instance learning. Bioinformatics.
- Dhanda et al. (2018) Dhanda, S. K. et al. (2018). Predicting HLA CD4 immunogenicity in human populations. Frontiers in Immunology, 9.
- Fischer et al. (2020) Fischer, D. S. et al. (2020). Predicting antigen specificity of single T cells based on TCR CDR 3 regions. Molecular systems biology, 16(8), e9416.
- Geirhos et al. (2020) Geirhos, R. et al. (2020). Shortcut learning in deep neural networks. Nature Machine Intelligence, 2(11), 665–673.
- Gfeller et al. (2023) Gfeller, D. et al. (2023). Improved predictions of antigen presentation and TCR recognition with MixMHCpred2.2 and PRIME2.0 reveal potent SARS-CoV-2 CD8+ T-cell epitopes. Cell Systems, 14(1), 72–83.e5.
- Heitmann et al. (2022) Heitmann, J. S. et al. (2022). A COVID-19 peptide vaccine for the induction of SARS-CoV-2 T cell immunity. Nature, 601(7894), 617–622.
- Hudson et al. (2023) Hudson, D. et al. (2023). Can we predict T cell specificity with digital biology and machine learning? Nature Reviews Immunology, pages 1–11.
- Lang et al. (2022) Lang, F. et al. (2022). Identification of neoantigens for individualized therapeutic cancer vaccines. Nature Reviews Drug Discovery, 21(4), 261–282.
- Müller et al. (2023) Müller, M. et al. (2023). Machine learning methods and harmonized datasets improve immunogenic neoantigen prediction. Immunity.
- Murphy and Weaver (2017) Murphy, K. M. and Weaver, C. (2017). Janeway’s immunobiology; 9th edition. Garland Science, Taylor Francis Group, New York.
- Nielsen et al. (2007) Nielsen, M. et al. (2007). Prediction of MHC class II binding affinity using SMM-align, a novel stabilization matrix alignment method. BMC Bioinformatics, 8(1).
- Ogishi and Yotsuyanagi (2019) Ogishi, M. and Yotsuyanagi, H. (2019). Quantitative prediction of the landscape of T cell epitope immunogenicity in sequence space. Frontiers in immunology, 10, 827.
- O’Donnell et al. (2020) O’Donnell, T. J. et al. (2020). MHCflurry 2.0: Improved pan-allele prediction of MHC class I-presented peptides by incorporating antigen processing. Cell Systems, 11(1), 42–48.e7.
- Pan and Yang (2009) Pan, S. J. and Yang, Q. (2009). A survey on transfer learning. IEEE Transactions on knowledge and data engineering, 22(10), 1345–1359.
- Paul et al. (2015) Paul, S. et al. (2015). Development and validation of a broad scheme for prediction of HLA class II restricted T cell epitopes. Journal of immunological methods, 422, 28–34.
- Rammensee et al. (1995) Rammensee, H.-G. et al. (1995). MHC ligands and peptide motifs: first listing. Immunogenetics, 41(4), 178–228.
- Rao et al. (2019) Rao, R. et al. (2019). Evaluating protein transfer learning with TAPE. Advances in neural information processing systems, 32.
- Reynisson et al. (2020) Reynisson, B. et al. (2020). NetMHCpan-4.1 and NetMHCIIpan-4.0: improved predictions of MHC antigen presentation by concurrent motif deconvolution and integration of MS MHC eluted ligand data. Nucleic Acids Research, 48(W1), W449–W454.
- Rosenstein (2005) Rosenstein, M. T. (2005). To transfer or not to transfer. In NIPS 2005.
- Sagawa et al. (2022) Sagawa, S. et al. (2022). Extending the WILDS benchmark for unsupervised adaptation. In International Conference on Learning Representations.
- Sahin and Türeci (2018) Sahin, U. and Türeci, Ö. (2018). Personalized vaccines for cancer immunotherapy. Science, 359(6382), 1355–1360.
- Schoenauer Sebag et al. (2019) Schoenauer Sebag, A. et al. (2019). Multi-domain adversarial learning. In ICLR 2019 - Seventh annual International Conference on Learning Representations, New Orleans, United States.
- Tzeng et al. (2017) Tzeng, E. et al. (2017). Adversarial discriminative domain adaptation. In Proceedings of the IEEE conference on computer vision and pattern recognition, pages 7167–7176.
- Van der Maaten and Hinton (2008) Van der Maaten, L. and Hinton, G. (2008). Visualizing data using t-SNE. Journal of machine learning research, 9(11).
- Vaswani et al. (2017) Vaswani, A. et al. (2017). Attention is all you need. In Advances in Neural Information Processing Systems, volume 30.
- Vita et al. (2018) Vita, R. et al. (2018). The Immune Epitope Database (IEDB): 2018 update. Nucleic Acids Research, 47(D1), D339–D343.
- Wells et al. (2020) Wells, D. K. et al. (2020). Key parameters of tumor epitope immunogenicity revealed through a consortium approach improve neoantigen prediction. Cell, 183(3), 818–834.
- Yin et al. (2022) Yin, R. et al. (2022). Benchmarking AlphaFold for protein complex modeling reveals accuracy determinants. Protein Science, 31(8).