CICLe: Conformal In-Context Learning for Largescale Multi-Class Food Risk Classification

Korbinian Randl,1 John Pavlopoulos,2,1,3 Aron Henriksson,1 Tony Lindgren1
1 Stockholm University, Borgarfjordsgatan 12, 164 07 Kista, Sweden
{korbinian.randl,ioannis,aronhen,tony}@dsv.su.se
2
Athens University of Economics and Business, Patission 76, Athens 104 34, Greece
annis@aueb.gr
3
Archimedes/Athena RC
Abstract

Contaminated or adulterated food poses a substantial risk to human health. Given sets of labeled web texts for training, Machine Learning and Natural Language Processing can be applied to automatically detect such risks. We publish a dataset of 7,546 short texts describing public food recall announcements. Each text is manually labeled, on two granularity levels (coarse and fine), for food products and hazards that the recall corresponds to. We describe the dataset and benchmark naive, traditional, and Transformer models. Based on our analysis, Logistic Regression based on a tf-idf representation outperforms RoBERTa and XLM-R on classes with low support. Finally, we discuss different prompting strategies and present an LLM-in-the-loop framework, based on Conformal Prediction, which boosts the performance of the base classifier while reducing energy consumption compared to normal prompting.

CICLe: Conformal In-Context Learning for Largescale Multi-Class Food Risk Classification


Korbinian Randl,1 John Pavlopoulos,2,1,3 Aron Henriksson,1 Tony Lindgren1 1 Stockholm University, Borgarfjordsgatan 12, 164 07 Kista, Sweden {korbinian.randl,ioannis,aronhen,tony}@dsv.su.se 2Athens University of Economics and Business, Patission 76, Athens 104 34, Greece annis@aueb.gr 3Archimedes/Athena RC


1 Introduction

Food-bourne illnesses and contaminated food pose a serious threat to human health and lead to thousands of deaths Majowicz et al. (2014); de Noordhout et al. (2014). Natural Language Processing (NLP) solutions based on Machine and Deep Learning (ML, DL) or Large Language Models (LLMs) enable fast responses to new threats by generating warnings from publicly available texts on the internet Maharana et al. (2019); Tao et al. (2023). These texts, however, as we show, can be noisy and are characterized by thousands of classes. While we are aware of existing text datasets on the topic of food-bourne illnesses Hu et al. (2022), they focus only on the detection of such illnesses and not on their categorization. Categorization is the natural next step after detection and is needed to properly address food risks as different kinds of hazards may warrant different actions. In this work, we address this classification task and provide the following main contributions:

  1. 1.

    We present the first dataset for text classification of food products and food hazards on two levels of granularity.111 DOI:10.5281/zenodo.10820657

  2. 2.

    We present a benchmark on the introduced dataset using naive, traditional ML, and Transformer classifiers, showing that a Support Vector Machine outperforms the rest due to better performance on low-support classes.

  3. 3.

    We discuss different approaches to few-shot prompting with GPT-3.5 on our data and propose reducing the number of relevant classes for few-shot prompting using Conformal Prediction (Vovk et al., 2005, CP). We show that this enables resource-friendly prompting at comparably high F1subscript𝐹1F_{1} by boosting a base classifier’s performance in a LLM-in-the-loop framework.

2 Background and Related Work

Research on ML with food data

has traditionally focused on tabular and image data Zhou et al. (2019); Jin et al. (2020); Wang et al. (2022), where food risk classification is usually presented as a detection task: rather than identifying specific hazards, the task is formulated as the binary classification of the presence or absence of an incident Maharana et al. (2019); Tao et al. (2023); Wang et al. (2023). Focusing on the text modality, we found literature exploring such detection tasks based on Amazon reviews matched with FDA food recall announcements Maharana et al. (2019) as well as Twitter data, labeled using instances from the US National Outbreak Reporting System Tao et al. (2023). In both of these papers, the data is highly biased towards the negative class (i.e. no incident). Furthermore, the description of the method for labeling the Twitter texts in Tao et al. (2023) lacks important detail, as it is unclear on what grounds and how texts and events are matched. We only found one study on the actual classification of hazards: Xiong et al. (2023) which use a hierarchical Transformer model to classify Chinese news texts into four categories of hazards. The authors do not share further details on their data, which makes an assessment of the paper’s validity hard. Overall, the field of food risk classification based on text lacks reproducible work on fine-grained prediction of hazards based on openly accessible data.

ML models based on the attention mechanism

by Vaswani et al. (2017) and the self-supervised masked language modeling pre-training paradigm generally outperform traditional methods both on monolingual Devlin et al. (2019); Liu et al. (2019) and multilingual Conneau et al. (2020) data. Although such Transformers were originally described as an encoder-decoder architecture Vaswani et al. (2017), mapping an input-text to an output-text, models intended for classification tasks usually only employ an encoder Devlin et al. (2019); Liu et al. (2019); Conneau et al. (2020), followed by several task-specific layers.

Recently, LLMs such as Llama 2 Touvron et al. (2023), PaLM Chowdhery et al. (2022), and GPT-family models Brown et al. (2020) have been shown to exceed the capabilities of smaller Transformers even without further fine-tuning. That is, by simply providing a context of a few labeled samples per class, LLMs can predict the classes of unseen samples within this context. As LLMs are usually text-to-text Transformers, the context is provided directly in each prompt. This paradigm is commonly referred to as few-shot prompting or in-context learning Brown et al. (2020). Since the detection of LLMs’ few-shot capabilities, newer LLMs are often designed for high few-shot performance Gao et al. (2021); Chowdhery et al. (2022).

Current work on few-shot prompt engineering

focuses mostly on creating/finding the optimal few-shot samples from the training data. Ahmed et al. (2023) proposed a workflow for automatically finding similar samples from the pool of labeled “training" samples for code summarization. Shi et al. (2023) focused on automatic generation of Chain of Thought (CoT) labels for samples in reasoning tasks. CoT is another prompting paradigm that asks the LLM to provide a chain of reasoning before delivering the prediction and has been shown to drastically improve reasoning performance Wei et al. (2022). Nevertheless, to the best of our knowledge, there is no previous work on how to leverage few-shot prompting in LLMs for multi-class prediction problems with a high number of classes. While prompting with long contexts may “confuse” the LLM (Liu et al., 2023), the context window may even be too small to support a view of all classes in such cases. Furthermore, the previous approaches focus on selecting specific samples for the prompt rather than relevant classes for the prompt.

3 The Food Recall Dataset

In this section, we first describe the dataset used and shared in this paper, then discuss the labeling process and quality, as well as class distribution.

3.1 Data Description

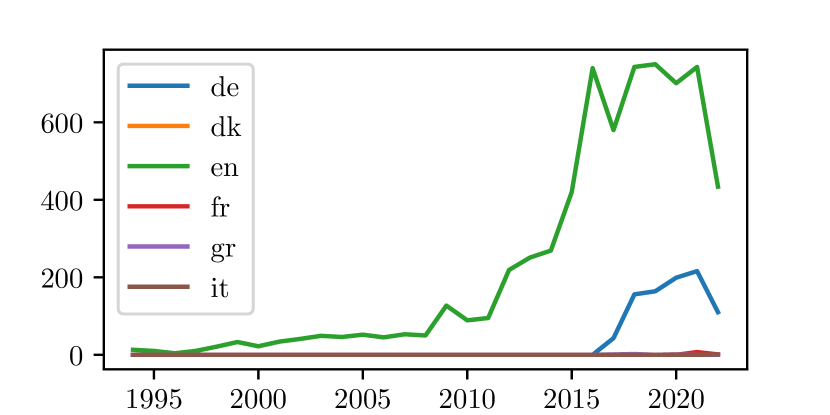
The dataset consists of 7,546 short texts (length in characters: min=5, avg=84, max=360), which are the titles of food-recall announcements (therefore referred to as title), crawled from 24 food-recall domains (governmental & NGO, see Table 3, Appendix A) by Agroknow222https://agroknow.com/ Papakonstantinou et al. (2022). The texts are written in 6 languages, with English (n=6,644𝑛6644n=6,644) and German (n=888𝑛888n=888) being the most common, followed by French (n=8𝑛8n=8), Greek (n=4𝑛4n=4), Italian (n=1𝑛1n=1) and Danish (n=1𝑛1n=1). As shown in Figure 1, most of the texts have been authored after 2010. The texts describe recalls of specific food products due to specific reasons. Experts manually classified each text to four groups of classes describing hazards and products on two levels of granularity:

hazard: A fine-grained description of the hazards mentioned in the texts comprising 261261261 classes. hazard-category: A categorized version of the hazard classification task comprising 101010 classes. product: A fine-grained description of the products mentioned in the texts comprising 1,256 classes. product-category: A categorized version of the product classification task comprising 222222 classes. The columns hazard-title and product-title comprise character spans, generated based on feature importance of a Logistic Regression (LR) classifier (see §3.1.1). These signify parts of the title that are important for the hazard and product classification. As the fine-grained tasks, hazard and product, have very low support for many classes, they may require further pre-processing (e.g. clustering/filtering of labels) dependent on the application. The dataset, publicly released under a Creative Commons BY-NC-SA 4.0 license, comprises also metadata, such as the release date of the text (columns year, month, and day), the language of the text (column language), and the country of issue (column country). Appendix A contains more detailed statistics, as well as sample texts.

Refer to caption
Figure 1: Languages in the dataset per year.

3.1.1 Ground Truth

It is important to note that samples were labeled not only based on the title, but also the content of the food recall article. This means that some of the samples may not contain evidence for all the classes assigned to them. As samples that are missing specific information are common in real-world data, we decided not to filter out such samples; instead, we provide an estimate of such noise in the data in the hazard-title and product-title classification tasks. To that end, we use the coefficients of the tf-idf Logistic Regression (TF-IDF-LR) classifiers for the hazard-category and product-category classes to extract important terms per class.

For each text-label pair Ti,Yisubscript𝑇𝑖subscript𝑌𝑖T_{i},Y_{i}, we split Tisubscript𝑇𝑖T_{i} in tokens {ti,1,ti,2,,ti,K}subscript𝑡𝑖1subscript𝑡𝑖2subscript𝑡𝑖𝐾\{t_{i,1},t_{i,2},\dots,t_{i,K}\}, using the process described in §4.2.1. We then calculate a score by adding the positive model coefficients associated with ti,ksubscript𝑡𝑖𝑘t_{i,k} if yi,j=1subscript𝑦𝑖𝑗1y_{i,j}=1, and subtracting the positive model coefficients associated with ti,ksubscript𝑡𝑖𝑘t_{i,k} if yi,j=0subscript𝑦𝑖𝑗0y_{i,j}=0. Although the quality of these terms depends on class support, they can still help us frame the noise in the data by focusing on informative tokens, i.e., tokens with a positive coefficient for a specific class. We find that each such token corresponds to 1.161.161.16 classes on average for the hazard-category and 1.301.301.30 classes for the product-category.333Estimation for the fine-grained classification tasks is difficult because of low per-class support. Also, we see that 13.1%percent13.113.1\% of the samples do not have spans in hazard-title (17.1%percent17.117.1\% for product-title), indicating that evidence for the class is missing.

Fine-grained labels were assigned per web-domain by a domain expert of Agroknow and then grouped to the final labels using internal ontologies.444Random checks of the labels were performed by more experienced curators for quality assurance. In order to measure inter-annotator agreement (IAA), we asked a senior curator involved in the labeling process and one independent expert to label a sample of 30 texts (stratified over all labels) independently of each other. Comparing the annotator’s assessment to the labels in the dataset shows moderate agreement (Cohen’s κ𝜅\kappa: 0.76 on hazard-category, 0.63 on product-category). The expert’s assessment is intuitively slightly less aligned (Cohen’s κ𝜅\kappa: 0.63 on hazard-category, 0.60 on product-category) but still acceptable. Expert and Annotator show a κ𝜅\kappa of 0.59 on hazard-category, 0.77 on product-category. The raw data of our IAA study are available along with the dataset.
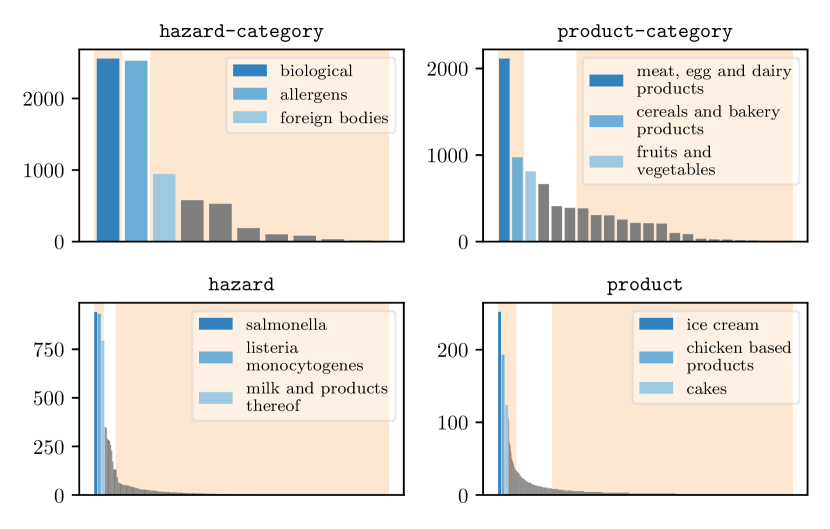
Refer to caption
Figure 2: Class support with orange background for high- (on the left) and low-support classes (right) for performance analysis. For reasons of better readability, we only name the three most supported classes per task.

3.2 Class Imbalance

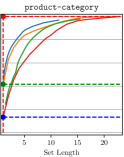
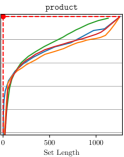
One of the most prominent features of the data is the heavy class imbalance. Figure 2 shows the sample counts per class and classification task. All the classification tasks in the data show a long-tail distribution of classes, with just a small number of classes having most of the samples. Therefore, we extract sets of high-support classes 𝒞highsubscript𝒞𝑖𝑔\mathcal{C}_{high} and low-support classes 𝒞lowsubscript𝒞𝑙𝑜𝑤\mathcal{C}_{low} comprised of around one-third of the total number of samples in the data for each classification task. The classes included in these sets are highlighted by an orange background in Figure 2. For the hazard-category classification task, the 𝒞highsubscript𝒞𝑖𝑔\mathcal{C}_{high} is comprised of only one class with 2,55725572,557 samples, and the 𝒞lowsubscript𝒞𝑙𝑜𝑤\mathcal{C}_{low} consists of 888 classes with 2,46224622,462 samples in total, and for hazard |𝒞high|=2,668subscript𝒞𝑖𝑔2668|\mathcal{C}_{high}|=2,668 samples in 333 classes and |𝒞low|=2,414subscript𝒞𝑙𝑜𝑤2414|\mathcal{C}_{low}|=2,414 samples in 248248248 classes. For product-category we have |𝒞high|=3,089subscript𝒞𝑖𝑔3089|\mathcal{C}_{high}|=3,089 samples in 222 classes and |𝒞low|=2,185subscript𝒞𝑙𝑜𝑤2185|\mathcal{C}_{low}|=2,185 samples in 161616 classes, and for product |𝒞high|=2,508subscript𝒞𝑖𝑔2508|\mathcal{C}_{high}|=2,508 samples in 393939 classes and |𝒞low|=2,483subscript𝒞𝑙𝑜𝑤2483|\mathcal{C}_{low}|=2,483 samples in 1,05810581,058 classes.

4 Methodology

This section describes the problem setting and the methods utilized in our empirical evaluation.

4.1 The Task

The basic problem we address in this paper is extreme multi-class classification on heavily imbalanced data. More formally, given a number of training-texts Ti,i{1,2,,N}subscript𝑇𝑖𝑖12𝑁T_{i},~{}i\in\{1,2,\dots,N\} and their corresponding classes yisubscript𝑦𝑖y_{i}, we aim to train a classifier f(Ti,)=y^ifsubscript𝑇𝑖subscript^𝑦𝑖\mathrm{f}(T_{i},\cdot)=\hat{y}_{i} that minimizes the error |yiy^i|subscript𝑦𝑖subscript^𝑦𝑖|y_{i}-\hat{y}_{i}|. For standard ML classifiers, the function f(Ti,)fsubscript𝑇𝑖\mathrm{f}(T_{i},\cdot) is usually a two-step process with the first step mapping the text to a machine-readable embedding vector Xi=e(Ti)subscript𝑋𝑖esubscript𝑇𝑖X_{i}=\mathrm{e}(T_{i}), and the second one involving the learning process on Xisubscript𝑋𝑖X_{i}: f(Ti,)=f(Xi,)fsubscript𝑇𝑖superscriptfsubscript𝑋𝑖\mathrm{f}(T_{i},\cdot)=\mathrm{f^{\prime}}(X_{i},\cdot). Both the class labels yisubscript𝑦𝑖y_{i} and predictions y^isubscript^𝑦𝑖\hat{y}_{i} are integer scalars in {1,2,,M}12𝑀\{1,2,\dots,M\}. In all our classification tasks, we have at least M10𝑀10M\geq 10.

4.2 ML Classifiers

As a naive baseline, we report the performance of two classifiers. The random classifier (RANDOM) yields a random integer in {1,2,,M}12𝑀\{1,2,\dots,M\} for each y^isubscript^𝑦𝑖\hat{y}_{i}. The majority baseline (MAJORITY), chooses each y^isubscript^𝑦𝑖\hat{y}_{i} to be the class with the highest number of samples in the training data.

4.2.1 Traditional ML Classifiers

We use Bag-of-Words (BOW) and Term Frequency - Inverse Document Frequency (Spärck Jones, 1972, TF-IDF) encodings (see Appendix C), combined with k𝑘k-Nearest Neighbours (KNN), LR, or Support Vector Machine (SVM) classifiers.555For the classifiers, we use the implementation from the Python library scikit-learn Pedregosa et al. (2011). For KNN we optimize over k{2,4,8}𝑘248k\in\{2,4,8\} neighbours based on cosine similarity of the embedding vectors. For LR, we use a ‘liblinear’ solver and optimize C{0.5,1.0,2.0}𝐶0.51.02.0C\in\{0.5,1.0,2.0\} for both L1 and L2 regularization. For the SVMs, we use a linear kernel and optimize the parameter C{0.5,1.0,2.0}𝐶0.51.02.0C\in\{0.5,1.0,2.0\} for L2 regularization on the validation splits (defined in §5.1). For LR and SVM, we use a one-vs-all approach to classification, which means that we train one binary classifier for each class in the predicted classification task and choose the class with the highest probability.

4.2.2 Encoder-only Transformers

As a more recent counterpart to the previously described traditional ML classifiers, we fine-tune two models from huggingface’s Transformers666https://huggingface.co/docs/transformers/index library: RoBERTabase Liu et al. (2019) and XLM-RoBERTabase (Conneau et al., 2020, XLM-R) in their base-sizes (RoBERTa: 125M params; XLM-R: 270M params). Both models use the structure introduced by BERTbase (Devlin et al., 2019, L=12, H=768, A=12), which improves comparability of their results. The different parameter counts result mainly from the different vocabulary sizes used in their Byte-Pair-based encoders Sennrich et al. (2016): RoBERTa uses a vocabulary of size 50k, while XLM-R uses 250k tokens. For the purposes of this paper, the most important difference between the models is that while RoBERTa is only pre-trained on English texts, XLM-R is pre-trained on 100 different languages.

To fine-tune these two models, we use the standard sequence classification heads provided by the Transformers library. We optimize training using AdamW Loshchilov and Hutter (2019) in combination with a learning rate that stays constant at a value of 51055superscript1055\cdot 10^{-5} for the first two epochs and then declines linearly towards 1% of its starting value after 20 epochs. Furthermore, we employ early stopping with a patience of five epochs on the minimum cross-entropy loss computed on the validation set. Due to hardware limitations, we use a batch size of 16 observations.

4.3 Prompting

We also employ few-shot prompting with gpt-3.5-turbo-instruct.777Accessed on 02-2024 through OpenAI’s python API. For all our prompting examples, we use a temperature value of 00. The naive approach is to provide a context describing the classification task followed by the two most similar text-label pairs (based on cosine similarity of the TF-IDF-embeddings) per class from the training data. These examples are ordered from the most similar to least similar in the prompt (dubbed GPT-ALL).

Refer to caption
Figure 3: Prompting strategies used in this study. Although the strategies are generally independent of the choice of classifier and LLM, we only show results for TF-IDF-LR and OpenAI’s gpt-3.5-turbo-instruct.

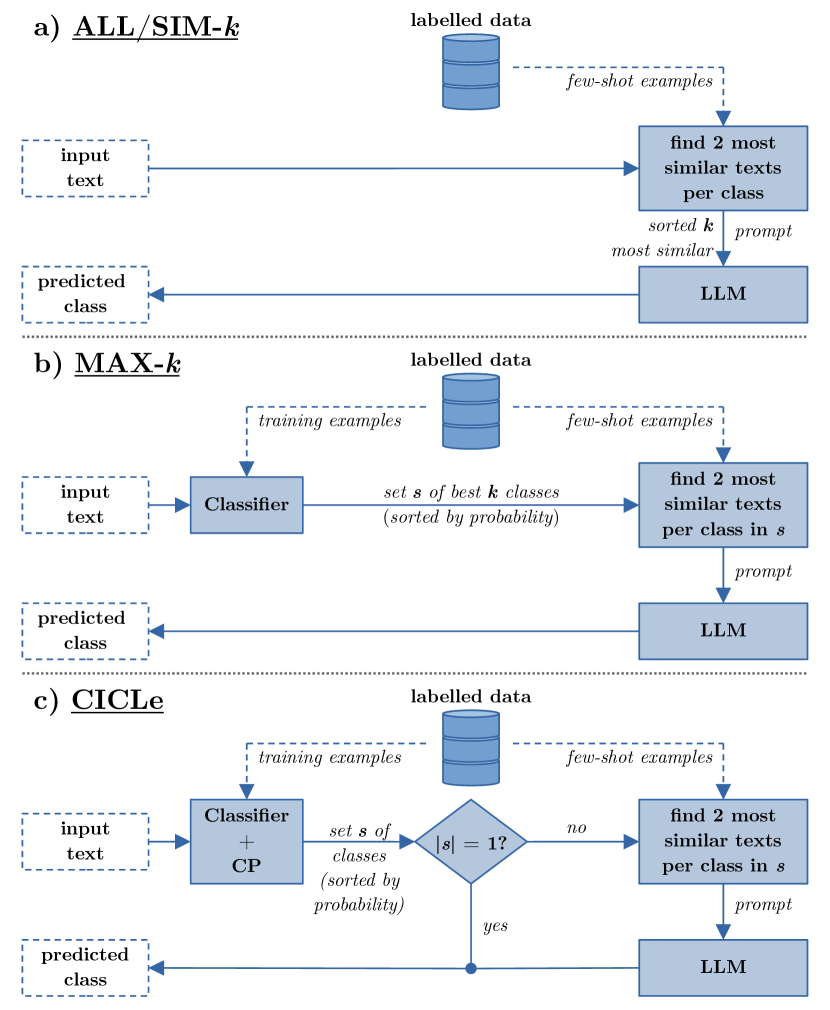
GPT-ALL is applicable only to coarse tasks due to the size of the context window: for the hazard task, we would have at most 4,096tokens261classes=15.74096tokens261classes15.7\frac{4,096~{}\mathrm{tokens}}{261~{}\mathrm{classes}}=15.7 tokens per class which is insufficient for providing two example texts. Furthermore, reduced prompt sizes can lead to increased energy efficiency, as the size of the attention weights computed in the Transformer is input size ×\times output size (Vaswani et al., 2017). Lastly, meaningfully reducing the classes in the prompt can increase predictive performance, as the probability of choosing the right class increases (Appendix D). Therefore, we use three different kinds of prompts (see Figure 3) with the third kind (GPT-CICLe) being novel. GPT-SIM-k𝑘k is simply the GPT-ALL prompt shortened by only keeping the k𝑘k most similar few-shot-samples. GPT-MAX-k𝑘k selects the two most similar few-shot-samples from the k𝑘k most probable class labels as predicted by a base classifier. The few-shot samples are ordered from most to least probable, which yields 2k2𝑘2\cdot k few-shot samples per prompt.

4.3.1 Our proposed GPT-CICLe

We propose using Conformal Prediction (CP) Vovk et al. (2005) to adapt the context length to a base classifier’s certainty on the predicted classes. CP uses the concept of a non-conformity measure δ(yi,y^i)𝛿subscript𝑦𝑖subscript^𝑦𝑖\delta(y_{i},\hat{y}_{i}) to create sets of predicted classes, which contain the true class with a probability of p1α𝑝1𝛼p\approx 1-\alpha.

In our case, this non-conformity measure is simply the base classifier’s uncertainty on the true class: δ(yi,y^i)=1P(y^i=yi)𝛿subscript𝑦𝑖subscript^𝑦𝑖1𝑃subscript^𝑦𝑖subscript𝑦𝑖\delta(y_{i},\hat{y}_{i})=1-P(\hat{y}_{i}=y_{i}). Here, y^isubscript^𝑦𝑖\hat{y}_{i} are the predictions and yisubscript𝑦𝑖y_{i} are the corresponding true labels. If one defines q=(N+1)(1α)N𝑞𝑁11𝛼𝑁q=\frac{\lceil{(N+1)(1-\alpha)}\rceil}{N}, and q^^𝑞\hat{q} as the qthsuperscript𝑞𝑡q^{th} empirical quantile of {δ(Yi,Y^i)|1iN}conditional-set𝛿subscript𝑌𝑖subscript^𝑌𝑖1𝑖𝑁\{\delta(Y_{i},\hat{Y}_{i})|1\leq i\leq N\}, it can be shown that for any prediction Y^^𝑌\hat{Y} of the classifier on an unknown sample, a set of classes {j|y^j1q^}conditional-set𝑗subscript^𝑦𝑗1^𝑞\{j|\hat{y}_{j}\geq 1-\hat{q}\} contains the true class with probability p1α𝑝1𝛼p\geq 1-\alpha Vovk et al. (2005). This means that we accept an upper bound of 1α1𝛼1-\alpha on prompting accuracy, which we trade for adaptive context length based on sample difficulty.

In the extreme case of a single class in the prediction set, we bypass the LLM completely and predict this class. As it is possible for CP to predict empty sets, which is not useful in classification, we return a set containing only the most probable class in such cases. This means that for α>1𝛼limit-from1\alpha>1-base classifier accuracy, the performance of this prompt becomes equal to that of the base classifier. As in GPT-MAX-k𝑘k, we finally select the two most similar samples per class in the conformal set from the training data to compose the prompt. Samples are again ordered from most to least probable as determined by the classifier. We refer to this LLM-in-the-loop framework as Conformal In-Context Learning (CICLe). An example of each of these prompts is shown in Appendix B.

In this paper, we focus on the pure few-shot performance of gpt-3.5-turbo-instruct. Therefore, we decided not to employ additional prompt-engineering techniques, such as CoT. Our code is publicly available (under a GPL V3.0 license) at https://github.com/k-randl/conformal_prompting.

5 Empirical Analysis

In this section, we present the experimental setup and the experimental results.

5.1 Experimental Setup

For training and evaluation of our ML models, we apply 5-fold cross-validation (CV) to create 5 train-test splits. From each of these 5 training sets, we create a validation set using 10%percent1010\% holdout. To reduce the computational cost, we only test our prompting methods other than GPT-ALL on the first CV split, which corresponds to a 20%percent2020\% holdout. We use stratification on the *-category classification tasks as those provide a sufficient number of samples for splitting in each class. We use the same splits for hazard-category and hazard, as well as product-category and product to keep the results comparable. Our classifiers provide baseline performance on the dataset. In order to demonstrate the effect of class imbalance on performance, we do not employ balancing methods like oversampling or class weights during training.

5.2 Experimental Results

In this section, we present the predictive performance of the classifiers described in §4. For hazard and product we present performance on classes that have a minimum support of four in the train set and at least one instance in the test set as for these ML is feasible. Performance on all classes in these tasks is reported in Appendix D.

𝐅𝟏subscript𝐅1\bf F_{1} (all classes) 𝐅𝟏subscript𝐅1\bf F_{1} (𝒞highsubscript𝒞𝑖𝑔\mathcal{C}_{high}) 𝐅𝟏subscript𝐅1\bf F_{1} (𝒞lowsubscript𝒞𝑙𝑜𝑤\mathcal{C}_{low})
Model mean max. mean max. mean max.
hazard-category 101010 classes
RANDOM 0.080.080.08 0.080.080.08 0.330.330.33 0.340.340.34 0.000.000.00 0.000.000.00
MAJORITY 0.050.050.05 0.050.050.05 1.001.00\bf 1.00 1.001.00\bf 1.00 0.000.000.00 0.000.000.00
TF-IDF-KNN 0.470.470.47 0.500.500.50 0.450.450.45 0.460.460.46 0.410.410.41 0.460.460.46
TF-IDF-LR 0.550.550.55 0.570.570.57 0.480.480.48 0.480.480.48 0.500.500.50 0.530.530.53
TF-IDF-SVM 0.580.58\bf 0.58 0.600.60\bf 0.60 0.470.470.47 0.470.470.47 0.560.56\bf 0.56 0.590.59\bf 0.59
RoBERTa 0.510.510.51 0.550.550.55 0.470.470.47 0.480.480.48 0.450.450.45 0.510.510.51
XLM-R 0.490.490.49 0.520.520.52 0.470.470.47 0.480.480.48 0.420.420.42 0.470.470.47
GPT-ALL 0.560.560.56 0.620.620.62 0.450.450.45 0.460.460.46 0.560.56\bf 0.56 0.670.67\bf 0.67
product-category 222222 classes
RANDOM 0.010.010.01 0.010.010.01 0.200.200.20 0.220.220.22 0.010.010.01 0.010.010.01
MAJORITY 0.010.010.01 0.010.010.01 0.240.240.24 0.240.240.24 0.000.000.00 0.000.000.00
TF-IDF-KNN 0.420.420.42 0.470.470.47 0.780.780.78 0.790.790.79 0.430.430.43 0.490.490.49
TF-IDF-LR 0.520.520.52 0.570.570.57 0.870.87\bf 0.87 0.880.88\bf 0.88 0.490.490.49 0.560.560.56
TF-IDF-SVM 0.590.590.59 0.600.600.60 0.860.860.86 0.880.880.88 0.590.590.59 0.610.610.61
RoBERTa 0.300.300.30 0.530.530.53 0.680.680.68 0.900.900.90 0.260.260.26 0.480.480.48
XLM-R 0.350.350.35 0.520.520.52 0.780.780.78 0.890.890.89 0.300.300.30 0.480.480.48
GPT-ALL 0.690.69\bf 0.69 0.720.72\bf 0.72 0.840.840.84 0.850.850.85 0.730.73\bf 0.73 0.750.75\bf 0.75
hazard 797979 / 261261261 classes
RANDOM 0.000.000.00 0.000.000.00 0.000.000.00 0.000.000.00 0.000.000.00 0.000.000.00
MAJORITY 0.000.000.00 0.000.000.00 0.000.000.00 0.000.000.00 0.000.000.00 0.000.000.00
TF-IDF-KNN 0.280.280.28 0.300.300.30 0.710.710.71 0.750.750.75 0.280.280.28 0.300.300.30
TF-IDF-LR 0.410.41\bf 0.41 0.440.44\bf 0.44 0.830.830.83 0.850.850.85 0.390.39\bf 0.39 0.430.43\bf 0.43
TF-IDF-SVM 0.230.230.23 0.240.240.24 0.840.840.84 0.860.860.86 0.170.170.17 0.180.180.18
RoBERTa 0.360.360.36 0.410.410.41 0.850.85\bf 0.85 0.860.86\bf 0.86 0.320.320.32 0.370.370.37
XLM-R 0.330.330.33 0.380.380.38 0.830.830.83 0.860.860.86 0.290.290.29 0.350.350.35
product 184184184 / 125612561256 classes
RANDOM 0.000.000.00 0.000.000.00 0.000.000.00 0.000.000.00 0.000.000.00 0.000.000.00
MAJORITY 0.000.000.00 0.000.000.00 0.000.000.00 0.000.000.00 0.000.000.00 0.000.000.00
TF-IDF-KNN 0.320.320.32 0.350.350.35 0.460.460.46 0.510.510.51 0.240.240.24 0.350.350.35
TF-IDF-LR 0.510.51\bf 0.51 0.530.53\bf 0.53 0.680.68\bf 0.68 0.720.72\bf 0.72 0.430.43\bf 0.43 0.520.52\bf 0.52
TF-IDF-SVM 0.090.090.09 0.100.100.10 0.500.500.50 0.520.520.52 0.000.000.00 0.000.000.00
RoBERTa 0.430.430.43 0.570.570.57 0.560.560.56 0.720.720.72 0.280.280.28 0.520.520.52
XLM-R 0.280.280.28 0.540.540.54 0.440.440.44 0.760.760.76 0.140.140.14 0.410.410.41
Table 1: Macro-averaged F1subscript𝐹1F_{1}-score (mean & maximum) over 5 CV splits. Blue cells highlight the best mean score per column and classification task. For hazard and product scores are only evaluated on well supported classes.

5.2.1 Traditional Baselines

The F1subscript𝐹1F_{1}-scores on classification (overall, as well as 𝒞highsubscript𝒞𝑖𝑔\mathcal{C}_{high} and 𝒞lowsubscript𝒞𝑙𝑜𝑤\mathcal{C}_{low} introduced in Figure 2) are presented in Table 1. All the classifiers outperform both naive baselines, except for the 𝒞highsubscript𝒞𝑖𝑔\mathcal{C}_{high} of hazard-category. In this task, 𝒞highsubscript𝒞𝑖𝑔\mathcal{C}_{high} only consists of the majority class. Since the BOW-based classifiers in general perform worse than TF-IDF, we only report them in the Appendix (see Table 8).

The best-performing non-prompting classifier for the hazard-category and product-category tasks is TF-IDF-SVM as it excels on 𝒞lowsubscript𝒞𝑙𝑜𝑤\mathcal{C}_{low}. For the fine-grained hazard and product tasks the SVM’s performance on the less represented classes drops, and TF-IDF-LR takes the position as the best traditional classifier. In parallel, TF-IDF-SVM’s relative F1subscript𝐹1F_{1}-score increases on high support classes, which we interpret as an inability to learn from classes with very few samples, paired with good performance on training sample counts >100absent100>100. TF-IDF-KNN has the overall lowest performance of the traditional classifiers.

5.2.2 Transformers

TF-IDF-LR performs overall comparably or better than the best encoder-only Transformer RoBERTa. We assume that the Transformer architectures would need higher numbers of training samples per class to perform on par or better compared to traditional methods.

Interestingly, RoBERTa and XLM-R both achieve lower and less stable F1subscript𝐹1F_{1}-score for product and product-category. This is not seen in other classifiers. By inspecting the data, we see that in both of these tasks brand names (e.g. "SnoBalls", "Sriracha") or hard-to-define word creations (e.g. "pecan caramel stars", "Vanilla Cups") make up the relevant part for classification. These are hard to learn during fine-tuning, as they are both very specific and most probably underrepresented in the data used for pre-training. Analysis of the spans in product-title shows that TF-IDF-LR often infers the product from the supplier and/or the hazard in such cases.

Surprisingly, the multilingual XLM-R only outperforms RoBERTa in the 𝒞highsubscript𝒞𝑖𝑔\mathcal{C}_{high} of the hazard-category and product-category tasks even though the texts come in multiple languages. We assume the low number of per-class samples is not sufficient for the very large embedding layer of XLM-R. Analysis of the performance on the two most common languages, English and German, is shown in Appendix D, Table 7. The results suggest that while XLM-R performs closer to RoBERTa on non-English texts, its performance in terms of F1subscript𝐹1F_{1} is generally worse than that of RoBERTa. XLM-R performs especially worse than RoBERTa on German texts in tasks with low per-class support (namely hazard and product), which supports our claim that XLM-R needs more training examples than RoBERTa to deliver good performance.

5.2.3 Large Language Models

A simple prompting approach (GPT-ALL) performs comparably to TF-IDF-LR and RoBERTa on the hazard-category and is the best classifier for product-category. In both cases, it excels on the 𝒞lowsubscript𝒞𝑙𝑜𝑤\mathcal{C}_{low} as it only needs two labeled samples per class. Since when prompting, the predicted class is delivered in free text, the LLM may produce output that is not within the set of class labels. While these outputs could be interpreted as belonging to one of the class labels, we only count exact matches. In both coarse tasks, GPT-ALL failed to predict any class for 2%percent22\% of the samples (Table 2). In a qualitative analysis, shown in Appendix D, we see that while some of the prompting failures can be improved by better prompt design (e.g. more samples per class, see also Table 2), others can even be seen as a positive feature of prompting.

Model 𝐅𝟏subscript𝐅1\bf F_{1} (macro) LLM usage Prompt Size (chars) Classes per Prompt Samples per Class Failure Rate
hazard-category 101010 classes; α=0.05𝛼0.05\alpha=0.05
TF-IDF-LR 0.550.550.55 - - - - -
GPT-ALL 0.530.530.53 100%percent100100\% 2301.72301.72301.7 10.010.010.0 2.02.02.0 2%percent22\%
GPT-SIM-10 0.520.520.52 100%percent100100\% 1206.31206.31206.3 5.85.8\enspace 5.8 1.71.71.7 2%percent22\%
GPT-MAX-5 0.550.550.55 100%percent100100\% 1214.91214.91214.9 5.05.0\enspace 5.0 2.02.02.0 2%percent22\%
GPT-SIM-20 0.530.530.53 100%percent100100\% 2301.72301.72301.7 10.010.010.0 2.02.02.0 2%percent22\%
GPT-MAX-10 0.490.490.49 100%percent100100\% 2301.72301.72301.7 10.010.010.0 2.02.02.0 3%percent33\%
GPT-CICLe 0.560.56\bf 0.56 𝟔𝟎%percent60\bf\enspace 60\% 707.5707.5\bf\enspace 707.5 2.62.6\enspace 2.6 2.02.02.0 2%percent22\%
product-category 222222 classes; α=0.05𝛼0.05\alpha=0.05
TF-IDF-LR 0.520.520.52 - - - - -
GPT-ALL 0.720.720.72 100%percent100100\% 5621.15621.15621.1 22.022.022.0 2.02.02.0 2%percent22\%
GPT-SIM-10 0.660.660.66 100%percent100100\% 1378.61378.6\bf 1378.6 6.66.6\enspace 6.6 1.51.51.5 4%percent44\%
GPT-MAX-5 0.640.640.64 100%percent100100\% 1395.61395.61395.6 5.05.0\enspace 5.0 2.02.02.0 4%percent44\%
GPT-SIM-20 0.690.690.69 100%percent100100\% 2614.02614.02614.0 11.611.611.6 1.71.71.7 2%percent22\%
GPT-MAX-10 0.680.680.68 100%percent100100\% 2631.82631.82631.8 10.010.010.0 2.02.02.0 6%percent66\%
GPT-CICLe 0.690.69\bf 0.69 𝟗𝟖%percent98\bf\enspace 98\% 1620.11620.11620.1 5.95.9\enspace 5.9 2.02.02.0 5%percent55\%
hazard 102102102 / 261261261 classes; α=0.20𝛼0.20\alpha=0.20
TF-IDF-LR 0.370.370.37 - - - - -
GPT-SIM-10 0.440.44\bf 0.44 100%percent100100\% 1308.01308.01308.0 7.57.5\enspace 7.5 1.31.31.3 15%percent1515\%
GPT-MAX-5 0.420.420.42 100%percent100100\% 1335.41335.41335.4 5.05.0\enspace 5.0 2.02.02.0 14%percent1414\%
GPT-SIM-20 0.440.44\bf 0.44 100%percent100100\% 2457.02457.02457.0 14.214.214.2 1.41.41.4 11%percent1111\%
GPT-MAX-10 0.420.420.42 100%percent100100\% 2521.12521.12521.1 10.010.010.0 2.02.02.0 13%percent1313\%
GPT-CICLe 0.420.420.42 𝟖𝟕%percent87\bf\enspace 87\% 1251.61251.6\bf 1251.6 4.74.7\enspace 4.7 2.02.02.0 14%percent1414\%
product 257257257 / 125612561256 classes; α=0.40𝛼0.40\alpha=0.40
TF-IDF-LR 0.540.540.54 - - - - -
GPT-SIM-10 0.540.540.54 100%percent100100\% 1238.71238.7\bf 1238.7 8.58.5\enspace 8.5 1.21.21.2 34%percent3434\%
GPT-MAX-5 0.560.560.56 100%percent100100\% 1270.01270.01270.0 5.05.0\enspace 5.0 2.02.02.0 20%percent2020\%
GPT-SIM-20 0.530.530.53 100%percent100100\% 2324.32324.32324.3 16.716.716.7 1.21.21.2 36%percent3636\%
GPT-MAX-10 0.570.570.57 100%percent100100\% 2385.22385.22385.2 10.010.010.0 2.02.02.0 23%percent2323\%
GPT-CICLe 0.580.58\bf 0.58 𝟗𝟔%percent96\bf\enspace 96\% 1645.81645.81645.8 6.76.7\enspace 6.7 2.02.02.0 24%percent2424\%
Table 2: Comparison of reduced prompting strategies. Blue cells highlight the best performance of reduced prompts per column and classification task; green cells the most resource-friendly value. For hazard and product F1subscript𝐹1F_{1} is only evaluated on well-supported classes.
Refer to caption
Refer to caption
Refer to caption
Refer to caption
Figure 4: CP performance on the best traditional classifier and the best encoder-only Transformer. The optimal prediction set (red dashed line) would have one element which is the true class with a probability of 1
Reduced prompts

Naive few-shot prompting (e.g., with two shots per class) may work for few but is not optimal for a high number of classes. In order to reduce the number of classes for which we include shots in the prompt, we compare three approaches that meaningfully reduce the context length. A condensed version of the results for reduced prompting is shown in Table 2 (the full version is in Table 9 of the Appendix D). Simply reducing the number of few-shot samples by moving to the GPT-SIM-k𝑘k prompts also reduces the overall F1subscript𝐹1F_{1}-scores888GPT-ALL and GPT-SIM-20 are identical in hazard-category as performance on 𝒞lowsubscript𝒞𝑙𝑜𝑤\mathcal{C}_{low} drops (see Table 9). This is largely owed to the circumstance that the 𝒞lowsubscript𝒞𝑙𝑜𝑤\mathcal{C}_{low} makes up the bulk of the classes and we are more likely to remove samples of a low-support class than the less prominent high-support classes. The latter actually profit from the reduction, as they now compete with fewer other classes. An analysis of the effect of reducing classes in the prompts on maximum and minimum performance is shown in Appendix D. Nevertheless, this very simple setup is already very powerful and outperforms the more sophisticated prompts on product.

A noteworthy detail of the hazard-category task is that it contains exactly ten classes. This means that GPT-ALL, GPT-SIM-20, and GPT-MAX-10 are identical apart from sample order: while GPT-ALL and GPT-SIM-20 are ordered by cosine similarity, GPT-MAX-10 is ordered by class probability as determined by the base classifier. While the evidence is anecdotal, the F1subscript𝐹1F_{1}-scores suggest that sample order is important in prompting and that ordering by similarity may be better.

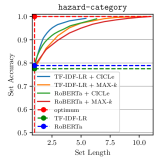
An estimate of the capabilities of *-MAX-k𝑘k vs. *-CICLe is shown in Figure 4: CP leads to more concise prediction sets (i.e. smaller sets at the same set accuracy) than GPT-MAX-k𝑘k. In contrast to max-k𝑘k, CP produces shorter sets if the classifier has a high certainty on the true class. Nevertheless, classifiers with lower overall performance will improve on max-k𝑘k’s accuracy only at larger sets. This is also reflected in Table 2: GPT-CICLe performs better or at least equal to GPT-MAX-k𝑘k in all tasks.

Focusing on GPT-CICLe, Table 2 shows that it outperforms its base classifier TF-IDF-LR on all tasks as well as all reduced prompting baselines for three out of four tasks. For higher numbers of classes, the performance of GPT-CICLe drops in 𝒞lowsubscript𝒞𝑙𝑜𝑤\mathcal{C}_{low} compared to the other prompts (see Table 9). We attribute this to the higher α𝛼\alpha in these cases: here we sacrifice CP-guarantees for faster prediction. GPT-CICLe also produces the lowest prompt lengths at the same F1subscript𝐹1F_{1} (Table 2). Here, we argue, that the base classifier used by GPT-MAX-k𝑘k and GPT-CICLe is able to produce more concise contexts for the LLM than simple cosine similarity. While this is already a step towards energy-efficient prompting, CICLe can avoid accessing the LLM completely in some cases: the extent depends on the task and the α𝛼\alpha, but ranges between accessing the LLM in only 60%percent6060\% to 98%percent9898\% of cases in our tasks.

6 Discussion

Our results suggest that a general reduction of few-shot examples, taken from a population that is very likely to contain the true class, can outperform traditional ML classifiers and Transformers in terms of F1subscript𝐹1F_{1} even without using other prompting techniques, e.g., example matching Ahmed et al. (2023) or CoT. This makes simple selection of few shots based on cosine similarity (GPT-SIM-k𝑘k) a powerful approach, especially for tasks with a high number of classes or extraction tasks. In this setting, we leverage the well-documented strong in-context reasoning capabilities of LLMs Chowdhery et al. (2022); Wei et al. (2022); Shi et al. (2023), which do not necessarily need a full view of all possible classes. However, in cases where we are able to train a decently performing base classifier, CICLe is a better choice: it boosts the performance of the base classifier by detecting insecure samples using CP and redirecting them to an LLM. Further analysis (see Appendix D.3) shows that CICLe’s strength is mainly based on better performance on low-support classes compared to the base classifier. This is most probably owed to the low demand for “training data” in few-shot prompting. In general, the influence of the base classifier and LLM on CICLe’s performance is controlled by the α𝛼\alpha value: low values favor the LLM, while high values favor the base classifier. Lastly, CICLe is subject to a trade-off between predictive and temporal performance: it allows sacrificing accuracy (e.g. due to hardware and time constraints) while keeping the context for the LLM as concise as possible. This makes it a resource-friendly alternative to prompting with all classes. Our results further suggest, in line with Liu et al. (2023), that sample order and context length are highly influential on prompting performance. We therefore see a need for future work on optimal ordering of few-shot samples and tuning of the α𝛼\alpha parameter within CICLe.

7 Conclusions

We present the first dataset for large-scale multi-class classification of short texts describing food recalls, which we release publicly under a CC BY-NC-SA 4.0 license. The dataset contains labels annotated by experts on food products and hazards on two levels of granularity, coarse (tens) and fine (hundreds). We carry out benchmarking, analysing the performance of naive, traditional, and deep-learning classifiers for all four classification tasks in the proposed dataset, showing the potential of traditional classifiers on this dataset. By employing this classifier, we also experimented with prompting, proposing a novel LLM-in-the-loop framework that leverages Conformal Prediction to establish more accurate and energy-efficient performance.

8 Limitations

Nevertheless, the dataset and approach discussed in this paper are subject to limitations. Regarding the dataset, we identified the following:

  • The labels in our dataset are subject to noise. Specifically, some samples are missing evidence for one or more of the assigned classes, while tokens important for classification may indicate more than one class. This may lead to classifiers trained on the data seeing contradicting examples and therefore limit their predictive performance.

  • The spans in hazard-title and product-title are machine generated and not manually curated. This means that while they give an estimation of word importance, they are no gold standard for explainability tasks.

We aim to improve these limitations in future iterations of the dataset. For our approach leveraging CP for few-shot prompting, we found the following limitations:

  • As visualized in Figure 4, CP represents a trade-off between high prediction set accuracy and low set length relative to the total number of classes. This means that with a rising total number of classes, we will have to sacrifice predictive performance in order to keep the prompt size feasible, which ultimately might render the approach useless.

  • In this paper we used normal conformal prediction, which only guarantees a certain probability of a single true class being in the prediction set. In order to achieve true multilabel guarantees we would need to switch to mondrian CP.

  • We only verify our approach on a single LLM. This means that our approach might not be generalizable to other LLMs and perform differently or not at all for few-shot prompting with such models.

While we have to accept the first of these points as inherent to the approach, we are planning to address the remaining points in future work. As all the data used in our dataset was already publicly available before the publication of this work, we do not violate anybody’s privacy by republishing it.

Acknowledgements

Funding for this research has been provided by the European Union’s Horizon Europe research and innovation programme EFRA (Grant Agreement Number 101093026). Funded by the European Union. Views and opinions expressed are however those of the author(s) only and do not necessarily reflect those of the European Union or European Commission-EU. Neither the European Union nor the granting authority can be held responsible for them. \euflag

References

  • Ahmed et al. (2023) Toufique Ahmed, Kunal Suresh Pai, Premkumar Devanbu, and Earl T. Barr. 2023. Improving few-shot prompts with relevant static analysis products.
  • Bird et al. (2009) S. Bird, E. Loper, and Klein E. 2009. Natural Language Processing with Python. O’Reilly Media Inc.
  • Brown et al. (2020) Tom Brown, Benjamin Mann, Nick Ryder, Melanie Subbiah, Jared D Kaplan, Prafulla Dhariwal, Arvind Neelakantan, Pranav Shyam, Girish Sastry, Amanda Askell, Sandhini Agarwal, Ariel Herbert-Voss, Gretchen Krueger, Tom Henighan, Rewon Child, Aditya Ramesh, Daniel Ziegler, Jeffrey Wu, Clemens Winter, Chris Hesse, Mark Chen, Eric Sigler, Mateusz Litwin, Scott Gray, Benjamin Chess, Jack Clark, Christopher Berner, Sam McCandlish, Alec Radford, Ilya Sutskever, and Dario Amodei. 2020. Language models are few-shot learners. In Advances in Neural Information Processing Systems, volume 33, pages 1877–1901. Curran Associates, Inc.
  • Chowdhery et al. (2022) Aakanksha Chowdhery, Sharan Narang, Jacob Devlin, Maarten Bosma, Gaurav Mishra, Adam Roberts, Paul Barham, Hyung Won Chung, Charles Sutton, Sebastian Gehrmann, Parker Schuh, Kensen Shi, Sasha Tsvyashchenko, Joshua Maynez, Abhishek Rao, Parker Barnes, Yi Tay, Noam Shazeer, Vinodkumar Prabhakaran, Emily Reif, Nan Du, Ben Hutchinson, Reiner Pope, James Bradbury, Jacob Austin, Michael Isard, Guy Gur-Ari, Pengcheng Yin, Toju Duke, Anselm Levskaya, Sanjay Ghemawat, Sunipa Dev, Henryk Michalewski, Xavier Garcia, Vedant Misra, Kevin Robinson, Liam Fedus, Denny Zhou, Daphne Ippolito, David Luan, Hyeontaek Lim, Barret Zoph, Alexander Spiridonov, Ryan Sepassi, David Dohan, Shivani Agrawal, Mark Omernick, Andrew M. Dai, Thanumalayan Sankaranarayana Pillai, Marie Pellat, Aitor Lewkowycz, Erica Moreira, Rewon Child, Oleksandr Polozov, Katherine Lee, Zongwei Zhou, Xuezhi Wang, Brennan Saeta, Mark Diaz, Orhan Firat, Michele Catasta, Jason Wei, Kathy Meier-Hellstern, Douglas Eck, Jeff Dean, Slav Petrov, and Noah Fiedel. 2022. Palm: Scaling language modeling with pathways.
  • Conneau et al. (2020) Alexis Conneau, Kartikay Khandelwal, Naman Goyal, Vishrav Chaudhary, Guillaume Wenzek, Francisco Guzmán, Edouard Grave, Myle Ott, Luke Zettlemoyer, and Veselin Stoyanov. 2020. Unsupervised cross-lingual representation learning at scale.
  • de Noordhout et al. (2014) Charline Maertens de Noordhout, Brecht Devleesschauwer, Frederick J Angulo, Geert Verbeke, Juanita Haagsma, Martyn Kirk, Arie Havelaar, and Niko Speybroeck. 2014. The global burden of listeriosis: a systematic review and meta-analysis. The Lancet Infectious Diseases, 14(11):1073–1082.
  • Devlin et al. (2019) Jacob Devlin, Ming-Wei Chang, Kenton Lee, and Kristina Toutanova. 2019. Bert: Pre-training of deep bidirectional transformers for language understanding.
  • Gao et al. (2021) Tianyu Gao, Adam Fisch, and Danqi Chen. 2021. Making pre-trained language models better few-shot learners.
  • Hu et al. (2022) Ruofan Hu, Dongyu Zhang, Dandan Tao, Thomas Hartvigsen, Hao Feng, and Elke Rundensteiner. 2022. Tweet-fid: An annotated dataset for multiple foodborne illness detection tasks.
  • Jin et al. (2020) Cangyu Jin, Yamine Bouzembrak, Jiehong Zhou, Qiao Liang, Leonieke M. van den Bulk, Anand Gavai, Ningjing Liu, Lukas J. van den Heuvel, Wouter Hoenderdaal, and Hans J.P. Marvin. 2020. Big data in food safety - a review. Current Opinion in Food Science, 36:24–32. Food Safety.
  • Liu et al. (2023) Nelson F. Liu, Kevin Lin, John Hewitt, Ashwin Paranjape, Michele Bevilacqua, Fabio Petroni, and Percy Liang. 2023. Lost in the middle: How language models use long contexts.
  • Liu et al. (2019) Yinhan Liu, Myle Ott, Naman Goyal, Jingfei Du, Mandar Joshi, Danqi Chen, Omer Levy, Mike Lewis, Luke Zettlemoyer, and Veselin Stoyanov. 2019. Roberta: A robustly optimized bert pretraining approach.
  • Loshchilov and Hutter (2019) I. Loshchilov and F. Hutter. 2019. Decoupled weight decay regularization. In 7th International Conference on Learning Representations, ICLR 2019, University of Freiburg.
  • Maharana et al. (2019) Adyasha Maharana, Kunlin Cai, Joseph Hellerstein, Yulin Hswen, Michael Munsell, Valentina Staneva, Miki Verma, Cynthia Vint, Derry Wijaya, and Elaine O Nsoesie. 2019. Detecting reports of unsafe foods in consumer product reviews. JAMIA Open, 2(3):330–338.
  • Majowicz et al. (2014) Shannon E. Majowicz, Elaine Scallan, Andria Jones-Bitton, Jan M. Sargeant, Jackie Stapleton, Frederick J. Angulo, Derrick H. Yeung, and Martyn D. Kirk. 2014. Global incidence of human shiga toxin–producing escherichia coli infections and deaths: A systematic review and knowledge synthesis. Foodborne Pathogens and Disease, 11(6):447–455. PMID: 24750096.
  • Papakonstantinou et al. (2022) Mihalis Papakonstantinou, Manos Karvounis, Giannis Stoitsis, and Nikos Manouselis. 2022. Deploying a Scalable Big Data Platform to Enable a Food Safety Data Space, pages 227–248. Springer International Publishing, Cham.
  • Pedregosa et al. (2011) F. Pedregosa, G. Varoquaux, A. Gramfort, V. Michel, B. Thirion, O. Grisel, M. Blondel, P. Prettenhofer, R. Weiss, V. Dubourg, J. Vanderplas, A. Passos, D. Cournapeau, M. Brucher, M. Perrot, and E. Duchesnay. 2011. Scikit-learn: Machine learning in Python. Journal of Machine Learning Research, 12:2825–2830.
  • Sennrich et al. (2016) R. Sennrich, B. Haddow, and A. Birch. 2016. Neural machine translation of rare words with subword units. In 54th Annual Meeting of the Association for Computational Linguistics, ACL 2016 - Long Papers, volume 3, pages 1715–1725, School of Informatics, University of Edinburgh.
  • Shi et al. (2023) Fobo Shi, Peijun Qing, Dong Yang, Nan Wang, Youbo Lei, Haonan Lu, and Xiaodong Lin. 2023. Prompt space optimizing few-shot reasoning success with large language models.
  • Spärck Jones (1972) K. Spärck Jones. 1972. A statistical interpretation of term specificity and its application in retrieval. Journal of Documentation, 28:11–21.
  • Tao et al. (2023) Dandan Tao, Ruofan Hu, Dongyu Zhang, Jasmine Laber, Anne Lapsley, Timothy Kwan, Liam Rathke, Elke Rundensteiner, and Hao Feng. 2023. A novel foodborne illness detection and web application tool based on social media. Foods, 12(14).
  • Touvron et al. (2023) Hugo Touvron, Louis Martin, Kevin Stone, Peter Albert, Amjad Almahairi, Yasmine Babaei, Nikolay Bashlykov, Soumya Batra, Prajjwal Bhargava, Shruti Bhosale, Dan Bikel, Lukas Blecher, Cristian Canton Ferrer, Moya Chen, Guillem Cucurull, David Esiobu, Jude Fernandes, Jeremy Fu, Wenyin Fu, Brian Fuller, Cynthia Gao, Vedanuj Goswami, Naman Goyal, Anthony Hartshorn, Saghar Hosseini, Rui Hou, Hakan Inan, Marcin Kardas, Viktor Kerkez, Madian Khabsa, Isabel Kloumann, Artem Korenev, Punit Singh Koura, Marie-Anne Lachaux, Thibaut Lavril, Jenya Lee, Diana Liskovich, Yinghai Lu, Yuning Mao, Xavier Martinet, Todor Mihaylov, Pushkar Mishra, Igor Molybog, Yixin Nie, Andrew Poulton, Jeremy Reizenstein, Rashi Rungta, Kalyan Saladi, Alan Schelten, Ruan Silva, Eric Michael Smith, Ranjan Subramanian, Xiaoqing Ellen Tan, Binh Tang, Ross Taylor, Adina Williams, Jian Xiang Kuan, Puxin Xu, Zheng Yan, Iliyan Zarov, Yuchen Zhang, Angela Fan, Melanie Kambadur, Sharan Narang, Aurelien Rodriguez, Robert Stojnic, Sergey Edunov, and Thomas Scialom. 2023. Llama 2: Open foundation and fine-tuned chat models.
  • Vaswani et al. (2017) Ashish Vaswani, Noam Shazeer, Niki Parmar, Jakob Uszkoreit, Llion Jones, Aidan N. Gomez, Łukasz Kaiser, and Illia Polosukhin. 2017. Attention is all you need. In Proceedings of the 31st International Conference on Neural Information Processing Systems, NIPS’17, page 6000–6010, Red Hook, NY, USA. Curran Associates Inc.
  • Vovk et al. (2005) Vladimir Vovk, Alexander Gammerman, and Glenn Shafer. 2005. Algorithmic Learning in a Random World. Springer International Publishing.
  • Wang et al. (2022) Xinxin Wang, Yamine Bouzembrak, AGJM Oude Lansink, and H. J. van der Fels-Klerx. 2022. Application of machine learning to the monitoring and prediction of food safety: A review. Comprehensive Reviews in Food Science and Food Safety, 21(1):416–434.
  • Wang et al. (2023) Xinxin Wang, Yamine Bouzembrak, A. G. J. M. Oude Lansink, and H. J. van der Fels-Klerx. 2023. Weighted bayesian network for the classification of unbalanced food safety data: Case study of risk-based monitoring of heavy metals. Risk Analysis, n/a(n/a).
  • Wei et al. (2022) Jason Wei, Xuezhi Wang, Dale Schuurmans, Maarten Bosma, brian ichter, Fei Xia, Ed Chi, Quoc V Le, and Denny Zhou. 2022. Chain-of-thought prompting elicits reasoning in large language models. In Advances in Neural Information Processing Systems, volume 35, pages 24824–24837. Curran Associates, Inc.
  • Xiong et al. (2023) Shufeng Xiong, Wenjie Tian, Vishwash Batra, Xiaobo Fan, Lei Xi, Hebing Liu, and Liangliang Liu. 2023. Food safety news events classification via a hierarchical transformer model. Heliyon, 9(7):e17806.
  • Zhou et al. (2019) Lei Zhou, Chu Zhang, Fei Liu, Zhengjun Qiu, and Yong He. 2019. Application of deep learning in food: A review. Comprehensive Reviews in Food Science and Food Safety, 18(6):1793–1811.

Appendix

Appendix A Data sample and statistics:

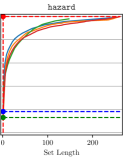
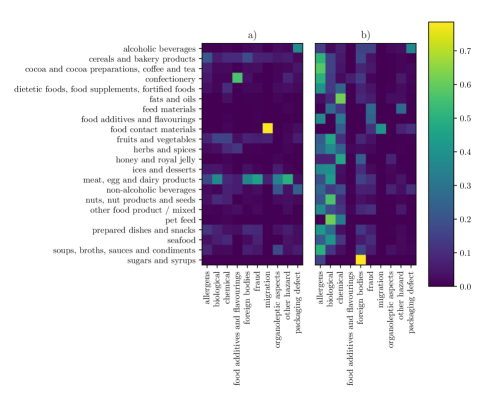
In the following Tables and Figures, we provide additional insights into the dataset shared with this publication. Table 3 lists the original websites our texts were collected from, Table 4 provides a statistical overview over the class- and language-distribution in the data, and Figure 5 is a heatmap highlighting co-occurrence of classes in the hazard-category and product-category tasks. Finally, we share a few data samples along with their labels in Figure 6.

Domain Samples
www.fda.gov: 1740
www.fsis.usda.gov: 1112
www.productsafety.gov.au: 925
www.food.gov.uk: 902
www.lebensmittelwarnung.de: 886
www.inspection.gc.ca: 864
www.fsai.ie: 358
www.foodstandards.gov.au: 281
inspection.canada.ca: 124
www.cfs.gov.hk: 123
recalls-rappels.canada.ca: 96
tna.europarchive.org: 52
wayback.archive-it.org: 23
healthycanadians.gc.ca: 18
www.sfa.gov.sg: 11
www.collectionscanada.gc.ca: 10
securite-alimentaire.public.lu: 8
portal.efet.gr: 4
www.foodstandards.gov.scot: 3
www.ages.at: 2
www.accessdata.fda.gov: 1
webarchive.nationalarchives.gov.uk: 1
www.salute.gov.it: 1
www.foedevarestyrelsen.dk: 1
Table 3: Data sources, ordered by support number
Per Class Support Based
most freq. least freq. 𝒞highsubscript𝒞𝑖𝑔\mathcal{C}_{high} 𝒞mediumsubscript𝒞𝑚𝑒𝑑𝑖𝑢𝑚\mathcal{C}_{medium} 𝒞lowsubscript𝒞𝑙𝑜𝑤\mathcal{C}_{low} Total
hazard-category biological migration
1994 - 1998 343434 (33.6)33.6(33.6) 343434 (33.6)33.6(33.6) 444 (71.0)71.0(71.0) 202020 (34.6)34.6(34.6) 585858 (36.5)36.5(36.5)
1999 - 2002 505050 (50.8)50.8(50.8) 505050 (50.8)50.8(50.8) 212121 (52.9)52.9(52.9) 595959 (46.0)46.0(46.0) 130130130 (49.0)49.0(49.0)
2003 - 2006 535353 (52.8)52.8(52.8) 535353 (52.8)52.8(52.8) 616161 (60.5)60.5(60.5) 787878 (58.1)58.1(58.1) 192192192 (57.4)57.4(57.4)
2007 - 2010 158158158 (95.3)95.3(95.3) 158158158 (95.3)95.3(95.3) 494949 (81.0)81.0(81.0) 112112112 (72.5)72.5(72.5) 319319319 (85.1)85.1(85.1)
2011 - 2014 308308308 (91.6)91.6(91.6) 308308308 (91.6)91.6(91.6) 293293293 (81.2)81.2(81.2) 233233233 (71.9)71.9(71.9) 834834834 (82.4)82.4(82.4)
2015 - 2018 911911911 (91.5)91.5(91.5) 911911911 (91.5)91.5(91.5) 104810481048 (86.8)86.8(86.8) 726726726 (82.2)82.2(82.2) 268526852685 (87.1)87.1(87.1)
By Year 2019 - 2022 104310431043 (85.7)85.7(85.7) 141414 (44.1)44.1(44.1) 104310431043 (85.7)85.7(85.7) 105110511051 (89.0)89.0(89.0) 123412341234 (83.7)83.7(83.7) 332833283328 (86.0)86.0(86.0)
DE 278278278 (58.8)58.8(58.8) 101010 (29.0)29.0(29.0) 278278278 (58.8)58.8(58.8) 969696 (52.7)52.7(52.7) 514514514 (58.4)58.4(58.4) 888888888 (57.9)57.9(57.9)
DK 111 (42.0)42.0(42.0) 111 (42.0)42.0(42.0)
EN 227822782278 (90.5)90.5(90.5) 444 (81.8)81.8(81.8) 227822782278 (90.5)90.5(90.5) 242624262426 (87.4)87.4(87.4) 194019401940 (85.2)85.2(85.2) 664466446644 (87.8)87.8(87.8)
FR 111 (73.0)73.0(73.0) 777 (71.7)71.7(71.7) 888 (71.9)71.9(71.9)
GR 333 (74.0)74.0(74.0) 111 (47.0)47.0(47.0) 444 (67.2)67.2(67.2)
By Language IT 111 (51.0)51.0(51.0) 111 (51.0)51.0(51.0) 111 (51.0)51.0(51.0)
Total 255725572557 (87.0)87.0(87.0) 141414 (44.1)44.1(44.1) 255725572557 (87.0)87.0(87.0) 252725272527 (86.0)86.0(86.0) 246224622462 (79.5)79.5(79.5) 754675467546 (84.2)84.2(84.2)
product-category meat, egg and dairy products sugars and syrups
1994 - 1998 434343 (32.6)32.6(32.6) 484848 (34.9)34.9(34.9) 555 (46.2)46.2(46.2) 555 (41.8)41.8(41.8) 585858 (36.5)36.5(36.5)
1999 - 2002 373737 (48.6)48.6(48.6) 585858 (47.6)47.6(47.6) 292929 (47.5)47.5(47.5) 434343 (51.8)51.8(51.8) 130130130 (49.0)49.0(49.0)
2003 - 2006 505050 (55.8)55.8(55.8) 898989 (56.0)56.0(56.0) 515151 (59.0)59.0(59.0) 525252 (58.1)58.1(58.1) 192192192 (57.4)57.4(57.4)
2007 - 2010 979797 (76.6)76.6(76.6) 129129129 (75.2)75.2(75.2) 707070 (67.7)67.7(67.7) 120120120 (105.8)105.8(105.8) 319319319 (85.1)85.1(85.1)
2011 - 2014 312312312 (76.8)76.8(76.8) 111 (58.0)58.0(58.0) 398398398 (78.0)78.0(78.0) 222222222 (83.3)83.3(83.3) 214214214 (89.8)89.8(89.8) 834834834 (82.4)82.4(82.4)
2015 - 2018 825825825 (87.1)87.1(87.1) 222 (141.0)141.0(141.0) 117811781178 (87.7)87.7(87.7) 793793793 (88.6)88.6(88.6) 714714714 (84.5)84.5(84.5) 268526852685 (87.1)87.1(87.1)
By Year 2019 - 2022 751751751 (83.0)83.0(83.0) 333 (132.7)132.7(132.7) 118911891189 (84.6)84.6(84.6) 110211021102 (87.1)87.1(87.1) 103710371037 (86.5)86.5(86.5) 332833283328 (86.0)86.0(86.0)
DE 250250250 (63.7)63.7(63.7) 353353353 (63.1)63.1(63.1) 260260260 (56.9)56.9(56.9) 275275275 (52.3)52.3(52.3) 888888888 (57.9)57.9(57.9)
DK 111 (42.0)42.0(42.0) 111 (42.0)42.0(42.0)
EN 186218621862 (83.5)83.5(83.5) 666 (123.0)123.0(123.0) 272927292729 (84.8)84.8(84.8) 200820082008 (89.2)89.2(89.2) 190719071907 (90.6)90.6(90.6) 664466446644 (87.8)87.8(87.8)
FR 333 (76.3)76.3(76.3) 333 (76.3)76.3(76.3) 444 (65.2)65.2(65.2) 111 (85.0)85.0(85.0) 888 (71.9)71.9(71.9)
GR 333 (74.0)74.0(74.0) 111 (47.0)47.0(47.0) 444 (67.2)67.2(67.2)
By Language IT 111 (51.0)51.0(51.0) 111 (51.0)51.0(51.0)
Total 211521152115 (81.1)81.1(81.1) 666 (123.0)123.0(123.0) 308930893089 (82.3)82.3(82.3) 227222722272 (85.4)85.4(85.4) 218521852185 (85.8)85.8(85.8) 754675467546 (84.2)84.2(84.2)
hazard salmonella rhodamine b
1994 - 1998 333 (25.0)25.0(25.0) 161616 (32.4)32.4(32.4) 232323 (35.4)35.4(35.4) 191919 (41.3)41.3(41.3) 585858 (36.5)36.5(36.5)
1999 - 2002 666 (58.7)58.7(58.7) 333333 (48.3)48.3(48.3) 464646 (49.1)49.1(49.1) 515151 (49.2)49.2(49.2) 130130130 (49.0)49.0(49.0)
2003 - 2006 131313 (56.8)56.8(56.8) 474747 (57.9)57.9(57.9) 828282 (59.0)59.0(59.0) 636363 (54.9)54.9(54.9) 192192192 (57.4)57.4(57.4)
2007 - 2010 969696 (105.2)105.2(105.2) 138138138 (97.9)97.9(97.9) 838383 (72.3)72.3(72.3) 989898 (77.9)77.9(77.9) 319319319 (85.1)85.1(85.1)
2011 - 2014 143143143 (104.6)104.6(104.6) 315315315 (92.5)92.5(92.5) 310310310 (76.8)76.8(76.8) 209209209 (75.7)75.7(75.7) 834834834 (82.4)82.4(82.4)
2015 - 2018 288288288 (87.1)87.1(87.1) 111 (95.0)95.0(95.0) 105410541054 (92.5)92.5(92.5) 914914914 (85.0)85.0(85.0) 717717717 (82.1)82.1(82.1) 268526852685 (87.1)87.1(87.1)
By Year 2019 - 2022 393393393 (84.2)84.2(84.2) 106510651065 (87.9)87.9(87.9) 100610061006 (85.6)85.6(85.6) 125712571257 (84.8)84.8(84.8) 332833283328 (86.0)86.0(86.0)
DE 130130130 (52.7)52.7(52.7) 215215215 (57.0)57.0(57.0) 264264264 (60.6)60.6(60.6) 409409409 (56.7)56.7(56.7) 888888888 (57.9)57.9(57.9)
DK 111 (42.0)42.0(42.0) 111 (42.0)42.0(42.0)
EN 812812812 (95.5)95.5(95.5) 111 (95.0)95.0(95.0) 245024502450 (92.3)92.3(92.3) 219321932193 (84.3)84.3(84.3) 200120012001 (86.1)86.1(86.1) 664466446644 (87.8)87.8(87.8)
FR 666 (76.2)76.2(76.2) 222 (59.0)59.0(59.0) 888 (71.9)71.9(71.9)
GR 222 (80.0)80.0(80.0) 111 (62.0)62.0(62.0) 111 (47.0)47.0(47.0) 444 (67.2)67.2(67.2)
By Language IT 111 (51.0)51.0(51.0) 111 (51.0)51.0(51.0)
Total 942942942 (89.6)89.6(89.6) 111 (95.0)95.0(95.0) 266826682668 (89.4)89.4(89.4) 246424642464 (81.8)81.8(81.8) 241424142414 (81.1)81.1(81.1) 754675467546 (84.2)84.2(84.2)
product ice cream canned meat stew
1994 - 1998 333 (48.3)48.3(48.3) 343434 (37.0)37.0(37.0) 181818 (36.9)36.9(36.9) 666 (32.3)32.3(32.3) 585858 (36.5)36.5(36.5)
1999 - 2002 888 (60.0)60.0(60.0) 626262 (49.5)49.5(49.5) 363636 (49.3)49.3(49.3) 323232 (47.4)47.4(47.4) 130130130 (49.0)49.0(49.0)
2003 - 2006 666 (61.7)61.7(61.7) 636363 (59.3)59.3(59.3) 717171 (57.1)57.1(57.1) 585858 (55.7)55.7(55.7) 192192192 (57.4)57.4(57.4)
2007 - 2010 696969 (120.7)120.7(120.7) 163163163 (97.4)97.4(97.4) 818181 (70.1)70.1(70.1) 757575 (74.6)74.6(74.6) 319319319 (85.1)85.1(85.1)
2011 - 2014 454545 (120.8)120.8(120.8) 331331331 (92.2)92.2(92.2) 261261261 (75.0)75.0(75.0) 242242242 (77.1)77.1(77.1) 834834834 (82.4)82.4(82.4)
2015 - 2018 646464 (100.0)100.0(100.0) 930930930 (88.3)88.3(88.3) 861861861 (87.4)87.4(87.4) 894894894 (85.7)85.7(85.7) 268526852685 (87.1)87.1(87.1)
By Year 2019 - 2022 575757 (97.4)97.4(97.4) 111 (90.0)90.0(90.0) 925925925 (90.6)90.6(90.6) 122712271227 (84.4)84.4(84.4) 117611761176 (84.1)84.1(84.1) 332833283328 (86.0)86.0(86.0)
DE 666 (93.5)93.5(93.5) 196196196 (63.9)63.9(63.9) 320320320 (55.4)55.4(55.4) 372372372 (57.0)57.0(57.0) 888888888 (57.9)57.9(57.9)
DK 111 (42.0)42.0(42.0) 111 (42.0)42.0(42.0)
EN 246246246 (106.3)106.3(106.3) 111 (90.0)90.0(90.0) 230923092309 (89.9)89.9(89.9) 222922292229 (86.4)86.4(86.4) 210621062106 (87.0)87.0(87.0) 664466446644 (87.8)87.8(87.8)
FR 222 (87.0)87.0(87.0) 111 (73.0)73.0(73.0) 555 (65.6)65.6(65.6) 888 (71.9)71.9(71.9)
GR 111 (62.0)62.0(62.0) 333 (69.0)69.0(69.0) 444 (67.2)67.2(67.2)
By Language IT 111 (51.0)51.0(51.0) 111 (51.0)51.0(51.0)
Total 252252252 (106.0)106.0(106.0) 111 (90.0)90.0(90.0) 250825082508 (87.9)87.9(87.9) 255525552555 (82.4)82.4(82.4) 248324832483 (82.4)82.4(82.4) 754675467546 (84.2)84.2(84.2)
Table 4: Statistical overview of the data by prediction task. Each cell contains the number of samples in this category as well as the average text length of these samples in characters (in brackets). Empty cells indicate no samples in this category.
Refer to caption
Figure 5: Label co-occurence for the hazard-category and product-category tasks normalized by a) hazard-category, and b) product-category. While this is not true for all the hazard-category-product-category pairs, some show strong linkage.
"Randsland brand Super Salad Kit recalled due to Listeria monocytogenes"
Labels hazard: listeria monocytogenes hazard-category: biological
product: salads product-category: fruits and vegetables
"Create Common Good Recalls Jambalaya Products Due To Misbranding and Undeclared Allergens"
Labels hazard: milk and products thereof hazard-category: allergens
product: meat preparations product-category: meat, egg and dairy products
"Revised Guan’s Mushroom Co Recalls Enoki Because of Possible Health Risk"
Labels hazard: listeria monocytogenes hazard-category: biological
product: mushrooms product-category: fruits and vegetables
"Nestlé Prepared Foods Recalls Lean Cuisine Baked Chicken Meal Products Due to Possible Foreign Matter Contamination"
Labels hazard: plastic fragment hazard-category: foreign bodies
product: cooked chicken product-category: prepared dishes and snacks
"Undeclared allergen (sulphur dioxide and sorbic acid ) found in prepackaged date sample"
Labels hazard: too high content of e 200 - sorbic acid hazard-category: food additives and flavourings
product: dates product-category: fruits and vegetables
Figure 6: Some labeled sample texts. Colored spans signify the spans in hazard-title and product-title

Appendix B Sample Prompts:

GPT-ALL:
We are looking for food hazards in texts. Please predict the correct class for the following sample:
"CSM Bakery Solutions Voluntary Recalls 8" => allergens
"CSM Bakery Solutions’ Voluntary Recall of Cinnabon Stix® Due to Undeclared Peanut Allergen" => allergens
"H-E-B Issues Voluntary Recall On Bakery Products" => biological
"2009 - christie cookie recalls certain lots of peanut butter cookies due to expanded recall by peanut corporation of america" => biological
"Gourmet Culinary Solutions Recalls Turkey Sausage Products Due To Possible Foreign Matter Contamination" => foreign bodies
"Golden Natural Products Inc. Issues Allergy Alert on Undeclared Sulfites in Two Dried Apricot Products" => fraud
"Texas Best Protein DBA Farm to Market Foods Issues Allergy Alert on Undeclared Peanut in Green Bean Casserole" => fraud
"SPAR recalls its SPAR Chicken Tikka Chunks because it may contain small pieces of glass" => foreign bodies
"Lactalis Nestlé Chilled Dairy UK recalls Nescafé Shakissimo Espresso Latte because of contamination with cleaning solution" => chemical
"oriental packing co. inc. issues alert on lead in curry powder" => chemical
"Garden Fortune Cookies" => migration
"Green Field Farms Dairy Issues Voluntary Recall of Whole Chocolate Milk" => other hazard
"Bakery Product - Labelling - Undeclared food additives (Preservative (211) and Colour (129) - 29 November 2010" => food additives and flavourings
"FSIS Issues Public Health Alert for Ready-To-Eat Ham Product Due to Possible Processing Deviation" => other hazard
"Pauls—Breaka chocolate UHT milk" => organoleptic aspects
"Nestle—Billabong chocolate ice cream 8 pack" => organoleptic aspects
"Undeclared allergen (sulphur dioxide and sorbic acid) found in prepackaged date sample" => food additives and flavourings
"Heinz—Baked Beans in Tomato Sauce" => packaging defect
"John West—Scottish sardines In vegetable oil" => packaging defect
"Notos Schafskäse / Bulgarischer Schafskäse in Salzlake gereift 200g" => migration
"CSM Bakery Solutions Issues Allergy Alert on Undeclared Peanut in Chick-Fil-A Chocolate Chunk Cookies" =>
GPT-SIM-k𝑘k:
We are looking for food hazards in texts. Please predict the correct class for the following sample:
k=1𝑘1absentk=\enspace 1\rightarrow "CSM Bakery Solutions Voluntary Recalls 8" => allergens
k=2𝑘2absentk=\enspace 2\rightarrow "CSM Bakery Solutions’ Voluntary Recall of Cinnabon Stix® Due to Undeclared Peanut Allergen" => allergens
k=3𝑘3absentk=\enspace 3\rightarrow "H-E-B Issues Voluntary Recall On Bakery Products" => biological
k=4𝑘4absentk=\enspace 4\rightarrow "2009 - christie cookie recalls certain lots of peanut butter cookies due to expanded recall by peanut corporation of america" => biological
k=5𝑘5absentk=\enspace 5\rightarrow "Gourmet Culinary Solutions Recalls Turkey Sausage Products Due To Possible Foreign Matter Contamination" => foreign bodies
k=6𝑘6absentk=\enspace 6\rightarrow "Golden Natural Products Inc. Issues Allergy Alert on Undeclared Sulfites in Two Dried Apricot Products" => fraud
k=7𝑘7absentk=\enspace 7\rightarrow "Texas Best Protein DBA Farm to Market Foods Issues Allergy Alert on Undeclared Peanut in Green Bean Casserole" => fraud
k=8𝑘8absentk=\enspace 8\rightarrow "SPAR recalls its SPAR Chicken Tikka Chunks because it may contain small pieces of glass" => foreign bodies
k=9𝑘9absentk=\enspace 9\rightarrow "Lactalis Nestlé Chilled Dairy UK recalls Nescafé Shakissimo Espresso Latte because of contamination with cleaning solution" => chemical
k=10𝑘10absentk=10\rightarrow "oriental packing co. inc. issues alert on lead in curry powder" => chemical
"CSM Bakery Solutions Issues Allergy Alert on Undeclared Peanut in Chick-Fil-A Chocolate Chunk Cookies" =>
GPT-MAX-k𝑘k:
We are looking for food hazards in texts. Please predict the correct class for the following sample:
"CSM Bakery Solutions Voluntary Recalls 8" => allergens
k=1𝑘1absentk=1\rightarrow "CSM Bakery Solutions’ Voluntary Recall of Cinnabon Stix® Due to Undeclared Peanut Allergen" => allergens
"Golden Natural Products Inc. Issues Allergy Alert on Undeclared Sulfites in Two Dried Apricot Products" => fraud
k=2𝑘2absentk=2\rightarrow "Texas Best Protein DBA Farm to Market Foods Issues Allergy Alert on Undeclared Peanut in Green Bean Casserole" => fraud
"Heinz—Baked Beans in Tomato Sauce" => packaging defect
k=3𝑘3absentk=3\rightarrow "John West—Scottish sardines In vegetable oil" => packaging defect
"Pauls—Breaka chocolate UHT milk" => organoleptic aspects
k=4𝑘4absentk=4\rightarrow "Nestle—Billabong chocolate ice cream 8 pack" => organoleptic aspects
"Green Field Farms Dairy Issues Voluntary Recall of Whole Chocolate Milk" => other hazard
k=5𝑘5absentk=5\rightarrow "FSIS Issues Public Health Alert for Ready-To-Eat Ham Product Due to Possible Processing Deviation" => other hazard
"CSM Bakery Solutions Issues Allergy Alert on Undeclared Peanut in Chick-Fil-A Chocolate Chunk Cookies" =>
GPT-CICLe:
We are looking for food hazards in texts. Please predict the correct class for the following sample:
"CSM Bakery Solutions Voluntary Recalls 8" => allergens
"CSM Bakery Solutions’ Voluntary Recall of Cinnabon Stix® Due to Undeclared Peanut Allergen" => allergens
"CSM Bakery Solutions Issues Allergy Alert on Undeclared Peanut in Chick-Fil-A Chocolate Chunk Cookies" =>
Table 5: Sample prompts taken from the hazard-category classification task. Example classes are color coded for better visibility. The order of the examples in GPT-ALL and GPT-SIM-k𝑘k is identical, while in GPT-CICLe and GPT-MAX-k𝑘k they are sorted by model certainty (most probable one first).

Appendix C Model Specifics

C.1 Embedings

As discussed in §4, we use two different types of embeddings for our classical models: bag-of-words (BOW) and tf-idf (TF-IDF). For the BOW representation,999We use or own implementation for the representations. we create a vector:

Xi=[xi,1,xi,2,,xi,V],xi,v[0,1]formulae-sequencesubscript𝑋𝑖subscript𝑥𝑖1subscript𝑥𝑖2subscript𝑥𝑖𝑉for-allsubscript𝑥𝑖𝑣01X_{i}=[x_{i,1},x_{i,2},\dots,x_{i,V}],~{}\forall x_{i,v}\in[0,1]

for each sample i𝑖i, where V𝑉V is the vocabulary size, and xi,vsubscript𝑥𝑖𝑣x_{i,v} is the normalized count of occurrences of token v𝑣v in sample i𝑖i. For the TF-IDF-embedding, we calcluate

xi,v=tfi,vidfv,subscript𝑥𝑖𝑣subscripttf𝑖𝑣subscriptidf𝑣x_{i,v}=\mathrm{tf}_{i,v}\cdot\mathrm{idf}_{v},

where tfi,vsubscripttf𝑖𝑣\mathrm{tf}_{i,v} is the count of the samples’ v𝑣v-th token in the i𝑖i-th training sample, and idfv=lnNnvsubscriptidf𝑣𝑁subscript𝑛𝑣\mathrm{idf}_{v}=\ln{\frac{N}{n_{v}}} with nvsubscript𝑛𝑣n_{v} being the number of documents that contain token v𝑣v. In order to make the above embeddings independent of the sample length we normalize Xisubscript𝑋𝑖X_{i} with the L2-norm in both cases. Text pre-processing comprises the application of a TreebankWordTokenizer, followed by PorterStemmer from the NLTK Bird et al. (2009) Python package.

C.2 Traditional Classifiers

Model Task Parameters
BOW-KNN hazard-category [k=2𝑘2k=2] (3×3\times) + [k=4𝑘4k=4] (2×2\times)
product-category [k=2𝑘2k=2] (4×4\times) + [k=4𝑘4k=4] (1×1\times)
hazard [k=2𝑘2k=2] (3×3\times) + [k=4𝑘4k=4] (2×2\times)
product [k=2𝑘2k=2] (3×3\times) + [k=8𝑘8k=8] (2×2\times)
TFIDF-KNN hazard-category [k=4𝑘4k=4] (1×1\times) + [k=8𝑘8k=8] (4×4\times)
product-category [k=2𝑘2k=2] (2×2\times) + [k=4𝑘4k=4] (2×2\times) +
[k=8𝑘8k=8] (1×1\times)
hazard [k=2𝑘2k=2] (1×1\times) + [k=4𝑘4k=4] (1×1\times) +
[k=8𝑘8k=8] (3×3\times)
product [k=2𝑘2k=2] (1×1\times) + [k=4𝑘4k=4] (1×1\times) +
[k=8𝑘8k=8] (3×3\times)
BOW-LR hazard-category [L1, C=2.0𝐶2.0C=2.0] (5×5\times)
product-category [L1, C=2.0𝐶2.0C=2.0] (5×5\times)
hazard [L1, C=2.0𝐶2.0C=2.0] (5×5\times)
product [L1, C=2.0𝐶2.0C=2.0] (5×5\times)
TFIDF-LR hazard-category [L1, C=2.0𝐶2.0C=2.0] (5×5\times)
product-category [L1, C=2.0𝐶2.0C=2.0] (5×5\times)
hazard [L1, C=2.0𝐶2.0C=2.0] (5×5\times)
product [L1, C=2.0𝐶2.0C=2.0] (5×5\times)
BOW-SVM hazard-category [C=2.0𝐶2.0C=2.0] (5×5\times)
product-category [C=2.0𝐶2.0C=2.0] (5×5\times)
hazard [C=2.0𝐶2.0C=2.0] (5×5\times)
product [C=2.0𝐶2.0C=2.0] (5×5\times)
TFIDF-SVM hazard-category [C=1.0𝐶1.0C=1.0] (1×1\times) + [C=2.0𝐶2.0C=2.0] (4×4\times)
product-category [C=2.0𝐶2.0C=2.0] (5×5\times)
hazard [C=2.0𝐶2.0C=2.0] (5×5\times)
product [C=2.0𝐶2.0C=2.0] (5×5\times)
Table 6: Parameters of Traditional Classifiers

As already discussed in §4, we optimze the models trained on each of our 555 CV splits on a calibration set created using 10%percent1010\% holdout on the respective training data. We optimize… k{2,4,8}𝑘248k\in\{2,4,8\} neighbours for KNN C{0.5,1.0,2.0}𝐶0.51.02.0C\in\{0.5,1.0,2.0\} for both L1 and L2 for LR C{0.5,1.0,2.0}𝐶0.51.02.0C\in\{0.5,1.0,2.0\} for SVM The best values found for each of the splits are reported in Table 6. Apart from KNN, we find stable sets of parameters for the best performance during grid search.

C.3 Encoder-only-Transformers

Refer to caption
Refer to caption
Figure 7: Learning curves of fine-tuning of RoBERTa and XLM-R averaged over 5 CV-splits.

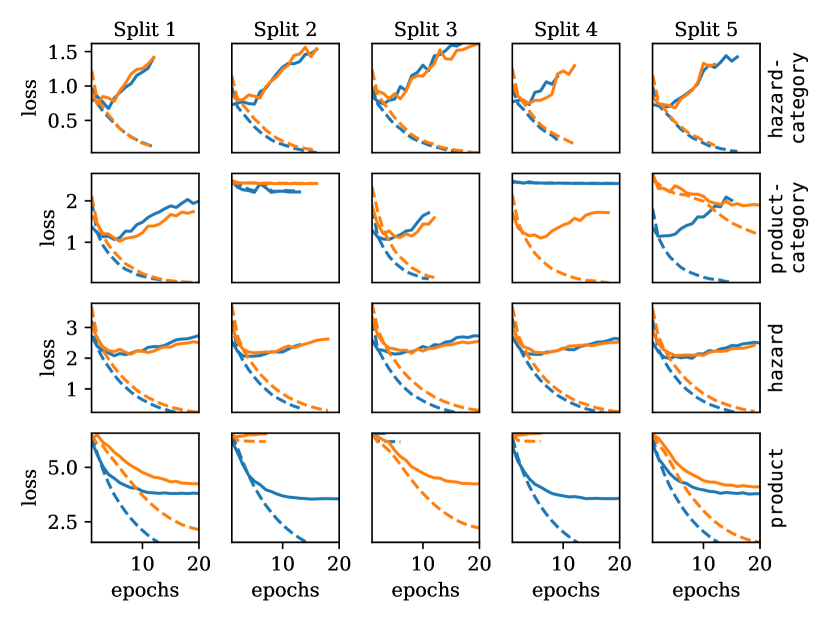
For fine-tuning RoBERTa and XLM-R we use a learning rate of 51055superscript1055\cdot 10^{-5} as well as a batch size of 161616. Instead of grid searching for the best parameter we employ early stopping at the minimum validation loss with a patience of 555 epochs. As the average learning curves in Figure 7 show, product-category and product are harder to learn, as for some of the splits the curves show no progression. For the remaining models we reach the mininmum validation loss at an epoch of 5 on average.

C.4 CICLe

As we are aiming for a low set size, we select the α𝛼\alpha based on Figure 4. For hazard-category and product-category, we choose α=0.05𝛼0.05\alpha=0.05 (meaning p=0.95𝑝0.95p=0.95), as even for this high accuracy we get set sizes smaller than 101010. For the remaining classification tasks we are limited by set length and choose α=0.20𝛼0.20\alpha=0.20 for hazard and α=0.40𝛼0.40\alpha=0.40 for product. This means, that for product we have to accept a chance of at most 40%percent4040\% that the prediction set does not contain the ground truth in order to keep the set size low. This results in on average 2.62.62.6 classes per prompt in hazard-category, 5.35.35.3 classes per prompt in product-category, 4.74.74.7 classes per prompt in hazard, and 6.76.76.7 classes per prompt in product.

Appendix D Extended Results

In this appendix, we present additional results not included in the main paper. Tables 8 and 9 show additional metrics (micro-F1subscript𝐹1F_{1}, macro-precision, and macro-recall), as well as the bag-of-word (BOW) based classifiers. Table 7 compares macro-F1subscript𝐹1F_{1} of RoBERTa and XLM-R on the two most represented languages in our data: English and German. We refer to §5 for a discussion of the aforementioned tables.

D.1 Theoretical boundaries on prompting performance

In Table 10 we present upper and lower bounds on the performance of our prompting strategies. In order to estimate the upper bounds (*-MAX), we assume that the LLM predicts the true class every time it is included in the prompt, and otherwise, the class of a random sample in the prompt. As is to be expected, the highest upper bound is always taken by the *-ALL prompts, as they include all classes in the training set. Note that for hazard and product the maximum scores are <1absent1<1, indicating that not all classes are present in the training data. This is a consequence of the low class support for some of the classes, which can not be divided into the five CV-splits. On our data, the reduction mostly affects the low-support classes, as they make up the bulk of the data but have a low number of tetxs per class. This means there is a higher possibility of completely removing them from the prompt compared to the other segments. Maximum performance on high support classes remains almost untouched by the reduction as they are very unlikely to be completely removed from the prompts.

For the lower bounds (MIN-*), we simply use the class of a random few-shot-sample in each prompt as the prediction. Here we assume that an LLM never predicts worse than random. The best minimum performance is delivered by CICLe most of the time, indicating that it produces short prompts with a high probability of containing the true class.

D.2 Analysis of prompting failures

We also provide a qualitative assessment of why prompting fails to produce a valid class label in some cases. Based on our experiments, we identified three reasons for failures:

  1. 1.

    Insufficient information in the sample for determining a class. In such cases, we found that the output of GPT explicitly states the problem. For example, consider the following texts and the corresponding LLM outputs for prompting on the hazard task: text: "Li Li Handmade Chicken and Pork Dumplings" output: "none (no food hazards mentioned)" text: "The Double Cola Company Recalls Select Cases of Its Cherry Ski Product" output: "none" text: "The Original Smoke and Spice Co Sea Salt Gourmet Seasoning" output: "none (no food hazards mentioned)" None of the above examples contain a food hazard. GPT therefore states the lack of evidence which does not lead to a valid class label. We argue that in a real-world scenario, this is a strength rather than a weakness, as it can help avoid misclassification.

  2. 2.

    The text contains more than one possible class. In such cases, we found that the LLM produces a mix of labels: text: "Bravo Packing, Inc. Recalls All Performance Dog and Ground Beef Raw Pet Food Because of Possible Salmonella and Listeria Monocytogenes Health Risk to Humans and Animals" class: "listeria monocytogenes" output: "salmonella and listeria monocytogenes" text: "Exceptional Health Products Issues Allergy Alert On Undeclared Soy And Milk Allergens In Angel Wings 99- Daily Multi 120 Capsules" class: "milk and products thereof" output: "soybeans and products thereof, milk and products thereof" text: "Great Value brand Spaghetti Marinara recalled due to undeclared milk and sulphites" class: "milk and products thereof" output: "milk and products thereof, sulphur dioxide and sulphites" The above examples are again for prompting on the hazard task. The texts contain multiple food hazards, which are combined by the LLM. Again, this can be seen as a strength of prompting rather than a weakness.

  3. 3.

    Too few few-shot-examples per class in the prompt. In Table 2 we see a high failure rate for the GPT-SIM-k𝑘k prompts in product. A closer look at GPT’s failed responses to these prompts shows the following: text: "New American Food Products LLC Issues Allergy Alert on Undeclared Milk in Packaged Goods Received From Our Supplier GKI Foods." class: "dark chocolate coated almonds" output: "dairy products" text: "Keats London Vegan Irish Cream Truffles 140g" class: "chocolate truffles" output: "vegan truffles" text: "New York Firm Recalls Boneless Veal Products Due To Possible E. Coli Contamination" class: "veal" output: "veal products" In these cases, the LLM is not able to reproduce the exact label although it often finds the right product. We argue that because of the low number of samples per class, the LLM is not able to capture the context.

The above samples show, that prompting failures are not necessarily a sign of bad performance (see cases 1. and 2.). In cases where the model is unable to capture the context (e.g. case 3.), better prompt design can help reduce the failure rate.

D.3 Confusion Matrices:

Predicted Class

True Class

HighMediumLowHighMediumLow

High

Medium

Low

Refer to captionRefer to caption

hazard-category

High

Medium

Low

Refer to captionRefer to caption

product-category

High

Medium

Low

Refer to captionRefer to caption

hazard

High

Medium

Low

Refer to captionRefer to caption

product

TF-IDF-LRGPT-CICLe
Figure 8: Confusion Matrices for all four prediction tasks. Classes were grouped by class support as shown in Figure 2.

In order to further analyze how prompting performs compared to other classifiers, we plotted confusion matrices of the best non-prompting-classifier (TF-IDF-LR) and GPT-CICLe in Figure 8. To achieve a better representation, we grouped classes based on the support zones introduced in the paper.

The figure shows, that while GPT-CICLe is generally worse than TF-IDF-LR in correctly predicting classes with high support, it performs much better on classes with low support. The latter are usually a problem for ML classifiers, as the impact of the few samples that are seen during training is usually overruled by the more supported classes.

TF-IDF-LR is generally more likely to wrongly predict samples to classes with higher support. This is natural, as we do not apply rebalancing techniques during training. For GPT-CICLe, however, this behavior is less evident. We surmise, that the LLM’s lower need for training samples is able to balance out this shortcoming of TF-IDF-LR which is used as a basis of GPT-CICLe.

English German
Model F1subscript𝐹1F_{1} (micro) F1subscript𝐹1F_{1} (micro) F1subscript𝐹1F_{1} (micro) F1subscript𝐹1F_{1} (macro)
hazard-category 101010 classes
RoBERTa 0.830.83\bf 0.83 ±0.01plus-or-minus0.01\bf\pm 0.01 0.570.57\bf 0.57 ±0.03plus-or-minus0.03\bf\pm 0.03 0.390.39\bf 0.39 ±0.03plus-or-minus0.03\bf\pm 0.03 0.130.130.13 ±0.02plus-or-minus0.02\pm 0.02
XLM-R 0.820.820.82 ±0.01plus-or-minus0.01\pm 0.01 0.530.530.53 ±0.02plus-or-minus0.02\pm 0.02 0.370.370.37 ±0.06plus-or-minus0.06\pm 0.06 0.160.16\bf 0.16 ±0.04plus-or-minus0.04\bf\pm 0.04
product-category 222222 classes
RoBERTa 0.560.560.56 ±0.22plus-or-minus0.22\pm 0.22 0.310.310.31 ±0.23plus-or-minus0.23\pm 0.23 0.410.410.41 ±0.10plus-or-minus0.10\pm 0.10 0.150.150.15 ±0.10plus-or-minus0.10\pm 0.10
XLM-R 0.610.61\bf 0.61 ±0.17plus-or-minus0.17\bf\pm 0.17 0.370.37\bf 0.37 ±0.21plus-or-minus0.21\bf\pm 0.21 0.470.47\bf 0.47 ±0.13plus-or-minus0.13\bf\pm 0.13 0.200.20\bf 0.20 ±0.11plus-or-minus0.11\bf\pm 0.11
hazard 797979 / 261261261 classes
RoBERTa 0.650.65\bf 0.65 ±0.02plus-or-minus0.02\bf\pm 0.02 0.380.38\bf 0.38 ±0.03plus-or-minus0.03\bf\pm 0.03 0.260.26\bf 0.26 ±0.03plus-or-minus0.03\bf\pm 0.03 0.060.06\bf 0.06 ±0.00plus-or-minus0.00\bf\pm 0.00
XLM-R 0.640.640.64 ±0.03plus-or-minus0.03\pm 0.03 0.360.360.36 ±0.04plus-or-minus0.04\pm 0.04 0.260.26\bf 0.26 ±0.01plus-or-minus0.01\bf\pm 0.01 0.050.050.05 ±0.00plus-or-minus0.00\pm 0.00
product 184184184 / 125612561256 classes
RoBERTa 0.530.53\bf 0.53 ±0.19plus-or-minus0.19\bf\pm 0.19 0.430.43\bf 0.43 ±0.17plus-or-minus0.17\bf\pm 0.17 0.360.36\bf 0.36 ±0.14plus-or-minus0.14\bf\pm 0.14 0.100.10\bf 0.10 ±0.04plus-or-minus0.04\bf\pm 0.04
XLM-R 0.390.390.39 ±0.28plus-or-minus0.28\pm 0.28 0.280.280.28 ±0.22plus-or-minus0.22\pm 0.22 0.250.250.25 ±0.18plus-or-minus0.18\pm 0.18 0.060.060.06 ±0.05plus-or-minus0.05\pm 0.05
Table 7: Average model F1subscript𝐹1F_{1} and mean deviation over 5 CV-splits on texts in the two most common languages. Blue cells highlight the best score per column and language. For hazard and product we report performance on well-supported classes only.
Scores (all classes) Scores (𝒞highsubscript𝒞𝑖𝑔\mathcal{C}_{high}) Scores (𝒞lowsubscript𝒞𝑙𝑜𝑤\mathcal{C}_{low})
Model F1subscript𝐹1F_{1} (micro) F1subscript𝐹1F_{1} Precision Recall F1subscript𝐹1F_{1} (micro) F1subscript𝐹1F_{1} Precision Recall F1subscript𝐹1F_{1} (micro) F1subscript𝐹1F_{1} Precision Recall
hazard-category 101010 classes
RANDOM 0.340.34\bf 0.34 ±0.01plus-or-minus0.01\bf\pm 0.01 0.080.08\bf 0.08 ±0.00plus-or-minus0.00\bf\pm 0.00 0.070.07\bf 0.07 ±0.00plus-or-minus0.00\bf\pm 0.00 0.100.10\bf 0.10 ±0.00plus-or-minus0.00\bf\pm 0.00 0.500.500.50 ±0.01plus-or-minus0.01\pm 0.01 0.330.330.33 ±0.00plus-or-minus0.00\pm 0.00 0.500.500.50 ±0.00plus-or-minus0.00\pm 0.00 0.250.250.25 ±0.00plus-or-minus0.00\pm 0.00 0.000.00\bf 0.00 ±0.00plus-or-minus0.00\bf\pm 0.00 0.000.00\bf 0.00 ±0.00plus-or-minus0.00\bf\pm 0.00 0.000.00\bf 0.00 ±0.00plus-or-minus0.00\bf\pm 0.00 0.000.00\bf 0.00 ±0.00plus-or-minus0.00\bf\pm 0.00
MAJORITY 0.340.34\bf 0.34 ±0.00plus-or-minus0.00\bf\pm 0.00 0.050.050.05 ±0.00plus-or-minus0.00\pm 0.00 0.030.030.03 ±0.00plus-or-minus0.00\pm 0.00 0.100.10\bf 0.10 ±0.00plus-or-minus0.00\bf\pm 0.00 1.001.00\bf 1.00 ±0.00plus-or-minus0.00\bf\pm 0.00 1.001.00\bf 1.00 ±0.00plus-or-minus0.00\bf\pm 0.00 1.001.00\bf 1.00 ±0.00plus-or-minus0.00\bf\pm 0.00 1.001.00\bf 1.00 ±0.00plus-or-minus0.00\bf\pm 0.00 0.000.00\bf 0.00 ±0.00plus-or-minus0.00\bf\pm 0.00 0.000.00\bf 0.00 ±0.00plus-or-minus0.00\bf\pm 0.00 0.000.00\bf 0.00 ±0.00plus-or-minus0.00\bf\pm 0.00 0.000.00\bf 0.00 ±0.00plus-or-minus0.00\bf\pm 0.00
BOW-KNN 0.730.730.73 ±0.01plus-or-minus0.01\pm 0.01 0.460.460.46 ±0.01plus-or-minus0.01\pm 0.01 0.640.640.64 ±0.03plus-or-minus0.03\pm 0.03 0.410.410.41 ±0.01plus-or-minus0.01\pm 0.01 0.860.860.86 ±0.01plus-or-minus0.01\pm 0.01 0.460.460.46 ±0.00plus-or-minus0.00\pm 0.00 0.500.50\bf 0.50 ±0.00plus-or-minus0.00\bf\pm 0.00 0.430.430.43 ±0.01plus-or-minus0.01\pm 0.01 0.570.570.57 ±0.02plus-or-minus0.02\pm 0.02 0.390.390.39 ±0.00plus-or-minus0.00\pm 0.00 0.700.700.70 ±0.04plus-or-minus0.04\pm 0.04 0.290.290.29 ±0.01plus-or-minus0.01\pm 0.01
BOW-LR 0.760.760.76 ±0.01plus-or-minus0.01\pm 0.01 0.520.520.52 ±0.02plus-or-minus0.02\pm 0.02 0.670.67\bf 0.67 ±0.01plus-or-minus0.01\bf\pm 0.01 0.470.470.47 ±0.02plus-or-minus0.02\pm 0.02 0.910.91\bf 0.91 ±0.01plus-or-minus0.01\bf\pm 0.01 0.480.48\bf 0.48 ±0.00plus-or-minus0.00\bf\pm 0.00 0.500.50\bf 0.50 ±0.00plus-or-minus0.00\bf\pm 0.00 0.450.450.45 ±0.00plus-or-minus0.00\pm 0.00 0.640.640.64 ±0.01plus-or-minus0.01\pm 0.01 0.470.470.47 ±0.03plus-or-minus0.03\pm 0.03 0.710.710.71 ±0.02plus-or-minus0.02\pm 0.02 0.360.360.36 ±0.03plus-or-minus0.03\pm 0.03
BOW-SVM 0.790.79\bf 0.79 ±0.01plus-or-minus0.01\bf\pm 0.01 0.570.570.57 ±0.03plus-or-minus0.03\pm 0.03 0.660.660.66 ±0.02plus-or-minus0.02\pm 0.02 0.530.530.53 ±0.03plus-or-minus0.03\pm 0.03 0.900.900.90 ±0.02plus-or-minus0.02\pm 0.02 0.470.470.47 ±0.01plus-or-minus0.01\pm 0.01 0.500.50\bf 0.50 ±0.00plus-or-minus0.00\bf\pm 0.00 0.450.450.45 ±0.01plus-or-minus0.01\pm 0.01 0.690.690.69 ±0.01plus-or-minus0.01\pm 0.01 0.530.530.53 ±0.03plus-or-minus0.03\pm 0.03 0.710.710.71 ±0.04plus-or-minus0.04\pm 0.04 0.440.440.44 ±0.03plus-or-minus0.03\pm 0.03
TF-IDF-KNN 0.700.700.70 ±0.01plus-or-minus0.01\pm 0.01 0.470.470.47 ±0.02plus-or-minus0.02\pm 0.02 0.640.640.64 ±0.02plus-or-minus0.02\pm 0.02 0.410.410.41 ±0.02plus-or-minus0.02\pm 0.02 0.820.820.82 ±0.01plus-or-minus0.01\pm 0.01 0.450.450.45 ±0.00plus-or-minus0.00\pm 0.00 0.500.50\bf 0.50 ±0.00plus-or-minus0.00\bf\pm 0.00 0.410.410.41 ±0.01plus-or-minus0.01\pm 0.01 0.560.560.56 ±0.03plus-or-minus0.03\pm 0.03 0.410.410.41 ±0.03plus-or-minus0.03\pm 0.03 0.690.690.69 ±0.03plus-or-minus0.03\pm 0.03 0.300.300.30 ±0.03plus-or-minus0.03\pm 0.03
TF-IDF-LR 0.780.780.78 ±0.01plus-or-minus0.01\pm 0.01 0.550.550.55 ±0.01plus-or-minus0.01\pm 0.01 0.670.67\bf 0.67 ±0.02plus-or-minus0.02\bf\pm 0.02 0.490.490.49 ±0.02plus-or-minus0.02\pm 0.02 0.910.91\bf 0.91 ±0.01plus-or-minus0.01\bf\pm 0.01 0.480.48\bf 0.48 ±0.00plus-or-minus0.00\bf\pm 0.00 0.500.50\bf 0.50 ±0.00plus-or-minus0.00\bf\pm 0.00 0.460.46\bf 0.46 ±0.00plus-or-minus0.00\bf\pm 0.00 0.650.650.65 ±0.01plus-or-minus0.01\pm 0.01 0.500.500.50 ±0.02plus-or-minus0.02\pm 0.02 0.720.72\bf 0.72 ±0.03plus-or-minus0.03\bf\pm 0.03 0.390.390.39 ±0.02plus-or-minus0.02\pm 0.02
TF-IDF-SVM 0.790.79\bf 0.79 ±0.01plus-or-minus0.01\bf\pm 0.01 0.580.58\bf 0.58 ±0.01plus-or-minus0.01\bf\pm 0.01 0.640.640.64 ±0.03plus-or-minus0.03\pm 0.03 0.550.55\bf 0.55 ±0.01plus-or-minus0.01\bf\pm 0.01 0.880.880.88 ±0.01plus-or-minus0.01\pm 0.01 0.470.470.47 ±0.00plus-or-minus0.00\pm 0.00 0.500.50\bf 0.50 ±0.00plus-or-minus0.00\bf\pm 0.00 0.440.440.44 ±0.01plus-or-minus0.01\pm 0.01 0.700.70\bf 0.70 ±0.01plus-or-minus0.01\bf\pm 0.01 0.560.56\bf 0.56 ±0.01plus-or-minus0.01\bf\pm 0.01 0.710.710.71 ±0.04plus-or-minus0.04\pm 0.04 0.470.47\bf 0.47 ±0.01plus-or-minus0.01\bf\pm 0.01
RoBERTa 0.780.78\bf 0.78 ±0.01plus-or-minus0.01\bf\pm 0.01 0.510.51\bf 0.51 ±0.03plus-or-minus0.03\bf\pm 0.03 0.640.64\bf 0.64 ±0.02plus-or-minus0.02\bf\pm 0.02 0.470.47\bf 0.47 ±0.03plus-or-minus0.03\bf\pm 0.03 0.890.890.89 ±0.03plus-or-minus0.03\pm 0.03 0.470.470.47 ±0.01plus-or-minus0.01\pm 0.01 0.500.50\bf 0.50 ±0.00plus-or-minus0.00\bf\pm 0.00 0.440.440.44 ±0.02plus-or-minus0.02\pm 0.02 0.650.65\bf 0.65 ±0.04plus-or-minus0.04\bf\pm 0.04 0.450.45\bf 0.45 ±0.04plus-or-minus0.04\bf\pm 0.04 0.660.66\bf 0.66 ±0.04plus-or-minus0.04\bf\pm 0.04 0.360.36\bf 0.36 ±0.05plus-or-minus0.05\bf\pm 0.05
XLM-R 0.770.770.77 ±0.01plus-or-minus0.01\pm 0.01 0.490.490.49 ±0.02plus-or-minus0.02\pm 0.02 0.610.610.61 ±0.03plus-or-minus0.03\pm 0.03 0.450.450.45 ±0.03plus-or-minus0.03\pm 0.03 0.900.90\bf 0.90 ±0.02plus-or-minus0.02\bf\pm 0.02 0.470.47\bf 0.47 ±0.01plus-or-minus0.01\bf\pm 0.01 0.500.50\bf 0.50 ±0.00plus-or-minus0.00\bf\pm 0.00 0.450.45\bf 0.45 ±0.01plus-or-minus0.01\bf\pm 0.01 0.640.640.64 ±0.03plus-or-minus0.03\pm 0.03 0.420.420.42 ±0.03plus-or-minus0.03\pm 0.03 0.620.620.62 ±0.04plus-or-minus0.04\pm 0.04 0.340.340.34 ±0.04plus-or-minus0.04\pm 0.04
GPT-ALL 0.760.76\bf 0.76 ±0.01plus-or-minus0.01\bf\pm 0.01 0.560.56\bf 0.56 ±0.03plus-or-minus0.03\bf\pm 0.03 0.620.62\bf 0.62 ±0.03plus-or-minus0.03\bf\pm 0.03 0.560.56\bf 0.56 ±0.04plus-or-minus0.04\bf\pm 0.04 0.820.82\bf 0.82 ±0.02plus-or-minus0.02\bf\pm 0.02 0.450.45\bf 0.45 ±0.01plus-or-minus0.01\bf\pm 0.01 0.410.41\bf 0.41 ±0.01plus-or-minus0.01\bf\pm 0.01 0.500.50\bf 0.50 ±0.00plus-or-minus0.00\bf\pm 0.00 0.680.68\bf 0.68 ±0.02plus-or-minus0.02\bf\pm 0.02 0.570.57\bf 0.57 ±0.05plus-or-minus0.05\bf\pm 0.05 0.570.57\bf 0.57 ±0.04plus-or-minus0.04\bf\pm 0.04 0.620.62\bf 0.62 ±0.06plus-or-minus0.06\bf\pm 0.06
product-category 222222 classes
RANDOM 0.080.080.08 ±0.00plus-or-minus0.00\pm 0.00 0.010.01\bf 0.01 ±0.00plus-or-minus0.00\bf\pm 0.00 0.010.01\bf 0.01 ±0.00plus-or-minus0.00\bf\pm 0.00 0.050.05\bf 0.05 ±0.00plus-or-minus0.00\bf\pm 0.00 0.220.220.22 ±0.01plus-or-minus0.01\pm 0.01 0.200.200.20 ±0.01plus-or-minus0.01\pm 0.01 0.170.17\bf 0.17 ±0.01plus-or-minus0.01\bf\pm 0.01 0.260.260.26 ±0.01plus-or-minus0.01\pm 0.01 0.030.03\bf 0.03 ±0.00plus-or-minus0.00\bf\pm 0.00 0.010.01\bf 0.01 ±0.00plus-or-minus0.00\bf\pm 0.00 0.000.00\bf 0.00 ±0.00plus-or-minus0.00\bf\pm 0.00 0.040.04\bf 0.04 ±0.00plus-or-minus0.00\bf\pm 0.00
MAJORITY 0.130.13\bf 0.13 ±0.00plus-or-minus0.00\bf\pm 0.00 0.010.01\bf 0.01 ±0.00plus-or-minus0.00\bf\pm 0.00 0.010.01\bf 0.01 ±0.00plus-or-minus0.00\bf\pm 0.00 0.050.05\bf 0.05 ±0.00plus-or-minus0.00\bf\pm 0.00 0.320.32\bf 0.32 ±0.00plus-or-minus0.00\bf\pm 0.00 0.240.24\bf 0.24 ±0.00plus-or-minus0.00\bf\pm 0.00 0.160.160.16 ±0.00plus-or-minus0.00\pm 0.00 0.500.50\bf 0.50 ±0.00plus-or-minus0.00\bf\pm 0.00 0.000.000.00 ±0.00plus-or-minus0.00\pm 0.00 0.000.000.00 ±0.00plus-or-minus0.00\pm 0.00 0.000.00\bf 0.00 ±0.00plus-or-minus0.00\bf\pm 0.00 0.000.000.00 ±0.00plus-or-minus0.00\pm 0.00
BOW-KNN 0.500.500.50 ±0.01plus-or-minus0.01\pm 0.01 0.350.350.35 ±0.02plus-or-minus0.02\pm 0.02 0.400.400.40 ±0.03plus-or-minus0.03\pm 0.03 0.350.350.35 ±0.02plus-or-minus0.02\pm 0.02 0.760.760.76 ±0.01plus-or-minus0.01\pm 0.01 0.730.730.73 ±0.02plus-or-minus0.02\pm 0.02 0.830.830.83 ±0.02plus-or-minus0.02\pm 0.02 0.650.650.65 ±0.02plus-or-minus0.02\pm 0.02 0.520.520.52 ±0.03plus-or-minus0.03\pm 0.03 0.380.380.38 ±0.03plus-or-minus0.03\pm 0.03 0.540.540.54 ±0.02plus-or-minus0.02\pm 0.02 0.310.310.31 ±0.03plus-or-minus0.03\pm 0.03
BOW-LR 0.690.690.69 ±0.01plus-or-minus0.01\pm 0.01 0.490.490.49 ±0.03plus-or-minus0.03\pm 0.03 0.590.590.59 ±0.03plus-or-minus0.03\pm 0.03 0.450.450.45 ±0.02plus-or-minus0.02\pm 0.02 0.890.890.89 ±0.01plus-or-minus0.01\pm 0.01 0.860.860.86 ±0.02plus-or-minus0.02\pm 0.02 0.940.940.94 ±0.01plus-or-minus0.01\pm 0.01 0.800.800.80 ±0.02plus-or-minus0.02\pm 0.02 0.690.690.69 ±0.02plus-or-minus0.02\pm 0.02 0.460.460.46 ±0.04plus-or-minus0.04\pm 0.04 0.650.650.65 ±0.05plus-or-minus0.05\pm 0.05 0.370.370.37 ±0.03plus-or-minus0.03\pm 0.03
BOW-SVM 0.700.700.70 ±0.01plus-or-minus0.01\pm 0.01 0.540.540.54 ±0.03plus-or-minus0.03\pm 0.03 0.610.610.61 ±0.04plus-or-minus0.04\pm 0.04 0.500.500.50 ±0.03plus-or-minus0.03\pm 0.03 0.890.890.89 ±0.01plus-or-minus0.01\pm 0.01 0.860.860.86 ±0.01plus-or-minus0.01\pm 0.01 0.940.940.94 ±0.01plus-or-minus0.01\pm 0.01 0.790.790.79 ±0.01plus-or-minus0.01\pm 0.01 0.720.720.72 ±0.02plus-or-minus0.02\pm 0.02 0.520.520.52 ±0.05plus-or-minus0.05\pm 0.05 0.700.700.70 ±0.05plus-or-minus0.05\pm 0.05 0.440.440.44 ±0.05plus-or-minus0.05\pm 0.05
TF-IDF-KNN 0.570.570.57 ±0.02plus-or-minus0.02\pm 0.02 0.420.420.42 ±0.03plus-or-minus0.03\pm 0.03 0.490.490.49 ±0.05plus-or-minus0.05\pm 0.05 0.390.390.39 ±0.02plus-or-minus0.02\pm 0.02 0.810.810.81 ±0.01plus-or-minus0.01\pm 0.01 0.780.780.78 ±0.01plus-or-minus0.01\pm 0.01 0.870.870.87 ±0.01plus-or-minus0.01\pm 0.01 0.710.710.71 ±0.01plus-or-minus0.01\pm 0.01 0.600.600.60 ±0.02plus-or-minus0.02\pm 0.02 0.430.430.43 ±0.04plus-or-minus0.04\pm 0.04 0.620.620.62 ±0.06plus-or-minus0.06\pm 0.06 0.350.350.35 ±0.03plus-or-minus0.03\pm 0.03
TF-IDF-LR 0.710.710.71 ±0.01plus-or-minus0.01\pm 0.01 0.520.520.52 ±0.02plus-or-minus0.02\pm 0.02 0.610.610.61 ±0.03plus-or-minus0.03\pm 0.03 0.480.480.48 ±0.02plus-or-minus0.02\pm 0.02 0.900.90\bf 0.90 ±0.00plus-or-minus0.00\bf\pm 0.00 0.870.87\bf 0.87 ±0.01plus-or-minus0.01\bf\pm 0.01 0.940.940.94 ±0.01plus-or-minus0.01\pm 0.01 0.810.81\bf 0.81 ±0.01plus-or-minus0.01\bf\pm 0.01 0.720.720.72 ±0.02plus-or-minus0.02\pm 0.02 0.490.490.49 ±0.04plus-or-minus0.04\pm 0.04 0.680.680.68 ±0.05plus-or-minus0.05\pm 0.05 0.400.400.40 ±0.04plus-or-minus0.04\pm 0.04
TF-IDF-SVM 0.730.73\bf 0.73 ±0.01plus-or-minus0.01\bf\pm 0.01 0.590.59\bf 0.59 ±0.01plus-or-minus0.01\bf\pm 0.01 0.640.64\bf 0.64 ±0.02plus-or-minus0.02\bf\pm 0.02 0.560.56\bf 0.56 ±0.02plus-or-minus0.02\bf\pm 0.02 0.890.890.89 ±0.01plus-or-minus0.01\pm 0.01 0.860.860.86 ±0.01plus-or-minus0.01\pm 0.01 0.950.95\bf 0.95 ±0.01plus-or-minus0.01\bf\pm 0.01 0.790.790.79 ±0.01plus-or-minus0.01\pm 0.01 0.770.77\bf 0.77 ±0.01plus-or-minus0.01\bf\pm 0.01 0.590.59\bf 0.59 ±0.01plus-or-minus0.01\bf\pm 0.01 0.760.76\bf 0.76 ±0.02plus-or-minus0.02\bf\pm 0.02 0.520.52\bf 0.52 ±0.02plus-or-minus0.02\bf\pm 0.02
RoBERTa 0.540.540.54 ±0.21plus-or-minus0.21\pm 0.21 0.300.300.30 ±0.22plus-or-minus0.22\pm 0.22 0.330.330.33 ±0.25plus-or-minus0.25\pm 0.25 0.300.300.30 ±0.20plus-or-minus0.20\pm 0.20 0.810.810.81 ±0.10plus-or-minus0.10\pm 0.10 0.680.680.68 ±0.22plus-or-minus0.22\pm 0.22 0.710.710.71 ±0.30plus-or-minus0.30\pm 0.30 0.680.680.68 ±0.14plus-or-minus0.14\pm 0.14 0.420.420.42 ±0.34plus-or-minus0.34\pm 0.34 0.260.260.26 ±0.21plus-or-minus0.21\pm 0.21 0.340.340.34 ±0.27plus-or-minus0.27\pm 0.27 0.230.230.23 ±0.18plus-or-minus0.18\pm 0.18
XLM-R 0.590.59\bf 0.59 ±0.16plus-or-minus0.16\bf\pm 0.16 0.350.35\bf 0.35 ±0.20plus-or-minus0.20\bf\pm 0.20 0.370.37\bf 0.37 ±0.22plus-or-minus0.22\bf\pm 0.22 0.350.35\bf 0.35 ±0.18plus-or-minus0.18\bf\pm 0.18 0.850.85\bf 0.85 ±0.07plus-or-minus0.07\bf\pm 0.07 0.780.78\bf 0.78 ±0.15plus-or-minus0.15\bf\pm 0.15 0.830.83\bf 0.83 ±0.20plus-or-minus0.20\bf\pm 0.20 0.740.74\bf 0.74 ±0.11plus-or-minus0.11\bf\pm 0.11 0.490.49\bf 0.49 ±0.25plus-or-minus0.25\bf\pm 0.25 0.300.30\bf 0.30 ±0.20plus-or-minus0.20\bf\pm 0.20 0.390.39\bf 0.39 ±0.25plus-or-minus0.25\bf\pm 0.25 0.270.27\bf 0.27 ±0.17plus-or-minus0.17\bf\pm 0.17
GPT-ALL 0.750.75\bf 0.75 ±0.01plus-or-minus0.01\bf\pm 0.01 0.690.69\bf 0.69 ±0.02plus-or-minus0.02\bf\pm 0.02 0.700.70\bf 0.70 ±0.02plus-or-minus0.02\bf\pm 0.02 0.740.74\bf 0.74 ±0.02plus-or-minus0.02\bf\pm 0.02 0.860.86\bf 0.86 ±0.00plus-or-minus0.00\bf\pm 0.00 0.840.84\bf 0.84 ±0.01plus-or-minus0.01\bf\pm 0.01 0.740.74\bf 0.74 ±0.01plus-or-minus0.01\bf\pm 0.01 0.990.99\bf 0.99 ±0.00plus-or-minus0.00\bf\pm 0.00 0.800.80\bf 0.80 ±0.01plus-or-minus0.01\bf\pm 0.01 0.730.73\bf 0.73 ±0.02plus-or-minus0.02\bf\pm 0.02 0.680.68\bf 0.68 ±0.02plus-or-minus0.02\bf\pm 0.02 0.830.83\bf 0.83 ±0.02plus-or-minus0.02\bf\pm 0.02
hazard 261261261 classes
RANDOM 0.000.00\bf 0.00 ±0.00plus-or-minus0.00\bf\pm 0.00 0.000.00\bf 0.00 ±0.00plus-or-minus0.00\bf\pm 0.00 0.000.00\bf 0.00 ±0.00plus-or-minus0.00\bf\pm 0.00 0.000.00\bf 0.00 ±0.00plus-or-minus0.00\bf\pm 0.00 0.000.00\bf 0.00 ±0.00plus-or-minus0.00\bf\pm 0.00 0.000.00\bf 0.00 ±0.00plus-or-minus0.00\bf\pm 0.00 0.000.00\bf 0.00 ±0.00plus-or-minus0.00\bf\pm 0.00 0.000.00\bf 0.00 ±0.00plus-or-minus0.00\bf\pm 0.00 0.010.01\bf 0.01 ±0.00plus-or-minus0.00\bf\pm 0.00 0.000.00\bf 0.00 ±0.00plus-or-minus0.00\bf\pm 0.00 0.000.00\bf 0.00 ±0.00plus-or-minus0.00\bf\pm 0.00 0.000.00\bf 0.00 ±0.00plus-or-minus0.00\bf\pm 0.00
MAJORITY 0.000.00\bf 0.00 ±0.00plus-or-minus0.00\bf\pm 0.00 0.000.00\bf 0.00 ±0.00plus-or-minus0.00\bf\pm 0.00 0.000.00\bf 0.00 ±0.00plus-or-minus0.00\bf\pm 0.00 0.000.00\bf 0.00 ±0.00plus-or-minus0.00\bf\pm 0.00 0.000.00\bf 0.00 ±0.00plus-or-minus0.00\bf\pm 0.00 0.000.00\bf 0.00 ±0.00plus-or-minus0.00\bf\pm 0.00 0.000.00\bf 0.00 ±0.00plus-or-minus0.00\bf\pm 0.00 0.000.00\bf 0.00 ±0.00plus-or-minus0.00\bf\pm 0.00 0.010.01\bf 0.01 ±0.00plus-or-minus0.00\bf\pm 0.00 0.000.00\bf 0.00 ±0.00plus-or-minus0.00\bf\pm 0.00 0.000.00\bf 0.00 ±0.00plus-or-minus0.00\bf\pm 0.00 0.000.00\bf 0.00 ±0.00plus-or-minus0.00\bf\pm 0.00
BOW-KNN 0.450.450.45 ±0.01plus-or-minus0.01\pm 0.01 0.100.100.10 ±0.01plus-or-minus0.01\pm 0.01 0.120.120.12 ±0.01plus-or-minus0.01\pm 0.01 0.110.110.11 ±0.01plus-or-minus0.01\pm 0.01 0.760.760.76 ±0.02plus-or-minus0.02\pm 0.02 0.750.750.75 ±0.02plus-or-minus0.02\pm 0.02 0.880.880.88 ±0.01plus-or-minus0.01\pm 0.01 0.670.670.67 ±0.03plus-or-minus0.03\pm 0.03 0.290.290.29 ±0.02plus-or-minus0.02\pm 0.02 0.090.090.09 ±0.01plus-or-minus0.01\pm 0.01 0.120.120.12 ±0.02plus-or-minus0.02\pm 0.02 0.090.090.09 ±0.01plus-or-minus0.01\pm 0.01
BOW-LR 0.560.560.56 ±0.02plus-or-minus0.02\pm 0.02 0.130.130.13 ±0.01plus-or-minus0.01\pm 0.01 0.150.150.15 ±0.01plus-or-minus0.01\pm 0.01 0.120.120.12 ±0.01plus-or-minus0.01\pm 0.01 0.840.840.84 ±0.02plus-or-minus0.02\pm 0.02 0.840.840.84 ±0.02plus-or-minus0.02\pm 0.02 0.890.890.89 ±0.01plus-or-minus0.01\pm 0.01 0.790.790.79 ±0.02plus-or-minus0.02\pm 0.02 0.410.410.41 ±0.02plus-or-minus0.02\pm 0.02 0.110.110.11 ±0.01plus-or-minus0.01\pm 0.01 0.140.140.14 ±0.01plus-or-minus0.01\pm 0.01 0.100.100.10 ±0.01plus-or-minus0.01\pm 0.01
BOW-SVM 0.540.540.54 ±0.01plus-or-minus0.01\pm 0.01 0.070.070.07 ±0.00plus-or-minus0.00\pm 0.00 0.080.080.08 ±0.00plus-or-minus0.00\pm 0.00 0.070.070.07 ±0.00plus-or-minus0.00\pm 0.00 0.850.85\bf 0.85 ±0.01plus-or-minus0.01\bf\pm 0.01 0.850.85\bf 0.85 ±0.01plus-or-minus0.01\bf\pm 0.01 0.900.900.90 ±0.01plus-or-minus0.01\pm 0.01 0.810.81\bf 0.81 ±0.01plus-or-minus0.01\bf\pm 0.01 0.310.310.31 ±0.01plus-or-minus0.01\pm 0.01 0.040.040.04 ±0.00plus-or-minus0.00\pm 0.00 0.060.060.06 ±0.00plus-or-minus0.00\pm 0.00 0.040.040.04 ±0.00plus-or-minus0.00\pm 0.00
TF-IDF-KNN 0.430.430.43 ±0.02plus-or-minus0.02\pm 0.02 0.100.100.10 ±0.00plus-or-minus0.00\pm 0.00 0.120.120.12 ±0.00plus-or-minus0.00\pm 0.00 0.110.110.11 ±0.01plus-or-minus0.01\pm 0.01 0.710.710.71 ±0.03plus-or-minus0.03\pm 0.03 0.710.710.71 ±0.03plus-or-minus0.03\pm 0.03 0.830.830.83 ±0.02plus-or-minus0.02\pm 0.02 0.630.630.63 ±0.04plus-or-minus0.04\pm 0.04 0.310.310.31 ±0.00plus-or-minus0.00\pm 0.00 0.090.090.09 ±0.01plus-or-minus0.01\pm 0.01 0.130.130.13 ±0.00plus-or-minus0.00\pm 0.00 0.090.090.09 ±0.01plus-or-minus0.01\pm 0.01
TF-IDF-LR 0.570.57\bf 0.57 ±0.02plus-or-minus0.02\bf\pm 0.02 0.150.15\bf 0.15 ±0.01plus-or-minus0.01\bf\pm 0.01 0.170.17\bf 0.17 ±0.01plus-or-minus0.01\bf\pm 0.01 0.150.15\bf 0.15 ±0.01plus-or-minus0.01\bf\pm 0.01 0.830.830.83 ±0.01plus-or-minus0.01\pm 0.01 0.830.830.83 ±0.01plus-or-minus0.01\pm 0.01 0.890.890.89 ±0.01plus-or-minus0.01\pm 0.01 0.790.790.79 ±0.02plus-or-minus0.02\pm 0.02 0.440.44\bf 0.44 ±0.02plus-or-minus0.02\bf\pm 0.02 0.130.13\bf 0.13 ±0.01plus-or-minus0.01\bf\pm 0.01 0.170.17\bf 0.17 ±0.01plus-or-minus0.01\bf\pm 0.01 0.120.12\bf 0.12 ±0.01plus-or-minus0.01\bf\pm 0.01
TF-IDF-SVM 0.540.540.54 ±0.01plus-or-minus0.01\pm 0.01 0.070.070.07 ±0.00plus-or-minus0.00\pm 0.00 0.070.070.07 ±0.00plus-or-minus0.00\pm 0.00 0.070.070.07 ±0.00plus-or-minus0.00\pm 0.00 0.840.840.84 ±0.02plus-or-minus0.02\pm 0.02 0.840.840.84 ±0.02plus-or-minus0.02\pm 0.02 0.910.91\bf 0.91 ±0.01plus-or-minus0.01\bf\pm 0.01 0.780.780.78 ±0.02plus-or-minus0.02\pm 0.02 0.320.320.32 ±0.01plus-or-minus0.01\pm 0.01 0.040.040.04 ±0.00plus-or-minus0.00\pm 0.00 0.060.060.06 ±0.00plus-or-minus0.00\pm 0.00 0.040.040.04 ±0.00plus-or-minus0.00\pm 0.00
RoBERTa 0.570.57\bf 0.57 ±0.02plus-or-minus0.02\bf\pm 0.02 0.110.11\bf 0.11 ±0.01plus-or-minus0.01\bf\pm 0.01 0.120.12\bf 0.12 ±0.01plus-or-minus0.01\bf\pm 0.01 0.120.12\bf 0.12 ±0.01plus-or-minus0.01\bf\pm 0.01 0.840.84\bf 0.84 ±0.01plus-or-minus0.01\bf\pm 0.01 0.850.85\bf 0.85 ±0.01plus-or-minus0.01\bf\pm 0.01 0.910.91\bf 0.91 ±0.01plus-or-minus0.01\bf\pm 0.01 0.790.79\bf 0.79 ±0.02plus-or-minus0.02\bf\pm 0.02 0.400.40\bf 0.40 ±0.03plus-or-minus0.03\bf\pm 0.03 0.090.09\bf 0.09 ±0.01plus-or-minus0.01\bf\pm 0.01 0.100.10\bf 0.10 ±0.01plus-or-minus0.01\bf\pm 0.01 0.090.09\bf 0.09 ±0.01plus-or-minus0.01\bf\pm 0.01
XLM-R 0.560.560.56 ±0.02plus-or-minus0.02\pm 0.02 0.100.100.10 ±0.01plus-or-minus0.01\pm 0.01 0.110.110.11 ±0.01plus-or-minus0.01\pm 0.01 0.110.110.11 ±0.01plus-or-minus0.01\pm 0.01 0.830.830.83 ±0.01plus-or-minus0.01\pm 0.01 0.830.830.83 ±0.01plus-or-minus0.01\pm 0.01 0.900.900.90 ±0.01plus-or-minus0.01\pm 0.01 0.780.780.78 ±0.02plus-or-minus0.02\pm 0.02 0.380.380.38 ±0.04plus-or-minus0.04\pm 0.04 0.080.080.08 ±0.01plus-or-minus0.01\pm 0.01 0.100.10\bf 0.10 ±0.01plus-or-minus0.01\bf\pm 0.01 0.080.080.08 ±0.01plus-or-minus0.01\pm 0.01
product 125612561256 classes
RANDOM 0.000.00\bf 0.00 ±0.00plus-or-minus0.00\bf\pm 0.00 0.000.00\bf 0.00 ±0.00plus-or-minus0.00\bf\pm 0.00 0.000.00\bf 0.00 ±0.00plus-or-minus0.00\bf\pm 0.00 0.000.00\bf 0.00 ±0.00plus-or-minus0.00\bf\pm 0.00 0.000.00\bf 0.00 ±0.00plus-or-minus0.00\bf\pm 0.00 0.000.00\bf 0.00 ±0.00plus-or-minus0.00\bf\pm 0.00 0.000.00\bf 0.00 ±0.00plus-or-minus0.00\bf\pm 0.00 0.000.00\bf 0.00 ±0.00plus-or-minus0.00\bf\pm 0.00 0.000.00\bf 0.00 ±0.00plus-or-minus0.00\bf\pm 0.00 0.000.00\bf 0.00 ±0.00plus-or-minus0.00\bf\pm 0.00 0.000.00\bf 0.00 ±0.00plus-or-minus0.00\bf\pm 0.00 0.000.00\bf 0.00 ±0.00plus-or-minus0.00\bf\pm 0.00
MAJORITY 0.000.00\bf 0.00 ±0.00plus-or-minus0.00\bf\pm 0.00 0.000.00\bf 0.00 ±0.00plus-or-minus0.00\bf\pm 0.00 0.000.00\bf 0.00 ±0.00plus-or-minus0.00\bf\pm 0.00 0.000.00\bf 0.00 ±0.00plus-or-minus0.00\bf\pm 0.00 0.000.00\bf 0.00 ±0.00plus-or-minus0.00\bf\pm 0.00 0.000.00\bf 0.00 ±0.00plus-or-minus0.00\bf\pm 0.00 0.000.00\bf 0.00 ±0.00plus-or-minus0.00\bf\pm 0.00 0.000.00\bf 0.00 ±0.00plus-or-minus0.00\bf\pm 0.00 0.000.00\bf 0.00 ±0.00plus-or-minus0.00\bf\pm 0.00 0.000.00\bf 0.00 ±0.00plus-or-minus0.00\bf\pm 0.00 0.000.00\bf 0.00 ±0.00plus-or-minus0.00\bf\pm 0.00 0.000.00\bf 0.00 ±0.00plus-or-minus0.00\bf\pm 0.00
BOW-KNN 0.230.230.23 ±0.00plus-or-minus0.00\pm 0.00 0.050.050.05 ±0.01plus-or-minus0.01\pm 0.01 0.060.060.06 ±0.01plus-or-minus0.01\pm 0.01 0.060.060.06 ±0.01plus-or-minus0.01\pm 0.01 0.470.470.47 ±0.03plus-or-minus0.03\pm 0.03 0.400.400.40 ±0.03plus-or-minus0.03\pm 0.03 0.590.590.59 ±0.04plus-or-minus0.04\pm 0.04 0.340.340.34 ±0.04plus-or-minus0.04\pm 0.04 0.120.120.12 ±0.03plus-or-minus0.03\pm 0.03 0.030.030.03 ±0.01plus-or-minus0.01\pm 0.01 0.030.030.03 ±0.01plus-or-minus0.01\pm 0.01 0.030.030.03 ±0.01plus-or-minus0.01\pm 0.01
BOW-LR 0.410.410.41 ±0.01plus-or-minus0.01\pm 0.01 0.090.090.09 ±0.00plus-or-minus0.00\pm 0.00 0.090.090.09 ±0.00plus-or-minus0.00\pm 0.00 0.110.110.11 ±0.00plus-or-minus0.00\pm 0.00 0.710.71\bf 0.71 ±0.01plus-or-minus0.01\bf\pm 0.01 0.690.69\bf 0.69 ±0.03plus-or-minus0.03\bf\pm 0.03 0.790.79\bf 0.79 ±0.03plus-or-minus0.03\bf\pm 0.03 0.650.65\bf 0.65 ±0.02plus-or-minus0.02\bf\pm 0.02 0.180.180.18 ±0.02plus-or-minus0.02\pm 0.02 0.030.030.03 ±0.00plus-or-minus0.00\pm 0.00 0.040.040.04 ±0.00plus-or-minus0.00\pm 0.00 0.040.040.04 ±0.00plus-or-minus0.00\pm 0.00
BOW-SVM 0.190.190.19 ±0.01plus-or-minus0.01\pm 0.01 0.010.010.01 ±0.00plus-or-minus0.00\pm 0.00 0.010.010.01 ±0.00plus-or-minus0.00\pm 0.00 0.020.020.02 ±0.00plus-or-minus0.00\pm 0.00 0.550.550.55 ±0.01plus-or-minus0.01\pm 0.01 0.470.470.47 ±0.02plus-or-minus0.02\pm 0.02 0.620.620.62 ±0.03plus-or-minus0.03\pm 0.03 0.450.450.45 ±0.02plus-or-minus0.02\pm 0.02 0.000.000.00 ±0.00plus-or-minus0.00\pm 0.00 0.000.000.00 ±0.00plus-or-minus0.00\pm 0.00 0.000.000.00 ±0.00plus-or-minus0.00\pm 0.00 0.000.000.00 ±0.00plus-or-minus0.00\pm 0.00
TF-IDF-KNN 0.280.280.28 ±0.02plus-or-minus0.02\pm 0.02 0.070.070.07 ±0.00plus-or-minus0.00\pm 0.00 0.080.080.08 ±0.00plus-or-minus0.00\pm 0.00 0.080.080.08 ±0.00plus-or-minus0.00\pm 0.00 0.510.510.51 ±0.05plus-or-minus0.05\pm 0.05 0.460.460.46 ±0.05plus-or-minus0.05\pm 0.05 0.640.640.64 ±0.03plus-or-minus0.03\pm 0.03 0.400.400.40 ±0.05plus-or-minus0.05\pm 0.05 0.160.160.16 ±0.01plus-or-minus0.01\pm 0.01 0.040.040.04 ±0.00plus-or-minus0.00\pm 0.00 0.040.040.04 ±0.00plus-or-minus0.00\pm 0.00 0.040.040.04 ±0.00plus-or-minus0.00\pm 0.00
TF-IDF-LR 0.420.42\bf 0.42 ±0.01plus-or-minus0.01\bf\pm 0.01 0.100.10\bf 0.10 ±0.00plus-or-minus0.00\bf\pm 0.00 0.100.10\bf 0.10 ±0.00plus-or-minus0.00\bf\pm 0.00 0.120.12\bf 0.12 ±0.00plus-or-minus0.00\bf\pm 0.00 0.710.71\bf 0.71 ±0.01plus-or-minus0.01\bf\pm 0.01 0.680.680.68 ±0.02plus-or-minus0.02\pm 0.02 0.790.79\bf 0.79 ±0.02plus-or-minus0.02\bf\pm 0.02 0.630.630.63 ±0.02plus-or-minus0.02\pm 0.02 0.220.22\bf 0.22 ±0.02plus-or-minus0.02\bf\pm 0.02 0.050.05\bf 0.05 ±0.00plus-or-minus0.00\bf\pm 0.00 0.050.05\bf 0.05 ±0.00plus-or-minus0.00\bf\pm 0.00 0.050.05\bf 0.05 ±0.00plus-or-minus0.00\bf\pm 0.00
TF-IDF-SVM 0.200.200.20 ±0.01plus-or-minus0.01\pm 0.01 0.010.010.01 ±0.00plus-or-minus0.00\pm 0.00 0.010.010.01 ±0.00plus-or-minus0.00\pm 0.00 0.020.020.02 ±0.00plus-or-minus0.00\pm 0.00 0.590.590.59 ±0.02plus-or-minus0.02\pm 0.02 0.500.500.50 ±0.01plus-or-minus0.01\pm 0.01 0.610.610.61 ±0.02plus-or-minus0.02\pm 0.02 0.490.490.49 ±0.01plus-or-minus0.01\pm 0.01 0.000.000.00 ±0.00plus-or-minus0.00\pm 0.00 0.000.000.00 ±0.00plus-or-minus0.00\pm 0.00 0.000.000.00 ±0.00plus-or-minus0.00\pm 0.00 0.000.000.00 ±0.00plus-or-minus0.00\pm 0.00
RoBERTa 0.360.36\bf 0.36 ±0.13plus-or-minus0.13\bf\pm 0.13 0.090.09\bf 0.09 ±0.03plus-or-minus0.03\bf\pm 0.03 0.080.08\bf 0.08 ±0.03plus-or-minus0.03\bf\pm 0.03 0.100.10\bf 0.10 ±0.04plus-or-minus0.04\bf\pm 0.04 0.610.61\bf 0.61 ±0.21plus-or-minus0.21\bf\pm 0.21 0.560.56\bf 0.56 ±0.22plus-or-minus0.22\bf\pm 0.22 0.630.63\bf 0.63 ±0.25plus-or-minus0.25\bf\pm 0.25 0.520.52\bf 0.52 ±0.20plus-or-minus0.20\bf\pm 0.20 0.170.17\bf 0.17 ±0.07plus-or-minus0.07\bf\pm 0.07 0.040.04\bf 0.04 ±0.01plus-or-minus0.01\bf\pm 0.01 0.040.04\bf 0.04 ±0.02plus-or-minus0.02\bf\pm 0.02 0.040.04\bf 0.04 ±0.02plus-or-minus0.02\bf\pm 0.02
XLM-R 0.250.250.25 ±0.18plus-or-minus0.18\pm 0.18 0.040.040.04 ±0.04plus-or-minus0.04\pm 0.04 0.040.040.04 ±0.03plus-or-minus0.03\pm 0.03 0.060.060.06 ±0.04plus-or-minus0.04\pm 0.04 0.480.480.48 ±0.33plus-or-minus0.33\pm 0.33 0.440.440.44 ±0.35plus-or-minus0.35\pm 0.35 0.480.480.48 ±0.38plus-or-minus0.38\pm 0.38 0.420.420.42 ±0.32plus-or-minus0.32\pm 0.32 0.060.060.06 ±0.05plus-or-minus0.05\pm 0.05 0.010.010.01 ±0.01plus-or-minus0.01\pm 0.01 0.010.010.01 ±0.01plus-or-minus0.01\pm 0.01 0.010.010.01 ±0.01plus-or-minus0.01\pm 0.01
hazard (well-supported only) 797979 classes
RANDOM 0.000.00\bf 0.00 ±0.00plus-or-minus0.00\bf\pm 0.00 0.000.00\bf 0.00 ±0.00plus-or-minus0.00\bf\pm 0.00 0.000.00\bf 0.00 ±0.00plus-or-minus0.00\bf\pm 0.00 0.010.01\bf 0.01 ±0.00plus-or-minus0.00\bf\pm 0.00 0.000.00\bf 0.00 ±0.00plus-or-minus0.00\bf\pm 0.00 0.000.00\bf 0.00 ±0.00plus-or-minus0.00\bf\pm 0.00 0.000.00\bf 0.00 ±0.00plus-or-minus0.00\bf\pm 0.00 0.000.00\bf 0.00 ±0.00plus-or-minus0.00\bf\pm 0.00 0.010.01\bf 0.01 ±0.01plus-or-minus0.01\bf\pm 0.01 0.000.00\bf 0.00 ±0.00plus-or-minus0.00\bf\pm 0.00 0.000.00\bf 0.00 ±0.00plus-or-minus0.00\bf\pm 0.00 0.010.010.01 ±0.00plus-or-minus0.00\pm 0.00
MAJORITY 0.000.00\bf 0.00 ±0.00plus-or-minus0.00\bf\pm 0.00 0.000.00\bf 0.00 ±0.00plus-or-minus0.00\bf\pm 0.00 0.000.00\bf 0.00 ±0.00plus-or-minus0.00\bf\pm 0.00 0.010.01\bf 0.01 ±0.00plus-or-minus0.00\bf\pm 0.00 0.000.00\bf 0.00 ±0.00plus-or-minus0.00\bf\pm 0.00 0.000.00\bf 0.00 ±0.00plus-or-minus0.00\bf\pm 0.00 0.000.00\bf 0.00 ±0.00plus-or-minus0.00\bf\pm 0.00 0.000.00\bf 0.00 ±0.00plus-or-minus0.00\bf\pm 0.00 0.010.01\bf 0.01 ±0.00plus-or-minus0.00\bf\pm 0.00 0.000.00\bf 0.00 ±0.00plus-or-minus0.00\bf\pm 0.00 0.000.00\bf 0.00 ±0.00plus-or-minus0.00\bf\pm 0.00 0.020.02\bf 0.02 ±0.00plus-or-minus0.00\bf\pm 0.00
BOW-KNN 0.480.480.48 ±0.02plus-or-minus0.02\pm 0.02 0.270.270.27 ±0.01plus-or-minus0.01\pm 0.01 0.330.330.33 ±0.02plus-or-minus0.02\pm 0.02 0.280.280.28 ±0.02plus-or-minus0.02\pm 0.02 0.760.760.76 ±0.02plus-or-minus0.02\pm 0.02 0.750.750.75 ±0.02plus-or-minus0.02\pm 0.02 0.880.880.88 ±0.01plus-or-minus0.01\pm 0.01 0.670.670.67 ±0.03plus-or-minus0.03\pm 0.03 0.350.350.35 ±0.02plus-or-minus0.02\pm 0.02 0.260.260.26 ±0.02plus-or-minus0.02\pm 0.02 0.390.390.39 ±0.04plus-or-minus0.04\pm 0.04 0.230.230.23 ±0.02plus-or-minus0.02\pm 0.02
BOW-LR 0.590.590.59 ±0.02plus-or-minus0.02\pm 0.02 0.380.380.38 ±0.02plus-or-minus0.02\pm 0.02 0.470.470.47 ±0.02plus-or-minus0.02\pm 0.02 0.360.360.36 ±0.02plus-or-minus0.02\pm 0.02 0.840.840.84 ±0.02plus-or-minus0.02\pm 0.02 0.840.840.84 ±0.02plus-or-minus0.02\pm 0.02 0.890.890.89 ±0.01plus-or-minus0.01\pm 0.01 0.790.790.79 ±0.02plus-or-minus0.02\pm 0.02 0.480.480.48 ±0.02plus-or-minus0.02\pm 0.02 0.360.360.36 ±0.03plus-or-minus0.03\pm 0.03 0.510.510.51 ±0.03plus-or-minus0.03\pm 0.03 0.310.310.31 ±0.03plus-or-minus0.03\pm 0.03
BOW-SVM 0.580.580.58 ±0.01plus-or-minus0.01\pm 0.01 0.240.240.24 ±0.00plus-or-minus0.00\pm 0.00 0.290.290.29 ±0.01plus-or-minus0.01\pm 0.01 0.220.220.22 ±0.00plus-or-minus0.00\pm 0.00 0.850.85\bf 0.85 ±0.01plus-or-minus0.01\bf\pm 0.01 0.850.85\bf 0.85 ±0.01plus-or-minus0.01\bf\pm 0.01 0.900.900.90 ±0.01plus-or-minus0.01\pm 0.01 0.810.81\bf 0.81 ±0.01plus-or-minus0.01\bf\pm 0.01 0.380.380.38 ±0.01plus-or-minus0.01\pm 0.01 0.170.170.17 ±0.01plus-or-minus0.01\pm 0.01 0.250.250.25 ±0.02plus-or-minus0.02\pm 0.02 0.140.140.14 ±0.01plus-or-minus0.01\pm 0.01
TF-IDF-KNN 0.460.460.46 ±0.02plus-or-minus0.02\pm 0.02 0.280.280.28 ±0.01plus-or-minus0.01\pm 0.01 0.340.340.34 ±0.02plus-or-minus0.02\pm 0.02 0.290.290.29 ±0.01plus-or-minus0.01\pm 0.01 0.710.710.71 ±0.03plus-or-minus0.03\pm 0.03 0.710.710.71 ±0.03plus-or-minus0.03\pm 0.03 0.830.830.83 ±0.02plus-or-minus0.02\pm 0.02 0.630.630.63 ±0.04plus-or-minus0.04\pm 0.04 0.360.360.36 ±0.01plus-or-minus0.01\pm 0.01 0.280.280.28 ±0.01plus-or-minus0.01\pm 0.01 0.410.410.41 ±0.02plus-or-minus0.02\pm 0.02 0.250.250.25 ±0.02plus-or-minus0.02\pm 0.02
TF-IDF-LR 0.600.600.60 ±0.02plus-or-minus0.02\pm 0.02 0.410.41\bf 0.41 ±0.02plus-or-minus0.02\bf\pm 0.02 0.490.49\bf 0.49 ±0.03plus-or-minus0.03\bf\pm 0.03 0.380.38\bf 0.38 ±0.02plus-or-minus0.02\bf\pm 0.02 0.830.830.83 ±0.01plus-or-minus0.01\pm 0.01 0.830.830.83 ±0.01plus-or-minus0.01\pm 0.01 0.890.890.89 ±0.01plus-or-minus0.01\pm 0.01 0.790.790.79 ±0.02plus-or-minus0.02\pm 0.02 0.500.50\bf 0.50 ±0.02plus-or-minus0.02\bf\pm 0.02 0.390.39\bf 0.39 ±0.03plus-or-minus0.03\bf\pm 0.03 0.540.54\bf 0.54 ±0.04plus-or-minus0.04\bf\pm 0.04 0.340.34\bf 0.34 ±0.02plus-or-minus0.02\bf\pm 0.02
TF-IDF-SVM 0.580.580.58 ±0.01plus-or-minus0.01\pm 0.01 0.230.230.23 ±0.00plus-or-minus0.00\pm 0.00 0.260.260.26 ±0.01plus-or-minus0.01\pm 0.01 0.230.230.23 ±0.00plus-or-minus0.00\pm 0.00 0.840.840.84 ±0.02plus-or-minus0.02\pm 0.02 0.840.840.84 ±0.02plus-or-minus0.02\pm 0.02 0.910.91\bf 0.91 ±0.01plus-or-minus0.01\bf\pm 0.01 0.780.780.78 ±0.02plus-or-minus0.02\pm 0.02 0.390.390.39 ±0.01plus-or-minus0.01\pm 0.01 0.170.170.17 ±0.01plus-or-minus0.01\pm 0.01 0.230.230.23 ±0.01plus-or-minus0.01\pm 0.01 0.150.150.15 ±0.00plus-or-minus0.00\pm 0.00
RoBERTa 0.610.61\bf 0.61 ±0.02plus-or-minus0.02\bf\pm 0.02 0.360.36\bf 0.36 ±0.03plus-or-minus0.03\bf\pm 0.03 0.410.41\bf 0.41 ±0.04plus-or-minus0.04\bf\pm 0.04 0.360.36\bf 0.36 ±0.03plus-or-minus0.03\bf\pm 0.03 0.840.84\bf 0.84 ±0.01plus-or-minus0.01\bf\pm 0.01 0.850.85\bf 0.85 ±0.01plus-or-minus0.01\bf\pm 0.01 0.910.91\bf 0.91 ±0.01plus-or-minus0.01\bf\pm 0.01 0.790.79\bf 0.79 ±0.02plus-or-minus0.02\bf\pm 0.02 0.490.49\bf 0.49 ±0.04plus-or-minus0.04\bf\pm 0.04 0.320.32\bf 0.32 ±0.04plus-or-minus0.04\bf\pm 0.04 0.400.40\bf 0.40 ±0.05plus-or-minus0.05\bf\pm 0.05 0.310.31\bf 0.31 ±0.03plus-or-minus0.03\bf\pm 0.03
XLM-R 0.600.600.60 ±0.02plus-or-minus0.02\pm 0.02 0.330.330.33 ±0.04plus-or-minus0.04\pm 0.04 0.390.390.39 ±0.02plus-or-minus0.02\pm 0.02 0.330.330.33 ±0.04plus-or-minus0.04\pm 0.04 0.830.830.83 ±0.01plus-or-minus0.01\pm 0.01 0.830.830.83 ±0.01plus-or-minus0.01\pm 0.01 0.900.900.90 ±0.01plus-or-minus0.01\pm 0.01 0.780.780.78 ±0.02plus-or-minus0.02\pm 0.02 0.460.460.46 ±0.03plus-or-minus0.03\pm 0.03 0.290.290.29 ±0.04plus-or-minus0.04\pm 0.04 0.380.380.38 ±0.03plus-or-minus0.03\pm 0.03 0.270.270.27 ±0.04plus-or-minus0.04\pm 0.04
product (well-supported only) 184184184 classes
RANDOM 0.000.00\bf 0.00 ±0.00plus-or-minus0.00\bf\pm 0.00 0.000.00\bf 0.00 ±0.00plus-or-minus0.00\bf\pm 0.00 0.000.00\bf 0.00 ±0.00plus-or-minus0.00\bf\pm 0.00 0.000.000.00 ±0.00plus-or-minus0.00\pm 0.00 0.000.00\bf 0.00 ±0.00plus-or-minus0.00\bf\pm 0.00 0.000.00\bf 0.00 ±0.00plus-or-minus0.00\bf\pm 0.00 0.000.00\bf 0.00 ±0.00plus-or-minus0.00\bf\pm 0.00 0.000.00\bf 0.00 ±0.00plus-or-minus0.00\bf\pm 0.00 0.000.00\bf 0.00 ±0.00plus-or-minus0.00\bf\pm 0.00 0.000.00\bf 0.00 ±0.00plus-or-minus0.00\bf\pm 0.00 0.000.00\bf 0.00 ±0.00plus-or-minus0.00\bf\pm 0.00 0.000.00\bf 0.00 ±0.00plus-or-minus0.00\bf\pm 0.00
MAJORITY 0.000.00\bf 0.00 ±0.00plus-or-minus0.00\bf\pm 0.00 0.000.00\bf 0.00 ±0.00plus-or-minus0.00\bf\pm 0.00 0.000.00\bf 0.00 ±0.00plus-or-minus0.00\bf\pm 0.00 0.010.01\bf 0.01 ±0.00plus-or-minus0.00\bf\pm 0.00 0.000.00\bf 0.00 ±0.00plus-or-minus0.00\bf\pm 0.00 0.000.00\bf 0.00 ±0.00plus-or-minus0.00\bf\pm 0.00 0.000.00\bf 0.00 ±0.00plus-or-minus0.00\bf\pm 0.00 0.000.00\bf 0.00 ±0.00plus-or-minus0.00\bf\pm 0.00 0.000.00\bf 0.00 ±0.00plus-or-minus0.00\bf\pm 0.00 0.000.00\bf 0.00 ±0.00plus-or-minus0.00\bf\pm 0.00 0.000.00\bf 0.00 ±0.00plus-or-minus0.00\bf\pm 0.00 0.000.00\bf 0.00 ±0.00plus-or-minus0.00\bf\pm 0.00
BOW-KNN 0.340.340.34 ±0.01plus-or-minus0.01\pm 0.01 0.230.230.23 ±0.01plus-or-minus0.01\pm 0.01 0.290.290.29 ±0.01plus-or-minus0.01\pm 0.01 0.240.240.24 ±0.01plus-or-minus0.01\pm 0.01 0.470.470.47 ±0.03plus-or-minus0.03\pm 0.03 0.400.400.40 ±0.03plus-or-minus0.03\pm 0.03 0.590.590.59 ±0.04plus-or-minus0.04\pm 0.04 0.340.340.34 ±0.04plus-or-minus0.04\pm 0.04 0.280.280.28 ±0.09plus-or-minus0.09\pm 0.09 0.200.200.20 ±0.08plus-or-minus0.08\pm 0.08 0.220.220.22 ±0.08plus-or-minus0.08\pm 0.08 0.190.190.19 ±0.09plus-or-minus0.09\pm 0.09
BOW-LR 0.580.580.58 ±0.02plus-or-minus0.02\pm 0.02 0.480.480.48 ±0.02plus-or-minus0.02\pm 0.02 0.530.530.53 ±0.02plus-or-minus0.02\pm 0.02 0.490.490.49 ±0.02plus-or-minus0.02\pm 0.02 0.710.71\bf 0.71 ±0.01plus-or-minus0.01\bf\pm 0.01 0.690.69\bf 0.69 ±0.03plus-or-minus0.03\bf\pm 0.03 0.790.79\bf 0.79 ±0.03plus-or-minus0.03\bf\pm 0.03 0.650.65\bf 0.65 ±0.02plus-or-minus0.02\bf\pm 0.02 0.460.460.46 ±0.10plus-or-minus0.10\pm 0.10 0.340.340.34 ±0.08plus-or-minus0.08\pm 0.08 0.360.360.36 ±0.07plus-or-minus0.07\pm 0.07 0.330.330.33 ±0.08plus-or-minus0.08\pm 0.08
BOW-SVM 0.290.290.29 ±0.01plus-or-minus0.01\pm 0.01 0.090.090.09 ±0.00plus-or-minus0.00\pm 0.00 0.120.120.12 ±0.01plus-or-minus0.01\pm 0.01 0.110.110.11 ±0.01plus-or-minus0.01\pm 0.01 0.550.550.55 ±0.01plus-or-minus0.01\pm 0.01 0.470.470.47 ±0.02plus-or-minus0.02\pm 0.02 0.620.620.62 ±0.03plus-or-minus0.03\pm 0.03 0.450.450.45 ±0.02plus-or-minus0.02\pm 0.02 0.000.000.00 ±0.00plus-or-minus0.00\pm 0.00 0.000.000.00 ±0.00plus-or-minus0.00\pm 0.00 0.000.000.00 ±0.00plus-or-minus0.00\pm 0.00 0.000.000.00 ±0.00plus-or-minus0.00\pm 0.00
TF-IDF-KNN 0.400.400.40 ±0.03plus-or-minus0.03\pm 0.03 0.320.320.32 ±0.02plus-or-minus0.02\pm 0.02 0.380.380.38 ±0.01plus-or-minus0.01\pm 0.01 0.330.330.33 ±0.03plus-or-minus0.03\pm 0.03 0.510.510.51 ±0.05plus-or-minus0.05\pm 0.05 0.460.460.46 ±0.05plus-or-minus0.05\pm 0.05 0.640.640.64 ±0.03plus-or-minus0.03\pm 0.03 0.400.400.40 ±0.05plus-or-minus0.05\pm 0.05 0.330.330.33 ±0.07plus-or-minus0.07\pm 0.07 0.240.240.24 ±0.04plus-or-minus0.04\pm 0.04 0.270.270.27 ±0.04plus-or-minus0.04\pm 0.04 0.230.230.23 ±0.04plus-or-minus0.04\pm 0.04
TF-IDF-LR 0.590.59\bf 0.59 ±0.01plus-or-minus0.01\bf\pm 0.01 0.510.51\bf 0.51 ±0.01plus-or-minus0.01\bf\pm 0.01 0.560.56\bf 0.56 ±0.01plus-or-minus0.01\bf\pm 0.01 0.520.52\bf 0.52 ±0.02plus-or-minus0.02\bf\pm 0.02 0.710.71\bf 0.71 ±0.01plus-or-minus0.01\bf\pm 0.01 0.680.680.68 ±0.02plus-or-minus0.02\pm 0.02 0.790.79\bf 0.79 ±0.02plus-or-minus0.02\bf\pm 0.02 0.630.630.63 ±0.02plus-or-minus0.02\pm 0.02 0.570.57\bf 0.57 ±0.05plus-or-minus0.05\bf\pm 0.05 0.430.43\bf 0.43 ±0.07plus-or-minus0.07\bf\pm 0.07 0.450.45\bf 0.45 ±0.07plus-or-minus0.07\bf\pm 0.07 0.420.42\bf 0.42 ±0.06plus-or-minus0.06\bf\pm 0.06
TF-IDF-SVM 0.310.310.31 ±0.01plus-or-minus0.01\pm 0.01 0.090.090.09 ±0.00plus-or-minus0.00\pm 0.00 0.100.100.10 ±0.01plus-or-minus0.01\pm 0.01 0.110.110.11 ±0.00plus-or-minus0.00\pm 0.00 0.590.590.59 ±0.02plus-or-minus0.02\pm 0.02 0.500.500.50 ±0.01plus-or-minus0.01\pm 0.01 0.610.610.61 ±0.02plus-or-minus0.02\pm 0.02 0.490.490.49 ±0.01plus-or-minus0.01\pm 0.01 0.000.000.00 ±0.00plus-or-minus0.00\pm 0.00 0.000.000.00 ±0.00plus-or-minus0.00\pm 0.00 0.000.000.00 ±0.00plus-or-minus0.00\pm 0.00 0.000.000.00 ±0.00plus-or-minus0.00\pm 0.00
RoBERTa 0.510.51\bf 0.51 ±0.19plus-or-minus0.19\bf\pm 0.19 0.430.43\bf 0.43 ±0.17plus-or-minus0.17\bf\pm 0.17 0.450.45\bf 0.45 ±0.18plus-or-minus0.18\bf\pm 0.18 0.450.45\bf 0.45 ±0.18plus-or-minus0.18\bf\pm 0.18 0.610.61\bf 0.61 ±0.21plus-or-minus0.21\bf\pm 0.21 0.560.56\bf 0.56 ±0.22plus-or-minus0.22\bf\pm 0.22 0.630.63\bf 0.63 ±0.25plus-or-minus0.25\bf\pm 0.25 0.520.52\bf 0.52 ±0.20plus-or-minus0.20\bf\pm 0.20 0.370.37\bf 0.37 ±0.19plus-or-minus0.19\bf\pm 0.19 0.280.28\bf 0.28 ±0.17plus-or-minus0.17\bf\pm 0.17 0.320.32\bf 0.32 ±0.20plus-or-minus0.20\bf\pm 0.20 0.260.26\bf 0.26 ±0.15plus-or-minus0.15\bf\pm 0.15
XLM-R 0.370.370.37 ±0.27plus-or-minus0.27\pm 0.27 0.280.280.28 ±0.22plus-or-minus0.22\pm 0.22 0.280.280.28 ±0.23plus-or-minus0.23\pm 0.23 0.300.300.30 ±0.24plus-or-minus0.24\pm 0.24 0.480.480.48 ±0.33plus-or-minus0.33\pm 0.33 0.440.440.44 ±0.35plus-or-minus0.35\pm 0.35 0.480.480.48 ±0.38plus-or-minus0.38\pm 0.38 0.420.420.42 ±0.32plus-or-minus0.32\pm 0.32 0.200.200.20 ±0.20plus-or-minus0.20\pm 0.20 0.140.140.14 ±0.15plus-or-minus0.15\pm 0.15 0.160.160.16 ±0.16plus-or-minus0.16\pm 0.16 0.130.130.13 ±0.14plus-or-minus0.14\pm 0.14
Table 8: Average model F1subscript𝐹1F_{1}(micro & macro), Precision (macro), and Recall (macro) as well as mean deviation over 5 CV-splits. Blue cells highlight the best score per column and classification task. Bold scores are the best per column, classification task, and type of classifier (naive, traditional, encoder-transformer, and prompting).
Scores (all classes) Scores (𝒞highsubscript𝒞𝑖𝑔\mathcal{C}_{high}) Scores (𝒞lowsubscript𝒞𝑙𝑜𝑤\mathcal{C}_{low})
Model F1subscript𝐹1F_{1} (micro) F1subscript𝐹1F_{1} (macro) Precision Recall F1subscript𝐹1F_{1} (micro) F1subscript𝐹1F_{1} (macro) Precision Recall F1subscript𝐹1F_{1} (micro) F1subscript𝐹1F_{1} (macro) Precision Recall
hazard-category 101010 classes; α=0.05𝛼0.05\alpha=0.05
RANDOM 0.330.330.33 0.080.080.08 0.070.070.07 0.100.100.10 0.510.510.51 0.340.340.34 0.500.500.50 0.250.250.25 0.000.000.00 0.000.000.00 0.000.000.00 0.000.000.00
MAJORITY 0.340.340.34 0.050.050.05 0.030.030.03 0.100.100.10 1.001.001.00 1.001.001.00 1.001.001.00 1.001.001.00 0.000.000.00 0.000.000.00 0.000.000.00 0.000.000.00
TF-IDF-LR 0.770.770.77 0.550.550.55 0.650.650.65 0.500.500.50 0.930.930.93 0.480.480.48 0.500.500.50 0.460.460.46 0.650.650.65 0.500.500.50 0.680.680.68 0.410.410.41
GPT-ALL 0.740.740.74 0.530.530.53 0.590.590.59 0.530.530.53 0.820.820.82 0.450.450.45 0.410.410.41 0.500.50\bf 0.50 0.670.670.67 0.540.54\bf 0.54 0.540.540.54 0.590.590.59
GPT-SIM-10 0.760.760.76 0.520.520.52 0.550.550.55 0.520.520.52 0.850.850.85 0.460.460.46 0.420.420.42 0.500.50\bf 0.50 0.670.670.67 0.500.500.50 0.480.480.48 0.570.570.57
GPT-SIM-20 0.740.740.74 0.530.530.53 0.590.590.59 0.530.530.53 0.820.820.82 0.450.450.45 0.410.410.41 0.500.50\bf 0.50 0.670.670.67 0.540.54\bf 0.54 0.540.540.54 0.590.590.59
GPT-MAX-5 0.750.750.75 0.550.550.55 0.540.540.54 0.590.590.59 0.850.850.85 0.460.460.46 0.420.420.42 0.500.50\bf 0.50 0.690.69\bf 0.69 0.540.54\bf 0.54 0.470.470.47 0.650.65\bf 0.65
GPT-MAX-10 0.720.720.72 0.490.490.49 0.630.63\bf 0.63 0.490.490.49 0.790.790.79 0.440.440.44 0.390.390.39 0.500.50\bf 0.50 0.630.630.63 0.490.490.49 0.590.59\bf 0.59 0.540.540.54
GPT-CICLe 0.770.77\bf 0.77 0.560.56\bf 0.56 0.530.530.53 0.610.61\bf 0.61 0.870.87\bf 0.87 0.470.47\bf 0.47 0.440.44\bf 0.44 0.500.50\bf 0.50 0.680.680.68 0.530.530.53 0.460.460.46 0.650.65\bf 0.65
product-category 222222 classes; α=0.05𝛼0.05\alpha=0.05
RANDOM 0.080.080.08 0.010.010.01 0.010.010.01 0.050.050.05 0.230.230.23 0.210.210.21 0.170.170.17 0.280.280.28 0.030.030.03 0.000.000.00 0.000.000.00 0.030.030.03
MAJORITY 0.130.130.13 0.010.010.01 0.010.010.01 0.050.050.05 0.320.320.32 0.240.240.24 0.160.160.16 0.500.500.50 0.000.000.00 0.000.000.00 0.000.000.00 0.000.000.00
TF-IDF-LR 0.710.710.71 0.580.580.58 0.620.620.62 0.560.560.56 0.870.870.87 0.840.840.84 0.940.940.94 0.760.760.76 0.760.760.76 0.600.600.60 0.770.770.77 0.520.520.52
GPT-ALL 0.760.760.76 0.720.72\bf 0.72 0.720.72\bf 0.72 0.770.770.77 0.860.860.86 0.850.850.85 0.740.740.74 0.980.980.98 0.800.800.80 0.750.75\bf 0.75 0.710.71\bf 0.71 0.860.860.86
GPT-SIM-10 0.770.770.77 0.660.660.66 0.640.640.64 0.750.750.75 0.890.890.89 0.870.870.87 0.790.790.79 0.980.980.98 0.800.800.80 0.670.670.67 0.600.600.60 0.850.850.85
GPT-SIM-20 0.770.770.77 0.690.690.69 0.670.670.67 0.750.750.75 0.870.870.87 0.860.860.86 0.760.760.76 0.980.980.98 0.810.81\bf 0.81 0.690.690.69 0.640.640.64 0.810.810.81
GPT-MAX-5 0.790.790.79 0.640.640.64 0.610.610.61 0.700.700.70 0.900.90\bf 0.90 0.890.89\bf 0.89 0.810.81\bf 0.81 0.990.99\bf 0.99 0.800.800.80 0.610.610.61 0.550.550.55 0.750.750.75
GPT-MAX-10 0.780.780.78 0.680.680.68 0.650.650.65 0.780.780.78 0.870.870.87 0.860.860.86 0.760.760.76 0.990.99\bf 0.99 0.800.800.80 0.680.680.68 0.610.610.61 0.880.88\bf 0.88
GPT-CICLe 0.800.80\bf 0.80 0.690.690.69 0.650.650.65 0.790.79\bf 0.79 0.900.90\bf 0.90 0.880.880.88 0.800.800.80 0.980.980.98 0.810.81\bf 0.81 0.680.680.68 0.600.600.60 0.880.88\bf 0.88
hazard 261261261 classes; α=0.20𝛼0.20\alpha=0.20
RANDOM 0.000.000.00 0.000.000.00 0.000.000.00 0.000.000.00 0.000.000.00 0.000.000.00 0.000.000.00 0.000.000.00 0.010.010.01 0.000.000.00 0.000.000.00 0.000.000.00
MAJORITY 0.000.000.00 0.000.000.00 0.000.000.00 0.000.000.00 0.000.000.00 0.000.000.00 0.000.000.00 0.000.000.00 0.010.010.01 0.000.000.00 0.000.000.00 0.000.000.00
TF-IDF-LR 0.550.550.55 0.150.150.15 0.170.170.17 0.140.140.14 0.810.810.81 0.810.810.81 0.880.880.88 0.760.760.76 0.440.440.44 0.130.130.13 0.170.170.17 0.120.120.12
GPT-SIM-10 0.600.600.60 0.180.18\bf 0.18 0.180.18\bf 0.18 0.200.20\bf 0.20 0.810.810.81 0.810.81\bf 0.81 0.710.710.71 0.930.93\bf 0.93 0.480.480.48 0.180.18\bf 0.18 0.170.170.17 0.210.21\bf 0.21
GPT-SIM-20 0.600.600.60 0.180.18\bf 0.18 0.180.18\bf 0.18 0.190.190.19 0.800.800.80 0.800.800.80 0.710.710.71 0.920.920.92 0.500.50\bf 0.50 0.180.18\bf 0.18 0.180.18\bf 0.18 0.210.21\bf 0.21
GPT-MAX-5 0.610.61\bf 0.61 0.160.160.16 0.150.150.15 0.190.190.19 0.820.82\bf 0.82 0.810.81\bf 0.81 0.730.73\bf 0.73 0.920.920.92 0.490.490.49 0.150.150.15 0.140.140.14 0.190.190.19
GPT-MAX-10 0.580.580.58 0.160.160.16 0.150.150.15 0.190.190.19 0.770.770.77 0.770.770.77 0.670.670.67 0.910.910.91 0.490.490.49 0.150.150.15 0.140.140.14 0.190.190.19
GPT-CICLe 0.590.590.59 0.160.160.16 0.150.150.15 0.180.180.18 0.790.790.79 0.790.790.79 0.700.700.70 0.910.910.91 0.490.490.49 0.150.150.15 0.140.140.14 0.190.190.19
product 125612561256 classes; α=0.40𝛼0.40\alpha=0.40
RANDOM 0.000.000.00 0.000.000.00 0.000.000.00 0.000.000.00 0.000.000.00 0.000.000.00 0.000.000.00 0.000.000.00 0.000.000.00 0.000.000.00 0.000.000.00 0.000.000.00
MAJORITY 0.000.000.00 0.000.000.00 0.000.000.00 0.000.000.00 0.000.000.00 0.000.000.00 0.000.000.00 0.000.000.00 0.000.000.00 0.000.000.00 0.000.000.00 0.000.000.00
TF-IDF-LR 0.430.430.43 0.110.110.11 0.110.110.11 0.120.120.12 0.710.710.71 0.660.660.66 0.760.760.76 0.620.620.62 0.230.230.23 0.050.050.05 0.050.050.05 0.050.050.05
GPT-SIM-10 0.520.52\bf 0.52 0.180.18\bf 0.18 0.180.18\bf 0.18 0.200.20\bf 0.20 0.610.610.61 0.570.570.57 0.460.460.46 0.850.85\bf 0.85 0.470.470.47 0.130.13\bf 0.13 0.120.12\bf 0.12 0.130.130.13
GPT-SIM-20 0.510.510.51 0.180.18\bf 0.18 0.180.18\bf 0.18 0.190.190.19 0.610.610.61 0.570.570.57 0.460.460.46 0.820.820.82 0.480.48\bf 0.48 0.130.13\bf 0.13 0.120.12\bf 0.12 0.140.14\bf 0.14
GPT-MAX-5 0.510.510.51 0.160.160.16 0.170.170.17 0.160.160.16 0.680.68\bf 0.68 0.650.65\bf 0.65 0.570.57\bf 0.57 0.810.810.81 0.380.380.38 0.090.090.09 0.100.100.10 0.100.100.10
GPT-MAX-10 0.510.510.51 0.160.160.16 0.170.170.17 0.170.170.17 0.680.68\bf 0.68 0.620.620.62 0.530.530.53 0.820.820.82 0.380.380.38 0.100.100.10 0.100.100.10 0.100.100.10
GPT-CICLe 0.520.52\bf 0.52 0.160.160.16 0.170.170.17 0.170.170.17 0.660.660.66 0.610.610.61 0.520.520.52 0.810.810.81 0.390.390.39 0.100.100.10 0.100.100.10 0.100.100.10
hazard (well-supported only) 102102102 classes; α=0.20𝛼0.20\alpha=0.20
RANDOM 0.000.000.00 0.000.000.00 0.000.000.00 0.010.010.01 0.000.000.00 0.000.000.00 0.000.000.00 0.000.000.00 0.010.010.01 0.000.000.00 0.000.000.00 0.010.010.01
MAJORITY 0.000.000.00 0.000.000.00 0.000.000.00 0.010.010.01 0.000.000.00 0.000.000.00 0.000.000.00 0.000.000.00 0.010.010.01 0.000.000.00 0.000.000.00 0.010.010.01
TF-IDF-LR 0.570.570.57 0.370.370.37 0.450.450.45 0.350.350.35 0.810.810.81 0.810.810.81 0.880.880.88 0.760.760.76 0.480.480.48 0.360.360.36 0.480.480.48 0.310.310.31
GPT-SIM-10 0.620.62\bf 0.62 0.440.44\bf 0.44 0.420.420.42 0.500.50\bf 0.50 0.810.810.81 0.810.81\bf 0.81 0.710.710.71 0.930.93\bf 0.93 0.520.520.52 0.440.44\bf 0.44 0.400.400.40 0.550.55\bf 0.55
GPT-SIM-20 0.620.62\bf 0.62 0.440.44\bf 0.44 0.440.44\bf 0.44 0.490.490.49 0.800.800.80 0.800.800.80 0.710.710.71 0.920.920.92 0.540.54\bf 0.54 0.440.44\bf 0.44 0.410.41\bf 0.41 0.540.540.54
GPT-MAX-5 0.620.62\bf 0.62 0.420.420.42 0.390.390.39 0.490.490.49 0.820.82\bf 0.82 0.810.81\bf 0.81 0.730.73\bf 0.73 0.920.920.92 0.530.530.53 0.400.400.40 0.350.350.35 0.530.530.53
GPT-MAX-10 0.590.590.59 0.420.420.42 0.390.390.39 0.490.490.49 0.770.770.77 0.770.770.77 0.660.660.66 0.910.910.91 0.530.530.53 0.410.410.41 0.360.360.36 0.530.530.53
GPT-CICLe 0.610.610.61 0.420.420.42 0.390.390.39 0.480.480.48 0.790.790.79 0.790.790.79 0.700.700.70 0.910.910.91 0.530.530.53 0.400.400.40 0.350.350.35 0.520.520.52
product (well-supported only) 257257257 classes; α=0.40𝛼0.40\alpha=0.40
RANDOM 0.000.000.00 0.000.000.00 0.000.000.00 0.000.000.00 0.000.000.00 0.000.000.00 0.000.000.00 0.000.000.00 0.000.000.00 0.000.000.00 0.000.000.00 0.000.000.00
MAJORITY 0.000.000.00 0.000.000.00 0.000.000.00 0.000.000.00 0.000.000.00 0.000.000.00 0.000.000.00 0.000.000.00 0.000.000.00 0.000.000.00 0.000.000.00 0.000.000.00
TF-IDF-LR 0.570.570.57 0.470.470.47 0.500.500.50 0.490.490.49 0.710.710.71 0.660.660.66 0.760.760.76 0.620.620.62 0.580.580.58 0.410.410.41 0.440.440.44 0.400.400.40
GPT-SIM-10 0.590.590.59 0.540.540.54 0.520.520.52 0.620.620.62 0.610.610.61 0.570.570.57 0.460.460.46 0.850.85\bf 0.85 0.710.710.71 0.580.580.58 0.560.560.56 0.610.610.61
GPT-SIM-20 0.590.590.59 0.530.530.53 0.510.510.51 0.620.620.62 0.610.610.61 0.570.570.57 0.460.460.46 0.820.820.82 0.720.720.72 0.590.590.59 0.570.570.57 0.640.640.64
GPT-MAX-5 0.620.620.62 0.560.560.56 0.570.570.57 0.620.620.62 0.680.68\bf 0.68 0.650.65\bf 0.65 0.570.57\bf 0.57 0.810.810.81 0.700.700.70 0.560.560.56 0.550.550.55 0.600.600.60
GPT-MAX-10 0.630.63\bf 0.63 0.570.570.57 0.570.570.57 0.630.630.63 0.680.68\bf 0.68 0.620.620.62 0.530.530.53 0.820.820.82 0.720.720.72 0.580.580.58 0.570.570.57 0.620.620.62
GPT-CICLe 0.620.620.62 0.580.58\bf 0.58 0.580.58\bf 0.58 0.650.65\bf 0.65 0.660.660.66 0.610.610.61 0.520.520.52 0.810.810.81 0.730.73\bf 0.73 0.610.61\bf 0.61 0.600.60\bf 0.60 0.650.65\bf 0.65
Table 9: Model F1subscript𝐹1F_{1}(micro & macro), Precision (macro), and Recall (macro) on 20% holdout (i.e. only calculated on the first CV-split to save resources). Blue cells highlight the best score per column and category.
Scores (all classes) Scores (𝒞highsubscript𝒞𝑖𝑔\mathcal{C}_{high}) Scores (𝒞lowsubscript𝒞𝑙𝑜𝑤\mathcal{C}_{low})
Model F1subscript𝐹1F_{1} (micro) F1subscript𝐹1F_{1} (macro) Precision Recall F1subscript𝐹1F_{1} (micro) F1subscript𝐹1F_{1} (macro) Precision Recall F1subscript𝐹1F_{1} (micro) F1subscript𝐹1F_{1} (macro) Precision Recall
hazard-category 101010 classes; α=0.05𝛼0.05\alpha=0.05
RANDOM 0.330.330.33 0.080.080.08 0.070.070.07 0.100.100.10 0.510.510.51 0.340.340.34 0.500.500.50 0.250.250.25 0.000.000.00 0.000.000.00 0.000.000.00 0.000.000.00
MAJORITY 0.340.340.34 0.050.050.05 0.030.030.03 0.100.100.10 1.001.001.00 1.001.001.00 1.001.001.00 1.001.001.00 0.000.000.00 0.000.000.00 0.000.000.00 0.000.000.00
TF-IDF-LR 0.770.770.77 0.550.550.55 0.650.650.65 0.500.500.50 0.930.930.93 0.480.480.48 0.500.500.50 0.460.460.46 0.650.650.65 0.500.500.50 0.680.680.68 0.410.410.41
MIN-ALL 0.100.100.10 0.070.070.07 0.140.140.14 0.090.090.09 0.100.100.10 0.090.090.09 0.050.050.05 0.500.50\bf 0.50 0.100.100.10 0.080.080.08 0.150.150.15 0.110.110.11
MIN-SIM-5 0.290.290.29 0.220.220.22 0.220.220.22 0.260.260.26 0.320.320.32 0.240.240.24 0.160.160.16 0.500.50\bf 0.50 0.320.320.32 0.250.250.25 0.190.190.19 0.390.390.39
MIN-SIM-10 0.170.170.17 0.100.100.10 0.120.120.12 0.110.110.11 0.160.160.16 0.140.140.14 0.080.080.08 0.500.50\bf 0.50 0.200.200.20 0.120.120.12 0.110.110.11 0.140.140.14
MIN-SIM-20 0.090.090.09 0.060.060.06 0.070.070.07 0.090.090.09 0.090.090.09 0.080.080.08 0.040.040.04 0.500.50\bf 0.50 0.100.100.10 0.070.070.07 0.070.070.07 0.120.120.12
MIN-MAX-5 0.180.180.18 0.120.120.12 0.160.160.16 0.130.130.13 0.190.190.19 0.160.160.16 0.100.100.10 0.500.50\bf 0.50 0.220.220.22 0.170.170.17 0.150.150.15 0.200.200.20
MIN-MAX-10 0.110.110.11 0.080.080.08 0.120.120.12 0.110.110.11 0.100.100.10 0.090.090.09 0.050.050.05 0.500.50\bf 0.50 0.150.150.15 0.100.100.10 0.120.120.12 0.150.150.15
MIN-CICLe 0.560.56\bf 0.56 0.320.32\bf 0.32 0.320.32\bf 0.32 0.330.33\bf 0.33 0.660.66\bf 0.66 0.400.40\bf 0.40 0.330.33\bf 0.33 0.500.50\bf 0.50 0.450.45\bf 0.45 0.290.29\bf 0.29 0.230.23\bf 0.23 0.400.40\bf 0.40
MAX-ALL 1.001.00\bf 1.00 1.001.00\bf 1.00 1.001.00\bf 1.00 1.001.00\bf 1.00 1.001.00\bf 1.00 1.001.00\bf 1.00 1.001.00\bf 1.00 1.001.00\bf 1.00 1.001.00\bf 1.00 1.001.00\bf 1.00 1.001.00\bf 1.00 1.001.00\bf 1.00
MAX-SIM-5 0.920.920.92 0.780.780.78 0.720.720.72 0.890.890.89 0.980.980.98 0.500.500.50 0.490.490.49 0.500.500.50 0.860.860.86 0.740.740.74 0.650.650.65 0.890.890.89
MAX-SIM-10 0.980.980.98 0.850.850.85 0.810.810.81 0.950.950.95 1.001.00\bf 1.00 1.001.00\bf 1.00 1.001.00\bf 1.00 1.001.00\bf 1.00 0.960.960.96 0.820.820.82 0.760.760.76 0.940.940.94
MAX-SIM-20 1.001.00\bf 1.00 1.001.00\bf 1.00 1.001.00\bf 1.00 1.001.00\bf 1.00 1.001.00\bf 1.00 1.001.00\bf 1.00 1.001.00\bf 1.00 1.001.00\bf 1.00 1.001.00\bf 1.00 1.001.00\bf 1.00 1.001.00\bf 1.00 1.001.00\bf 1.00
MAX-MAX-5 0.980.980.98 0.790.790.79 0.740.740.74 0.880.880.88 1.001.00\bf 1.00 0.500.500.50 0.500.500.50 0.500.500.50 0.950.950.95 0.740.740.74 0.670.670.67 0.860.860.86
MAX-MAX-10 1.001.00\bf 1.00 1.001.00\bf 1.00 1.001.00\bf 1.00 1.001.00\bf 1.00 1.001.00\bf 1.00 1.001.00\bf 1.00 1.001.00\bf 1.00 1.001.00\bf 1.00 1.001.00\bf 1.00 1.001.00\bf 1.00 1.001.00\bf 1.00 1.001.00\bf 1.00
MAX-CICLe 0.960.960.96 0.760.760.76 0.710.710.71 0.870.870.87 0.990.990.99 0.500.500.50 0.500.500.50 0.500.500.50 0.920.920.92 0.710.710.71 0.640.640.64 0.850.850.85
product-category 222222 classes; α=0.05𝛼0.05\alpha=0.05
MIN-ALL 0.050.050.05 0.030.030.03 0.040.040.04 0.050.050.05 0.080.080.08 0.090.090.09 0.050.050.05 0.490.490.49 0.060.060.06 0.040.040.04 0.040.040.04 0.070.070.07
MIN-SIM-5 0.220.220.22 0.160.160.16 0.170.170.17 0.160.160.16 0.370.370.37 0.370.37\bf 0.37 0.250.250.25 0.690.69\bf 0.69 0.260.26\bf 0.26 0.220.22\bf 0.22 0.160.160.16 0.380.380.38
MIN-SIM-10 0.140.140.14 0.090.090.09 0.090.090.09 0.080.080.08 0.250.250.25 0.250.250.25 0.160.160.16 0.580.580.58 0.180.180.18 0.100.100.10 0.080.080.08 0.190.190.19
MIN-SIM-20 0.090.090.09 0.060.060.06 0.060.060.06 0.060.060.06 0.160.160.16 0.170.170.17 0.100.100.10 0.560.560.56 0.100.100.10 0.070.070.07 0.050.050.05 0.110.110.11
MIN-MAX-5 0.190.190.19 0.180.18\bf 0.18 0.190.19\bf 0.19 0.200.20\bf 0.20 0.280.280.28 0.270.270.27 0.180.180.18 0.560.560.56 0.260.26\bf 0.26 0.220.22\bf 0.22 0.180.18\bf 0.18 0.400.40\bf 0.40
MIN-MAX-10 0.100.100.10 0.060.060.06 0.060.060.06 0.070.070.07 0.210.210.21 0.200.200.20 0.120.120.12 0.610.610.61 0.100.100.10 0.060.060.06 0.050.050.05 0.110.110.11
MIN-CICLe 0.230.23\bf 0.23 0.130.130.13 0.130.130.13 0.150.150.15 0.400.40\bf 0.40 0.370.37\bf 0.37 0.270.27\bf 0.27 0.600.600.60 0.240.240.24 0.140.140.14 0.100.100.10 0.240.240.24
MAX-ALL 1.001.00\bf 1.00 1.001.00\bf 1.00 1.001.00\bf 1.00 1.001.00\bf 1.00 1.001.00\bf 1.00 1.001.00\bf 1.00 1.001.00\bf 1.00 1.001.00\bf 1.00 1.001.00\bf 1.00 1.001.00\bf 1.00 1.001.00\bf 1.00 1.001.00\bf 1.00
MAX-SIM-5 0.840.840.84 0.650.650.65 0.620.620.62 0.700.700.70 0.950.950.95 0.940.940.94 0.900.900.90 0.980.980.98 0.810.810.81 0.610.610.61 0.540.540.54 0.740.740.74
MAX-SIM-10 0.930.930.93 0.790.790.79 0.770.770.77 0.880.880.88 0.990.990.99 0.990.990.99 0.980.980.98 1.001.00\bf 1.00 0.890.890.89 0.750.750.75 0.700.700.70 0.880.880.88
MAX-SIM-20 0.970.970.97 0.850.850.85 0.860.860.86 0.870.870.87 1.001.00\bf 1.00 1.001.00\bf 1.00 1.001.00\bf 1.00 1.001.00\bf 1.00 0.940.940.94 0.810.810.81 0.800.800.80 0.840.840.84
MAX-MAX-5 0.920.920.92 0.720.720.72 0.680.680.68 0.810.810.81 1.001.00\bf 1.00 0.990.990.99 0.990.990.99 1.001.00\bf 1.00 0.860.860.86 0.650.650.65 0.580.580.58 0.790.790.79
MAX-MAX-10 0.960.960.96 0.810.810.81 0.770.770.77 0.920.920.92 1.001.00\bf 1.00 1.001.00\bf 1.00 1.001.00\bf 1.00 1.001.00\bf 1.00 0.910.910.91 0.750.750.75 0.680.680.68 0.910.910.91
MAX-CICLe 0.950.950.95 0.800.800.80 0.760.760.76 0.910.910.91 1.001.00\bf 1.00 1.001.00\bf 1.00 1.001.00\bf 1.00 1.001.00\bf 1.00 0.910.910.91 0.750.750.75 0.680.680.68 0.910.910.91
hazard 261261261 classes; α=0.20𝛼0.20\alpha=0.20
MIN-ALL 0.010.010.01 0.000.000.00 0.010.010.01 0.010.010.01 0.010.010.01 0.010.010.01 0.000.000.00 0.280.280.28 0.010.010.01 0.010.010.01 0.010.010.01 0.010.010.01
MIN-SIM-5 0.190.190.19 0.060.060.06 0.060.06\bf 0.06 0.070.070.07 0.360.360.36 0.360.360.36 0.270.270.27 0.540.540.54 0.170.170.17 0.070.07\bf 0.07 0.060.06\bf 0.06 0.090.090.09
MIN-SIM-10 0.110.110.11 0.030.030.03 0.040.040.04 0.040.040.04 0.230.230.23 0.220.220.22 0.150.150.15 0.450.450.45 0.080.080.08 0.030.030.03 0.030.030.03 0.040.040.04
MIN-SIM-20 0.060.060.06 0.020.020.02 0.020.020.02 0.030.030.03 0.130.130.13 0.130.130.13 0.080.080.08 0.430.430.43 0.040.040.04 0.030.030.03 0.020.020.02 0.030.030.03
MIN-MAX-5 0.150.150.15 0.050.050.05 0.040.040.04 0.070.070.07 0.290.290.29 0.290.290.29 0.200.200.20 0.510.510.51 0.190.190.19 0.050.050.05 0.040.040.04 0.090.090.09
MIN-MAX-10 0.080.080.08 0.030.030.03 0.030.030.03 0.050.050.05 0.160.160.16 0.160.160.16 0.100.100.10 0.480.480.48 0.100.100.10 0.030.030.03 0.020.020.02 0.070.070.07
MIN-CICLe 0.330.33\bf 0.33 0.070.07\bf 0.07 0.060.06\bf 0.06 0.090.09\bf 0.09 0.600.60\bf 0.60 0.600.60\bf 0.60 0.500.50\bf 0.50 0.750.75\bf 0.75 0.250.25\bf 0.25 0.070.07\bf 0.07 0.060.06\bf 0.06 0.110.11\bf 0.11
MAX-ALL 0.980.98\bf 0.98 0.460.46\bf 0.46 0.470.47\bf 0.47 0.450.45\bf 0.45 1.001.00\bf 1.00 1.001.00\bf 1.00 1.001.00\bf 1.00 1.001.00\bf 1.00 0.950.95\bf 0.95 0.450.45\bf 0.45 0.460.46\bf 0.46 0.440.44\bf 0.44
MAX-SIM-5 0.680.680.68 0.200.200.20 0.210.210.21 0.210.210.21 0.930.930.93 0.930.930.93 0.880.880.88 0.980.980.98 0.530.530.53 0.200.200.20 0.190.190.19 0.220.220.22
MAX-SIM-10 0.780.780.78 0.250.250.25 0.250.250.25 0.260.260.26 0.970.970.97 0.970.970.97 0.950.950.95 0.990.990.99 0.620.620.62 0.240.240.24 0.230.230.23 0.260.260.26
MAX-SIM-20 0.840.840.84 0.280.280.28 0.280.280.28 0.290.290.29 0.990.990.99 0.990.990.99 0.990.990.99 1.001.00\bf 1.00 0.680.680.68 0.260.260.26 0.260.260.26 0.280.280.28
MAX-MAX-5 0.760.760.76 0.200.200.20 0.180.180.18 0.230.230.23 0.990.990.99 0.990.990.99 0.990.990.99 1.001.00\bf 1.00 0.600.600.60 0.180.180.18 0.160.160.16 0.220.220.22
MAX-MAX-10 0.810.810.81 0.210.210.21 0.200.200.20 0.250.250.25 1.001.00\bf 1.00 1.001.00\bf 1.00 1.001.00\bf 1.00 1.001.00\bf 1.00 0.650.650.65 0.190.190.19 0.170.170.17 0.240.240.24
MAX-CICLe 0.780.780.78 0.200.200.20 0.190.190.19 0.240.240.24 0.990.990.99 0.990.990.99 0.990.990.99 1.001.00\bf 1.00 0.620.620.62 0.180.180.18 0.160.160.16 0.230.230.23
product 125612561256 classes; α=0.40𝛼0.40\alpha=0.40
MIN-ALL 0.000.000.00 0.000.000.00 0.000.000.00 0.000.000.00 0.000.000.00 0.000.000.00 0.000.000.00 0.000.000.00 0.000.000.00 0.000.000.00 0.000.000.00 0.000.000.00
MIN-SIM-5 0.120.120.12 0.040.040.04 0.040.040.04 0.050.050.05 0.200.200.20 0.170.170.17 0.130.130.13 0.280.280.28 0.090.090.09 0.020.02\bf 0.02 0.020.02\bf 0.02 0.030.03\bf 0.03
MIN-SIM-10 0.080.080.08 0.020.020.02 0.030.030.03 0.030.030.03 0.150.150.15 0.140.140.14 0.090.090.09 0.330.330.33 0.060.060.06 0.020.02\bf 0.02 0.020.02\bf 0.02 0.020.020.02
MIN-SIM-20 0.050.050.05 0.010.010.01 0.020.020.02 0.020.020.02 0.090.090.09 0.080.080.08 0.050.050.05 0.180.180.18 0.040.040.04 0.010.010.01 0.010.010.01 0.010.010.01
MIN-MAX-5 0.110.110.11 0.030.030.03 0.030.030.03 0.040.040.04 0.200.200.20 0.220.220.22 0.160.160.16 0.450.45\bf 0.45 0.060.060.06 0.010.010.01 0.010.010.01 0.020.020.02
MIN-MAX-10 0.060.060.06 0.020.020.02 0.020.020.02 0.030.030.03 0.080.080.08 0.080.080.08 0.060.060.06 0.160.160.16 0.050.050.05 0.010.010.01 0.010.010.01 0.010.010.01
MIN-CICLe 0.150.15\bf 0.15 0.050.05\bf 0.05 0.050.05\bf 0.05 0.060.06\bf 0.06 0.240.24\bf 0.24 0.240.24\bf 0.24 0.200.20\bf 0.20 0.390.390.39 0.090.09\bf 0.09 0.020.02\bf 0.02 0.020.02\bf 0.02 0.020.020.02
MAX-ALL 0.900.90\bf 0.90 0.350.35\bf 0.35 0.360.36\bf 0.36 0.340.34\bf 0.34 1.001.00\bf 1.00 1.001.00\bf 1.00 1.001.00\bf 1.00 1.001.00\bf 1.00 0.730.73\bf 0.73 0.240.24\bf 0.24 0.250.25\bf 0.25 0.240.24\bf 0.24
MAX-SIM-5 0.490.490.49 0.160.160.16 0.170.170.17 0.160.160.16 0.720.720.72 0.660.660.66 0.580.580.58 0.810.810.81 0.380.380.38 0.100.100.10 0.100.100.10 0.110.110.11
MAX-SIM-10 0.580.580.58 0.180.180.18 0.200.200.20 0.190.190.19 0.810.810.81 0.760.760.76 0.690.690.69 0.880.880.88 0.410.410.41 0.120.120.12 0.120.120.12 0.120.120.12
MAX-SIM-20 0.650.650.65 0.210.210.21 0.230.230.23 0.220.220.22 0.870.870.87 0.820.820.82 0.770.770.77 0.910.910.91 0.480.480.48 0.140.140.14 0.140.140.14 0.140.140.14
MAX-MAX-5 0.590.590.59 0.170.170.17 0.170.170.17 0.170.170.17 0.850.850.85 0.820.820.82 0.780.780.78 0.910.910.91 0.330.330.33 0.080.080.08 0.080.080.08 0.080.080.08
MAX-MAX-10 0.640.640.64 0.180.180.18 0.190.190.19 0.190.190.19 0.900.900.90 0.860.860.86 0.830.830.83 0.920.920.92 0.370.370.37 0.090.090.09 0.090.090.09 0.090.090.09
MAX-CICLe 0.620.620.62 0.180.180.18 0.190.190.19 0.180.180.18 0.860.860.86 0.840.840.84 0.800.800.80 0.930.930.93 0.360.360.36 0.080.080.08 0.090.090.09 0.090.090.09
Table 10: Model F1subscript𝐹1F_{1}(micro & macro), Precision (macro), and Recall (macro) on 20% holdout (i.e. only calculated on the first CV-split to save resources). Blue cells highlight the best score per column and category. Rows named "MIN-[METHOD]" sigignify a lower bound on performance for prompting with [METHOD], while rows named "MAX-[METHOD]" signify an upper bound.