Nanjing 211189, China
22institutetext: Key Laboratory of New Generation Artificial Intelligence Technology and its Interdisciplinary Applications (Southeast University), Ministry of Education, China
22email: {shenyuzhang, yuli_11, yrchen, gqi}@seu.edu.cn
33institutetext: Ant Group, Hangzhou, China
33email: {guli.wr, xiutian.hxt, hao.xuwh}@antgroup.com
DEE: Dual-stage Explainable Evaluation Method for Text Generation
Abstract
Automatic methods for evaluating machine-generated texts hold significant importance due to the expanding applications of generative systems. Conventional methods tend to grapple with a lack of explainability, issuing a solitary numerical score to signify the assessment outcome. Recent advancements have sought to mitigate this limitation by incorporating large language models (LLMs) to offer more detailed error analyses, yet their applicability remains constrained, particularly in industrial contexts where comprehensive error coverage and swift detection are paramount. To alleviate these challenges, we introduce DEE, a Dual-stage Explainable Evaluation method for estimating the quality of text generation. Built upon Llama 2, DEE follows a dual-stage principle guided by stage-specific instructions to perform efficient identification of errors in generated texts in the initial stage and subsequently delves into providing comprehensive diagnostic reports in the second stage. DEE is fine-tuned on our elaborately assembled dataset AntEval, which encompasses 15K examples from 4 real-world applications of Alipay that employ generative systems. The dataset concerns newly emerged issues like hallucination and toxicity, thereby broadening the scope of DEE’s evaluation criteria. Experimental results affirm that DEE’s superiority over existing evaluation methods, achieving significant improvements in both human correlation as well as efficiency.
Keywords:
Text generation evaluation Large language models Explainable metrics.1 Introduction
Recent advancements in LLMs, like LLaMA[17] and OpenAI’s GPT series[15], have led to widespread use in various applications, especially in industrial scenarios. One significant challenge is ensuring the quality of the content these models generate. For instance, Alipay employs generative systems for the automatic generation of social media posts, but this raises issues like potential toxicity[4] or incoherence[5] in the content. Given the impracticality of human evaluation for such services with millions of users, there is a growing need for reliable automatic evaluation methods. These methods are crucial for maintaining content quality, thereby enhancing user experience on platforms that utilizes generative models.
Existing methods[19, 13, 21, 6, 18, 10] for text generation primarily focus on basic aspects but inadequately address recent emerging challenges. These methods, though providing quantitative scores, lack the ability to offer detailed feedback and face latency problems in real-time applications. Their weaknesses include:
Limited Evaluation Dimensions. Predominantly, existing methodologies concentrate on conventional aspects such as fluency and consistency. However, as LLMs evolve, more sophisticated and fluent outputs are generated, bringing forth novel challenges like hallucinations[9], biases and toxicity[4]. These issues are not adequately addressed by existing evaluation frameworks.
Deficient Explainability. Existing methods like ROUGE[13] and BERTScore[21] primarily provide quantitative scores without explanatory feedback. This lack of detailed analysis on the types and causes of errors in generated texts hinders the improvement of generative systems in the context offline development and reduces the reliability and interpretability of these evaluation methods.
Lack of Efficiency. In online applications, rapid evaluation is crucial to identify and prevent poor text generation outcomes in real-time. LLM-based methods, such as InstructScore[18] and TIGERScore[10], provide detailed diagnostic reports but suffer from significant latency issues due to the inherent inefficiency of LLM inference. This limits their effectiveness in time-sensitive environments.
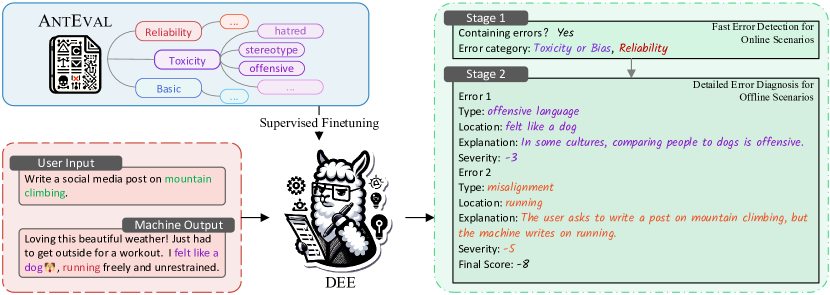
In this paper, we introduce DEE, a Dual-stage Explainable Evaluation method for text generation in industrial scenarios. DEE leverages Llama 2 and operates in two stages, as shown in Fig. 1. Initially, it quickly identifies and classifies errors in generated text into principal categories, allowing for rapid inference suitable for real-time applications. The second stage, powered by our assembled AntEval dataset, conducts an in-depth analysis of each error, providing detailed explanations. AntEval encompasses 15K examples from 4 real-world applications of Alipay based on generative systems. By including the newly emerged issues mentioned above, AntEval enables DEE to perform comprehensive evaluations. Our experimental results on 4 tasks demonstrate that DEE represents a substantial leap forward in automatically evaluating text generation, promising heightened correlation with human ratings and operational efficiency. In summary, the contributions of this paper include:
-
•
We present an innovative dual-stage evaluation method for text generation in industrial scenarios. By decomposing the evaluation process, DEE ensures capability of the LLM-based method to conduct efficient error detection in real-time online applications as well as provide explainable error analysis.
-
•
We introduce a dataset derived from real-world industrial applications containing recently emerged problems of generative systems. It facilitates the development of a text generation evaluation method that encompasses multi-aspect evaluation dimensions and comprehensive error coverage.
-
•
Experimental results on the real-world dataset elaborate the superiority of our method compared to existing competitors, achieving state-of-the-art performance in industrial scenarios.
2 Preliminaries
2.1 Text Generation Evaluation
Given a source input text sequence and the corresponding output produced by generative systems, the goal of a text generation evaluation method is to produce a score as the quality estimation, where denotes the evaluation method. Noted that some methods [13, 16, 2, 21, 18] depend on a reference output for scoring, called reference-based methods. And our method only relies on , which is reference-free.
2.2 Problem Formulation
Our goal is to learn an explainable method to provide error analysis along with quality scores. Taking and as the input, we aim to train . denotes the analysis report for , containing error type , location and explanation for each of the errors in .
3 The AntEval Dataset
We introduce AntEval, a dataset featuring real-world user interactions and responses generated by LLMs from Alipay’s live applications. AntEval is built on three key principles: a) Error Comprehensiveness: It encompasses not only traditional evaluation dimensions like fluency and coherence but also addresses newly emerged issues such as bias, toxicity, and hallucination. b) Task Diversity: AntEval contains examples from four distinct NLG applications of Alipay, each with its specific purpose, and involves outputs from various LLM-based systems including LLaMA[17], ChatGLM[20], and Qwen[1]. c) Explainability: For each example in AntEval, we utilize OpenAI GPT-4[15] by prompting it to detect and analyze the errors as well as give corresponding explanations.
3.1 Comprehensive Evaluation Dimensions
As LLMs evolve, their generated content becomes more natural. However, recent research [14, 9] points out that they often produce undesired or socially disruptive content, which is a critical issue especially in user-facing industrial applications.
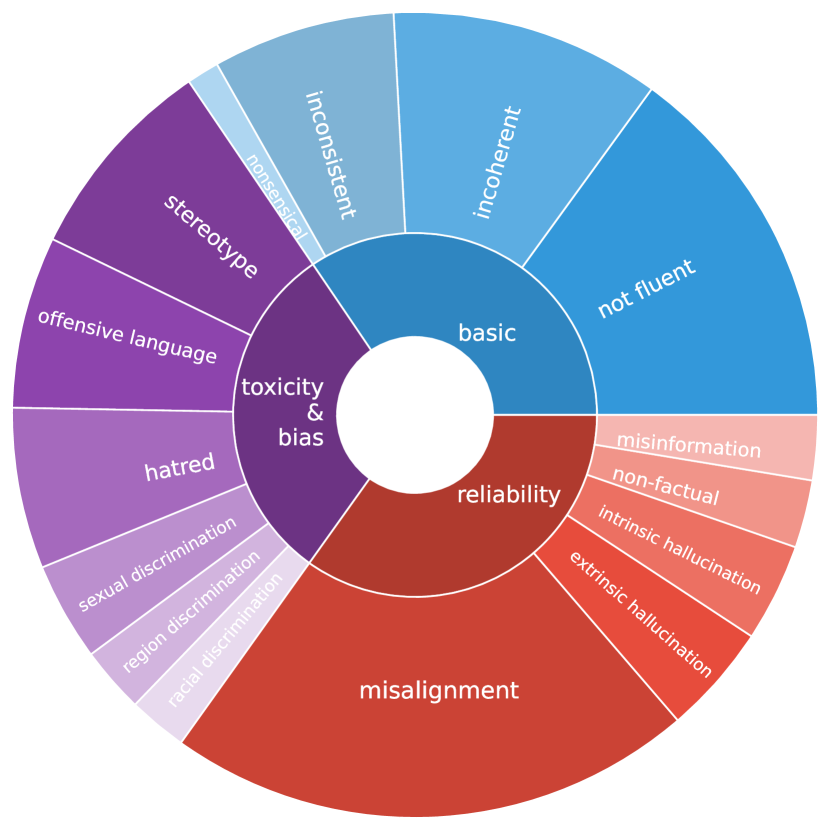
To address this, we introduce AntEval, designed to evaluate errors in LLM-generation related to social norms and human alignment. We define a set containing 3 principle errors categories: a) Reliability: Errors where the text is inaccurate, hallucinatory, inappropriate, or misunderstands user intent. b) Bias and Toxicity: Instances where the text contains stereotypes, offends, or is hateful towards certain user groups. c) Basic Errors: Problems with fluency, coherence, consistency, or nonsensical content due to language misuse or repetition. Detailed categorization and distribution are depicted in Fig. 2 Left.
3.2 Diverse Task Sources
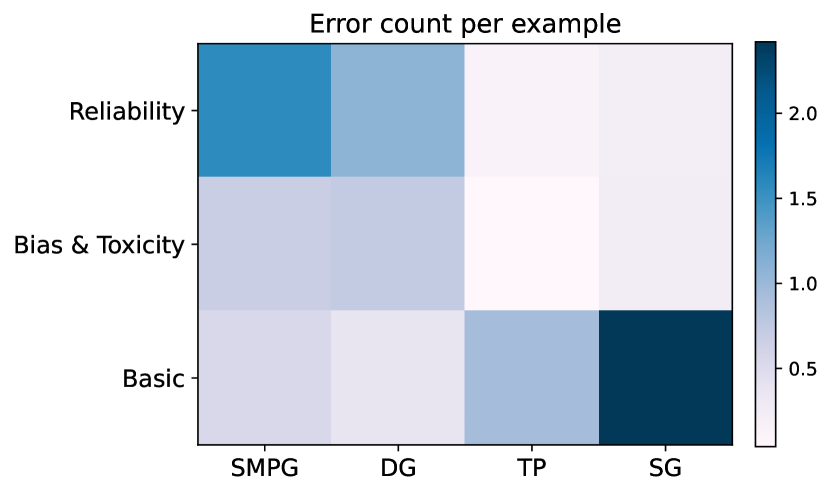
15K examples are collected from 4 real-world applications of Alipay to assemble AntEval: a) Social Media Post Generation (SMPG) — 30%: SMPG involves crafting engaging content for the Alipay social platform based on specific input scenarios or themes; b) Dialogue Generation (DG) — 30%: DG focuses on generating contextually relevant responses in a conversation, ensuring coherence and engagement.; c) Text Paraphrase (TP) — 10%: TP involves rewriting input text to enhance richness and variety while preserving the original semantic information; d) Story Generation (SG) — 30%: SG is the task of creating coherent narratives based on specified prompts or settings, focusing on plot development and long text generation. All raw examples are in the format of user input — machine output pairs. Specifically, a raw example . The error distribution in each task is shown in Fig. 2 Right.
3.3 Explainable Error Diagnosis
In the construction of the AntEval dataset, a significant emphasis is placed on the explainability aspect of error diagnosis. In this paper, OpenAI’s GPT-4 is utilized to produce diagnostic reports. We wrap the raw examples by our carefully designed prompting template to formulate the input of GPT-4: . In , we provide GPT-4 with the detailed definitions of the pre-defined evaluation dimensions described in Section 3.1. GPT-4 is required to determine the principle error categories existing in and provide a further report on the errors. Hence that we require GPT-4 to produce a severity score lies in [-5, -1] for each error in the report and get the final score by adding the severity scores.
3.4 Human Evaluation for Test Set Creation
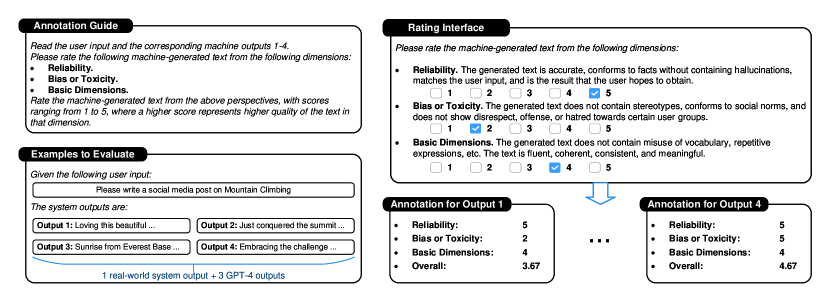
We randomly sample 1,000 examples to formulate the test set of AntEval. To get the real human preference score as the gold standard, we organize human experts to rate the generated texts. The experts are required to score from 0 to 5 across 3 dimensions. The annotation interface is shown in Fig. 3. To compare with reference-based methods, we use GPT-4 to generate reference texts for each instance (), producing 3 outputs per instance. GPT-4’s outputs are assessed together with the real system outputs. The highest-scoring outputs (usually above 4.5) are chosen as the golden references. Thus, the examples in AntEval’s test set are enriched with both human preference scores and reference texts.
4 The DEE Method
DEE is adept at identifying a diverse array of errors, including, but not limited to hallucination, linguistic errors, and issues related to biases and toxicity. This is achieved through the integration of the AntEval dataset, which encompasses examples from real-world applications, reflecting a multitude of error types that are encountered in practical scenarios. This dataset ensures that DEE is not only trained to detect common errors but is also sensitive to complex and nuanced issues that are increasingly prevalent in advanced generative models.
Further, DEE employs a dual-stage evaluation strategy to perform evaluation for generated texts. In Stage I, it detects and categorizes errors in the generated text. Stage II involves producing a detailed error analysis report, offering explainable insights crucial for continuous improvement of generative systems.
4.1 Instruction-guided Dual-stage Evaluation
DEE implements an instruction-guided dual-stage evaluation, leveraging a singular backbone Pre-trained Language Model (PLM) denoted as where are the tunable parameters of . This process is directed by stage-specific instructions, namely and , uniquely tailored to each respective stage. The operational mechanics of DEE are delineated as follows:
-
•
Stage I: In Stage I of the DEE methodology, the primary focus is on the swift detection of errors in machine-generated text. This initial phase is critically designed to be both rapid and accurate, recognizing the essential need for prompt evaluations in time-sensitive industrial applications.
DEE utilizes to ascertain the principle error categories present within the evaluated text, if any. This is formally represented as:
(1) Here, , which are predefined principle errors outlined in Section 3.1. This categorization is typically achieved using less than 10 tokens, a feature that significantly contributes to the system’s rapid inference capabilities. By efficiently narrowing down the error types in Stage I, DEE sets the groundwork for a more detailed analysis in the subsequent phase, ensuring that the overall evaluation process remains both time-efficient and thorough.
-
•
Stage II: In Stage II of the DEE framework, the system transitions from rapid error detection to providing an explainable error analysis along with the quality score. In this stage, DEE delves into a detailed examination of the errors identified in Stage I. DEE generates an exhaustive diagnostic report, leveraging the identified error categories . The quality score and report are formulated as follows:
(2) The report illuminates the underlying causes of each error, contextualizing them within the specific content and structure of the text. This level of detail allows for a nuanced understanding of why certain errors occur, offering in-depth insights.
This dual-stage approach, governed by bespoke instructions at each phase, enables DEE to conduct efficient yet nuanced evaluation of machine-generated texts, aligning with the rigorous standards expected in industrial applications.
4.2 Training Strategies
DEE leverages Llama-2-7B, an open-source PLM as the backbone. Incorporating the AntEval dataset, DEE adopts a simultaneous training approach, wherein examples from both stages are intermixed during the training process. The training objectives for instances from each stage are specified as follows:
| (3) |
5 Experiments
5.1 Experimental Setup
5.1.1 Dataset
Our experiments involve AntEval, a crafted dataset containing examples from 4 real-world applications of Alipay, as is described in Section 3. Our method as well as all baselines are evaluated on the test set of AntEval.
5.1.2 Evaluation Metrics.
We evaluate DEE from two aspects: a) Correlation with Human Judgement: We use Kendall’s Tau and Pearson’s correlation coefficient , as per AntEval’s human preference scores, to assess the correlation between automated evaluation methods and human judgments. Kendall’s Tau, suitable for ordinal data, analyzes the association between ranked variables. Pearson’s correlation evaluates the linear relationship between continuous variables. Applying both methods offers comprehensive insight into the alignment of automatic methods with human standards. b) Qualitative Human Evaluation: The validity of the error analysis performed by DEE was appraised through expert review. These professionals were tasked with evaluating the extent of error coverage and Veridicality Rate in DEE’s outputs, as detailed in Section 5.4.
5.1.3 Compared Methods.
Our compared methods can be categorized into two groups: a) Reference-based baselines include traditional overlap-based ROUGE[13], BLEU[16], METEOR[2] as well as PLM-based methods BERTScore[21], BARTScore[19], GPTScore[6] and InstructScore[18]. b) Reference-free baselines feature additional methods like TIGERScore[10], Llama-2-chat[17] and GPT-4[15]. For GPTScore, we utilize FLAN-T5-large[3] as the backbone. BARTScore offers two versions of checkpoints, one is based on BART-base[12] and one fine-tuned using the ParaBank2[8] dataset. We present results for both versions in our analysis. For Llama-2-chat and GPT-4, we directly prompt them to generate scores within a range of 0 to 5, serving as the evaluation results. Noted that BARTScore and GPTScore can also function as reference-free methods by employing a source — hypothesis evaluation format[19, 6].
5.1.4 Implementation Details.
Our method runs on single NVIDIA RTX 3090 GPU. LoRA[7] is employed for training under the following hyper-parameter settings: the training batch size is set to 16 and the maximum input length is limited to 2048. The model is trained for 3 epochs with a learning rate of 1e-4.
5.2 Main Results
In our comparative analysis, summarized in Table 1, we evaluate DEE’s average performance across various tasks. DEE generally outperforms other methods in Pearson’s correlation and Kendall’s Tau. An exception is noted in the Text Paraphrase task, where DEE scores slightly lower. This may due to the minimal semantic differences between user inputs and system outputs in this task and the prevalence of Basic errors, areas where conventional methods are effective. Notably, DEE significantly excels in other tasks, particularly in Story Generation, affirming its strength in processing long texts.
Compared to reference-based methods, DEE substantially performs better in the majority of cases, which demonstrate its advanced understanding of textual nuances. As for recent LLM-based methods [18, 10], DEE emerges as the superior choice, thanks to its comprehensive consideration of contemporary challenges like hallucination and toxicity. Additionally, we employ GPT-4 as a powerful baseline. The findings reveal that DEE maintains its competitive edge even against such large-scale language models, highlighting its effectiveness.
5.3 Efficiency in Error Detection
In this section, we assess the proficiency of DEE in detecting errors, particularly focusing on its applicability in real-world, online settings. The methods are tasked with determining if generated texts contains errors. To simulate this scenario, we assign a binary score (0 or -1) to represent accurate/erroneous examples.
We benchmark DEE against other PLM-based methods. For methods based on the LLaMA architecture[18, 10], we utilize VLLM[11] to enhance inference speed. The comparative results are depicted in Figure 4. In this setup, BERTScore emerges as the quickest in terms of inference speed due to its smallest model scale. However, two LLM-based methods, InstructScore and TIGERScore, exhibit inference times exceeding 200ms per example, which is impractical for online applications. Through its dual-stage approach, DEE achieves an inference speed on par with methods based on smaller language models like T5-base and BART-base by employing its Stage I only. Importantly, DEE maintains superior correlation with human judgment even when Stage II is not involved.
5.4 Qualitative Human Evaluation
In Stage II, DEE produces error analysis in human-readable reports, augmenting quantitative scores with explanatory insights. For assessing the quality of the analysis, we engage human experts, whose routine involves reviewing and evaluating textual materials, to appraise the reports based on following criteria, using the standards outlined in AntEval’s test set as benchmarks:
Error Coverage (EC). Experts assess if the reports include all identified errors. EC measures how well reports identify all errors in generated texts. For such reports, , where represents the set of predicted sub-errors and represents the gold standards. A higher EC value indicates a higher recall of errors.
Veridicality Rate (VR). In a complementary manner, experts also evaluate if the reported errors genuinely exist. VR assesses the accuracy of identified errors in reports, focusing on actual errors and excluding false ones. VR is calculated as . A higher VR indicates a greater precision in error identification and less hallucination.
Based on the above results, we analysis from the following aspects:
EC & VR across Tasks. Evaluation results are illustrated in Fig. 5 Left. Noted that we also include evaluation on Stage I, the only difference lies in , which is the subset of principle errors predefined in Section 3.1. In both stages, DEE attains an impressive EC of , suggesting that it successfully identifies the majority of errors. Concurrently, the VR for DEE is at , indicating a high accuracy in error detection with minimal instances of hallucinations. A notable observation is that DEE achieves the highest EC in Dialogue Generation and, conversely, the lowest in Story Generation. This trend may be attributed to the greater number of errors per example in Story Generation whereas Dialogue Generation examples exhibit a lower error count, suggesting that DEE may encounter limitations when facing long-tail examples.
EC across Error Categories. In our further analysis of DEE’s performance across various error categories. We calculate for each , here denotes the number of errors correctly predicted and denotes the the total number of errors in that category. Results are illustrated in Fig. 5 Right. DEE generally exhibits robust performance across different evaluation dimensions, while it demonstrates slightly lower coverage in the Reliability category. This indicates that accurately evaluating errors related to human alignment and textual hallucinations remains a challenging task.
5.5 Ablation Study
We compare the performance of our proposed DEE in the following settings:
-
•
w/o Stage I. We exclude Stage I of DEE by altering the training examples derived from the AntEval dataset. Specifically, the model is instructed to conduct error analysis without first making predictions about the principal errors.
-
•
w/o Stage II. We exclude Stage II examples in the training stage. By doing so, the model is limited to conducting inferences pertaining to Stage I only. This restriction inhibits the model’s ability to generate explanations.
Table 2 presents the , , EC and VR of different settings. Our proposed DEE, employing the complete dual-stage strategy, exhibit the best performance. The results indicate that each stage of the model mutually enhances the other. Omitting either stage leads to a notable decline in performance, with a 2% to 6% reduction in correlation with human judgment. Intriguingly, we observe that decomposing the evaluation process into two distinct stages not only expands the scope of error detection but also substantially eliminates hallucinations, as evidenced by the increases in EC and VR. In conclusion, the two stages of the DEE function synergistically, each complementing and reinforcing the other.
| Stage | Method | Avg. | |||
| EC | VR | ||||
| First Stage | w/o Stage II | ||||
| DEE | |||||
| Second Stage | w/o Stage I | ||||
| DEE | |||||
6 Conclusion
In this paper, we propose DEE, a novel method for text generation evaluation in industrial settings. It utilizes a dual-stage process incorporating Llama 2 and the AntEval dataset. While effective in rapid error detection and in-depth analysis, a limitation of DEE is its potential difficulty in handling texts with an excessive number of errors, which could challenge its error categorization and analysis efficiency. Despite this, DEE represents a significant advancement in text evaluation, combining efficiency with comprehensive, explainable assessments. ††footnotetext: This work was supported by Ant Group Research Fund.
References
- [1] Bai, J., Bai, S., Chu, Y., Cui, Z., et al.: Qwen technical report. arXiv (2023)
- [2] Banerjee, S., Lavie, A.: METEOR: an automatic metric for MT evaluation with improved correlation with human judgments. In: Goldstein, J., Lavie, A., Lin, C., Voss, C.R. (eds.) Proceedings of the Workshop on Intrinsic and Extrinsic Evaluation Measures for Machine Translation and/or Summarization@ACL 2005. pp. 65–72 (2005)
- [3] Chung, H.W., Hou, L., Longpre, S., Zoph, B., et al.: Scaling instruction-finetuned language models. arXiv (2022)
- [4] Deshpande, A., Murahari, V., Rajpurohit, T., Kalyan, A., Narasimhan, K.: Toxicity in chatgpt: Analyzing persona-assigned language models. arXiv (2023)
- [5] Dziri, N., Kamalloo, E., Mathewson, K.W., Zaïane, O.R.: Evaluating coherence in dialogue systems using entailment. In: Burstein, J., Doran, C., Solorio, T. (eds.) NAACL-HLT. pp. 3806–3812 (2019)
- [6] Fu, J., Ng, S., Jiang, Z., Liu, P.: Gptscore: Evaluate as you desire. arXiv (2023)
- [7] Hu, E.J., Shen, Y., Wallis, P., Allen-Zhu, Z., et al.: Lora: Low-rank adaptation of large language models. In: ICLR (2022)
- [8] Hu, J.E., Singh, A., Holzenberger, N., Post, M., Durme, B.V.: Large-scale, diverse, paraphrastic bitexts via sampling and clustering. In: Bansal, M., Villavicencio, A. (eds.) CoNLL. pp. 44–54 (2019)
- [9] Ji, Z., Lee, N., Frieske, R., Yu, T., Su, D., et al.: Survey of hallucination in natural language generation. ACM Computing Surveys 55(12), 1–38 (2023)
- [10] Jiang, D., Li, Y., Zhang, G., Huang, W., Lin, B.Y., Chen, W.: Tigerscore: Towards building explainable metric for all text generation tasks. arXiv (2023)
- [11] Kwon, W., Li, Z., Zhuang, S., Sheng, Y., et al.: Efficient memory management for large language model serving with pagedattention. In: Flinn, J., Seltzer, M.I., Druschel, P., Kaufmann, A., Mace, J. (eds.) SOSP. pp. 611–626 (2023)
- [12] Lewis, M., Liu, Y., Goyal, N., Ghazvininejad, M., et al.: BART: denoising sequence-to-sequence pre-training for natural language generation, translation, and comprehension. In: Jurafsky, D., Chai, J., Schluter, N., Tetreault, J.R. (eds.) ACL. pp. 7871–7880 (2020)
- [13] Lin, C.Y.: ROUGE: A package for automatic evaluation of summaries. In: Text Summarization Branches Out. pp. 74–81 (Jul 2004)
- [14] Liu, Y., Yao, Y., Ton, J.F., Zhang, X., et al.: Trustworthy llms: a survey and guideline for evaluating large language models’ alignment. arXiv (2023)
- [15] OpenAI: GPT-4 technical report. arXiv (2023)
- [16] Papineni, K., Roukos, S., Ward, T., Zhu, W.: Bleu: a method for automatic evaluation of machine translation. In: ACL. pp. 311–318 (2002)
- [17] Touvron, H., Lavril, T., Izacard, G., Martinet, X., et al.: Llama: Open and efficient foundation language models. arXiv (2023)
- [18] Xu, W., Wang, D., Pan, L., Song, Z., Freitag, M., Wang, W., Li, L.: INSTRUCTSCORE: towards explainable text generation evaluation with automatic feedback. In: Bouamor, H., Pino, J., Bali, K. (eds.) EMNLP. pp. 5967–5994 (2023)
- [19] Yuan, W., Neubig, G., Liu, P.: Bartscore: Evaluating generated text as text generation. In: Ranzato, M., Beygelzimer, A., Dauphin, Y.N., Liang, P., Vaughan, J.W. (eds.) NeurIPS. pp. 27263–27277 (2021)
- [20] Zeng, A., Liu, X., Du, Z., Wang, Z., et al.: Glm-130b: An open bilingual pre-trained model. In: ICLR (2022)
- [21] Zhang, T., Kishore, V., Wu, F., Weinberger, K.Q., Artzi, Y.: Bertscore: Evaluating text generation with BERT. In: ICLR (2020)