SDSS J075217.84+193542.2: X-ray weighing of a secondary BH
Abstract
Precise measurements of black hole (BHs) masses are necessary to understand the coevolution of these sources and their host galaxies. Sometimes in the center of a galaxy there is not one, but two BHs. The BH duality of the quasar nucleus SDSS J075217.84+193542.2 (herein SDSS J0752) was recently proposed based on the observed strict periodicity of optical emission from the source. We tested this assumption using X-ray observations with Swift/XRT (2008–2010). We fitted the SDSS J075217 spectrum using a Comptonization model and discovered soft X-ray variability in the 0.3–10 keV energy range. We pursued a scenario in which two supermassive BHs at the center of SDSS J0752 form a pair; and the less massive (secondary) BH periodically crosses/punctures the disk around the more massive (primary) BH. We associate these periodic crossings with tidal disruptions of the disk and, as a consequence, with an increase in X-rays seen as a flare in SDSS J0752. During such an X-ray flare event (2008–2010), we discovered a change in the source spectral states and the photon index saturation at the level with mass accretion rate . For BH mass scaling we used sources: OJ 287, M101 ULX–1 and HLX–1 ESO 243–49, as a reference ones, and found that M solar masses, assuming Mpc. Thus, we obtained a lower limit to a BH mass due the unknown inclination. In addition, we used the virial mass of the secondary BH based on -line measurements and we estimated the binary’s inclination at SDSS J0752, , using a scaling technique.
1 Introduction
The duality of objects is a fairly common phenomenon in astrophysics. Most stars in the Universe are binary. Duality is also common among galaxies. Over the past few years, the number of detected binary black holes (BHs) in the centers of galaxies has increased sharply. Although such double objects are no longer uncommon, the manifestation of their binarity remains not fully understood. Analysis of the dual nature of BHs in active galactic nuclei (AGNs) confirms the reality of supermassive BH (SMBH) mergers in galactic nuclei. Scientists have long been concerned about the problem of the origin of ultra massive black holes, because due to the matter accretion onto stellar-mass BHs, they could not form, since this would require time longer than the lifetime of the Universe. The discovery of binary AGNs, observations of massive BH merger events and confirmations of the high resulting masses of such BHs obtained in recent years are a real breakthrough in our understanding the origin of ultra massive BHs through maasive BH mergers in galactic nuclei.
Binary supermassive black holes are a remarkable by-product of galaxy mergers in the hierarchical universe (Begelman et al.,, 1980). In the very last stage of their orbital evolution, gravitational wave radiation powers the binary inspiral. Periodic X-ray/optical/radio flares from AGNs during their orbital rotation have been proposed as a powerful tool for studying such binary systems (Chen et al.,, 2020; Liu et al.,, 2016). It should be noted that the very idea of binary systems with SMBHs was expressed by Boris Komberg back in 1967 (Komberg,, 1967). Subsequently, their hypothesis about the possible duality of nuclei in quasars was brilliantly confirmed by observations (Sect. 3). However, the methods for establishing the duality of SMBHs is tenuous at best and is based on four criteria (Seifina et al.,, 2023).
First of all, the duality of galactic nuclei is is in some cases demonstrated by analyzing their observed images (for nearby galaxies), which allows us to resolve the double structure of their central regions (for example, NGC 7727, Voggel et al., (2022); NGC 6240, Kollatschny et al., (2020); Mrk 739, Koss et al., (2011); UGC 4211, Koss et al., (2023)). For distant AGNs, spectroscopic studies make it possible to establish duality by the characteristic behavior of spectral line systems (SDSS J1537+044, Boroson and Lauer, (2009); SDSS J0927+294, Eracleous et al., (2012)). It is clear that the described methods are no longer applicable for very distant sources. In fact, the collision of galaxies (and, accordingly, their nuclei) in the past, which led to the formation of a binary from two SMBHs, but there is in no way to indicate the duality of their new “nucleus”, except perhaps for the presence of “extra” jets in 3C 75 (Molnar et al.,, 2017) or the strict periodicity of the source flares in OJ 287 (Titarchuk et al.,, 2023; Zhang et al.,, 2022). In such cases, the duality of the nucleus can sometimes be established by individual exotic features, for example, by the same bending of the jets of each of the SMBHs, by the specific shape of the light curve (for example, from periodicity and from the double-humped flare maximum in the light curve) or as a possible way to connect the results on optical, X-ray and radio data for the same object. As an interesting additional criterion for duality, Titarchuk et al., (2023) pointed to the duality of SMBHs in an AGN, established by the following peculiarities. Namely, the discrepancy between the BH mass according to X-ray and optical data, as a possible consequence of the duality of the central AGN in M87 (see Titarchuk et al., (2023, 2020); Seifina et al., (2023)).
Binary BHs in distant quasars are of particular interest and complexity. Because of their remoteness, it is impossible to establish the duality of their nuclei by direct imaging or Doppler shift analysis of spectral lines. Therefore, the main method for establishing their duality is through analysis of the periodicity of radiation from such sources, which may reveal quasi-periodic oscillations (QPOs) of their emission.
Recently, a QPO with a periodicity of 6.4 years was discovered in the quasar SDSS J075217.84+193542.2 (herein SDSS J0752) by Zhang et al., (2022) at a redshift of 0.117 (Paris et al.,, 2018). The discovery of this QPO made this quasar a reliable candidate for the binary systems containing SMBHs. In fact, the BH duality in the SDSS J0752 center is indicated by the detection of two Gaussian components in the broad Hα line, with an expected spatial distance about 0.02 pc between these two central SMBHs. Their virial masses are about and (Table 1).
This periodicity is derived from analysis of the 13.6-year optical light curve from the Catalina Sky Survey (CSS) (Drake et al.,, 2009) and from the All-Sky Automated Survey for Supernovae (ASAS-SN) (Shappee et al.,, 2014; Kochanek et al.,, 2017). The 6.4-year QPOs are also confirmed using the generalized Lomb-Scargle periodogram with a confidence level above 99.99%, as well as using the results of autocorrelation analysis and using the weighted wavelet z-transformation technique.
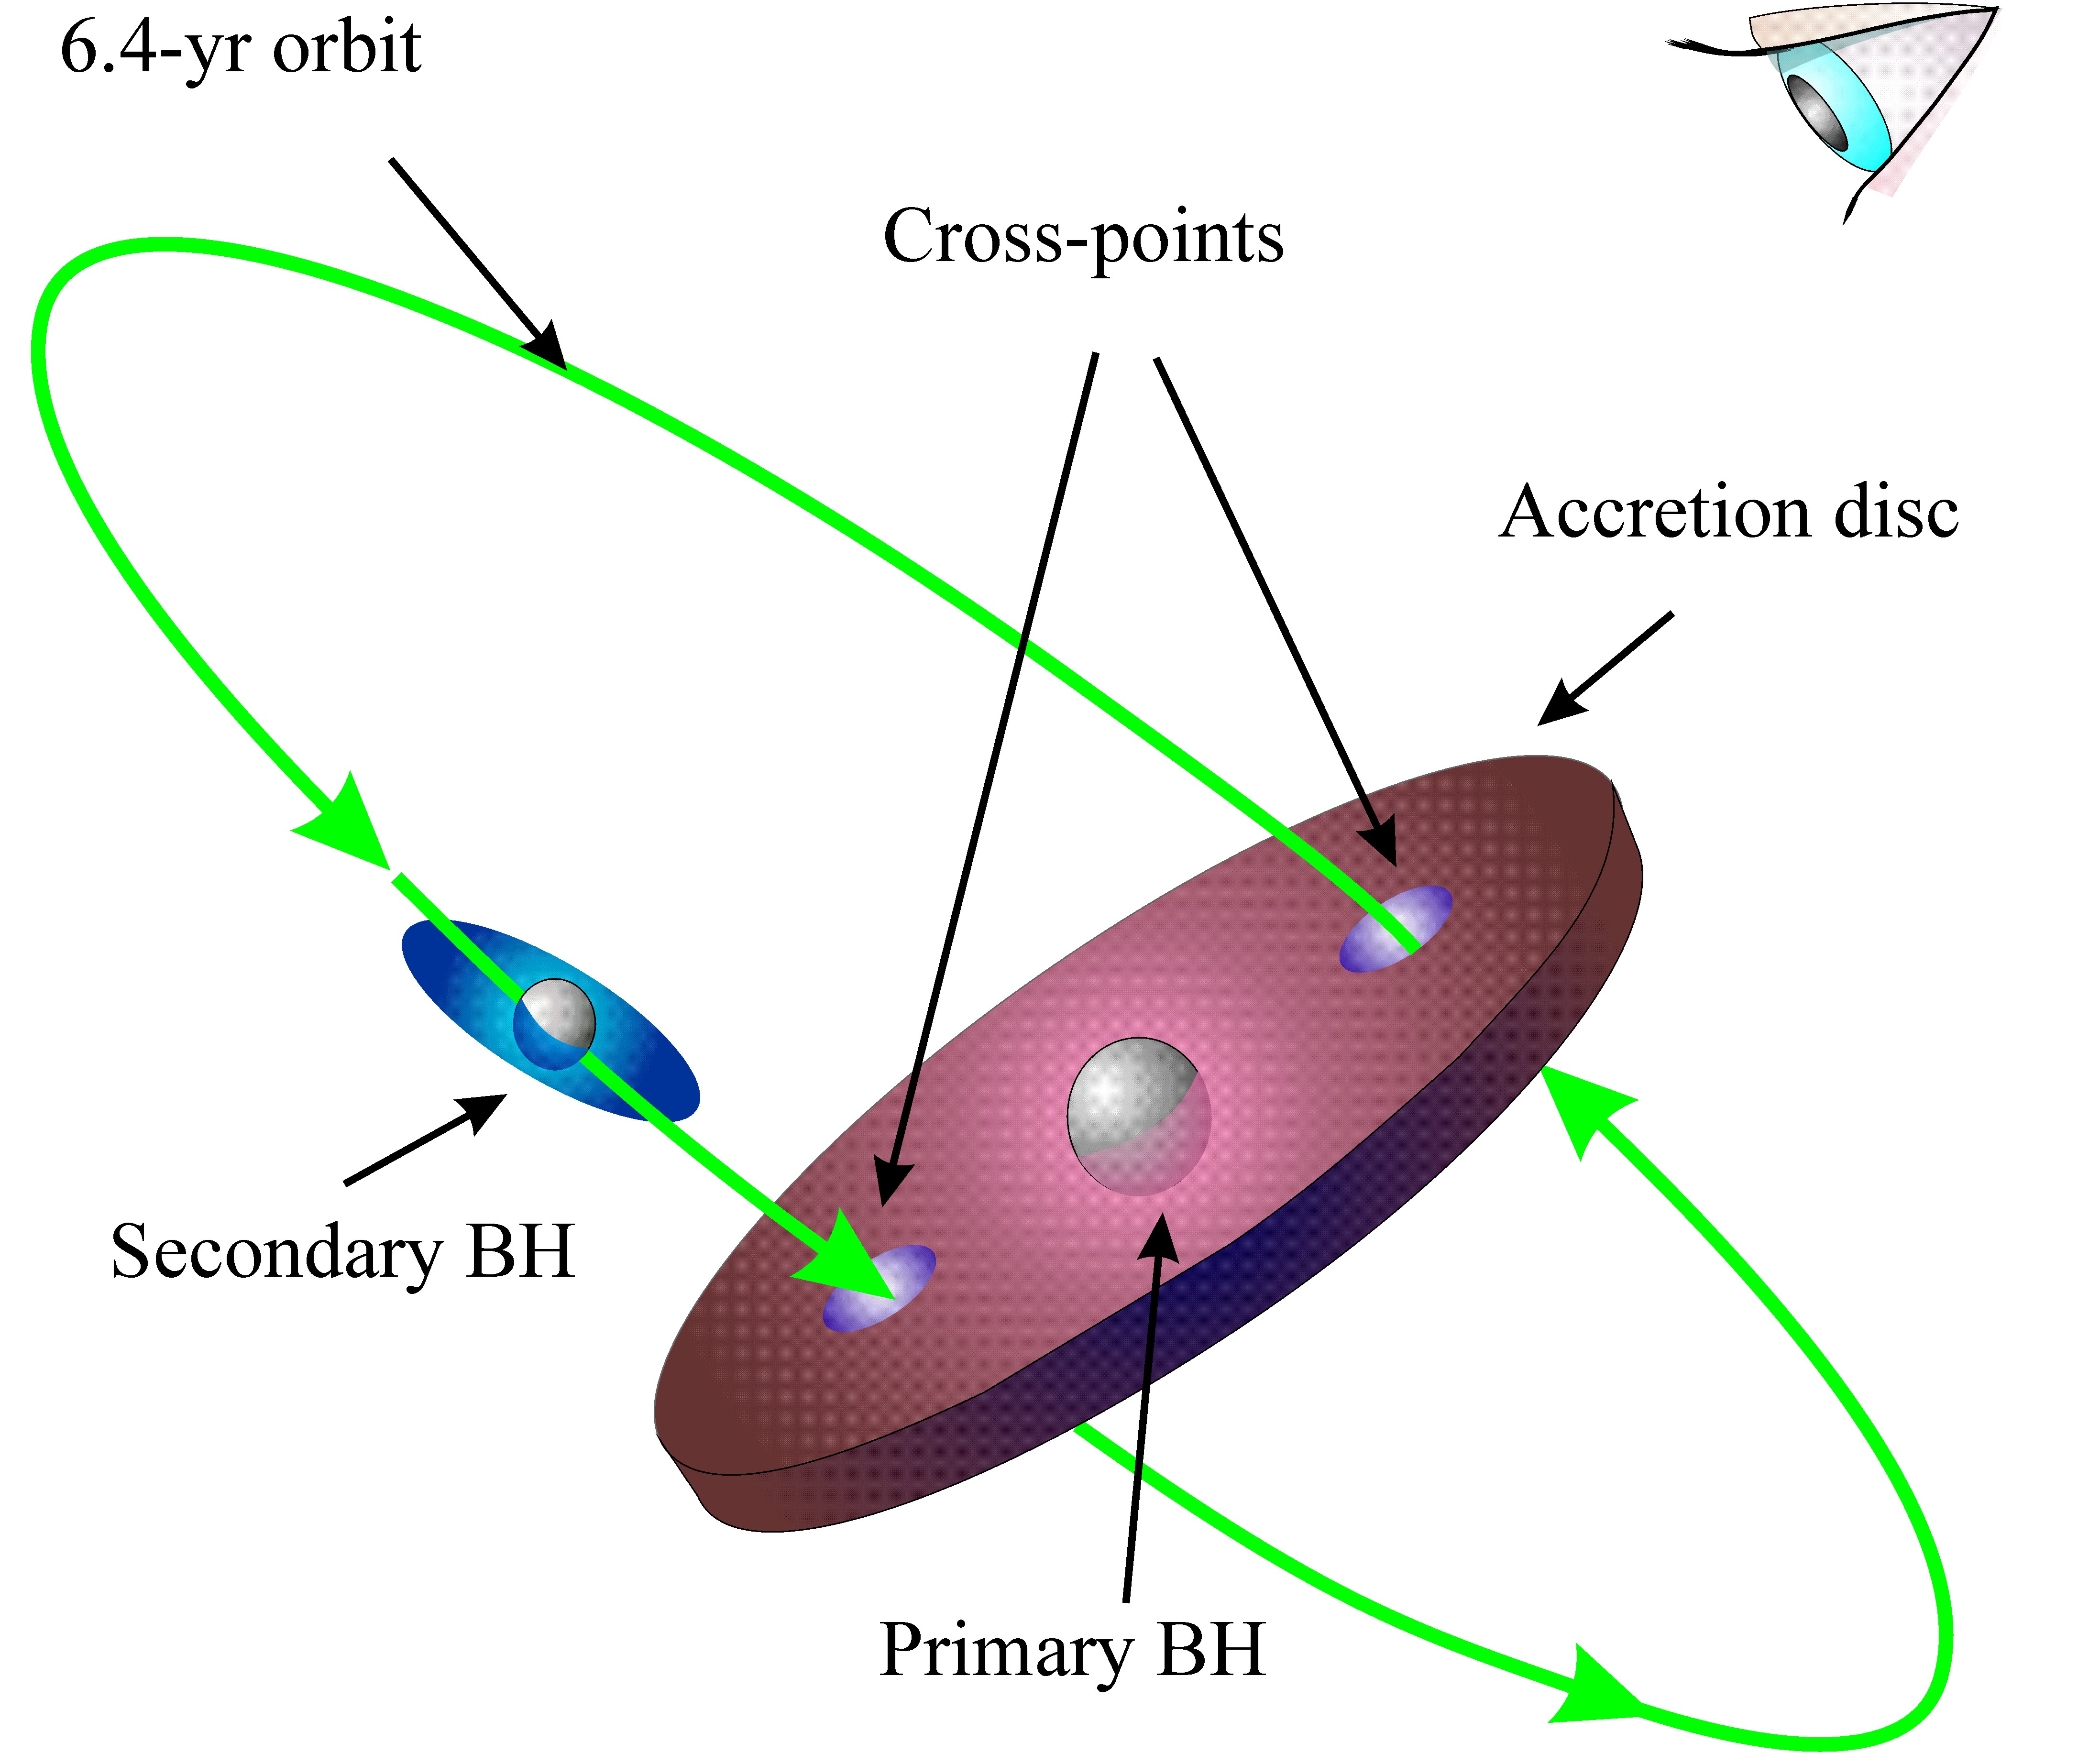
In this paper, we test the binary black hole hypothesis in the SDSS J0752 (schematically presented in Fig. 1) using Swift/XRT data from an X-ray counterpart of this source (Fig. 2). The specific goal of our paper is to estimate the mass of the secondary BH in the SDSS J0752 applying the scaling method to determine the mass of the BH (Shaposhnikov and Titarchuk, (2009), hereafter ST09) based on Swift observations during X-ray flaring events (Fig. 3). Based on the discovered more or less strict 6.4-year cycle, we adhere to the hypothesis of orbital rotation of components in a binary black hole, in which the secondary BH periodically disturbs the accretion disk around the primary BH (Fig. 1) to explain the optical (and possibly X-ray) periodic variability of SDSS J0752 (Zhang et al.,, 2022). In this case, the secondary BH is surrounded by a smaller disk, a minidisk, consisting of matter captured during such periodic passages of the primary BH disk (see Fig. 1).
The scaling method was proposed back in 2007 by Shaposhnikov and Titarchuk, (2007), hereafter ST07, and by ST09. It is worth noting that there are two scaling methods: based on the correlation between the photon index, , and the QPO frequency, ; and one based on the correlation between and the normalization of the spectrum proportional to . For the first method (), the source distance is not required to estimate the black hole mass (ST07), while for the second method, (see ST09), the source distance and the inclination of the accretion disk relative to the Earth observer are needed.
For both methods, it is necessary for the source to show a change in spectral states, accompanied by a characteristic behavior of the index , during the flare. monotonically increase with or during the transition from the low hard state (LHS) through the intermediate state (IS) to the high soft state (HSS) and reaching a constant level (saturating) at high values of or . Then monotonically decreases during a HSSISLHS transition when the flare decays. The saturation of (so-called -saturation phase whereby reaches a constant value in our parameter space; see Fig. 6) during a flare is a specific signature that this particular object contains a BH (Titarchuk and Zannias,, 1998). Indeed, the -saturation phase can be only caused by an accretion flow converging to the event horizon of a BH (see numerical simulation results by Laurent and Titarchuk, (1999, 2011)). Then, it makes sense to compare BH sources that have the same -saturation levels. In the second method (), it is assumed that BH luminosity is directly proportional to (and, consequently, to the mass of the central BH), and inversely proportional to the squared distance to the source. Thus, we can determine the BH mass by comparisons of the corresponding tracks for a pair of sources with BHs, in which all parameters are known except for the BH mass (for more details on the scaling method, see Titarchuk et al., (2010); Seifina and Titarchuk, (2010) and ST09).
The scaling approach, in general, has a number of advantages over other methods for determination of a BH mass. A determination of the X-ray spectrum arising in the innermost part of the source, based on the fundamental physical models, taking into account the Comptonization of soft disk photons, by hot electrons from the Compton cloud and in the converging flow into a BH. In this case, the latest achievements in modeling the BH states using the Monte-Carlo method were used, based on the numerical solution of the complete relativistic kinetic equation and the detection of the “saturation” phase of the spectral index at the maximum of the X-ray flare of the black hole. The method was developed and tested by us on various astrophysical objects and showed excellent agreement with classical methods see e.g. Seifina and Titarchuk, (2010); Titarchuk et al., (2014); Titarchuk and Seifina, 2016a ; Titarchuk and Seifina, (2017); Seifina et al., (2017); Seifina et al., 2018b ; Titarchuk et al., (2020); Titarchuk and Seifina, (2023). The method is based on first principles and fundamental assessments of the gravitational effect of a black hole on the matter surrounding it, as well as on calculating the effective size and mass of the reaction zone to such an effect.
In this paper, based on a particular Swift/XRT data analysis, we estimate a BH mass in SDSS J0752 using the scaling method. In §2 we provide details of our data analysis, while in §3 we present a description of the spectral models used for fitting these data. In §4 we focus on the interpretation of our observations. In §5 we focus on the construction of the power density spectra (PDS) and its interpretation. In §6 we discuss the main results of the paper. In §7 we present our final conclusions.
2 DATA REDUCTION
Using Swift/XRT data in the 0.3–10 keV energy range, we studied flaring events of SDSS J0752 from 2008 to 2010 (see the log of observations in Table 2). The data used in this paper are public and available through the GSFC public archive111https://heasarc.gsfc.nasa.gov. It must be acknowledged that not all flare events can be associated with the disk–secondary BH interactions. Therefore, it is difficult to separate the sporadic flares that often occur in SDSS J0752, which are completely unrelated to the presence of any binary in the SDSS J0752 center. However, the identified periodicity of the optical source facilitates such identification, since it can be associated mainly with orbital variability. Here we assume that X-ray variability caused by flares due to the passage of a smaller BH through the disk around a larger BH. Moreover, it will be accompanied by corresponding spectral changes, which will help us separate the X-ray flare activity of the small BH. In Sect. 3 we present the X-ray variability analysis of SDSS J0752 (using Swift/XRT) and show that SDSS J0752 follows spectral patterns typical of galactic and extragalactic sources with BHs.
Data were processed using the HEASOFT v6.14, the tool xrtpipeline v0.12.84, and the calibration files (CALDB version 4.1). The ancillary response files were created using xrtmkarf v0.6.0 and exposure maps were generated by xrtexpomap v0.2.7. Source events were accumulated within a circular region with a radius of 50" centered at the position of SDSS J0752 ( and , J2000.0). Given the low count rate of SDSS J0752 most of the data were collected using the most sensitive Photon Counting (PC) mode. The background was estimated in a nearby source-free circular region with a 85" radius.
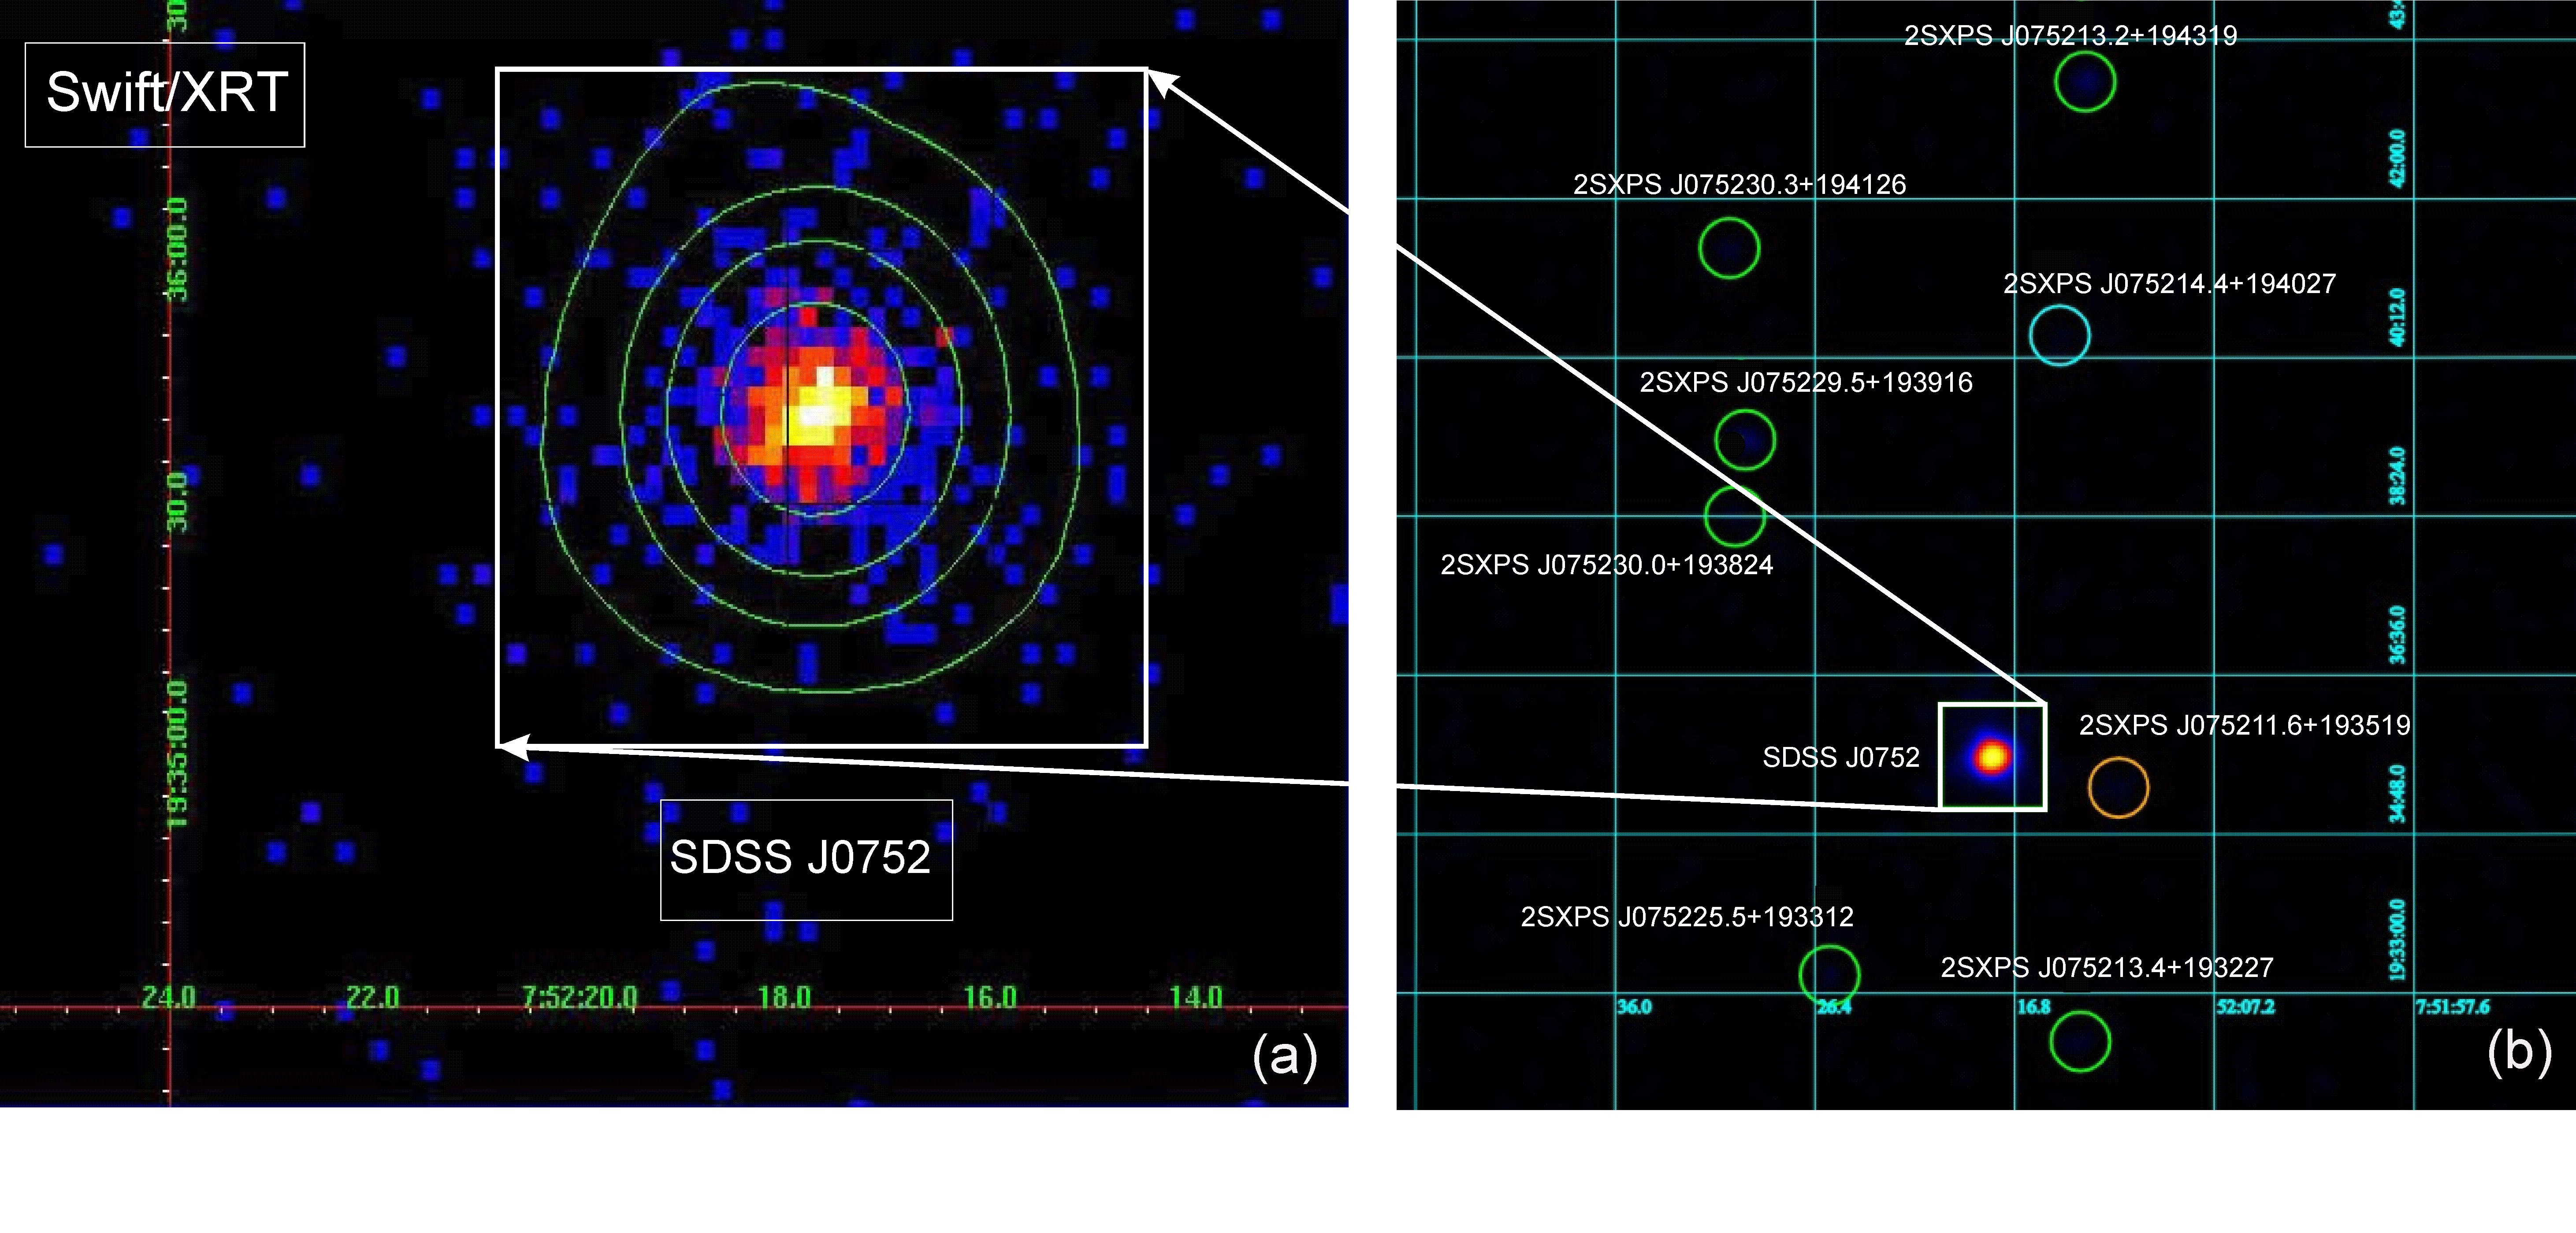
Using the xselect v2.4 task, source and background light curves and spectra were generated. Spectra were rebinned with at least ten counts in each energy bin using the grppha task in order to apply statistics. We also used the online XRT data product generator222http://www.swift.ac.uk/user_objects/ to obtain the image of the source field of view in order to make a visual inspection and to get rid of possible contamination from nearby sources (Evans et al.,, 2007, 2009). The Swift/XRT (0.3 – 10 keV) image of the SDSS J0752 field of view (FOV) is presented in the right panel of Fig. 2, where the panel (a) demonstrates absence of the X-ray jet-like (elongated) structure as well as the minimal contamination by other point sources and diffuse emission within a region with a 85" radius around SDSS J0752. The next nearest source 2SXPS J075211.6+193519 is 86" away (marked by orange circle). We used observation of SDSS J0752 (2008 – 2010) extracted from the HEASARC archives and found that these data cover a wide range of X-ray luminosities.
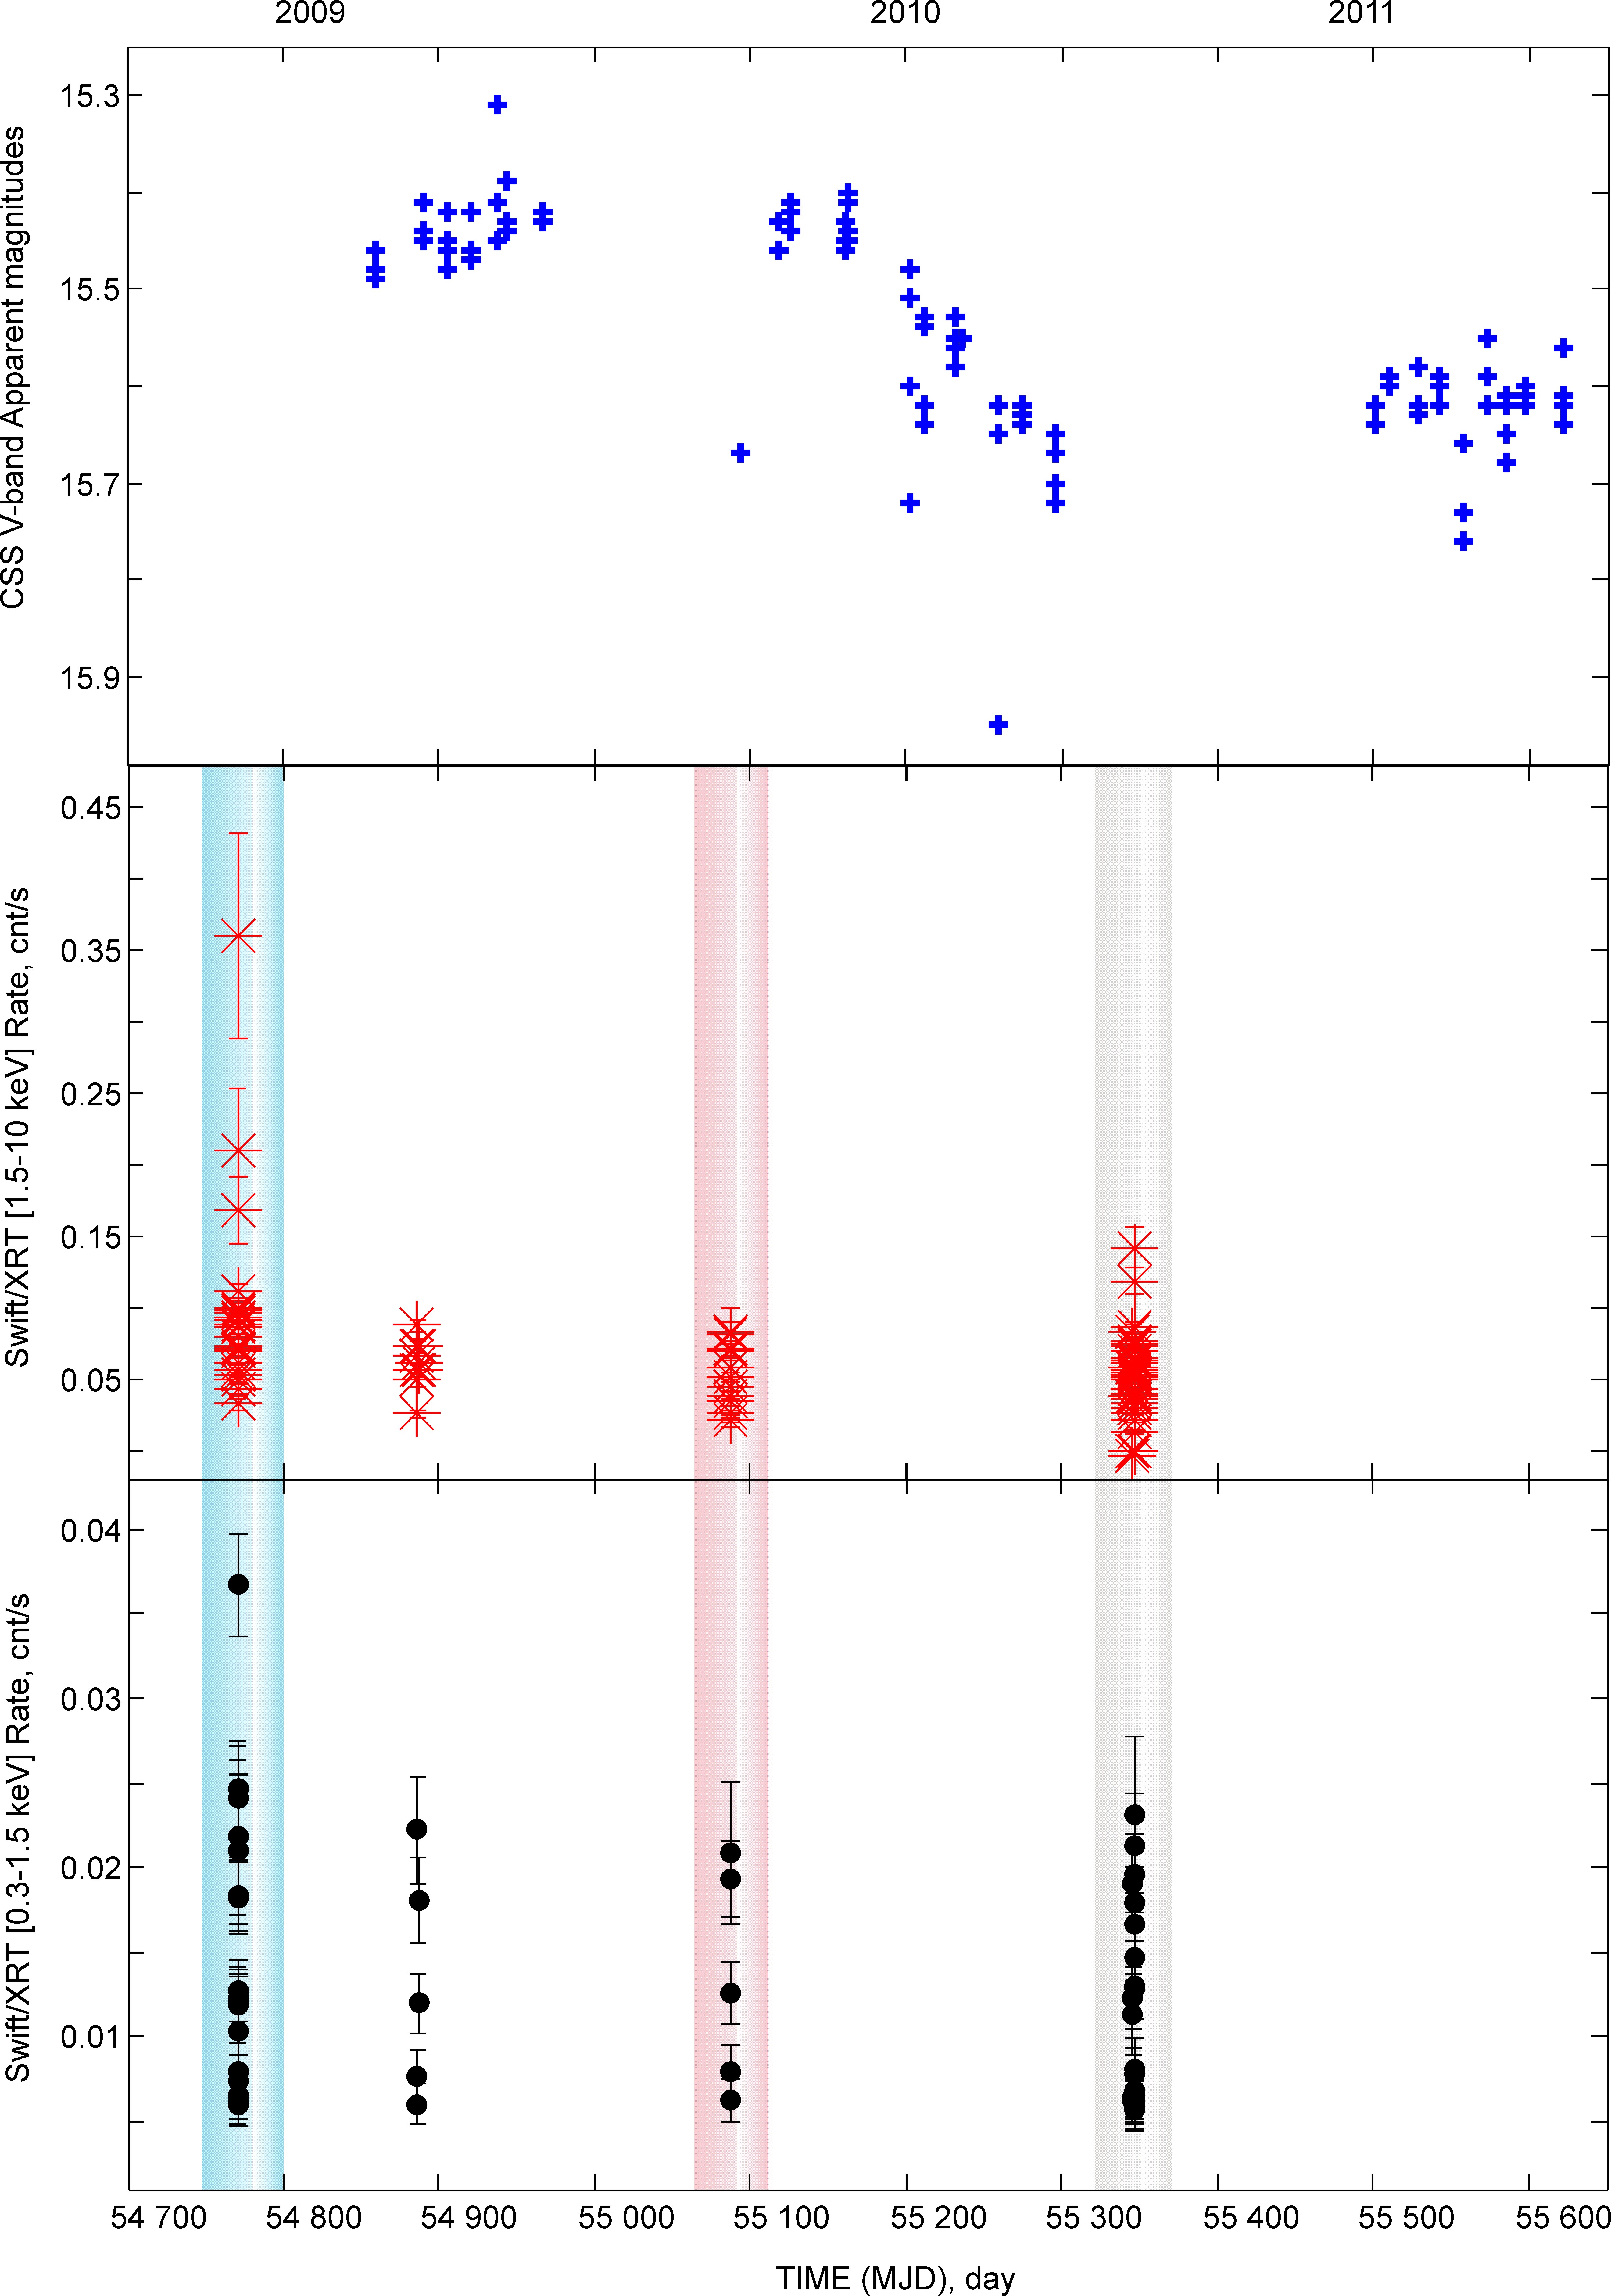
Before proceeding and providing the details of the spectral fitting, we study a long-term behavior of SDSS J0752, in particular, its activity patterns. We present a long-term X-ray light curve of SDSS J0752 detected by the XRT on board Swift from 2008 – 2010 (see Fig. 3).
We note that this X-ray light curve makes it rather difficult to judge the 6.4-yr periodicity found earlier from optical observations (see also the top panel of Fig. 3). But it can be unequivocally stated that the quasar SDSS J0752 has become active over the past 15 years and shows sporadic X-ray activity (e.g., MJD 54700–55400, see Fig. 3).
3 RESULTS
3.1 Image of SDSS J0752
We detected an X-ray source (within the error radius with 90% confidence) at the location of SDSS J0752 indicated by optical observations , (refs). At the same time, the coordinates of our X-ray source associated with SDSS J0752 were some refined (), (, J2000.0) in accordance with the analysis of XTR/Swift data. Visual inspection of the source with the indicated coordinates showed the presence of an almost point-like source in the SDSS J0752 position and the absence of other nearby objects within a radius of 85′′.
3.2 X-ray light curve of SDSS J0752
We discovered variability of SDSS J0752 in X-rays. The Swift/XRT light curves of this source in the 1.5–10 keV energy range (central panel) and in the 0.3–1.5 keV energy range (bottoml panel) from 2008 to 2010 is presented in Fig. 3. The figure shows light curves obtained with the Binning mode by time. To test source variability within one observation, we set the time interval size to 100 s. From the figure we can see that the source is variable within one observation, even taking into account observational errors. Fig. 3 also demonstrates the change in the maximum countrate achieved in each observation during the full source observation interval 2008–2010. A comparison of the source light curves in different energy bands showed that the main variability of SDSS J0752 is due to changes in the hard band (1.5–10 keV), although minor variability in the soft band (0.3–1.5 keV) also occurs. We also present CSS V-band light curve data, taken from http://nesssi.cacr.caltech.edu/DataRelease/, to compare the variability of SDSS J0752 in different energy bands for the time interval MJD 54770 (October 2008) to 55650 (March 2011). It is clear from the figure that the source is variable in both the X-ray and optical bands. Both bands show the tendency of the source to flare at MJD 54900–55100. In this case, the contribution of hard photons is significant for all states, but for MJD 55100 it has become significantly smaller, which corresponds to a typical flare state for BHs (Titarchuk et al.,, 2023) and with a softened X-ray spectrum of the source (for example, see the red spectrum in Fig. 5). The phases LHS, IS and HSS are marked with blue, grey and red vertical strips, for which the corresponding spectra are presented in Fig. 5 in the next Section.
3.3 Hardness-intensity diagram of SDSS J0752
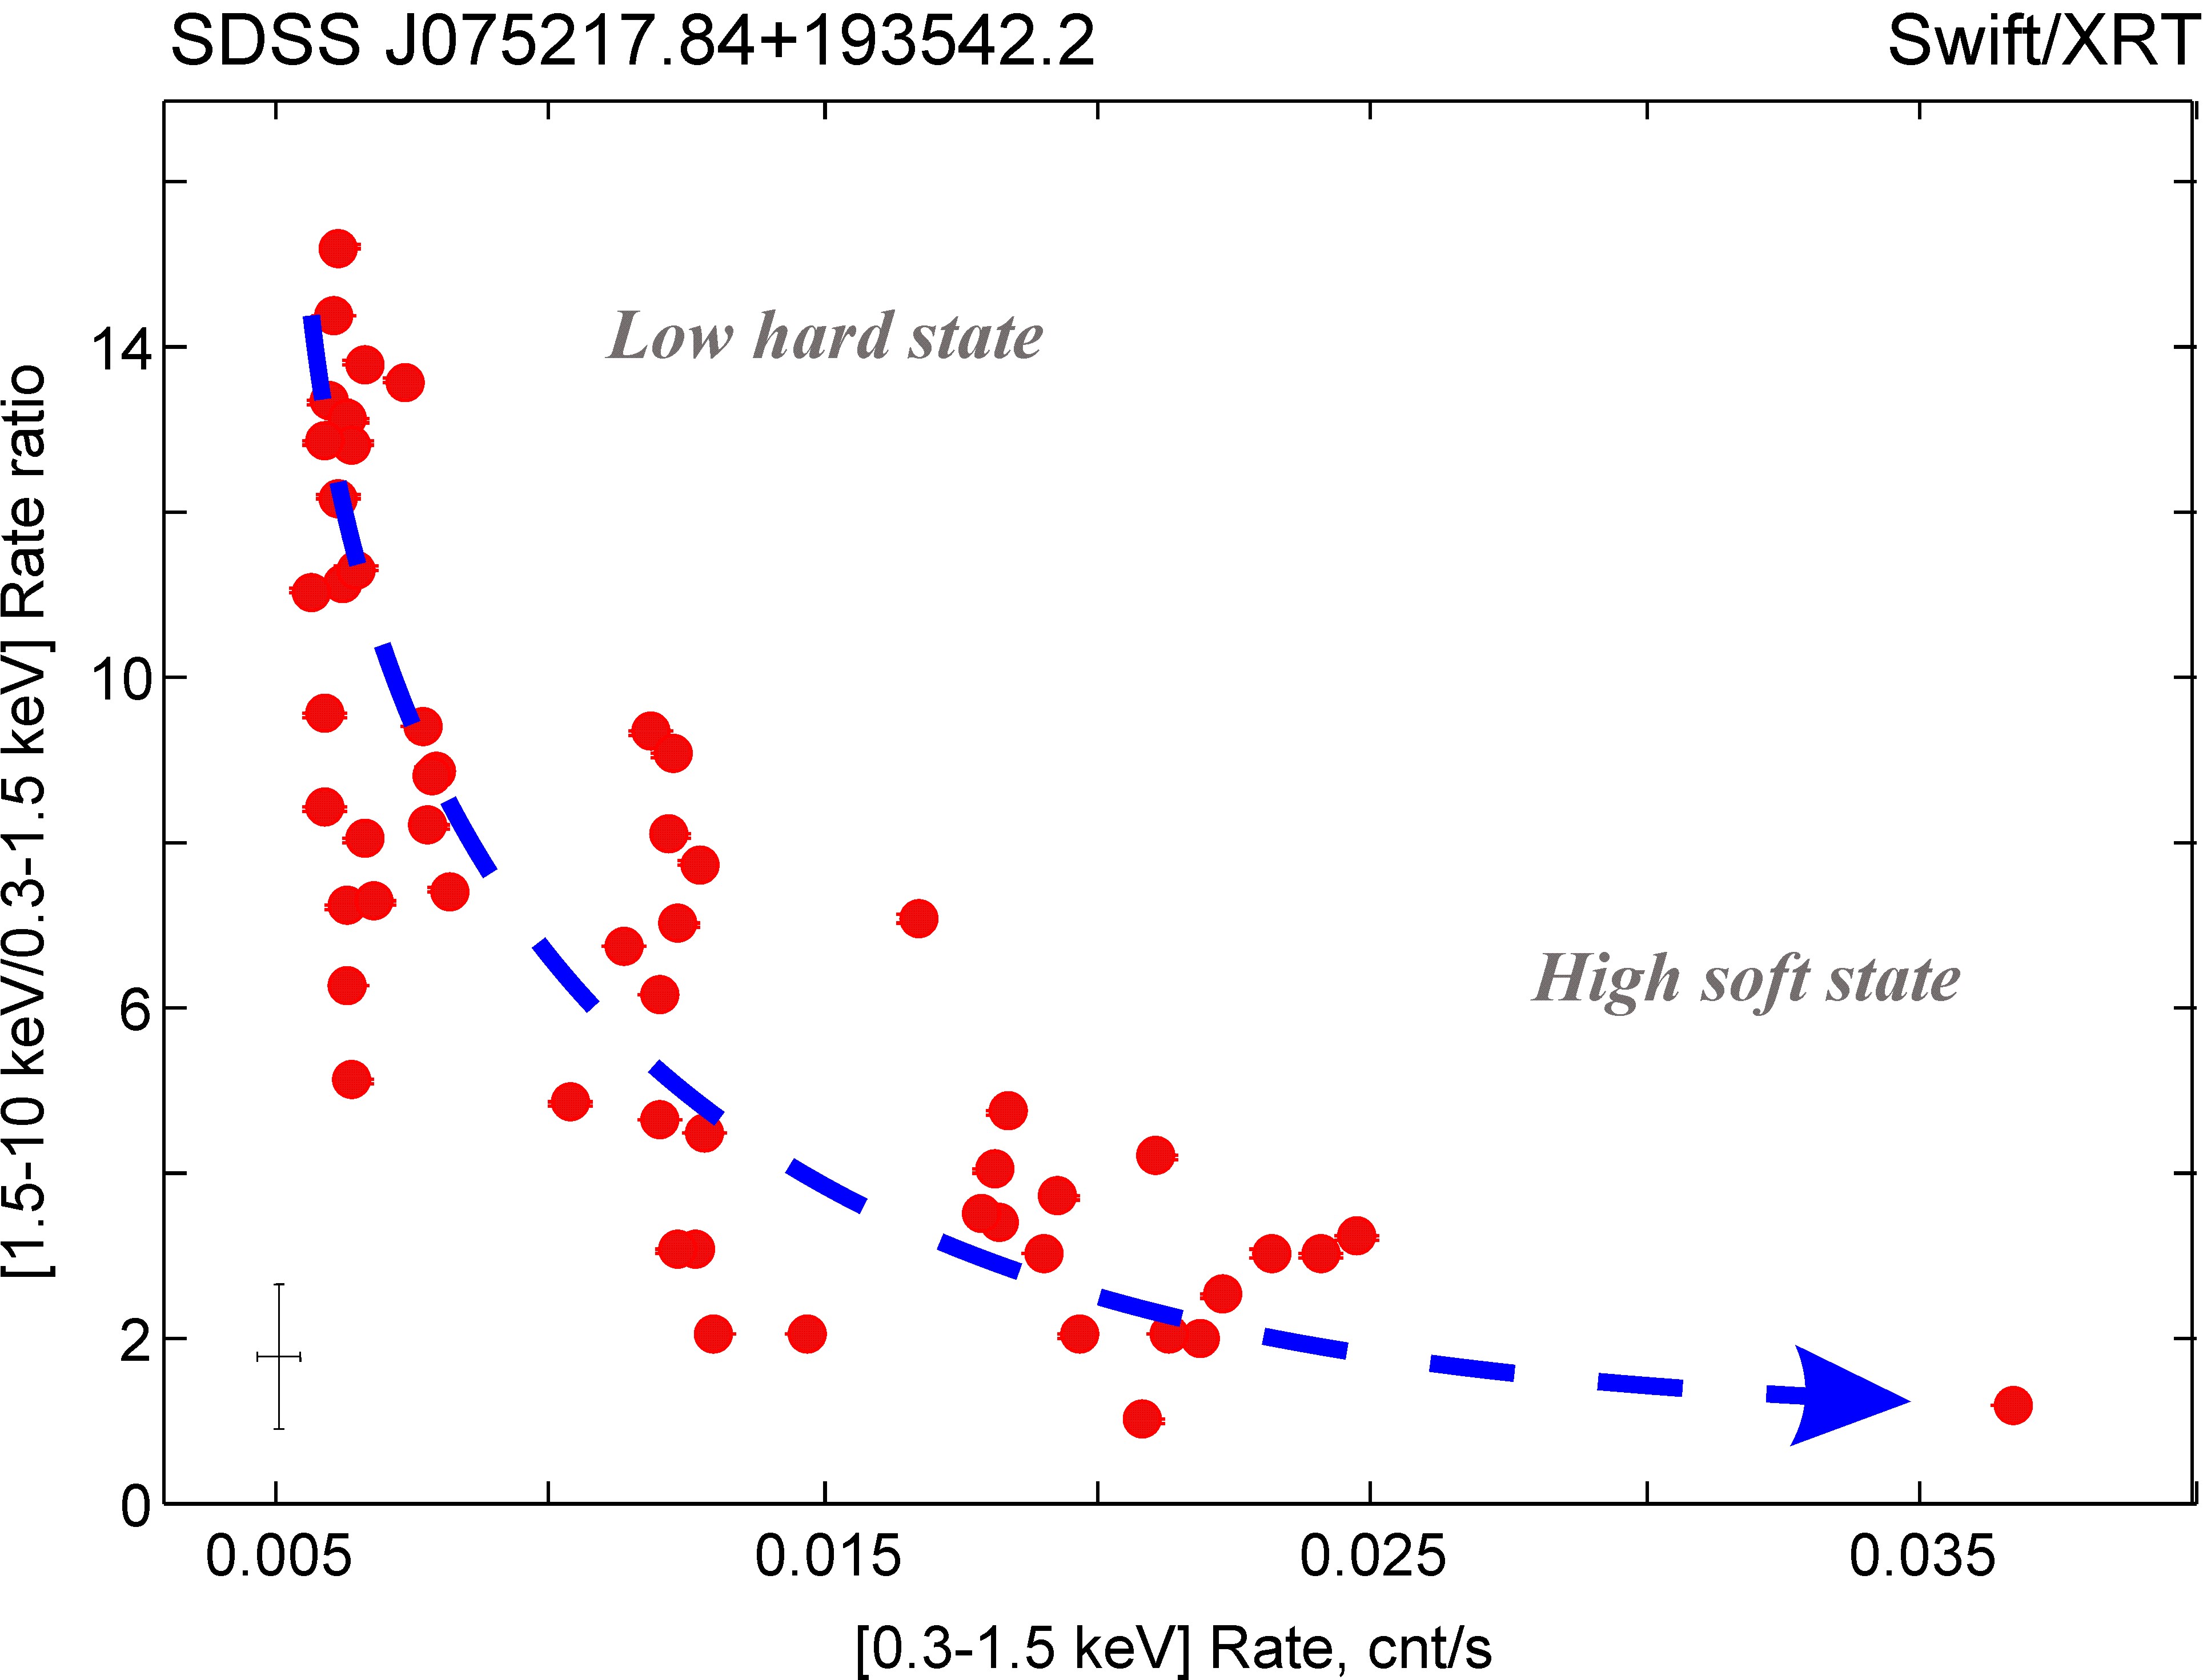
In application to the Swift data of SDSS J0752 we have defined the hardness ratio (HR) as a ratio of the hard and soft counts in the 1.5–10 keV and 0.3–1.5 keV bands, respectively. In Figure 4 we present hardness-intensity diagram (HID) for SDSS J0752 using the Swift/XRT observations (2008–2009) during spectral evolution from the high state to the low state. The diagram demonstrates that different count-rate observations are related to different color regimes. The HR larger values correspond to harder spectra. For clarity, we plot only one point with error bars (in the bottom left corner) to demonstrate typical uncertainties for the soft count rate and HR. Figure 4 clearly shows that the HR monotonically drops with the soft count rate (0.3–1.5 keV). This HID indicates X-ray variability of SDSS J0752 with changing spectral states. This particular sample is similar to those of most of flares of Galactic X-ray binary transients (see Homan et al., (2001); Belloni et al., (2006); Shaposhnikov and Titarchuk, (2009); Titarchuk and Seifina, (2009); Shrader et al., (2010); Munoz-Darias et al., (2014)).
Below, we analyzed the SDSS J0752 spectrum in each observation to better understand the nature of this X-ray variability.
3.4 Spectral Analysis of SDSS J0752
To fit the energy spectra of SDSS J0752, we used an XSPEC Bulk Motion Comptonization model (hereafter BMC) [see Titarchuk and Zannias, (1998) and Laurent and Titarchuk, (1999)]. We also used a multiplicative tbabs model (Wilms et al.,, 2000) which takes absorption by neutral material into account. We assume that accretion onto a BH is described by two main zones (see, for example, Fig. 1 in Titarchuk and Seifina, (2021)): a geometrically thin accretion disk (e.g., the standard Shakura-Sunyaev disk, see SS73) and a transition layer (TL), which is an intermediate zone between the accretion disk, and a converging (bulk) region which is assumed to exist below 3 Schwarzschild radii, , [see details in Titarchuk and Fiorito, (2004)]. The spectral model parameters are equivalent hydrogen absorption column density ; the photon index ; which is related to the Comptonized factor []; the color temperature and normalization of the seed photon blackbody component and , respectively. The parameter of the BMC component is fixed at two when the best-fit . In fact, for a sufficiently high (and, therefore, a high value for ), the illumination factor becomes a constant value close to one (that is, the same as in the case of ). We note that was fixed at the Galactic absorption level of cm-2 (Wilms et al.,, 2000).
Similarly to the bbody XSPEC model, the normalization parameter of the BMC model is a ratio of the source (disk) luminosity to the square of the distance (ST09, see Eq. 1 there):
| (1) |
This encompasses an important property of our model. Namely, using this model, one can correctly evaluate normalization of the original “seed” component, which is presumably a correct indicator (Seifina and Titarchuk,, 2011). In turn,
| (2) |
Here is an effective radius where the main energy release takes place in the disk, is the Schwarzschild radius, , is the dimensionless in units of the critical mass accretion rate , and is the Eddington luminosity. For the formulation of the Comptonization problem, one can refer to Titarchuk et al., (1998); Titarchuk and Zannias, (1998); Laurent and Titarchuk, (1999); Borozdin et al., (1999), and Shaposhnikov and Titarchuk, (2009).
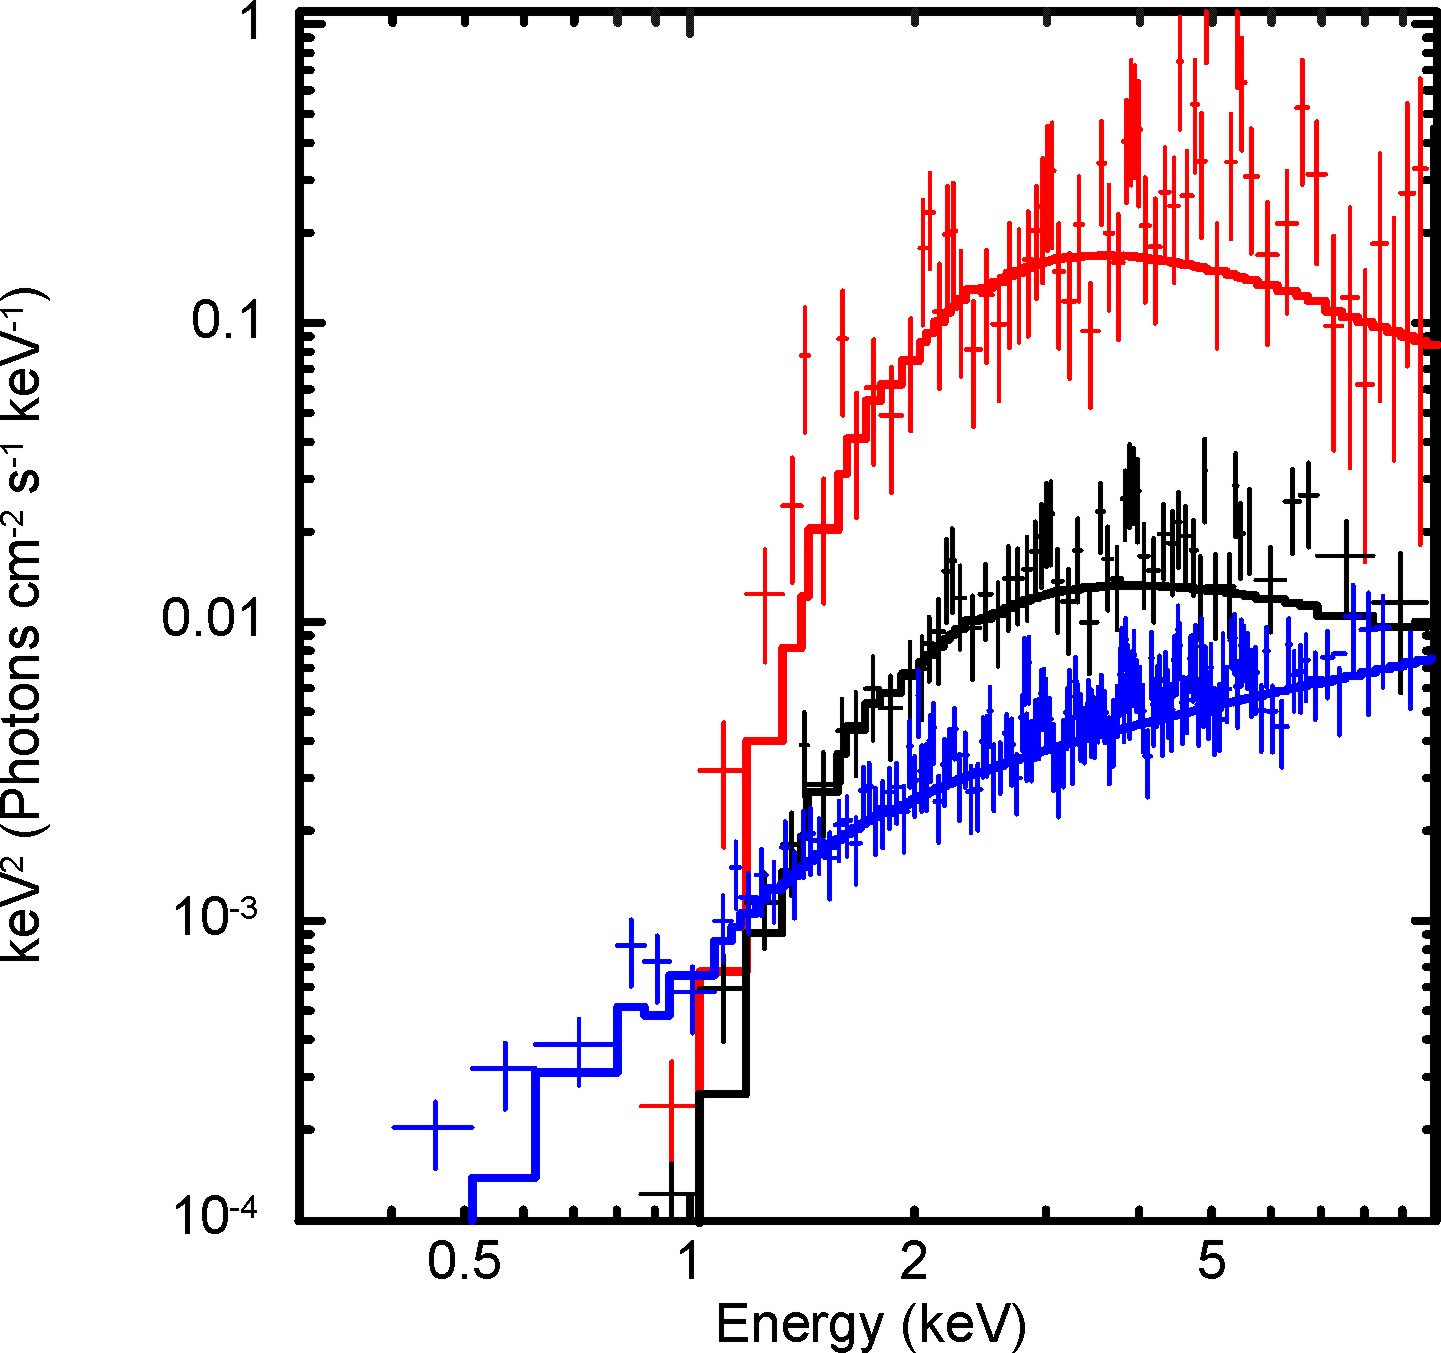
Spectral analysis of the /XRT data fits for SDSS J0752 provides a general picture of the source evolution. We can trace the change in the spectrum shape during the LHS–IS–HSS transition. In Fig. 5, we show three representative spectral diagrams for different states of SDSS J0752. Here, we put together spectra of the LHS, IS, and HSS, to demonstrate the source spectral evolution from the low-hard to high-soft states to states based on the observations. The data are presented here as follows: the LHS (taken from observation 00038041001, blue), the IS (00039551001, black) and the HSS (00038041002, red) in units fitted using the tbabs*bmc model. Exposure times are 3.6, 1.3 anf 5.0 ks, respectively. It is worth noting, that the source spectra were constructed based on the integral flux during the entire observation without taking into account binning to achieve a good signal-to-noise value. These spectra (blue, red and black) are plotted for the LHS, IS and HSS phases, marked with blue, gray and red vertical stripes, respectively, in Fig. 3.
The best-fit parameters in the HSS state (red spectrum in Fig. 5) are = 2.90.6, = 1305 eV, = 8.20.6 L34/d, and = -1.470.08 for which the reduced chi-square value =1.04 for 964 degrees of freedom (dof), while the best-fit model parameters for the IS state (black spectrum) are = 2.20.6, = 1403 eV, = 2.30.8 L33/d, and = -0.320.09 (=0.95 for 288 dof); and, finally, the best-fit model parameters for the LHS state (red spectrum) are = 1.90.4, = 889 eV, = 1.10.4 L33/d, and = -3.580.07 (=1.06 for 249 dof). A systematic uncertainty of 1% represents the instrumental flux calibration uncertainty and has been applied to all analyzed spectra.
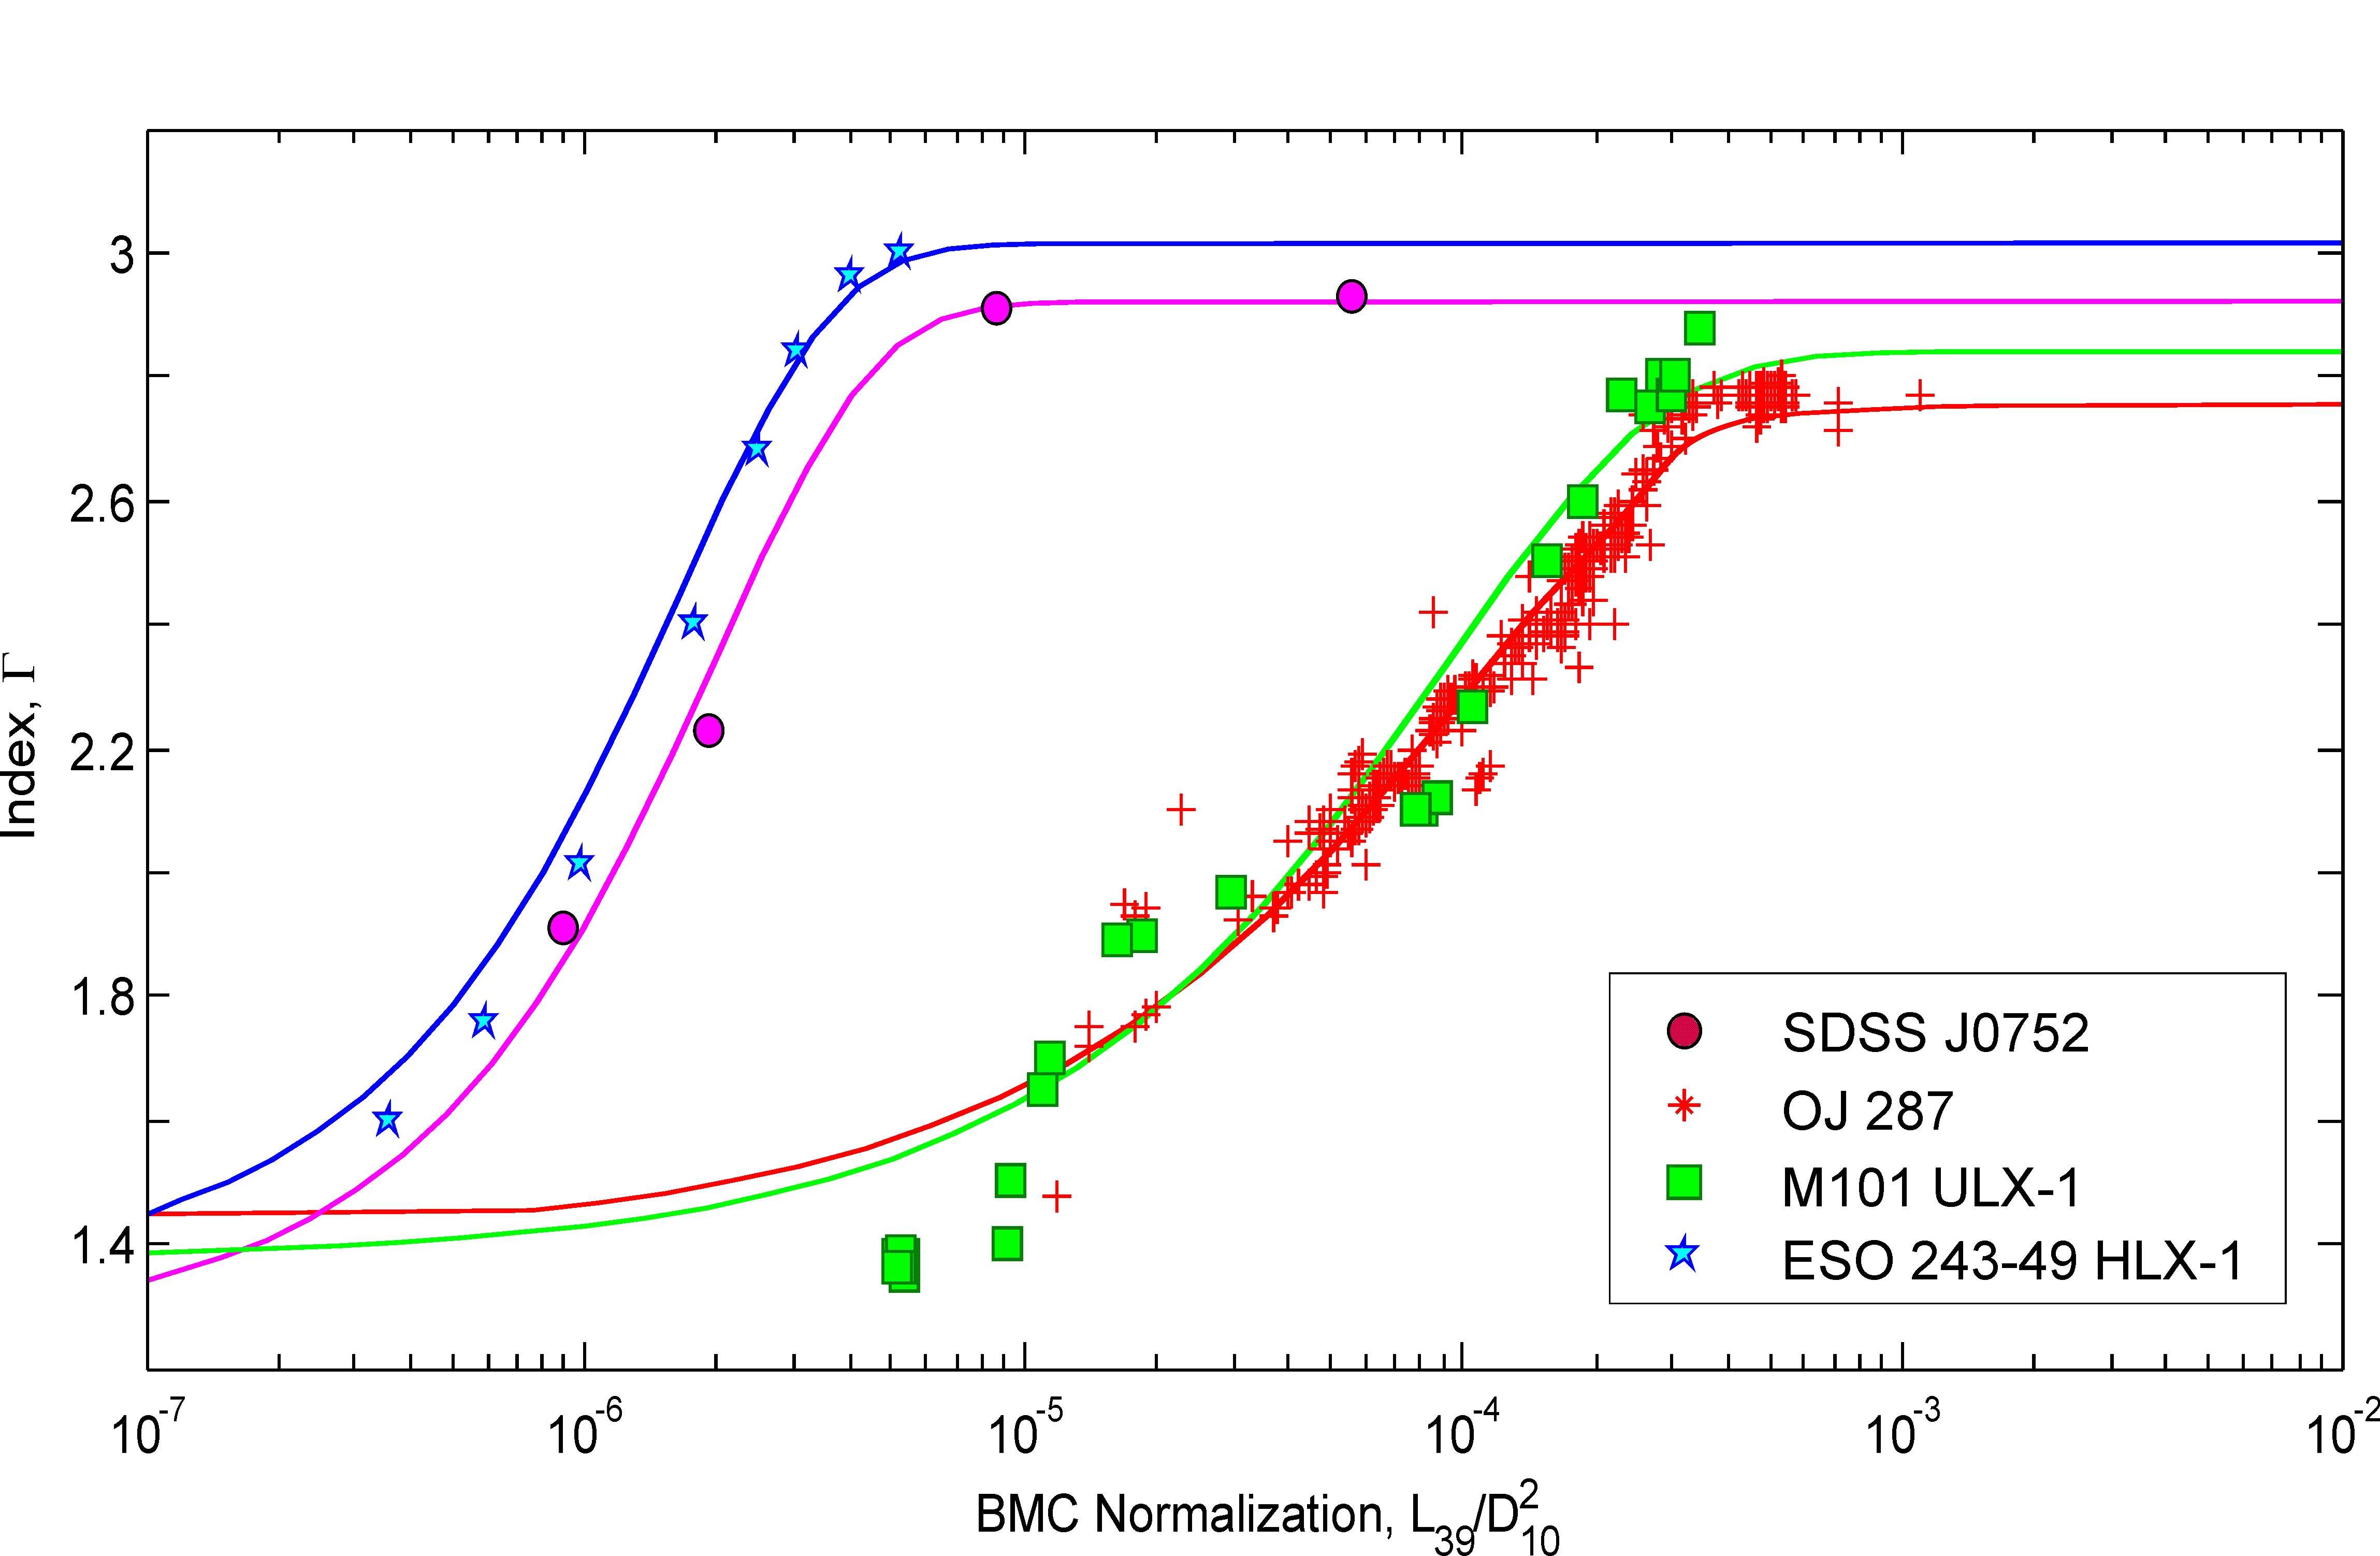
Analysis of the /XRT data fits (see Fig. 6, pink circles) showed that monotonically increases from 1.85 to 2.95, when normalization of the spectral component (or ) increases by a factor of about 15. We have determined that energy spectra of SDSS J0752 in all spectral states can be well modeled using a product of the tbabs and a BMC Comptonization component.
We plotted the dependence of on (Fig. 6) and discovered a linear section of monotonic increase in the index with increasing , which is proportional to the accretion rate . It is interesting that the dependence for high clearly shows the area of index saturation at the level . This effect is well known as an index saturation, see ST09 (pink line in Fig. 6). It was previously tested on a large number of sources with BHs of different masses [stellar-mass BHs Titarchuk and Seifina, (2009), Seifina and Titarchuk, (2010), Titarchuk et al., (2014), Titarchuk and Seifina, (2023)], intermediate mass BHs [Titarchuk and Seifina, 2016a , Titarchuk and Seifina, 2016b ] and supermassive BHs [Titarchuk and Seifina, (2017), Seifina et al., (2017), Seifina et al., 2018a , Seifina et al., 2018b , Titarchuk et al., (2020), Titarchuk et al., (2023)] and has established itself as a reliable indicator of the BH presence in the source [Titarchuk and Seifina, (2009)]. In addition to diagnosing the presence of a black hole, this effect makes it possible to estimate the parameters of a black hole object, such as a mass and inclination.
3.5 A BH mass estimate of the SDSS J0752 secondary
We used a previously-developed technique to estimate the BH mass, , (Titarchuk et al.,, 2023). Previously, we did not know a mass of which BH in the SDSS J0752 quasar can be estimated using our X-ray data for SDSS J0752. We used the correlation to estimate a BH mass (see ST09 for details). This method ultimately (i) deal with a pair of BHs for which correlates with an increasing normalization (which is proportional to the mass accretion rate and a BH mass , cm ST09, Eq. (7)) and for which the saturation levels are the same and (ii) calculates the scaling factor , which allows us to determine the black hole mass of the target object. It should also be emphasized that to estimate a BH mass using the following equation for the scale factor, the ratio of the distances to the target and reference sources is necessary:
| (3) |
where and are the BMC normalizations of the spectra, and are the dimensionless BH masses with respect to solar mass, and and are distances to the target and reference sources, correspondingly. A geometrical factor, , where and are the disk inclinations for the reference and target sources, respectively (see ST09, Eq. (7)).
For an appropriate scaling, we have to select X-ray sources (reference sources), which also show the effect of index saturation, and at the same level as the SDSS J0752 (target source). For reference sources, a BH’s mass, inclination, and distance must be well known. We found that OJ 287, M101 ULX–1 and HLX–1 ESO 243 can be used as the reference sources because these sources met all aforementioned requirements to estimate a BH mass of the target source OJ 287 (see items (i) and (ii) above).
In Figure 6 we demonstrate how the photon index evolves with normalization (proportional to the mass accretion rate ) in the blazar OJ 287 and in the quasar SDSS J0752, where is presented in units of ( is the source luminosity in units of erg/s and is the distance to the source in units of 10 kpc).
In Figure 6, the correlations versus are self-similar for the target source (SDSS J0752) and two M101 ULX–1 and ESO 243–49 HLX–1 are ultra-luminous X-ray (ULX) sources. Moreover, these three sources have almost the same index saturation level about 2.8. We estimated a BH mass for SDSS J0752 using the scaling approach (see e.g., ST09). In Figure 6 we illustrate how the scaling method works shifting correlations relative to another. From these correlations we could estimate , for SDSS J0752 and for the reference sources (see Table 3). A value of , in units of is determined in the beginning of the -saturation part [see Fig. 6, ST07, ST09, Titarchuk et al., (2014); Titarchuk and Seifina, 2016a ; Titarchuk and Seifina, 2016b ; Titarchuk and Seifina, (2009)].
To determine the distance to SDSS J0752 we used the formula (for )
| (4) |
where the redshift for SDSS J0752, is the Hubble constant and km/s is the speed of light. This distance agrees with the luminosity distance estimate using Ned Wright’s Javascript Cosmology Calculator333https://www.astro.ucla.edu/ wright/CosmoCalc.html Mpc (Wright,, 2006).
A value of for the target and reference sources can be obtained using a trial inclination for SDSS J0752 and for (see Table 3). As a result of the estimated target mass (SDSS J0752), we find that
| (5) |
where we used values of Mpc.
Applying Eq.(5), we can estimate (see Table 3) and we find that the secondary BH mass in SDSS J0752 is about M⊙. To obtain this estimate with appropriate error bars, we need to consider error bars for and assuming, in the first approximation, errors for and only. We rewrote Eq. (5) as
| (6) |
Thus we obtained errors for the determination (see Table 3, second column for the target source), such that
| (7) |
As a result, we find that M M⊙
() assuming Mpc to SDSS J0752. Thus, we obtained a lower limit to the BH mass due the unknown inclination. We present all these results in Table 3.
In order to calculate the dispersion of the arithmetic mean for a BH mass estimate using different reference sources (see Table 3), one should keep in mind that
| (8) |
where is the dispersion of using each of the reference sources and is a number of the reference sources. As a result we determined that the mean deviation of the arithmetic mean
| (9) |
and finally we came to the following conclusion (see also Table 3):
| (10) |
It should be noted that in our calculations, we assume the angle between the normal to the secondary disk and the line of sight to be about 50 degrees. However, the actual inclination may be different.
3.6 Secondary disk inclination estimate in SDSS J0752
The inclination of SDSS J0752 is still unknown. However, we can attempt to estimate it using the scaling method and the virial BH mass in SDSS J0752 from optical data (Zhang et al.,, 2022) under the assumption that the source of the X-ray variability is a secondary BH. According to Zhang et al., (2022), the virial mass of the secondary BH is about M⊙. Then using the second scaling law Titarchuk et al., (2023), we find the inclination of secondary BH disk in SDSS J0752:
| (11) |
where we used ESO 243–49 HLX–1 as a reference source and parameters M⊙, M⊙, Mpc, Mpc, and .
Now that we have estimated the inclination of the (mini) disk around the secondary BH based on its virial mass, we can refine our scaling estimate of a BH mass of the secondary. If we previously assumed , then clarifying the angle leads to . Since the secondary disk should be seen almost edge-on, namely, this angle tends to 90 degrees, then the mass of the secondary BH component should be slightly larger, M⊙.
4 DISCUSSION
We estimated the minidisk inclination of the secondary BH by combining scaling of the X-ray spectral properties of SDSS J0752 and the virial mass obtained from optical observations (CSS444 http://nesssi.cacr.caltech.edu/DataRelease/ and ASAS-SN555 https://asas-sn.osu.edu/ V-band light curve) of this quasar (Zhang et al.,, 2022). A high value of the inclination of the minidisk of the secondary BH was obtained (). However, it is necessary to emphasize that the IR and radio data available for SDSS J0752 are consistent with such a high minidisc inclination. It is known that SDSS J0752, is a so-called a blue quasar (Zhang et al.,, 2022) is a quasar whose IR radiation is weakly absorbed. As a working hypothesis to explain the status of blue quasars, it was argued that they are observed at a low inclination angle (Klindt et al.,, 2019) to the observer and are thus weakly subject to IR absorption. According to this hypothesis, blue quasars are fundamentally different from so-called red quasars, whose radiation is predominantly red at optical wavelengths due to the presence of dust in the line of sight. However, Klindt et al., (2019) ruled out orientation as the cause of the differences between red and blue quasars based on an analysis of quasar’s radio properties using FIRST data (1.4 GHz/6m).
But even in the case of the “face-on” orientation of the main disk of the SDSS J0752 quasar, when we see the galaxy disk almost from the pole, the high inclination of the secondary BH (mini)disk we obtained is consistent with the fact that the orbit of the secondary BH is oriented perpendicular to the plane of the main disk around the primary BH. This is consistent with our orbital flare scenario (see Fig. 1), in which the orbit of the secondary BH does not coincide with the galactic plane, but makes a significant angle, in our case . Therefore, we clearly see periodic X-ray and optical flares during the orbital passage of a secondary BH through the disk around the primary BH (i.e., through the disk of the galaxy).
We obtained a fairly low temperature of the seed photons from the inner part of the disk around the secondary black hole (80 – 115 eV). This is consistent with calculations of the X-ray spectrum arising from the innermost part of the source, based on first-principles physical models, taking into account the Comptonization of soft disk photons by hot electrons of the Compton cloud originated from the disk innermost part and from the converging flow of the black hole. Indeed, in the case of a black hole, the peak temperature of the disk is relatively low, , that is, about 20–100 eV, and its thermal peak is in the UV energy range.
We proceed with a scenario of orbital rotation of a binary system in the center of the quasar SDSS J0752, consisting of two BHs of higher and lower mass (Fig. 1), which explains its X-ray variability. In this case, a heavier BH is surrounded by a powerful accretion disk, and a lighter BH, surrounded by the minidisk, rotates around the primary BH in a plane different from the equatorial plane of the accretion disk of the primary BH crossing it twice during the orbital period (6.4 years). We also assumed that when a secondary BH passes through the disk around the primary BH, “tidal disruption” of nearby parts of the disk occurs. As a result a partial destruction and subsequent replenishment of matter from the accretion minidisk around the secondary BH takes place (see a similar process in Chan et al., (2021)). In this case, a powerful transition minidisk is developed around the secondary BH with subsequent accretion of material from the transition minidisk onto the secondary BH. This provides an increase in luminosity in the X-ray/optical/radio bands.
To complete our analysis, we list other possible reasons leading to the variability of quasar emission. It should be also taken into account that this variability of quasars may be associated with changes in emission of their jets. This source is a weak radio emitter and is not classified as ”radio loud”, By conventional definition of radio loudness it is . For this object its . According to a recent structural analysis of 447 of the radio sources in the northern sky at 15 GHz (Lister,, 2021), variations in the position angle of the jets with an average amplitude of 10–50∘ on a timescale of about ten years. For some sources, variations reach 200∘. There are several scenarios that could explain this behavior, see for example, orbital motion in a binary black hole (Begelman et al.,, 1980). The Lense–Thirring effect (Lense and Thirring,, 1918; Thirring,, 1918) in a binary system with a rotating black hole is widely discussed. In this case, fluctuations in the internal orientation of the jet are caused by the precession of the accretion disk, the rotation axis of which is shifted relative to the rotation axis of the black hole (Caproni et al.,, 2004). For example, based on observations made over 22 years in 170 separate epochs, a study of the structure of the jet in the radio galaxy M87 showed a periodic change in the position angle of the jet with a peak-to-peak amplitude of 10∘ and a period of T11 years on scales 600–2500 (Cui et al.,, 2023). The periodicity of the light curve in the optical range and variations in the position angle of the jet in the quasar 3C 120 suggest the existence of a precession of the jet caused by the Lense–Thirring effect with a period of 12.3 years (Caproni and Abraham,, 2004). The same is also shown for the jet in M81, the precession period of which is estimated at 7 years (von Fellenberg et al.,, 2023). A detailed analysis of the orientation oscillations of other jets also indicates their periodicity and possible connection with precession, for example, PKS 2131–021 (O’Neill et al.,, 2022) ( 22 years), PG 1553+113 (Lico et al.,, 2020), 4C 38.41 (Algaba et al.,, 2019) ( years), 3C 279 (Abraham and Carrara,, 1998) ( 22 years), 3C 273 (Abraham and Romero,, 1999) ( 16 years ) and OJ 287 (Britzen et al.,, 2018) ( 12 years). This list may be supplemented by SDSS J0752, but this requires an additional research.
One can argue that the emission from this quasar object comes from a jet. However, we do not see any serious arguments for this statement. A particularly important point regards the fitting of X-ray spectra. One could think that our spectral models contain too many components and thus, that they could not be fitted to low-resolution data, since there would then be many more free parameters than actual independent data bins. This is not the case because our continuum spectral model is an XSPEC model consisting of the BMC component. The spectral model parameters are equivalent hydrogen absorption column density ; the photon index ; , which is related to the Comptonized factor ; and the color temperature and normalization of the seed photon blackbody component and , respectively.
Since the more massive BH is not active in the X-rays, then the active culprit for the X-ray flares, for example, in M87 is precisely the secondary (less massive) BH. It is this activity that underlies the X-ray scaling and timing analysis methods, and their results relate to the smaller black hole of this binary system in M87 and now it is not surprising that a BH mass according to X-ray estimates by Titarchuk et al., (2020) turned out to be two orders of magnitude less than results of the EHT method (Akiyama et al.,, 2019) and classical gas and stellar dynamic approach (Gebhardt et al.,, 2011; Walsh et al.,, 2013).
5 CONCLUSIONS
The optical periodic variability of the SDSS J0752 quasar has raised several questions regarding whether the source contains one or two BHs. It was very important to identify the X-ray characteristics indicating the duality of this quasar. In this paper, we demonstrated that an X-ray source coupled to an optical one exhibits flux variability in the energy range of 0.3–10 keV by a factor of 15. At the same time, the X-ray spectra of SDSS J0752 undergo transitions from the LHS state to the IS and then to the HSS (see Fig. 5) based on data from the XRT telescope on board the Swift observatory. We fitted the SDSS J0752 energy spectrum to a Comptonization model and described the evolution of the spectrum parameters. The temperature of the seed disk photons turned out to be very low ( keV), the degree of disk illumination varied in a wide range (illumination factor ) and the disk luminosity in the soft X-ray range showed a monotonic increase during the state evolution – the LHSISHSS – with a factor of ten and correlated with the optical flash of the SDSS J0752 (). In addition, we discovered saturation of the photon index with the mass accretion rate in SDSS J0752, which allowed us to scale the secondary black hole in this object using the scaling method. We thus determine mass of 9107 M⊙ for the secondary BH. We have shown that a scenario in which two supermassive black holes at the center of the quasar SDSS J0752 form an orbital pair, and the less massive secondary BH periodically crosses/pierces the disk around the more massive primary BH, can be applied to SDSS J0752. Thus, we associated an increase of the X-ray flux in SDSS J0752 with intersections of the disk of the primary BH with the secondary BH. In addition, we estimated the orbital inclination of the secondary BH, , based on a combination of our scaling approach and virial BH mass estimates by Zhang et al., (2022).
ACKNOWLEDGMENTS
We thank the anonymous referee for the careful reading of the manuscript and for providing valuable comments. The Authors are very happy to get a careful reading and editing our manuscript by Chris Shrader. We thank the anonymous referes for the careful reading of the manuscript and for providing valuable comments. We acknowledge support from UK Science Data Centre at the University of Leicester for supplied data. This paper has made use of the data from the CSS projects http://nesssi.cacr.caltech.edu/DataRelease/.
CONFLICTS OF INTEREST
The authors declare no conflict of interest.
Funding
No additional grants to carry out or direct this particular research were obtained.
Data Availability Statement
The Swift and CSS data underlying this paper are publicly available through the GSFC public archive (http://heasarc.gsfc.nasa.gov) and the CSS project (http://nesssi.cacr.caltech.edu/DataRelease/).
References
- Abraham and Romero, (1999) Abraham, Z., and Romero, G. E. (1999). Beaming and precession in the inner jet of 3C 273. Astron. and Astrophys. 344, 61–67
- Abraham and Carrara, (1998) Abraham, Z., and Carrara, E. A. (1998). The Precessing Jet in 3C 279. Astrophys. J. 496, 172–176. doi: 10.1086/305387
- Algaba et al., (2019) Algaba, J. C., Rani, B., Lee, S. S., Kino, M., Park, J., and Kim, J.-Y. (2019). Exploring the Morphology and Origins of the 4C 38.41 Jet. Astrophys. J. 886, 85. doi: 10.3847/1538-4357/ab4b45
- Akiyama et al., (2019) EHT Collaboration, Akiyama, K., Alberdi, A., Alef, W., Asada, K., Azulay, R. et al. (2019). First M87 Event Horizon Telescope Results. VI. The Shadow and Mass of the Central Black Hole. Astrophys. J. Lett. 875, L6. doi: 10.3847/2041-8213/ab1141
- Belloni et al., (2006) Belloni, T., Parolin, I., Del Santo, M., Homan, J., Casella, P., Fender, R. P. et al. (2006). INTEGRAL/RXTE high-energy observation of a state transition of GX 339–4. Mon. Not. R. Astron. Soc.. 367, 1113–1120. doi: 10.1111/j.1365-2966.2006.09999.x
- Boroson and Lauer, (2009) Boroson, T. A., and Lauer, T. R. (2009). A candidate sub-parsec supermassive binary black hole system. Nature. 458, 53–55. doi: 10.1038/nature07779
- Begelman et al., (1980) Begelman, M. C., Blandford, R. D., and Rees, M. J. (1980). Massive black hole binaries in active galactic nuclei. Nature. 287, 307–309. doi: 10.1038/287307a0
- Borozdin et al., (1999) Borozdin, K., Revnivtsev, M., Trudolyubov, S., Shrader, Ch., and Titarchuk, L. (1999). Do the Spectra of Soft X-Ray Transients Reveal Bulk-Motion Inflow Phenomenon? it Astrophys. J. 517, 367–380. doi: 10.1086/30718
- Britzen et al., (2018) Britzen, S., Fendt, C., Witzel, G., Qian, S.-J., Pashchenko, I. N., Kurtanidze, O. et al. (2018). OJ 287: deciphering the Rosetta stone of blazars. Mon. Not. R. Astron. Soc. 478, 3199–3219. doi: 10.1093/mnras/sty1026
- Caproni et al., (2004) Caproni, A., Mosquera Cuesta, H. J., and Abraham, Z. (2004). Observational Evidence of Spin-induced Precession in Active Galactic Nuclei. Astrophys. J. 616, L99–L102. doi: 10.1086/426863
- Caproni and Abraham, (2004) Caproni, A., and Abraham, Z. (2004). Can long-term periodic variability and jet helicity in 3C 120 be explained by jet precession? Mon. Not. R. Astron. Soc. 349, 1218–1226. doi: 10.1111/j.1365-2966.2004.07550.x
- Chan et al., (2021) Chan, C.-H., Piran, T., and Krolik, J. H. (2021). High-energy Emission from Tidal Disruption Events in Active Galactic Nuclei. Astrophys. J. 914, 107. doi: 10.3847/1538-4357/abf0a7
- Chen et al., (2020) Chen, Y.-C., Liu, X., Liao, W.-T., Holgado, A. M., Guo, H., Gruendl, R. et al. (2020). Candidate periodically variable quasars from the Dark Energy Survey and the Sloan Digital Sky Survey. Mon. Not. R. Astron. Soc. 499, 2245–2264. doi: 10.1093/mnras/staa2957
- Cui et al., (2023) Y. Cui, Y., Hada, K., Kawashima, T., Kino, M., Lin, W. et al. (2023). Precessing jet nozzle connecting to a spinning black hole in M87. Nature 621, 711–715. doi: 10.1038/s41586-023-06479-6
- Drake et al., (2009) Drake, A. J., Djorgovski, S. G., Mahabal, A., Beshore, E., Larson, S., Graham, M. J. et al. (2009). First Results from the Catalina Real-Time Transient Survey. Astrophys. J. 696, 870–884. doi: 10.1088/0004-637X/696/1/870
- Evans et al., (2009) Evans, P. A., Beardmore, A. P., Page, K. L., Osborne, J. P., O’Brien, P. T., Willingale, R. et al. (2009). Methods and results of an automatic analysis of a complete sample of Swift-XRT observations of GRBs. Mon. Not. R. Astron. Soc. 397, 1177–1201. doi: 10.1111/j.1365-2966.2009.14913.x
- Evans et al., (2007) Evans, P. A., Beardmore, A. P., Page, K. L., Tyler, L. G., Osborne, J. P., Goad, M. R. et al. (2007). An online repository of Swift/XRT light curves of -ray bursts. Astron. Astrophys. 469, 379–385. doi: 10.1051/0004-6361:20077530
- Eracleous et al., (2012) Eracleous, M., Boroson T. A., Halpern J. P., and Liu J. (2012). A large systematic search for close supermassive binary and rapidly recoiling black holes. Astrophysical J. Suppl. Ser. 201, 23 doi: 10.1088/0067-0049/201/2/23
- Gebhardt et al., (2011) Gebhardt, K., Adams, J., Richstone, D., Lauer, T. R., Faber, S. M., Gltekin, K. et al. (2011). The Black Hole Mass in M87 from Gemini/NIFS Adaptive Optics Observations. Astrophys. J. 729, 119. doi: 10.1088/0004-637X/729/2/11
- Homan et al., (2001) Homan, J., Wijnands, R., van der Klis, M., Belloni, T., van Paradijs, J., Klein-Wolt, M. et al. (2001). Correlated X-Ray Spectral and Timing Behavior of the Black Hole Candidate XTE J1550–564: A New Interpretation of Black Hole States. ApJS, 132, 377–402. doi: 10.1086/318954
- Kochanek et al., (2017) Kochanek, C. S., Shappee, B. J., Stanek, K. Z., Holoien, T. W.-S., Thompson, T. A., Prieto, J. L. et al. (2017). The All-Sky Automated Survey for Supernovae (ASAS-SN) Light Curve Server v1.0. Publ. Astron. Soc. Pac. 129, 104502. doi: 10.1088/1538-3873/aa80d
- Klindt et al., (2019) Klindt L., Alexander, D. M., Rosario, D. J., Lusso, E., and Fotopoulou, S. (2019). Fundamental differences in the radio properties of red and blue quasars: evolution strongly favoured over orientation. Mon. Not. R. Astron. Soc. 488, 3109–3128. doi:10.1093/mnras/stz1771
- Kollatschny et al., (2020) Kollatschny, W., Weilbacher P.M., Ochmann M.W., Chelouche, D., Monreal-Ibero, A., Bacon, R. et al. (2020). NGC 6240: A triple nucleus system in the advanced or final state of merging, Astron. Astrophys. 633, A79. doi: 10.1051/0004-6361/201936540
- Komberg, (1967) Komberg, B. V. (1967). A Binary System as a Quasar Model. Astron. Zh. 44, 906–907
- Koss et al., (2023) Koss, M. J., Treister, E., Kakkad, D., Casey-Clyde, J. A., Kawamuro, T. et al. (2023). UGC 4211: A Confirmed Dual Active Galactic Nucleus in the Local Universe at 230 pc Nuclear Separation. Astrophys. J. Lett. 942, L24. doi: 10.3847/2041-8213/aca8f0
- Koss et al., (2011) Koss, M., Mushotzky, R., Treister, E., Veilleux, S., Vasudevan, R., Miller, N. et al. (2011). Chandra Discovery of a Binary Active Galactic Nucleus in Mrk 739. Astrophys. J. Lett. 735, L42. doi: 10.1088/2041-8205/735/2/L42
- Laurent and Titarchuk, (2011) Laurent, P., and Titarchuk, L. (2011). Spectral Index as a Function of Mass Accretion Rate in Black Hole Sources: Monte Carlo Simulations and an Analytical Description. Astrophys. J. 727, 34. doi: 10.1088/0004-637X/727/1/34
- Laurent and Titarchuk, (1999) Laurent, P., and Titarchuk, L. (1999). The Converging Inflow Spectrum Is an Intrinsic Signature for a Black Hole: Monte Carlo Simulations of Comptonization on Free-falling Electrons. Astrophys. J. 511, 289–297. doi: 10.1086/306683
- Lense and Thirring, (1918) Lense, J., and Thirring, H. (1918). On the Influence of the Proper Rotation of Central Bodies on the Motions of Planets and Moons According to Einstein’s Theory of Gravitation. Phys. Z. 19, 156–163
- Lico et al., (2020) Lico, R., Liu, J., Giroletti, M., Orienti, M., Gmez, J. L., Piner, B. G. al. (2020). A parsec-scale wobbling jet in the high-synchrotron peaked blazar PG 1553+113. Astron. Astrophys. 634, id.A87. doi: 10.1051/0004-6361/20193656
- Lister, (2021) Lister, M. L., Homan, D. C., Kellermann, K. I., Kovalev, Y. Y., Pushkarev, A. B., Ros, E. et al. (2021). Monitoring Of Jets in Active Galactic Nuclei with VLBA Experiments. XVIII. Kinematics and Inner Jet Evolution of Bright Radio-loud Active Galaxies. Astrophys. J. 923, 30. doi: 10.3847/1538-4357/ac230f
- Liu et al., (2016) Liu, T., Gezari, S., Burgett, W., Chambers, K., Draper, P., Hodapp, K. et al. (2016). A Systematic Search for Periodically Varying Quasars in Pan-STARRS1: An Extended Baseline Test in Medium Deep Survey Field MD09. Astrophys. J. 833, 6. doi: 10.3847/0004-637X/833/1/6
- Molnar et al., (2017) Molnar, S. M., Schive, H.-Y., Birkinshaw, Chiueh, M. T., Musoke, G., and Young, A. J. (2017). Hydrodynamical simulations of colliding jets: modeling 3C 75. Astrophys. J. 835, 57. doi:10.3847/1538-4357/835/1/57
- Munoz-Darias et al., (2014) Muoz-Darias, T., Fender, R. P., Motta, S. E., & Belloni, T. M. (2014). Black hole-like hysteresis and accretion states in neutron star low-mass X-ray binaries. Mon. Not. R. Astron. Soc., 443, 3270–3283. doi: 10.1093/mnras/stu1334
- O’Neill et al., (2022) O’Neill, S., Kiehlmann, S., Readhead, A. C. S., Aller, M. F., Blandford, R. D., Liodakis, I. et al. (2022). The Unanticipated Phenomenology of the Blazar PKS 2131-021: A Unique Supermassive Black Hole Binary Candidate. Astrophys. J. Lett. 926, L35. doi: 10.3847/2041-8213/ac504b
- Paris et al., (2018) Paris, I., Petitjean, P., Aubourg, E., Myers, A.D., Streblyanska, A., Lyke, B. W. et al. (2018). The Sloan Digital Sky Survey Quasar Catalog: Fourteenth data release. Astron. Astrophys. 613, 51. doi: 10.1051/0004-6361/201732445
- Seifina et al., (2023) Seifina, E. (2023). Active galaxy nuclei: current state of the problem, Astron. Astrophys. Transact., Arxiv:2311.14830[astro-ph.GA]
- Seifina et al., (2017) Seifina, E., Titarchuk, L., and Virgilli, E. (2017). Swift J164449.3+573451 and Swift J2058.4+0516: Black hole mass estimates for tidal disruption event sources. Astron. Astrophys. 607, 38. doi: 10.1051/0004-6361/201730869
- (39) Seifina, E., Titarchuk, L., and Ugolkova, L. (2018a). Scaling of X-ray spectral properties of a black hole in the Seyfert 1 galaxy NGC 7469. Astron. Astrophys. 619, 21. doi: 10.1051/0004-6361/201833169
- (40) Seifina, E., Chekhtman, A., and Titarchuk, L. (2018b). NGC 4051: Black hole mass and photon index-mass accretion rate correlation. Astron. Astrophys. 613, 48. doi: 10.1051/0004-6361/201732235
- Seifina and Titarchuk, (2011) Seifina, E., andTitarchuk, L. (2011). On the Constancy of the Photon Index of X-Ray Spectra of 4U 1728-34 through All Spectral States. Astrophys. J. 738, 128. doi: 10.1088/0004-637X/738/2/128
- Seifina and Titarchuk, (2010) Seifina, E., and Titarchuk, L. (2010). On the Nature of the Compact Object in SS 433: Observational Evidence of X-ray Photon Index Saturation. Astrophys. J. 722, 586. doi: 10.1088/0004-637X/722/1/586
- Shakura and Sunyaev, (1973) Shakura, N. I., and Sunyaev, R. A. (1973). Black holes in binary systems. Observational appearance. Astron. Astrophys. 24, 337–355
- Shaposhnikov and Titarchuk, (2009) Shaposhnikov, N., and Titarchuk, L. (2009). Determination of Black Hole Masses in Galactic Black Hole Binaries Using Scaling of Spectral and Variability Characteristics. Astrophys. J. 699, 453–468. doi: 10.1088/0004-637X/699/1/453 (ST09)
- Shaposhnikov and Titarchuk, (2007) Shaposhnikov, N., and Titarchuk, L. (2007). Determination of Black Hole Mass in Cygnus X-1 by Scaling of Spectral Index-QPO Frequency Correlation. Astrophys. J. 663, 445–449. doi: 10.1086/518110 (ST07)
- Shappee et al., (2014) Shappee, B. J., Prieto, J. L., Grupe, D., Kochanek, C. S., Stanek, K. Z., De Rosa, G. et al. (2014). The Man behind the Curtain: X-Rays Drive the UV through NIR Variability in the 2013 Active Galactic Nucleus Outburst in NGC 2617. Astrophys. J. 788, 48. doi: 10.1088/0004-637X/788/1/48
- Shrader et al., (2010) Shrader, C. R., Titarchuk, L., & Shaposhnikov, N. (2010). New Evidence for a Black Hole in the Compact Binary Cygnus X–3. Astrophys. J., 718, 488–493. doi: 10.1088/0004-637X/718/1/488
- Thirring, (1918) Thirring, H. (1918). ber die Wirkung rotierender ferner Massen in der Einsteinschen Gravitationstheorie. Phys. Z. 19, 33–39
- Titarchuk and Seifina, (2023) Titarchuk, L., and Seifina, E. (2023). MAXI J1348–630: Estimating the black hole mass and binary inclination using a scaling technique. Astron. Astrophys. 669, 57. doi: 10.1051/0004-6361/202244585
- Titarchuk et al., (2023) Titarchuk, L., Seifina, E., and Shrader, Ch. (2023). OJ 287: a new BH mass estimate of the secondary. Astron. Astrophys. 671, A159. doi: 10.1051/0004-6361/202345923
- Titarchuk and Seifina, (2021) Titarchuk, L., and Seifina, E. (2021). Detection of a high-temperature blackbody hump in black hole spectra - the strongly redshifted annihilation line. Mon. Not. R. Astron. Soc. 501, 5659–5678. doi: 10.1093/mnras/staa3961
- Titarchuk et al., (2020) Titarchuk L., Seifina E., Chekhtman A., and Ocampo, I. (2020). Spectral index–mass accretion rate correlation and evaluation of black hole masses in AGNs 3C 454.3 and M 87. Astron. Astrophys. 633, A73. doi: 10.1051/0004-6361/201935576
- Titarchuk and Seifina, (2017) Titarchuk, L., and Seifina, E. (2017). BL Lacertae: X-ray spectral evolution and a black-hole mass estimate. Astron. Astrophys. 602, 113. doi: 10.1051/0004-6361/201630280
- (54) Titarchuk, L., and Seifina, E. (2016a). Scaling of the photon index vs. mass accretion rate correlation and estimate of black hole mass in M101 ULX–1. Astron. Astrophys. 585, A94. doi: 10.1051/0004-6361/201526122
- (55) Titarchuk, L., and Seifina, E. (2016b). ESO 243–49 HLX–1: scaling of X-ray spectral properties and black hole mass determination. Astron. Astrophys. 595, 110. doi: 10.1051/0004-6361/201527840
- Titarchuk et al., (2014) Titarchuk, L., Seifina, E., and Shaposhnikov, N. (2014). Black hole mass determination in the X-ray binary 4U 1630–47: scaling of spectral and variability characteristics. Astrophys. J. 789, 57. doi: 10.1088/0004-637X/789/1/57
- Titarchuk et al., (2010) Titarchuk, L., Shaposhnikov, N., and Seifina, E. (2010). Discovery of photon index saturation in the black hole binaries. AIP Conf. Proc. 1205, 168–176. doi: 10.1063/1.3382325
- Titarchuk and Seifina, (2009) Titarchuk, L., and Seifina, E. (2009). Discovery of Photon Index Saturation in the Black Hole Binary GRS 1915+105. Astrophys. J. 706, 1463–1483. doi: 10.1088/0004-637X/706/2/1463
- Titarchuk and Fiorito, (2004) Titarchuk, L. G., and Fiorito, R. (2004). Spectral Index and Quasi-Periodic Oscillation Frequency Correlation in Black Hole Sources: Observational Evidence of Two Phases and Phase Transition in Black Holes. Astrophys. J. 612, 988–999. doi: 10.1086/422573
- Titarchuk and Zannias, (1998) Titarchuk, L., and Zannias, T. (1998). The Extended Power Law as an Intrinsic Signature for a Black Hole. Astrophys. J. 493, 863–872. doi: 10.1086/305157
- Titarchuk et al., (1998) Titarchuk, L. G., Mastichiadis, A., and Kylafis, N. D. (1998). Mechanisms for High-Frequency Quasi-periodic Oscillations in Neutron Star and Black Hole Binaries. Astrophys. J. 499, 315–328. doi: 10.1086/305642
- Voggel et al., (2022) Voggel, K. T., Seth A. C., Baumgardt H., Husemann, B., Neumayer, N., Hilker, M.l et al. (2022). First direct dynamical detection of a dual supermassive black hole system at sub-kiloparsec separation. Astron. Astrophys. 658, A152. doi: 10.1051/0004-6361/202140827
- von Fellenberg et al., (2023) von Fellenberg, S. D., Janssen, M., Davelaar, J., Zajaek, M., Britzen, S., Falcke, H. et al. (2023). Radio jet precession in M 81. Astron. Astrophys. 672, L5. doi: 10.1051/0004-6361/202245506
- Walker et al., (2018) Walker, R. C., Hardee, P. E., Davies, F. B., Ly, C., and Junor, W. (2018). The Structure and Dynamics of the Subparsec Jet in M87 Based on 50 VLBA Observations over 17 Years at 43 GHz. Astrophys. J. 855, 128. doi: 10.3847/1538-4357/aaafcc
- Walsh et al., (2013) Walsh, J. L., Barth, A. J., Ho, L. C., and Sarzi, M. (2013). The M87 Black Hole Mass from Gas-dynamical Models of Space Telescope Imaging Spectrograph Observations. Astrophys. J. 770, 86. doi: 10.1088/0004-637X/770/2/86
- Wilms et al., (2000) Wilms, J., Allen, A., and McCray, R. (2000). On the Absorption of X-Rays in the Interstellar Medium. Astrophys. J. 542, 914-924. doi: 10.1086/317016
- Wright, (2006) Wright, E. L. (2006). A Cosmology Calculator for the World Wide Web. Publ. Astron. Soc. Pac. 118, 1711–1715. doi: 10.1086/510102
- Zhang et al., (2022) Zhang, X.-G. (2022). A 6.4-yr optical quasi-periodic oscillations in SDSS J075217.84+193542.2: a new candidate for central binary black hole system. Mon. Not. R. Astron. Soc. 512, 1003–1011. doi.org/10.1093/mnras/stac540
| Parameter | Value | Reference |
|---|---|---|
| Source class | QSO | Zhang et al., (2022) |
| Virial mass of a primary BH, M⊙ | 1.04 | Zhang et al., (2022) |
| Virial mass of a secondary BH, M⊙ | 8.8 | Zhang et al., (2022) |
| Orbital inclination, , deg | 80 | this work |
| Orbital period, , yr | 6.4 | Zhang et al., (2022) |
| Distance , Mpc | 500 | this work |
| Red shift, | 0.117 | Paris et al., (2018) |
| Obs. ID | Start time (UT) | Exposure time, ks | Start time (MJD) | |
|---|---|---|---|---|
| 00038041001 | 2008 October 31 07:06:59 | 3.6 | 54770.297 | |
| 00038041002 | 2009 February 24 04:55:17 | 1.3 | 54886.205 | |
| 00038041003 | 2009 September 12 19:12:59 | 1.5 | 55086.800 | |
| 00038041004 | 2010 May 30 00:07:16 | 2.7 | 55346.005 | |
| 00039551001 | 2010 May 30 09:44:39 | 5.0 | 55346.406 |
| Reference | , | , | , | , |
|---|---|---|---|---|
| sources | M⊙ | deg | Mpc | |
| HLX–1 | ||||
| ESO 243–49(1) | 75 | |||
| M101 ULX–1(2) | ||||
| OJ 287(3) | ||||
| Target source | , | , | , | |
| M⊙ | deg | Mpc | ||
| SDSS J0752 | 50 | 500 | that using ESO 243-49 as a ref. source | |
| SDSS J0752 | 50 | 500 | that using M101 ULX-1 as a ref. source | |
| SDSS J0752 | Final estimate | 50 | 500 | as a standard deviation for a mean: |
(a) System inclination in the literature and (b) source distance found in the literature. (1) Titarchuk and Seifina, 2016b ; (2) Titarchuk and Seifina, 2016a ; and (3) Titarchuk et al., (2023).