ChartThinker: A Contextual Chain-of-Thought Approach to Optimized Chart Summarization
Abstract
Data visualization serves as a critical means for presenting data and mining its valuable insights. The task of chart summarization, through natural language processing techniques, facilitates in-depth data analysis of charts. However, there still are notable deficiencies in terms of visual-language matching and reasoning ability for existing approaches.
To address these limitations, this study constructs a large-scale dataset of comprehensive chart-caption pairs and fine-tuning instructions on each chart.
Thanks to the broad coverage of various topics and visual styles within this dataset, better matching degree can be achieved from the view of training data.
Moreover, we propose an innovative chart summarization method, ChartThinker, which synthesizes deep analysis based on chains of thought and strategies of context retrieval, aiming to improve the logical coherence and accuracy of the generated summaries.
Built upon the curated datasets, our trained model consistently exhibits superior performance in chart summarization tasks, surpassing 8 state-of-the-art models over 7 evaluation metrics. Our dataset and codes are publicly accessible.
Keywords: chart summarization, large visual-language model, chain of thought
ChartThinker: A Contextual Chain-of-Thought Approach to Optimized Chart Summarization
| Mengsha Liu1, Daoyuan Chen2, Yaliang Li2, Guian Fang1,Ying Shen1††thanks: Corresponding authors |
| 1 Sun Yat-sen University, |
| 2 Alibaba Group |
| {liumsh6, fanggan}@mail2.sysu.edu.cn |
| {daoyuanchen.cdy, yaliang.li}@@alibaba-inc.com |
| sheny76@mail.sysu.edu.cn |
Abstract content
1. Introduction
Data visualizations, such as bar charts and line charts, are widely used to present quantitative data. These charts are valuable tools for gaining insights from data and making informed decisions. However, manually writing textual descriptions for charts can be time-consuming and prone to errors Stokes et al. (2022). Automatic chart summarization addresses this challenge by explaining a chart and summarizing its key takeaways in natural language. Using such systems, not only can the interpretability of the charts be enhanced, but they can also significantly reduce the time and cognitive resources required, thereby optimizing workflow efficiency Obeid and Hoque (2020).
In the early stages, researchers relied on template-based methods that combined statistical techniques and planning-based architecture to generate captions for charts Reiter (2007). However, this method has its limitations, as it often leads to similar answer styles across different charts. More recently, there has been a shift towards exploring data-driven neural models for describing tabular data Liu et al. (2018). This approach involves converting all charts into tables and then transforming these tables into descriptive texts Liu et al. (2022a). Although this approach can accurately capture the data within the charts, it also results in the omission of a substantial amount of information, such as chart types, curve trends, and other crucial details. Furthermore, with the advancement of large visual-language models, some researchers have begun utilizing pre-trained models trained on language and vision tasks to address the chart-to-text task Masry et al. (2023).
However, large visual-language models still face challenges when generating chart-based textual descriptions. Two primary challenges include: (i) Insufficient Matching Degree: This refers to the degree to which the generated summaries align with a chart’s numerical information. There are two main pitfalls here: incomplete descriptions and fabricated chart content. The former arises because the proportion of numbers and text in charts is relatively small, causing these details to be easily overlooked by the models, leading to content omissions. The latter, fabricated chart content, is an outcome of large visual-language models being influenced by unrelated information from their pre-training corpus, which causes them to produce content not relevant to the charts Du et al. (2022). (ii) Reasoning Errors: Large models often underperform in chart reasoning tasks Jiang et al. (2022); Bertolini et al. (2022). Beyond numerical descriptions, models are expected to provide a holistic summary that captures the chart’s intended meaning. However, some charts present vast amounts of numerical data and intricate curve patterns. This complexity poses challenges for models in deciphering the inherent meaning represented by the data, leading them to sometimes misinterpret the chart’s intended message, causing reasoning errors Wang et al. (2022a).
To address these limitations, we propose a new method named ChartThinker for training context-aware visual-language models, which leverages the chain of thought (CoT) and context retrieval for generating textual descriptions from charts. First, we pre-train the model using 595,955 chart-description pairs to enhance the matching degree, and subsequently fine-tune it using 8 million question-answer pairs, aiming to improve the model’s accuracy and robustness in handling diverse charts and questions. Additionally, we introduce a Context-Enhanced CoT Generator module. This module fuses thought chains with context retrieval, incorporating increased logic and contextual information during the generation process, aiming to enhance the model’s reasoning ability. Lastly, we employ a chart parsing module. This module combines the extracted underlying data with the prompt and feeds it as input to the CoT Generator, enhancing the model’s accuracy and matching degree in interpreting chart data.
We conduct extensive empirical analysis to answer the following research questions (RQ):
-
•
RQ1: Can answer reasoning benefit from introducing a chain of thought?
-
•
RQ2: How can context retrieval and chain of thought effectively interact with each other?
-
•
RQ3: How does instruction fine-tuning improve the chart-summary matching degree?
Our main contributions are as follows:
-
•
A large-scale chart dataset consisting of 595,955 chart-caption pairs and 8 million instruction-question pairs, covering a diverse range of visual styles and topics.
-
•
An effective method for chart summarization, which leverages a context-enhanced CoT generator to integrate CoT with context retrieval.
-
•
Extensive automatic and human evaluations that demonstrate the state-of-the-art (SOTA) performance of ChartThinker on various chart benchmarks. To facilitate further research, we release our dataset and codes at OpenChartThinker.
2. Related Work
Chart Summarization. Early methods for chart summarization relied on planning-based architectures Reiter (2007). The iGRAPH-Lite system Ferres et al. (2007) employed template-based generation, aiding the visually impaired. Recent research by Chen et al. (2020) introduced a coarse-to-fine template-based generation method, and addressed some logical issues. While effective, the template-based generated text tends to be similar in nature, lacking individual differences and diversity. To overcome these limitations, researchers began adopting architectures like LSTM Hochreiter and Schmidhuber (1997) or transformers Vaswani et al. (2017). For instance, Singh and Shekhar (2020) and Kantharaj et al. (2022) utilized ResNet to encode and introduced attention mechanisms, enhancing chart detail understanding. Additionally, some researchers Obeid and Hoque (2020) have improved the factual accuracy of generated summaries by enhancing the embeddings in transformers.
To enhance the model’s understanding of charts, Liu et al. (2022b) made improvements based on Pix2Struct Lee et al. (2023) through pre-training on chart inverse rendering and mathematical reasoning tasks. In recent research, Liu et al. (2022a) integrated the underlying information of charts with a large language model (LLM), improving the logical coherence and accuracy of chart summarization.
Visual-Language Models. The field of LLMs has experienced significant advancements, exemplified by groundbreaking works such as ChatGPT Brown et al. (2020); OpenAI (2023), LLaMA Touvron et al. (2023), and Vicuna Chiang et al. (2023). More recently, multi-modal LLMs have garnered increasing attention. Flamingo Alayrac et al. (2022) proposed a unified architecture with context-aware few-shot capabilities, and its open-source variant is OpenFlamingo Awadalla et al. (2023). Blip2 Li et al. (2023b) bridges the modality gap between vision and language through a lightweight query transformer Vaswani et al. (2017). Mini-GPT4 Zhu et al. (2023) builds on BLIP-2 to support longer responses and multi-turn dialogues better. LLaVA Liu et al. (2023a) employs a projection layer to align the frozen visual encoder CLIP Radford et al. (2021) with the frozen LLM (Vicuna). LLaMA-Adapter Zhang et al. (2023); Gao et al. (2023) adapts LLaMA with additional adapter modules and multi-modal prompts. Ottor Li et al. (2023a) focuses on enhancing the model’s ability to follow instructions through context examples.
| Dataset Name | Image Count | Q&A Pair Count | Chart Types |
|---|---|---|---|
| Autochart Zhu et al. (2021) | 6,003 | - | Scatter, Line, Bar |
| Linecap Mahinpei et al. (2022) | 3,528 | - | Line |
| DVQA Kafle et al. (2018) | 300,000 | 3,480,000 | Scatter, Line, Bar |
| PlotQA Methani et al. (2020) | 157,070 | 2,890,000 | Scatter, Line, Bar |
| Chart-to-text Kantharaj et al. (2022) | 29,354 | - | Scatter, Line, Bar, Pie |
| FIGUREQA Kahou et al. (2017) | 100,000 | 1,600,000 | Scatter, Line, Bar, Pie |
| Chart-Sum-QA (Ours) | 595,955 | 8,170,000 | Scatter, Line, Bar,Pie |
Prompt Engineering. In recent years, guiding large language models to provide more accurate answers has become a research hotspot. To this end, researchers have proposed various prompt engineering frameworks aimed at enhancing LLM reasoning, among which Prompt Chain of Thought Wei et al. (2022), which guides the model’s responses with intermediate reasoning examples, stands out as one of the most innovative and beneficial techniques. Its subsequent development, Chain-of-Thought-Self-Consistency Wang et al. (2022b), employs multiple reasoning paths, weighting them for optimized responses. Tree-of-Thoughts Yao et al. (2023) showcases a tree-structured thought expansion, while Graph-of-Thoughts Besta et al. (2023) progresses it into a directed acyclic graph, complete with self-loops. Algorithm-of-Thoughts Sel et al. (2023) sets forth dynamic reasoning paths, mitigating redundancies. Skeleton-of-Thought Ning et al. (2023) crafts a response blueprint, and Program-of-Thought Chen et al. (2022) articulates reasoning process into actionable programs.
Our Position. In summary, improving chart summarization with LLMs is under-explored. While current SOTA LLMs predominantly emphasize improving factual accuracy, logical coherence, or refining training architectures, they often overlook holistic integration. Our research bridges this gap by bolstering the accuracy and efficiency of vision-language LLMs specifically for chart summarization. We achieve this through the introduction of a novel dataset and a pioneering method that seamlessly blends Chain of Thought (CoT) with context retrieval strategies, all while maximizing context utilization.
3. Methodology
Given an input chart image and a prompt (question or instruction) , we aim to generate an effective summary that includes as much accurate information as possible, such as the chart’s axes, data points, trends, and other relevant details.
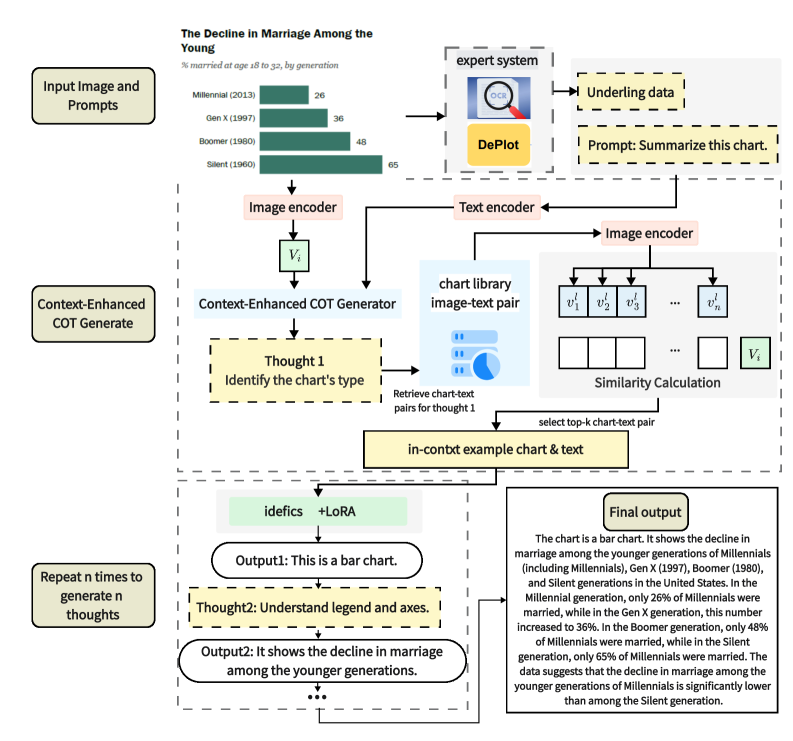
In this section, we begin by discussing the construction of the dataset (Sec. 3.1). Regarding the model architecture, we first utilize an image encoder and a text encoder to extract features from the input chart and prompt respectively (Sec. 3.2). Then, we introduce a chart parsing module that combines the obtained underlying data with the prompt to generate new text features (Sec. 3.3). Next, we design a Context-Enhanced CoT Generator module that integrates thought chains with context retrieval. By leveraging a small retrieval library, the model can access context examples related to the chart while constructing thought chains, injecting more logic and contextual information during the generation process (Sec. 3.4). Finally, all the generated thought chains are integrated with the LLM, Idefics Huggingface (2023), to produce the final output. The overall architecture of the model is shown in Figure 2.
3.1. Dataset Construction
We construct a dataset named Chart-Sum-QA, which includes comprehensive chart-summary pairs and question-answer pairs for instruction fine-tuning. Based on it, our model is pre-trained on 595,955 chart summary data points and is further fine-tuned using 8,170,000 instruction-question pairs (detailed in Table 1).
The process of constructing the dataset involves:
(1) Data Collection: We collect six different datasets containing images and their corresponding descriptions, consisting of 595,955 charts covering a broad range of topics and various chart types. These datasets are sourced from public image databases, research papers, or online image libraries. All datasets are covered under appropriate licenses (e.g., CC BY-NC-SA 4.0, MIT, GPL3.0). (2) Data Preprocessing: For each dataset, we perform preprocessing to ensure the consistency and usability of the data Chen et al. (2023). This includes resizing images, converting and standardizing formats, as well as cleaning and standardizing titles or descriptions. We ensure a precise alignment between images and their captions. (3) Generate Question-Answer Pairs: To improve our model, we generate an additional 400,000 chart-question-answer pairs for instruction fine-tuning based on the summaries of Chart-to-text Kantharaj et al. (2022), Autochart Zhu et al. (2021), and Linecap Mahinpei et al. (2022) datasets. The generated instruction fine-tuning dataset is merged with other QA datasets and filtered to obtain the final QA question-answer pairs for instruction fine-tuning, totaling 8,170,000 pairs, which include diverse questions about the charts. Since human annotations are costly, we generate questions automatically from human-written chart summaries using ChatGPT 4 and manually validate a subset of them for quality assurance. Through the QA dataset, the model can perform step-by-step learning more effectively in the contextual thought of chain, answering relevant questions more accurately. (4) Dataset Splitting: We partition the dataset into 80% training, 10% validation, and 10% testing. The data is randomly and evenly distributed during the splitting process.
3.2. Image and Text Encoder
Our chart image encoder is based on the encoder of CLIP Radford et al. (2021). The encoder takes an input chart and generates an encoded feature vector. To effectively encode chart images, the encoder identifies four components: (1) text elements (chart legends and axis labels), (2) data point elements (points, bars, lines representing specific values), (3) visual elements (chart type, colors), and (4) trend elements (patterns and trends of lines and scatter points in the chart). By recognizing and understanding these components, the chart image encoder generates a comprehensive encoded feature vector that captures the key information of the chart. The input chart image is processed by the encoder through operations such as convolution, pooling, and fully connected layers to transform it into a fixed-length encoded feature vector:
| (1) |
where represents the encoded feature vector, represents the chart image encoder function, and represents the input chart image.
We employ the LLaMA2 Touvron et al. (2023) decoder to generate the output. The input is the prompt (question or instruction), and the output is the token sequence obtained by the encoder:
| (2) |
where represents the encoded token sequence, represents the text encoder function, and represents the input prompt.
3.3. Chart Parsing Module
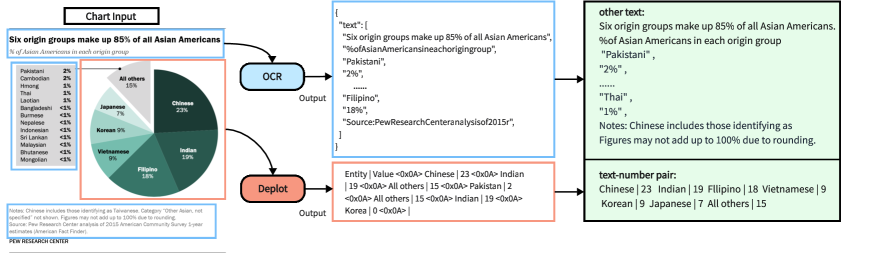
The chart parsing module consists of two parts. The first part is the OCR module, which can extract textual and numerical content from charts. However, it lacks the ability to extract corresponding positions. The second part is the deplot moduleLiu et al. (2022a), which converts charts into tables. It is effective in handling the correspondence between numbers and text, but sometimes struggles with accurate numerical extraction and can be easily affected by irrelevant chart elements. We integrate these two modules to output the textual legends of the chart and text-number pairs containing key information. After extracting the necessary information, the outputs of the chart parsing module are combined with prompts and inputted into the context-enhanced CoT generator. An example of this module’s operation is shown in Figure 3.
3.4. Context-Enhanced CoT Generator
To improve the quality and logical consistency of the generated results, we propose the Context-Enhanced CoT Generator module, which combines thought chains with context retrieval. Below are the detailed steps of this module:
-
•
Building a Small Retrieval Library: We created a small retrieval library containing 1,000 pairs of charts and text, where each pair includes basic information about the chart, image trends, x-y coordinates, etc. These context examples correspond to each stage of the COT, as detailed in Appendix B.
-
•
Similarity Computation: We employ cosine similarity to measure the similarity between the features of the input image and each context example in the retrieval library:
(3) where represents the feature vector of the -th context example, represents the encoded feature vector of the input chart, () denotes the dot product, () represents the norm of the vector.
-
•
Context Learning Weight Computation: Based on the results of the similarity computation, we assign context learning weights to each context example.Given the sensitivity of language models to the order of input prompts, images that are more similar in context learning (i.e., those ranked higher) are given more weight. That is, the weight of each image is inversely proportional to its relative position i. We define the weight as . That is, the weight of each image is inversely proportional to its relative position . We define the weight as .
The weighting function is as follows:
(4) where the function represents the influence of the image when generating he th language token.
-
•
Logic and Context Information Injection: During the generation process, we use the Idefics generation model. Given the image context, therefore, the conditional probability of the text can be expressed as:
(5) The generation of each language token depends not only on the previous text tokens , but also on the weighted influence of the image context calculated by weighting function . This method ensures the effective use of the image context information in the generation process.
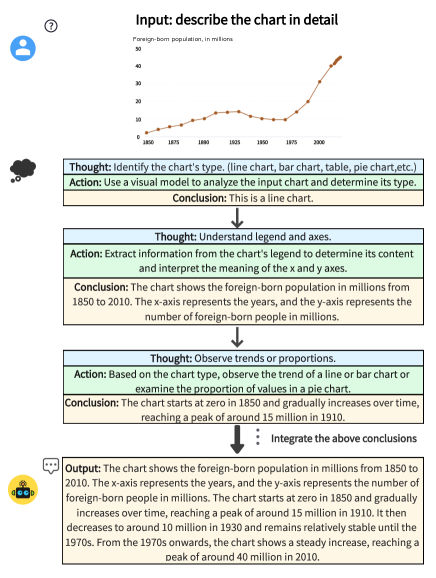
In a nutshell, our objective is to leverage the integration of thought chains with context retrieval to enhance the Context-Enhanced CoT Generator module. This enhancement aims to facilitate the provision of comprehensive contextual information, and enhance the quality and logical consistency of the generated results. The process of generating a CoT chart summary is shown in Figure 4. Some specific generation examples are shown in Appendix A.
4. Experiment
4.1. Experimental Setup
| BLEU | BLEURT | CIDEr | CS | PPL | ||
|---|---|---|---|---|---|---|
| OCR-T5 Raffel et al. (2020) | 10.49 | -0.35 | 2.20 | 40.87% | 10.11 | 0.803 |
| OCR-Chart2text Obeid and Hoque (2020) | 7.2 | -0.56 | 0.65 | 24.49% | 12.11 | 0.338 |
| OCR-Field-Infuse Chen et al. (2020) | 0.19 | -1.01 | 0.26 | 10.12% | 9.57 | 0.179 |
| OCR-BART Lewis et al. (2020) | 9.09 | -0.38 | 1.97 | 39.99 % | 11.04 | 0.696 |
| OCR-ChartThinker (ours) | 11.81 | -0.32 | 2.21 | 32.72% | 9.23 | 0.948 |
| BLEU | BLEURT | CIDEr | CS | PPL | |
|---|---|---|---|---|---|
| LLaMA-Adapter-v2 Gao et al. (2023) | 1.07 | -0.83 | 0.36 | 8.19% | 12.35 |
| MiniGPT-4 Zhu et al. (2023) | 2.29 | -0.63 | 0.62 | 11.77% | 12.21 |
| mPLUG-Owl Ye et al. (2023) | 3.21 | -0.52 | 0.65 | 16.9% | 12.25 |
| LLaVA Liu et al. (2023a) | 4.21 | -0.51 | 1.08 | 19.15% | 12.16 |
| ChartThinker (ours) | 5.82 | -0.45 | 1.58 | 21.68% | 11.43 |
4.1.1. Baselines
We compare our model against 8 baselines. (1) T5 Raffel et al. (2020): A unified seq2seq transformer model that achieved SOTA results on various text-to-text tasks. (2) Chart2text Obeid and Hoque (2020): An adapted transformer model specifically designed for chart-to-text translation. (3) Field-Infusing Model Chen et al. (2020): A transformer encoder-decoder model that generates target summaries and incorporates bounding box information for positional details. (4) BART Lewis et al. (2020): A seq2seq transformer model pre-trained with denoising objectives, which has shown effectiveness in text generation tasks. (5) LLaMA-Adapter-v2 Gao et al. (2023): A parameter-efficient visual instruction model enable powerful multi-modal reasoning. (6) MiniGPT-4 Zhu et al. (2023): It demonstrates powerful multi-modal capabilities similar to GPT-4 by aligning visual features with an advanced LLM. (7) mPLUG-Owl Ye et al. (2023): A model that achieves powerful visual understanding, multi-turn dialogue capability, and knowledge reasoning. (8) LLaVA Liu et al. (2023a): An end-to-end trained model that achieves a new SOTA accuracy on Science QA Lu et al. (2022).
4.1.2. Automatic & Human Evaluation
To verify the matching degree between generated text and charts, we employ five measures for automatic evaluation in our study. We use BLEU Post (2018) for n-gram overlaps and BLEURT Sellam et al. (2020), specifically BLEURT-base-128, for fluency and content accuracy. CIDEr Vedantam et al. (2015) evaluates the TFIDF weighted n-gram overlaps between the modelgenerated text and the reference, while Content Selection (CS) score Wiseman et al. (2017) measures how well the generated text aligns with the gold answer. Lastly, we use the GPT-2 Medium model Radford et al. (2019) to determine readability via perplexity. To holistically assess ChartThinker’s performance, we newly calculated average normalized scores across five indicators, with the formula = .
To further evaluate the quality of the summaries, we conduct a manual assessment of 200 generated chart summaries. Annotators evaluated each summary based on two criteria: (i) Matching Degree (the data in the generated summary matches the chart with minimal data omission or fabrication) (ii) Reasoning Correctness (the summary accurately infers the intended message or viewpoint from the chart). Summaries were rated on a 1-5 scale, with 1 being the lowest and 5 being the highest, and presented randomly to avoid bias. The final score was the average given by the three evaluators.
4.1.3. Fine-tuning Implementation
We apply the LoRA mechanism Hu et al. (2021) into our model, setting the rank of the update matrices to 16, which reduced the size and number of trainable parameters. Specifically, the LoRA update matrices were applied to the modules “”, “”, and “”. To control the magnitude of the LoRA updates, we set the scaling factor, Alpha, to 32 and implemented a dropout rate of 0.05 on the LoRA layers to mitigate over-fitting. The model was initialized with the weights of the pre-trained base model and was fine-tuned using the “paged_adamw_8bit” optimizer with a learning rate of 2e-4. To emulate larger batch sizes, a gradient accumulation step of 8 was used. During fine-tuning, evaluations were conducted every 20 steps.
4.2. Main Results
4.2.1. Benchmark Results
For a comprehensive evaluation, we compare our model to two types of methods, which cover different model architectures, processing of visual information, and input configurations.
| BLEU | BLEURT | CIDEr | CS | PPL | Human | |
|---|---|---|---|---|---|---|
| ChartThinker (ours) | 5.82 | -0.45 | 1.58 | 21.68% | 11.43 | 4.25 |
| No Chart Parsing Module | 4.87 | -0.50 | 1.12 | 18.29% | 11.68 | 3.98 |
| No Context-Enhanced | 5.45 | -0.53 | 1.34 | 20.10% | 12.07 | 4.11 |
| No CoT | 5.10 | -0.57 | 1.22 | 19.87% | 11.97 | 3.92 |
| No Context-Enhanced CoT Generator | 4.59 | -0.60 | 1.10 | 19.55% | 12.38 | 3.85 |
| No finetune on caption dataset | 4.36 | -0.60 | 1.19 | 19.03% | 11.75 | 3.74 |
| No finetune on inrtruction dataset | 4.52 | -0.63 | 1.27 | 19.23% | 11.50 | 4.03 |
Comparing with classic decoder-only models. Initially, we juxtapose our model against four classic pre-trained LLMs, as shown in Table 2. Beyond the standard inputs of images and questions, we enrich the input data by integrating OCR-generated content from each chart. This augmented input feeds both the benchmark models and our own. Our experimental outcomes show that our model registers BLEU and CIDEr scores of 11.81 and 2.21, outstripping all baseline models. This performance underscores the superior matching degree of our generated text with the corresponding charts. Additionally, our model excels in BLEURT and PPL metrics, reflecting the enhanced readability and fluency of our generated summaries. To more intuitively and comprehensively evaluate the overall performance of ChartThinker compared to other classic models, we calculated the average normalized score for each model. This method normalizes all scores to a range between 0 and 1, allowing for direct and fair comparison between different metrics. The final results show that OCR-ChartThinker not only excels in individual metrics but also demonstrates the best overall performance. Overall, these findings emphasize the advantages of our model architecture over traditional transformer models.
Comparing with encoder-decoder models. In a subsequent phase, we compare our model with other large visual language models using the encoder-decoder architecture, as seen in Table 3. We train five baseline models on the pew dataset and evaluate them on its test set Kantharaj et al. (2022). The results highlight the superior performance of our model over other visual language models with similar frameworks. This observation directly addresses RQ1, emphasizing that embedding the reasoning chain into the model positively influences answer inference. With respect to RQ2, our findings confirm that the synergy between context retrieval and the reasoning chain bolsters model performance. Our model adeptly marries context retrieval with the reasoning chain, guaranteeing peak inference at every juncture. The model progressively generates the desired outcomes and makes timely adjustments, resulting in summaries that match more closely with the underlying charts. As a testament to this, our BLEU score witnesses an enhancement of 1.61 when juxtaposed against contemporary SOTA methods.
Our model undergoes instruction fine-tuning for each chart, allowing for a more accurate description of the actual values in the chart and further enhancing chart comprehension. Consequently, our model achieves the best PPL score. This provides evidence for RQ3, suggesting that using a directive dataset in fine-tuning enhances performance.
4.2.2. Human Evaluation Results
Table 5 showcases a manual evaluation of chart summarization. In this assessment, our ChartThinker model is benchmarked against eight advanced baseline models, which include those based on the classic transformer architecture as well as other prominent visual language models. The assessment primarily centers on two key criteria: matching degree between the summaries and the charts, and reasoning correctness. In terms of matching degree, the summaries generated by ChartThinker faithfully represent the data and information from the charts and show fewer errors. This indicates that our model significantly reduces data omissions and fabrications. Regarding reasoning correctness, the evaluators consistently favored our model. This demonstrates that ChartThinker excels in interpreting charts and making accurate inferences, capturing the core messages conveyed by the charts. Compared to other baseline models, ChartThinker holds a notable edge in this domain. More details are provided in Appendix C.
| Matching | Reasoning | |
|---|---|---|
| Degree | Correctness | |
| OCR-T5 | 3.96 | 4.11 |
| OCR-Chart2text | 3.58 | 4.02 |
| OCR-Field-Infuse | 2.13 | 3.29 |
| OCR-BART | 3.79 | 3.87 |
| LLaMA-Adapter-v2 | 2.63 | 2.97 |
| MiniGPT-4 | 2.92 | 2.85 |
| mPLUG-Owl | 3.10 | 3.26 |
| LLaVA | 3.27 | 3.34 |
| ChartThinker (ours) | 4.32 | 4.27 |
4.3. Ablation Studies
To further assess the impact of different parts on our model, we conduct ablation studies. The results are shown in Table 4.
The impact of ChartThinker component. On the component level, we find that removing any major component (Chart Parsing Module and Context-Enhanced CoT Generator) would cause a performance drop. From Table 4, we observe that: (1) Remove the Chart Parsing Module results in a significant decrease in the accuracy of describing the underlying data of the chart. (2) The removal of the context retrieval component from the generator significantly decreases the coherence and logicality of the generated text. This decline in language proficiency is attributed to the model’s loss of contextual examples. (3) Similarly, the removal of the CoT component in the generator results in a decline in reasoning ability and a decrease in the comprehensiveness of the generated content. This is due to its lack of step-by-step generation and final integration process.
Caption Dataset. Excluding the chart description dataset leads to a decline in performance on the chart-to-text pew testset. Notably, BLEU decreases by 1.46, CIDEr by 0.39, and CS by 2.65%. This indicates challenges in producing precise chart summaries without the dataset. Additionally, a reduced BLEURT and a higher PPL highlight the model’s difficulty with unfamiliar chart layouts.
Instruction Dataset. To further investigate the impact of the instruction dataset, we excluded the dataset from our training. Without this fine-tuning, the model’ degree of chart-summary matching weakens, occasionally generating unrelated content. This mismatching arises because the model relying on its pre-training parameters, fails to adapt to chart tasks. The drop in BLEU and CS scores reveals challenges in extracting pertinent details and reasoning accurately.
4.4. Case Study
4.4.1. Training Paradigms and Task-Specific Optimization
Regarding the performance gap between multi-modal large models and text-only models, LMMs, such as our proposed ChartThinker, are pre-trained on unsupervised text-image pairs and are not fine-tuned for specific tasks, which contrasts with text-only models using OCR systems trained on task-specific supervised data. This accounts for the superior performance of OCR+LLM models on certain tasks Jiao et al. (2024), where the OCR system benefits from training data distribution that mirrors the test set. As an illustration, the OCR in ChartThinker, , Paddle OCR, does not specialize in chart summarization, unlike other OCR models referenced in Table 2. This difference in training is why OCR+ChartThinker underperforms in terms of the CS indicator, as also observed in the literature Liu et al. (2023b).
4.4.2. Limitations of Content Similarity (CS) as a Single Metric.
In Table 2, ChartThinker performs lower on the Content Similarity (CS) metric compared to certain OCR models. But evaluating generative models on the sole basis of CS is limiting, as CS only measures similarity to a standard summary and may not reflect the accuracy of model-generated content. For instance, ChartThinker might generate detailed and accurate summaries, but if the content extends beyond the standard answer, the CS score might suggest an inferior performance. An example detailed below underscores this issue (Table 6): despite ChartThinker producing a detailed and accurate summary, its CS score (32.29%) is lower than OCR-T5’s (38.74%), which is less descriptive.
| Gold Summary: The global temperature records over the past 100 years depict a temperature rise process from 14.5 °C in 1920 to 16.2 °C in 2020, with temperatures sharply rising by 1.2 °C between 1980 and 2020. 1998 and 2016 are the two hottest years on record. |
|---|
| Summary by ChartThinker:This line chart provides a detailed display of the changes in global temperature over the past 100 years. The data shows that the average temperature increased from 14.5 °C in 1920 to 16.2 °C in 2020, showing a significant upward trend overall. Especially between 1980 and 2020, temperatures rose by nearly 1.2 °C, reflecting the acceleration of global warming. In addition, the chart also specifically indicates the two extremely high-temperature years of 1998 and 2016. |
| Summary by OCR-T5:This chart shows the global temperature changes over the past 100 years. The average temperature has risen from 14.5 °C in 1920 to 16.2 °C in 2020, showing an overall upward trend. At the same time, the increase of 1.2 °C from 1980 to 2020 indicates that global warming is intensifying. |
5. Conclusion
We introduce Chart-Sum-QA, a comprehensive dataset tailored for chart summarization, and ChartThinker, a new method capable of training visual-language models with enhanced utilization of contextual information. ChartThinker integrates the chain of thought with context retrieval to enrich the summaries with rigorous logic. Both automated and human evaluations were conducted, demonstrating the superiority of our approach in chart summarization tasks over 8 SOTA methods and 7 evaluation metrics. Further, through extensive ablations, we elucidate the effectiveness of each component and the helpfulness of our dataset. Our findings underscore the key role of CoT in reasoning and the criticality of context retrieval for semantic understanding. We hope our released dataset, codes, and empirical results can shed light on more LLMs-based chart-summarition studies.
6. Bibliographical References
- Alayrac et al. (2022) Jean-Baptiste Alayrac, Jeff Donahue, Pauline Luc, Antoine Miech, Iain Barr, Yana Hasson, Karel Lenc, Arthur Mensch, Katherine Millican, Malcolm Reynolds, et al. 2022. Flamingo: a visual language model for few-shot learning. Advances in Neural Information Processing Systems, 35:23716–23736.
- Awadalla et al. (2023) Anas Awadalla, Irena Gao, Josh Gardner, Jack Hessel, Yusuf Hanafy, Wanrong Zhu, Kalyani Marathe, Yonatan Bitton, Samir Gadre, Shiori Sagawa, et al. 2023. Openflamingo: An open-source framework for training large autoregressive vision-language models. arXiv preprint arXiv:2308.01390.
- Bertolini et al. (2022) Lorenzo Bertolini, Julie Weeds, and David Weir. 2022. Testing large language models on compositionality and inference with phrase-level adjective-noun entailment. In Proceedings of the 29th International Conference on Computational Linguistics, pages 4084–4100.
- Besta et al. (2023) Maciej Besta, Nils Blach, Ales Kubicek, Robert Gerstenberger, Lukas Gianinazzi, Joanna Gajda, Tomasz Lehmann, Michal Podstawski, Hubert Niewiadomski, Piotr Nyczyk, et al. 2023. Graph of thoughts: Solving elaborate problems with large language models. arXiv preprint arXiv:2308.09687.
- Brown et al. (2020) Tom Brown, Benjamin Mann, Nick Ryder, Melanie Subbiah, Jared D Kaplan, Prafulla Dhariwal, Arvind Neelakantan, Pranav Shyam, Girish Sastry, Amanda Askell, et al. 2020. Language models are few-shot learners. NeurIPS, 33:1877–1901.
- Chen et al. (2023) Daoyuan Chen, Yilun Huang, Zhijian Ma, Hesen Chen, Xuchen Pan, Ce Ge, Dawei Gao, Yuexiang Xie, Zhaoyang Liu, Jinyang Gao, et al. 2023. Data-juicer: A one-stop data processing system for large language models. arXiv preprint arXiv:2309.02033.
- Chen et al. (2020) Wenhu Chen, Jianshu Chen, Yu Su, Zhiyu Chen, and William Yang Wang. 2020. Logical natural language generation from open-domain tables. In ACL, pages 7929–7942.
- Chen et al. (2022) Wenhu Chen, Xueguang Ma, Xinyi Wang, and William W Cohen. 2022. Program of thoughts prompting: Disentangling computation from reasoning for numerical reasoning tasks. arXiv preprint arXiv:2211.12588.
- Chiang et al. (2023) Wei-Lin Chiang, Zhuohan Li, Zi Lin, Ying Sheng, Zhanghao Wu, Hao Zhang, Lianmin Zheng, Siyuan Zhuang, Yonghao Zhuang, Joseph E Gonzalez, et al. 2023. Vicuna: An open-source chatbot impressing gpt-4 with 90%* chatgpt quality. See https://vicuna. lmsys. org (accessed 14 April 2023).
- Du et al. (2022) Yifan Du, Zikang Liu, Junyi Li, and Wayne Xin Zhao. 2022. A survey of vision-language pre-trained models. In Proceedings of the Thirty-First International Joint Conference on Artificial Intelligence, IJCAI-22, pages 5436–5443.
- Ferres et al. (2007) Leo Ferres, Petro Verkhogliad, Gitte Lindgaard, Louis Boucher, Antoine Chretien, and Martin Lachance. 2007. Improving accessibility to statistical graphs: the igraph-lite system. In Proceedings of the 9th International ACM SIGACCESS Conference on Computers and Accessibility, pages 67–74.
- Gao et al. (2023) Peng Gao, Jiaming Han, Renrui Zhang, Ziyi Lin, Shijie Geng, Aojun Zhou, Wei Zhang, Pan Lu, Conghui He, Xiangyu Yue, et al. 2023. Llama-adapter v2: Parameter-efficient visual instruction model. arXiv preprint arXiv:2304.15010.
- Hochreiter and Schmidhuber (1997) Sepp Hochreiter and Jürgen Schmidhuber. 1997. Long short-term memory. Neural computation, 9(8):1735–1780.
- Hu et al. (2021) Edward J Hu, Phillip Wallis, Zeyuan Allen-Zhu, Yuanzhi Li, Shean Wang, Lu Wang, Weizhu Chen, et al. 2021. Lora: Low-rank adaptation of large language models. In International Conference on Learning Representations.
- Huggingface (2023) Huggingface. 2023. Introducing idefics: An open reproduction of state-of-the-art visual language model.
- Jiang et al. (2022) Zhengbao Jiang, Jun Araki, Haibo Ding, and Graham Neubig. 2022. Understanding and improving zero-shot multi-hop reasoning in generative question answering. In Proceedings of the 29th International Conference on Computational Linguistics, pages 1765–1775.
- Jiao et al. (2024) Qirui Jiao, Daoyuan Chen, Yilun Huang, Yaliang Li, and Ying Shen. 2024. Enhancing multimodal large language models with vision detection models: An empirical study. arXiv preprint arXiv:2401.17981.
- Kafle et al. (2018) Kushal Kafle, Brian Price, Scott Cohen, and Christopher Kanan. 2018. Dvqa: Understanding data visualizations via question answering. In Proceedings of the IEEE conference on computer vision and pattern recognition, pages 5648–5656.
- Kahou et al. (2017) Samira Ebrahimi Kahou, Vincent Michalski, Adam Atkinson, Ákos Kádár, Adam Trischler, and Yoshua Bengio. 2017. Figureqa: An annotated figure dataset for visual reasoning. arXiv preprint arXiv:1710.07300.
- Kantharaj et al. (2022) Shankar Kantharaj, Rixie Tiffany Leong, Xiang Lin, Ahmed Masry, Megh Thakkar, Enamul Hoque, and Shafiq Joty. 2022. Chart-to-text: A large-scale benchmark for chart summarization. In ACL, pages 4005–4023.
- Kenton and Toutanova (2019) Jacob Devlin Ming-Wei Chang Kenton and Lee Kristina Toutanova. 2019. Bert: Pre-training of deep bidirectional transformers for language understanding. In Proceedings of NAACL-HLT, pages 4171–4186.
- Lee et al. (2023) Kenton Lee, Mandar Joshi, Iulia Raluca Turc, Hexiang Hu, Fangyu Liu, Julian Martin Eisenschlos, Urvashi Khandelwal, Peter Shaw, Ming-Wei Chang, and Kristina Toutanova. 2023. Pix2struct: Screenshot parsing as pretraining for visual language understanding. In ICML, pages 18893–18912. PMLR.
- Lewis et al. (2020) Mike Lewis, Yinhan Liu, Naman Goyal, Marjan Ghazvininejad, Abdelrahman Mohamed, Omer Levy, Veselin Stoyanov, and Luke Zettlemoyer. 2020. Bart: Denoising sequence-to-sequence pre-training for natural language generation, translation, and comprehension. In ACL, pages 7871–7880.
- Li et al. (2023a) Bo Li, Yuanhan Zhang, Liangyu Chen, Jinghao Wang, Jingkang Yang, and Ziwei Liu. 2023a. Otter: A multi-modal model with in-context instruction tuning. arXiv preprint arXiv:2305.03726.
- Li et al. (2023b) Junnan Li, Dongxu Li, Silvio Savarese, and Steven Hoi. 2023b. Blip-2: Bootstrapping language-image pre-training with frozen image encoders and large language models. arXiv preprint arXiv:2301.12597.
- Liu et al. (2022a) Fangyu Liu, Julian Martin Eisenschlos, Francesco Piccinno, Syrine Krichene, Chenxi Pang, Kenton Lee, Mandar Joshi, Wenhu Chen, Nigel Collier, and Yasemin Altun. 2022a. Deplot: One-shot visual language reasoning by plot-to-table translation. arXiv preprint arXiv:2212.10505.
- Liu et al. (2022b) Fangyu Liu, Francesco Piccinno, Syrine Krichene, Chenxi Pang, Kenton Lee, Mandar Joshi, Yasemin Altun, Nigel Collier, and Julian Martin Eisenschlos. 2022b. Matcha: Enhancing visual language pretraining with math reasoning and chart derendering. arXiv preprint arXiv:2212.09662.
- Liu et al. (2023a) Haotian Liu, Chunyuan Li, Qingyang Wu, and Yong Jae Lee. 2023a. Visual instruction tuning. arXiv preprint arXiv:2304.08485.
- Liu et al. (2018) Tianyu Liu, Kexiang Wang, Lei Sha, Baobao Chang, and Zhifang Sui. 2018. Table-to-text generation by structure-aware seq2seq learning. In Proceedings of the AAAI conference on artificial intelligence, volume 32(1).
- Liu et al. (2023b) Yuliang Liu, Zhang Li, Hongliang Li, Wenwen Yu, Mingxin Huang, Dezhi Peng, Mingyu Liu, Mingrui Chen, Chunyuan Li, Lianwen Jin, et al. 2023b. On the hidden mystery of ocr in large multimodal models. arXiv preprint arXiv:2305.07895.
- Lovon et al. (2022) Jesus Lovon, José G Moreno, Romaric Besançon, Olivier Ferret, and Lynda Tamine. 2022. Can we guide a multi-hop reasoning language model to incrementally learn at each single-hop? In 29th International Conference on Computational Linguistics (COLING 2022), pages 1455–1466.
- Lu et al. (2022) Pan Lu, Swaroop Mishra, Tony Xia, Liang Qiu, Kai-Wei Chang, Song-Chun Zhu, Oyvind Tafjord, Peter Clark, and Ashwin Kalyan. 2022. Learn to explain: Multimodal reasoning via thought chains for science question answering. In Advances in Neural Information Processing Systems.
- Mahinpei et al. (2022) Anita Mahinpei, Zona Kostic, and Chris Tanner. 2022. Linecap: Line charts for data visualization captioning models. In 2022 IEEE Visualization and Visual Analytics (VIS), pages 35–39. IEEE.
- Masry et al. (2023) Ahmed Masry, Parsa Kavehzadeh, Xuan Long Do, Enamul Hoque, and Shafiq Joty. 2023. Unichart: A universal vision-language pretrained model for chart comprehension and reasoning. arXiv preprint arXiv:2305.14761.
- Methani et al. (2020) Nitesh Methani, Pritha Ganguly, Mitesh M Khapra, and Pratyush Kumar. 2020. Plotqa: Reasoning over scientific plots. In Proceedings of the IEEE/CVF Winter Conference on Applications of Computer Vision, pages 1527–1536.
- Ning et al. (2023) Xuefei Ning, Zinan Lin, Zixuan Zhou, Huazhong Yang, and Yu Wang. 2023. Skeleton-of-thought: Large language models can do parallel decoding. arXiv preprint arXiv:2307.15337.
- Obeid and Hoque (2020) Jason Obeid and Enamul Hoque. 2020. Chart-to-text: Generating natural language descriptions for charts by adapting the transformer model. In Proceedings of the 13th International Conference on Natural Language Generation, pages 138–147.
- OpenAI (2023) R OpenAI. 2023. Gpt-4 technical report (arxiv: 2303.08774).
- Post (2018) Matt Post. 2018. A call for clarity in reporting bleu scores. In Proceedings of the Third Conference on Machine Translation: Research Papers, page 186.
- Radford et al. (2021) Alec Radford, Jong Wook Kim, Chris Hallacy, Aditya Ramesh, Gabriel Goh, Sandhini Agarwal, Girish Sastry, Amanda Askell, Pamela Mishkin, Jack Clark, et al. 2021. Learning transferable visual models from natural language supervision. In International conference on machine learning, pages 8748–8763. PMLR.
- Radford et al. (2019) Alec Radford, Jeffrey Wu, Rewon Child, David Luan, Dario Amodei, Ilya Sutskever, et al. 2019. Language models are unsupervised multitask learners. OpenAI blog, 1(8):9.
- Raffel et al. (2020) Colin Raffel, Noam Shazeer, Adam Roberts, Katherine Lee, Sharan Narang, Michael Matena, Yanqi Zhou, Wei Li, and Peter J Liu. 2020. Exploring the limits of transfer learning with a unified text-to-text transformer. The Journal of Machine Learning Research, 21(1):5485–5551.
- Reiter (2007) Ehud Reiter. 2007. An architecture for data-to-text systems. In proceedings of the eleventh European workshop on natural language generation (ENLG 07), pages 97–104.
- Sel et al. (2023) Bilgehan Sel, Ahmad Al-Tawaha, Vanshaj Khattar, Lu Wang, Ruoxi Jia, and Ming Jin. 2023. Algorithm of thoughts: Enhancing exploration of ideas in large language models. arXiv preprint arXiv:2308.10379.
- Sellam et al. (2020) Thibault Sellam, Dipanjan Das, and Ankur Parikh. 2020. Bleurt: Learning robust metrics for text generation. In ACL, pages 7881–7892.
- Singh and Shekhar (2020) Hrituraj Singh and Sumit Shekhar. 2020. Stl-cqa: Structure-based transformers with localization and encoding for chart question answering. In EMNLP, pages 3275–3284.
- Stokes et al. (2022) Chase Stokes, Vidya Setlur, Bridget Cogley, Arvind Satyanarayan, and Marti A Hearst. 2022. Striking a balance: reader takeaways and preferences when integrating text and charts. IEEE Transactions on Visualization and Computer Graphics, 29(1):1233–1243.
- Touvron et al. (2023) Hugo Touvron, Thibaut Lavril, Gautier Izacard, Xavier Martinet, Marie-Anne Lachaux, Timothée Lacroix, Baptiste Rozière, Naman Goyal, Eric Hambro, Faisal Azhar, et al. 2023. Llama: Open and efficient foundation language models. arXiv preprint arXiv:2302.13971.
- Vaswani et al. (2017) Ashish Vaswani, Noam Shazeer, Niki Parmar, Jakob Uszkoreit, Llion Jones, Aidan N Gomez, Łukasz Kaiser, and Illia Polosukhin. 2017. Attention is all you need. NeurIPS, 30.
- Vedantam et al. (2015) Ramakrishna Vedantam, C Lawrence Zitnick, and Devi Parikh. 2015. Cider: Consensus-based image description evaluation. In Proceedings of the IEEE conference on computer vision and pattern recognition, pages 4566–4575.
- Wang et al. (2022a) Siyuan Wang, Zhongyu Wei, Zhihao Fan, Qi Zhang, and Xuan-Jing Huang. 2022a. Locate then ask: Interpretable stepwise reasoning for multi-hop question answering. In Proceedings of the 29th International Conference on Computational Linguistics, pages 1655–1665.
- Wang et al. (2022b) Xuezhi Wang, Jason Wei, Dale Schuurmans, Quoc V Le, Ed H Chi, Sharan Narang, Aakanksha Chowdhery, and Denny Zhou. 2022b. Self-consistency improves chain of thought reasoning in language models. In The Eleventh International Conference on Learning Representations.
- Wei et al. (2022) Jason Wei, Xuezhi Wang, Dale Schuurmans, Maarten Bosma, Fei Xia, Ed Chi, Quoc V Le, Denny Zhou, et al. 2022. Chain-of-thought prompting elicits reasoning in large language models. Advances in Neural Information Processing Systems, 35:24824–24837.
- Wiseman et al. (2017) Sam Wiseman, Stuart M Shieber, and Alexander M Rush. 2017. Challenges in data-to-document generation. In Proceedings of the 2017 Conference on Empirical Methods in Natural Language Processing, pages 2253–2263.
- Yao et al. (2023) Shunyu Yao, Dian Yu, Jeffrey Zhao, Izhak Shafran, Thomas L Griffiths, Yuan Cao, and Karthik Narasimhan. 2023. Tree of thoughts: Deliberate problem solving with large language models. arXiv preprint arXiv:2305.10601.
- Ye et al. (2023) Qinghao Ye, Haiyang Xu, Guohai Xu, Jiabo Ye, Ming Yan, Yiyang Zhou, Junyang Wang, Anwen Hu, Pengcheng Shi, Yaya Shi, et al. 2023. mplug-owl: Modularization empowers large language models with multimodality. arXiv preprint arXiv:2304.14178.
- Zhang et al. (2023) Renrui Zhang, Jiaming Han, Aojun Zhou, Xiangfei Hu, Shilin Yan, Pan Lu, Hongsheng Li, Peng Gao, and Yu Qiao. 2023. Llama-adapter: Efficient fine-tuning of language models with zero-init attention. arXiv preprint arXiv:2303.16199.
- Zhu et al. (2023) Deyao Zhu, Jun Chen, Xiaoqian Shen, Xiang Li, and Mohamed Elhoseiny. 2023. Minigpt-4: Enhancing vision-language understanding with advanced large language models. arXiv preprint arXiv:2304.10592.
- Zhu et al. (2021) Jiawen Zhu, Jinye Ran, Roy Ka-Wei Lee, Zhi Li, and Kenny Choo. 2021. Autochart: A dataset for chart-to-text generation task. In Proceedings of the International Conference on Recent Advances in Natural Language Processing (RANLP 2021), pages 1636–1644.
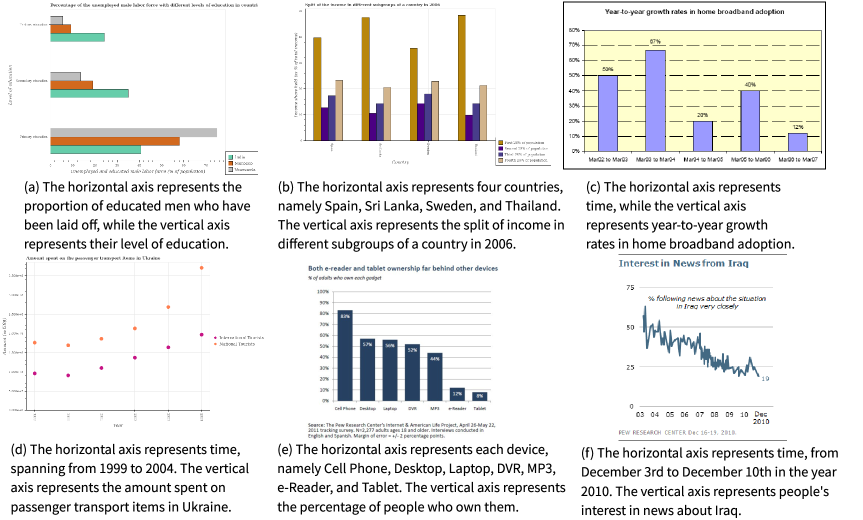
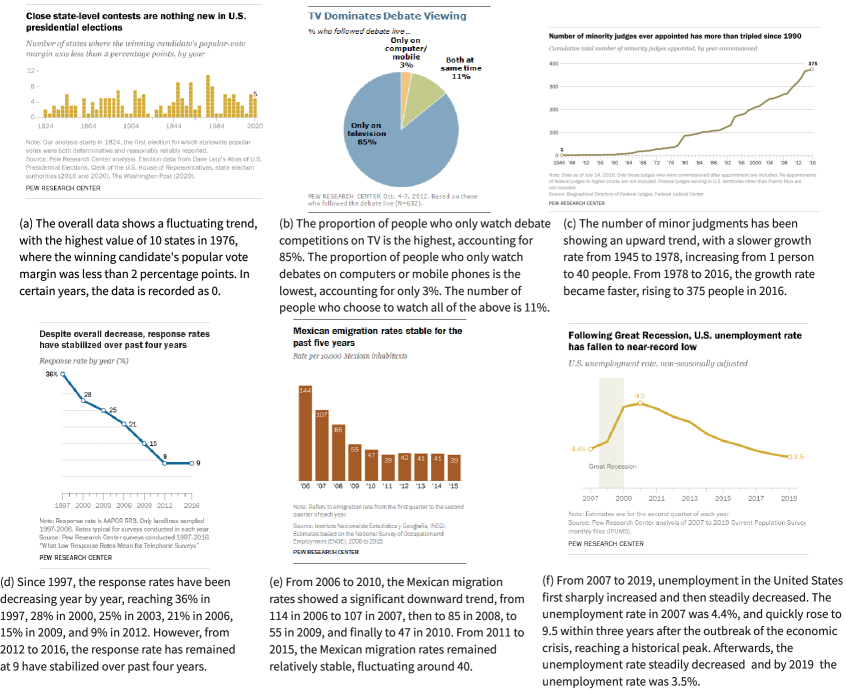
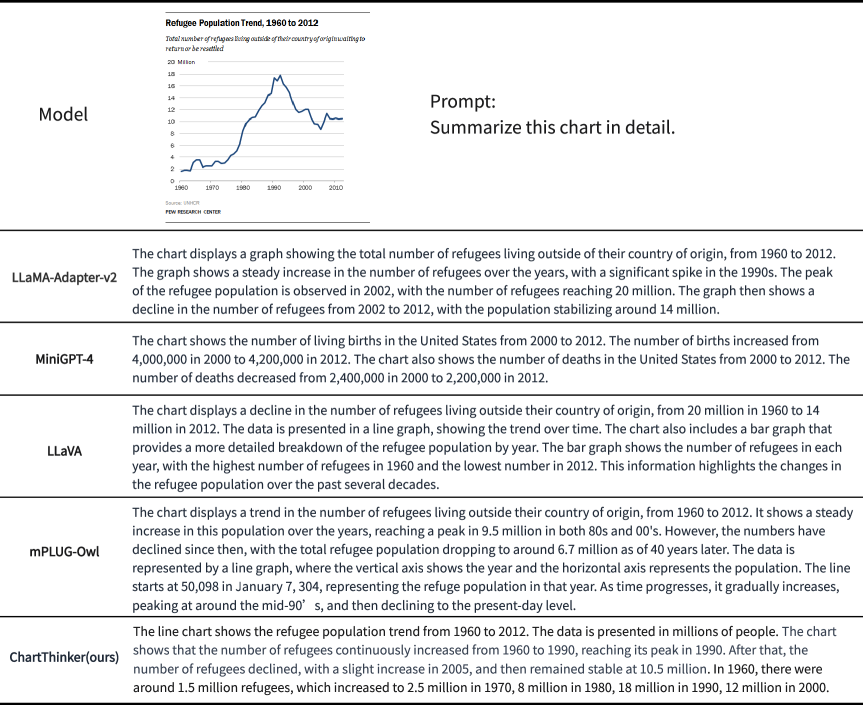
Appendix A Generated Summary Example
In the following sections, we provide a series of summaries generated by ChartThinker, as illustrated in Figures 5 through 10.
Appendix B Retrieval Library
Our constructed context retrieval library is divided into four stages of examples. The first stage focuses on chart types. By analyzing a given chart, the model identifies and learns its type, with some examples presented in Figure 15.
The second stage pertains to the overall caption of the chart, primarily derived from the chart’s title. In this stage, the model learns from the context examples in the retrieval library to output a chart overview summary, as illustrated in Figure 16.
The third stage elucidates the meanings of both the horizontal and vertical axes of the chart. The primary objective here is to significantly deepen the model’s understanding of the axes and the intricate relationships they share, as detailed in Figure 17.
The fourth stage centers on the trend of the chart data. The model learns to describe the chart’s trend in natural language and generates a numerical trend description, as shown in Figure 18.
To conclude, the context retrieval library comprises 1,000 charts, with each stage containing 250 charts and their associated textual descriptions. During training for each stage, the model searches within the 250 charts of the respective stage, selecting the top K most relevant charts as examples for context learning. Through this approach, the model becomes adept at describing charts in natural language, enhancing its chart comprehension and linguistic capabilities.
Appendix C Comparison of examples generated by various models
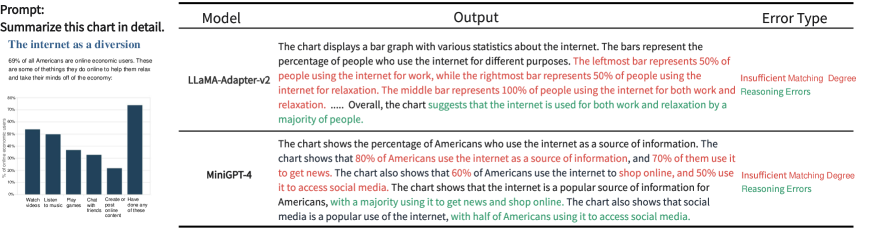
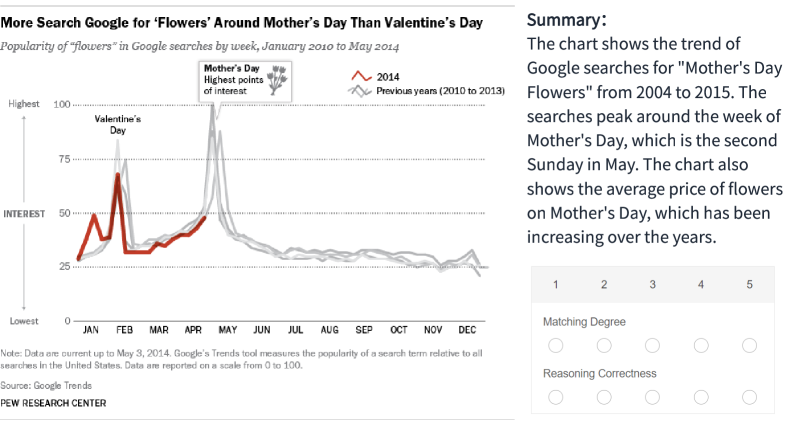
In order to gain a more comprehensive understanding of our model’s summaries, we undertake a meticulous manual assessment. The evaluation process involves evaluating a total of 200 summaries, including 40 summaries each from four baselines and our model. Figure 19 showcases example summaries generated by the five models. The primary objective is to ensure summaries accurately and meaningfully represent the charts’ essence and data.
To ensure an objective evaluation, we employ a set of annotators who are tasked with comparing each generated summary against its corresponding chart. The comparison is based on two pivotal criteria: (i) Matching Degree: This criterion gauges the degree to which the data presented in the generated summary is in harmony with the chart. (ii) Reasoning Correctness: Beyond just presenting data, it’s imperative that the summary can accurately infer and convey the intended message or viewpoint that the chart aims to communicate.
To uphold consistency and objectivity in the assessments, each summary is rated on a scale of 1 to 5, with 1 being the lowest and 5 being the highest. To further eliminate potential biases, the summaries are presented to the annotators in a random order. This strategy prevents evaluators from harboring preconceived notions or biases stemming from the presentation order. The complete evaluation procedure is illustrated in Figure 20. After the evaluation, each summary’s final score is determined by calculating the average of the scores given by three separate evaluators.
- (1)