Granular Change Accuracy: A More Accurate Performance Metric for Dialogue State Tracking
Abstract
Current metrics for evaluating Dialogue State Tracking (DST) systems exhibit three primary limitations. They: ) erroneously presume a uniform distribution of slots throughout the dialog, ) neglect to assign partial scores for individual turns, ) frequently overestimate or underestimate performance by repeatedly counting the models’ successful or failed predictions.
To address these shortcomings, we introduce a novel metric: Granular Change Accuracy (GCA). GCA focuses on evaluating the predicted changes in dialogue state over the entire dialogue history. Benchmarking reveals that GCA effectively reduces biases arising from distribution uniformity and the positioning of errors across turns, resulting in a more precise evaluation. Notably, we find that these biases are particularly pronounced when evaluating few-shot or zero-shot trained models, becoming even more evident as the model’s error rate increases. Hence, GCA offers significant promise, particularly for assessing models trained with limited resources. Our GCA implementation is a useful addition to the pool of DST metrics.
Keywords: Dialogue, Task-oriented Dialogue, Dialogue State Tracking, Evaluation, Performance Metric, Joint Goal Accuracy, Slot Accuracy, Granular Change Accuracy
Granular Change Accuracy: A More Accurate Performance Metric for Dialogue State Tracking
| Taha Aksu,, Nancy F. Chen |
| National University of Singapore (NUS), Singapore |
| Institute for Infocomm Research (), A*STAR, Singapore |
| *taksu@u.nus.edu |
Abstract content
1. Introduction
Dialogue State Tracking (DST) is the task of extracting user preferences from a Task-Oriented Dialogue (TOD) to accomplish a task such as booking a hotel room Henderson et al. (2014). The community has adopted a several different metrics to evaluate model performances on this task Ye et al. (2022); Feng et al. (2022); Zhu et al. (2022); Hung et al. (2022); however, these metrics employ some weaknesses that can result in an imbalanced assessment, such that strong systems receive poor scores and vice versa.
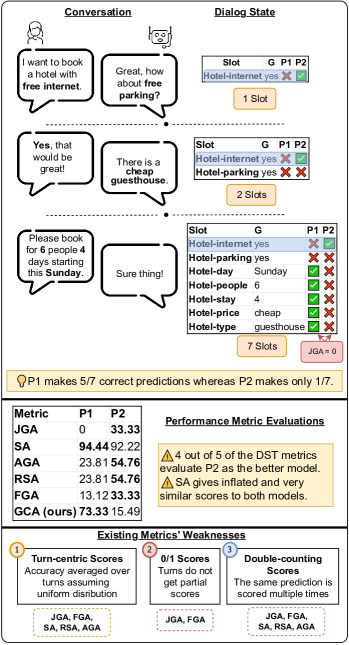
Figure 1 presents a sample TOD with two sets of DST predictions, and . predicts five of seven slots correctly whereas only predicts one correctly. However, the metrics of Joint Goal Accuracy (JGA; Henderson et al. 2014), Flexible Goal Accuracy (FGA; Dey et al. 2022), Relative Slot Accuracy (RSA; Kim et al. 2022 ) and Average Goal Accuracy (AGA; Rastogi et al. 2020a) evaluate the latter as the better prediction. Just as problematic, Slot Accuracy (SA; Wu et al. 2021) gives inflated and similar scores to both predictions. The bottom of the figure depicts the source of these miss-evaluations in the form of weaknesses that these metrics employ.
Firstly, their scores are turn-centric, i.e. they uniformly treat each turn, averaging their accuracies, even when certain turns involve more slots and are inherently more challenging to predict. Secondly, their turn evaluation is limited to 0/1 scoring lacking a mechanism to assign partial credit for turns that have only a subset of slots predicted correctly. Lastly, they double-count scores, i.e. they have a tendency to repeatedly penalize or reward the same predictions made in earlier turns.
Such shortcomings make the current metrics sensitive to two spurious characteristics of model predictions: (1) the timing of mistakes (whether early or late in the dialog) and (2) the spread of errors among turns. To address these, we present Granular Change Accuracy (GCA). GCA gauges the variance between predictions and the actual belief states each turn, prevents repeated counting of predictions, and ensures precise evaluation by averaging over state alterations rather than turns.
We evaluate GCA on the MultiWOZ 2.1 and SGD datasets Eric et al. (2020); Rastogi et al. (2020b) , conducting benchmarking experiments with popular baselines and show that GCA positions in the middle of the spectrum, more optimistic than JGA and FGA’s strict penalizing scheme, but not as inflated as SA and AGA.
Our contributions are four-fold:
-
•
Detailed Analysis of current metrics: We perform a thorough examination of existing metrics, depicting their inherent biases sourced from three weaknesses depicted above.
-
•
Granular Approach: We introduce Granular Change Accuracy (GCA)111The code is available at https://github.com/cuthalionn/Granular_Change_Accuracy, a new DST evaluation metric that focuses on capturing belief state changes rather than a simple turn-by-turn assessment, effectively addressing the weaknesses prevalent in traditional metrics.
-
•
Comprehensive Benchmarking: We evaluate GCA against other DST metrics on MultiWOZ 2.1 and SGD datasets, showcasing its superior balance in terms of evaluation accuracy. We further prove that GCA is significantly less correlated by the position of mistakes in the dialogue and by the distribution uniformity of mistakes compared to the most recent FGA metric.
-
•
Few-shot & Zero-shot Experiments: We shine a light on the heightened discrepancies between GCA and traditional metrics in low-resource settings, emphasizing the increased effect of the identified weaknesses when models are trained with less data.
2. Task Definition
DST involves extracting/generating slot values for specific slot labels in each domain (e.g., restaurant-food: Indian). A task-oriented dialogue is represented as triplets of system and user turn pairs, and the turn belief state denoted as
| (1) |
, where and are system and user utterances in the turn, and is the belief state. Each turn pair can have zero or more slot–value pairs, summarized as
| (2) |
, where represents an active slot–value pair (i.e. all pairs where the value is not “none”) and is the number of active slots in the current turn. The remaining inactive slots are assigned a “none” value. Previous turn predictions persist unless new values are predicted, including “none” values.
3. Related Work
The evaluation of Dialogue State Tracking (DST) systems has seen various metrics proposed over the years, aiming to capture the nuances and complexities of dialogs. Among these, two metrics stand out due to their widespread adoption and historical significance: Joint Goal Accuracy (JGA) and Slot Accuracy (SA).
Joint Goal Accuracy Henderson et al. (2014)
computes the ratio of turn–pair slots that are correctly predicted across all turn pairs. For a prediction to be deemed correct, all slot–value sets in a turn–pair must align between the predicted and the ground truth belief states. The metric is formulated as:
| (3) |
, where and represent the ground truth and predicted belief states, respectively. One shortcoming of JGA is its tendency to underestimate results by not affording partial credit to turns. This shortcoming can be observed for the example in Figure 1, JGA scores higher despite obviously performing better.
Slot Accuracy Wu et al. (2021)
quantifies accuracy across all pre-defined slot labels, incorporating even those slots with a "none" value. It is expressed as:
| (4) |
where and , are the number of missed predictions and wrong predictions (including slots that do not exist in the ground truth belief state) in turn , and is the total number of slots specified in the dataset (for instance for MultiWOZ 2.1 dataset). A key limitation of SA is its inclination to overestimate model performance, largely because it rewards models for correctly identifying inactive slots. For the dialogue in Figure 1 for instance slot accuracy scores for and are very close and inflated despite the large difference they show in actual performance.
Given the identified weaknesses in JGA and SA, subsequent research efforts have introduced alternative metrics such as Average Goal Accuracy, Relative Slot Accuracy, and Flexible Goal Accuracy to better capture DST performance nuances.
Average Goal Accuracy Rastogi et al. (2020a)
differs from earlier metrics because it evaluates only the performance of turns with active slots; i.e., if a turn does not have any ground truth values, it will be discarded during the evaluation. It calculates a recall value for all turns with non-empty ground truth belief states and returns the average. AGA takes an average over each turn, leading to the recurring inclusion of each turn’s mistakes or accurate predictions. AGA results for and at Figure 1 show that AGA also mistakenly chooses as the better performing model.
Relative Slot Accuracy Kim et al. (2022)
addresses the overestimation problem in SA by calculating the score over active slots in the turn.
| (5) |
, where if = 0, and , and are the number of unique slots in the predicted and ground truth turns, missed slots, and wrong predictions (including slots that do not exist in the gold belief state), respectively. Despite its advancement over SA, RSA still computes the average over each turn, resulting in the repeated counting of errors and accurate predictions for each turn. in Figure 1 gets a lower RSA score compared to . Thus it is evident that the RSA metric inherits similar weaknesses as AGA.
Flexible Goal Accuracy Dey et al. (2022)
adapts JGA by treating mistakes in the current turn as zero, while mimicking JGA’s behavior. Yet, if all current turn slot values are correctly predicted with a mistake
propagated from a previous turn, FGA applies a penalty that decreases over time with the decay ratio parameter . Although FGA softens the strict evaluation of JGA, it inherits a significant limitation; even a single error in the current turn results in the metric disregarding all other correct predictions. It is also evident from the FGA results in Figure 1, where again gets the higher score. Note that FGA’s more flexible definition can be observed in the increased performance of , however, it still evaluates to be the outperforming model out of the two.
The preceding discussion underscores the need for a fresh metric. Both RSA and AGA predominantly rely on turn-based averaging, leaving them susceptible to the nuances of dialogue dynamics. Meanwhile, FGA exhibits an elevated sensitivity to individual errors. GCA steps in to bridge this gap by comprehensively addressing dialogue dynamics without excessively penalizing or rewarding models.
4. Granular Change Accuracy
In developing GCA, our primary objective is to rectify the limitations outlined in the preceding section, as illustrated in Figure 1. Contrary to traditional metrics that emphasize turns, GCA focuses on slots, specifically evaluating them only when their value undergoes a modification in the latest turn. This design choice tackles the issues of 0/1 scores and double counting. Furthermore, by averaging over the total number of such modifications, GCA shifts away from turn-centric scores. The name "Granular Change Accuracy" encapsulates its essence: a metric dedicated to evaluating accuracy based on granular changes in the belief state. A notable strength of GCA is its resilience against biases introduced by the temporal location of an error, whether it occurs early or late, or within a turn characterized by many or few active slots.
A critical distinction in GCA’s design is its recognition of the two-step prediction required in DST, a nuance often overlooked in previous metrics. Instead of merely categorizing predictions as right or wrong, GCA acknowledges that DST models first determine if a slot is active within the dialogue context, and subsequently predict its value. Consequently, GCA computes state changes using four distinct counts, as illustrated in Figure 2 (c.f. Algorithm 1):
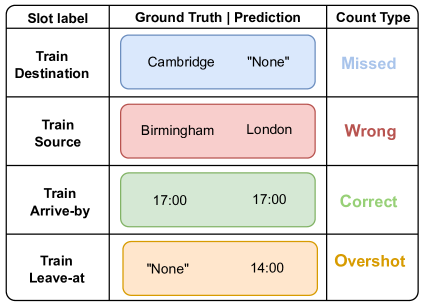
Missed predictions (): Number of slots valued in the ground truth Belief State (BS) but absent in the predicted BS. Wrong predictions (): Number of mismatched slot values present in both ground truth and predicted BS. Overshot predictions (): Number of slots valued in the predicted BS but absent in the ground truth BS. Correct predictions (): Number of matching slot-value pairs in both ground truth and predicted BS. While similar counts have been outlined by Smith (2014), they presented them discretely, without consolidating them into a singular evaluation metric, a gap GCA bridges.
Building on the dual-layer prediction challenge inherent to DST, our proposed metric goes beyond raw counts to offer a more granular evaluation. We translate the aforementioned counts into four intermediate metrics, each tailored to assess either the act of recognizing an active slot (the slot label) or predicting its exact value (the slot value):
Value Precision:
This metric evaluates the accuracy of value predictions for detected active slots. It’s formulated as: , where represents the total number of predictions.
Value Recall:
This metric evaluates how well the model recalls actual slot values from the dialogue context: , where is the total number of gold values.
Label Precision:
This metric captures the precision with which the model identifies a slot as active, irrespective of the value’s accuracy:
Label Recall:
Analogous to Label Precision, this measure gauges the model’s ability to recall active slots:
The combined counts pertain to instances where the slot detection was correct, even if the subsequent value prediction might not be accurate.
These intermediate products help dissect model performance at both levels of DST prediction, offering insights not captured by previous monolithic accuracy scores. Finally, we formulate GCA using a weighted harmonic mean of the four intermediate metrics as adopted in the F1 score for its efficacy in balancing precision and recall 222We use weighted harmonic mean to weigh value accuracies differently from label accuracies. Since value accuracy is an exact match whereas label accuracy is a partial match we believe the former should have a higher value. Thus, in our experiments, we set the weight of and to , whereas the weight of and to .:
| (6) |
For the two predictions and in Figure 1, GCA attributes significantly higher performance to the former reflecting the real performance they depict unlike all previous metrics.
5. Experiments and Analysis
To study how GCA’s design affects popular benchmarks and assess its effectiveness in addressing previous metrics’ under/overestimation tendencies, we conduct experiments with MultiWOZ 2.1 and SGD datasets, evaluating 6 DST models: TRADE Wu et al. (2021), SOM-DST Kim et al. (2020), Trippy Heck et al. (2020),T5 based model by Lin et al. (2021b), TransferQA Lin et al. (2021a) and FlanT5 Chung et al. (2022). For TRADE and SOM-DST we re-use the predictions reported in Dey et al. (2022).
5.1. Benchmarking Results
In this section, we present comprehensive benchmarking results over the listed datasets and models under varying training conditions. We categorize our results based on full-shot, zero-shot, and few-shot training scenarios.
5.1.1. Full-shot Results
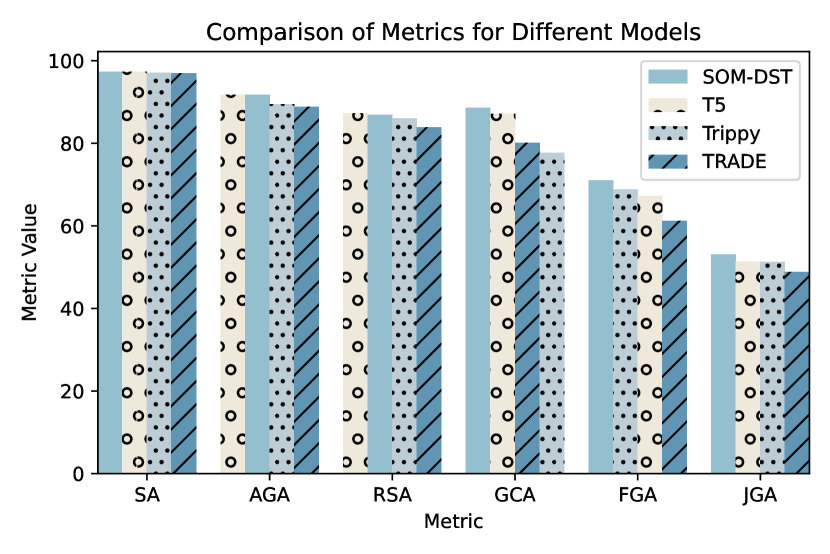
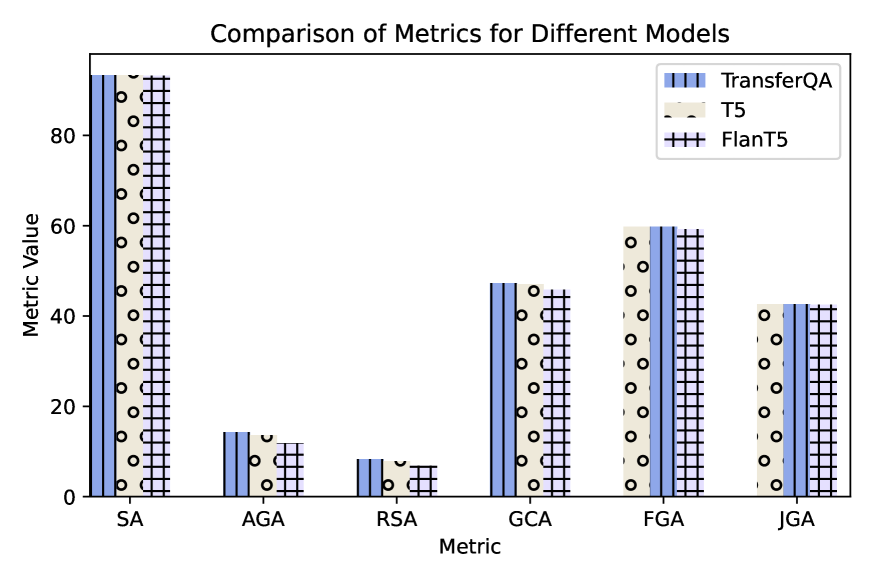
Figure 3(a) shows the full-shot results. We set for FGA following Dey et al. (2022). Notably, JGA and FGA tend to produce lower performance scores owing to their binary scoring approach. On the contrary, SA and AGA exhibit inflated scores, reflecting their tendency to overestimate. GCA and RSA scores are positioned between these two extremes. It’s noteworthy to point out the fluctuations in model rankings based on different metrics. For example, while GCA ranks SOM-DST as the top-performing model, RSA places T5 at the top. This emphasizes that the choice of evaluation metric can indeed lead to distinct model hierarchies.
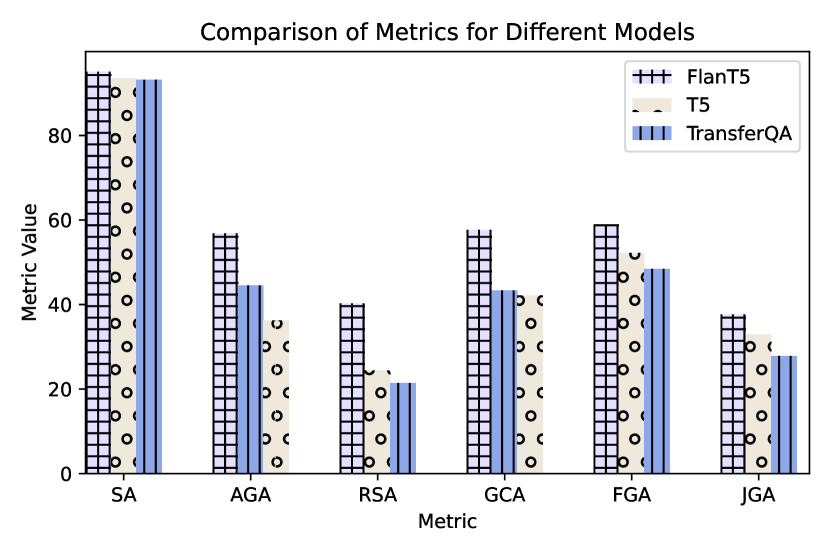
5.1.2. Zero-shot Results
Zero-shot results are shown in Figure 3(b) and Figure 3(c). One can observe that various weaknesses described in Figure 1 are at work in these results. Due to the cross-domain nature of MultiWOZ, most turns within zero-shot adaptation do not have any active slots. This leads to the issue of double-counting (early mistakes are multiply counted for most turns), which ultimately results in lower scores for JGA. FGA addresses this problem by decaying the mistakes; however, the turn-centric scoring it employs counts most empty turns as successful predictions of the model, which deceptively boosts the final score of a model. RSA has scores that float at the bottom as whenever a turn does not have any active slots it scores that turn as 0 which drags the average score of the dialogue down (turn-centric scoring). GCA takes the middle ground between these metrics since it counts each mistake once at the first encounter and calculates the performance by aggregating accuracy over the model’s actions rather than turns (c.f Section 5.4 for an extensive explanation on a running example).
5.1.3. Few-shot Results
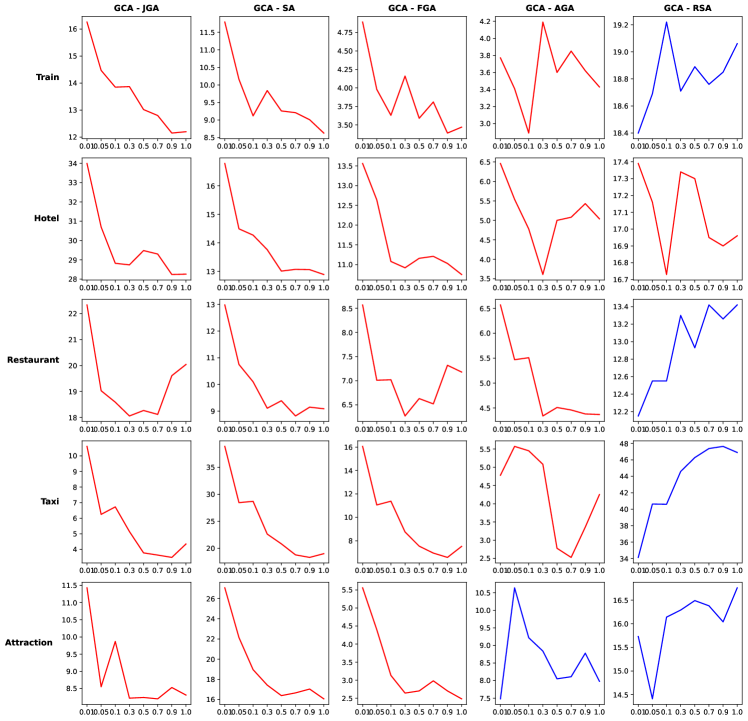
In an effort to further understand the disparities between zero and full-shot for GCA in comparison to other metrics, we incrementally increased the number of shots used during training. The results, for the MultiWOZ dataset with the T5 model, are displayed in Figure 5. A clear observation is that the disparity between GCA and other metrics intensifies as the number of shots diminishes, that is, as the model’s error rate climbs. From the figure, we derive the following observations:
Predominant Effect:
A significant majority of the metrics exhibit increased differences in comparison to GCA when models are trained with scarcer data. In the figure, this trend is depicted through color: red plots indicate a higher difference, while blue plots signify a lower difference. This reinforces the idea that for the majority of metrics, the identified weaknesses become more pronounced when evaluating models trained on limited data.
RSA’s Unique Behavior:
Contrary to other metrics, RSA showcases an inverse effect. Notably, it produces markedly lower scores in the zero-shot scenarios (as seen in 2-b and 2-c). This is largely due to its behavior of assigning a score of zero for turns without active slots—a frequent occurrence in zero-shot evaluations—subsequently dragging the overall dialogue score downward.
In essence, the variance in metrics underscores the need for nuanced evaluations, especially in few-shot scenarios, to garner insights into a model’s actual capabilities and limitations.
5.2. Fine-Grained Analysis
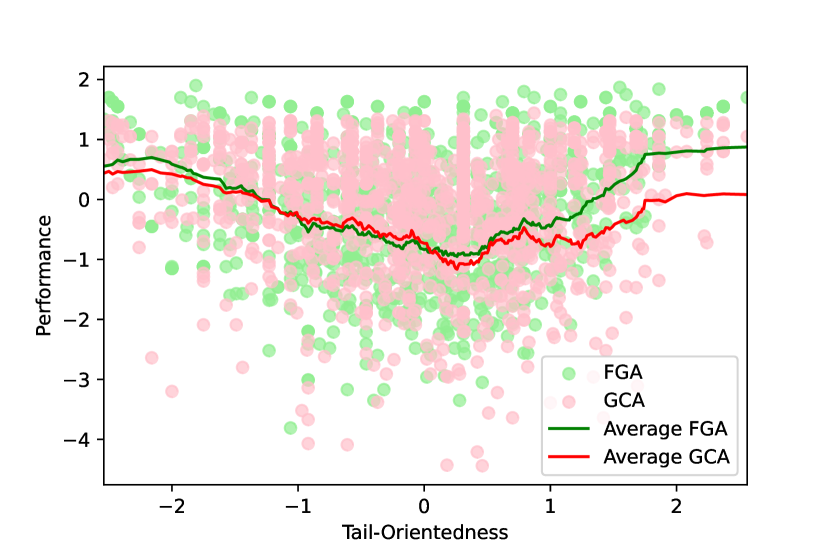
To analyze edge cases, we examined 20 predictions of TRADE and SOM-DST models where FGA and GCA show the largest disagreement. We chose FGA for detailed examination because of its one of the most recent metrics, contrasted to community standard JGA (Joint Goal Accuracy). We observe that FGA overestimates the performance when errors are accumulated in a few turns, i.e. the mistakes are not uniformly distributed. Especially if these accumulations occur in the later part of the dialog, i.e. when the mistakes show a tail-oriented distribution (c.f. samples in Section 5.3).
Tail-Oriented Mistake Distribution.
To examine the impact of tail-oriented mistakes on FGA and GCA evaluation, we introduce a new measure, :
| (7) |
| (8) |
, where is the total number of turns, is the turn index of mistake , and is the total number of mistakes. It calculates the average distance of each mistake’s turn from the middle turn of the dialog. Figure 4(a) illustrates the performance distribution based on . Despite GCA consistently yielding higher results for lower values of to , we observe that FGA shows similar or even higher scores at the right-hand side of the figure. This suggests that as dialog state mistakes become more tail-oriented, FGA tends to overestimate the performance.
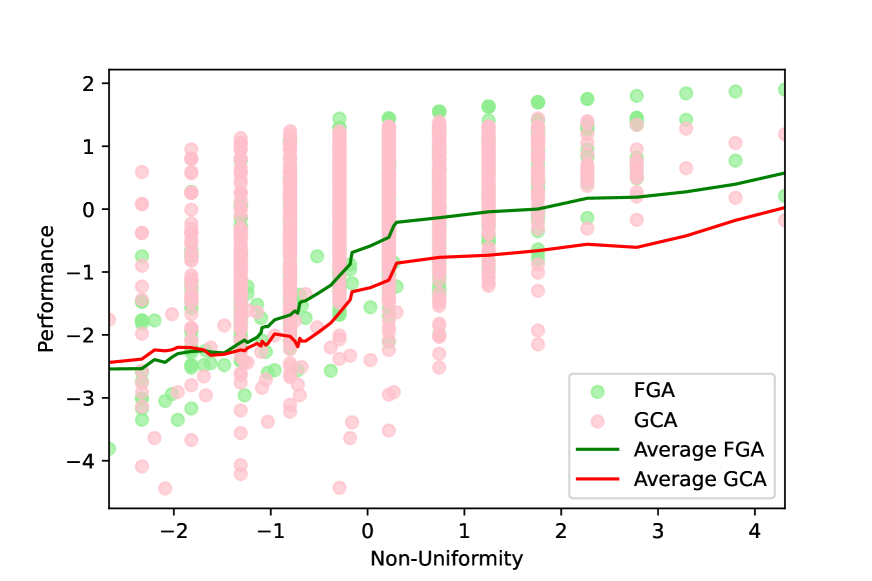
Non-Uniform Mistake Distribution.
In a similar manner we define a non-uniformity measure, NU,
| (9) |
| (10) |
, where is the number of mistaken predictions (missed, over-shot or wrong) in turn . is the expected number of mistakes per turn under a uniform distribution, and is the total number of turns. Figure 4(b) demonstrates the performance distribution by . The results are mean-normalized, causing the NU measure to have otherwise impossible negative values. For lower ) to , FGA generally exhibits lower values compared to GCA, however, one can observe it going higher as values increase — i.e. for . This suggests that FGA is adversely affected by the uniform spread of prediction errors.
Finally, we further calculate the Pearson Correlation Coefficients of both FGA and GCA with both spurious traits across dialogs. The correlations between and FGA/GCA are /, whereas between and FGA/GCA are / respectively. The differences between these correlations are significant according to Zou (2008)’s confidence interval tests. FGA’s correlation with both features is significantly stronger with a 95% confidence level. These results show that GCA is less susceptible to spurious features than FGA.
5.3. Sample GCA and FGA Scores
This section presents two sample dialogs from the MultiWOZ 2.1 dataset along with DST model predictions, and FGA/GCA evaluations.
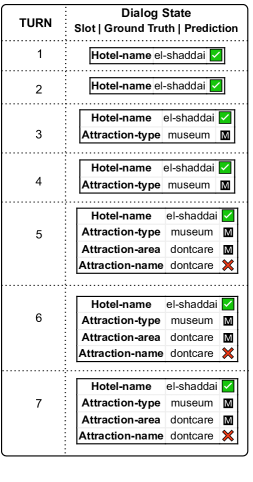
The dialogue in Figure 6 is an example where FGA overestimates the performance of a dialogue even though it only predicts one out of four slots correctly. This is because the majority of mistakes in the dialogue occur closer to the tail of the dialogue and correct prediction done at the first turn is counted multiple times — i.e. Double-counting score weakness.
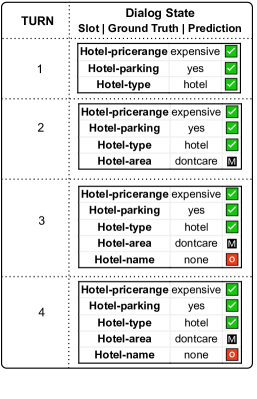
Figure 7 on the other hand presents an example where FGA underestimates the performance of a model even though it predicts three out of five slots correctly – significantly better compared to the performance in Figure 6. This is because, unlike the prior example, the dialog is shorter, leading to fewer repeated predictions by FGA.
5.4. Fine-grained Explanation of Zero-shot Results

In zero-shot evaluations, given their cross-domain nature focused on a single domain, most turns don’t contain active slots. This characteristic poses a challenge for existing metrics, leading to skewed evaluations. To elucidate, let’s delve into a hypothetical dialogue depicted in Figure 8. This dialogue has two active slots: one at the first turn and another at the last. Such scenarios aren’t uncommon in datasets like MultiWOZ, where, for instance, taxi domain dialogues primarily discuss hotel or restaurant bookings, leaving taxi booking for the final turns.
Now, let’s analyze two prediction scenarios for this dialogue, represented as and . In , the first slot is predicted correctly, but the final slot is amiss. Conversely, nails the final slot prediction but misses the initial one. With JGA, scores for and are and , respectively. Such an overestimation for arises because JGA rewards every empty turn, while is harshly penalized due to JGA’s all-or-nothing approach. RSA paints a similar picture, scoring for and for . FGA nuances it a bit with for and for . Though it aligns with JGA for , it is more generous for by positively scoring empty turns, explaining FGA’s inflation in zero-shot contexts. Contrarily, GCA offers a balanced perspective with for both, as it gauges changes in dialogue state uniformly, penalizing and rewarding predictions only once.
6. Conclusion
In this work, we have delved deep into the inherent weaknesses of prevalent DST evaluation metrics. Specifically, we spotlighted their propensity to over or underestimate model performance, the pitfalls of 0/1 scoring, the turn-centric nature of their scoring systems, and the double-counting of errors. Addressing these shortcomings, we introduce GCA, a novel metric that prioritizes accuracy based on belief state changes, offering a more nuanced evaluation approach than simple turn-by-turn assessments. Through rigorous analyses, we demonstrate that GCA provides a more balanced and representative evaluation, effectively sidestepping the pitfalls within other metrics. Additionally, GCA showcases a notably diminished correlation with certain dialog traits that shouldn’t influence metric performance, such as the non-uniform distribution or tail-skewness of mistakes. Most crucially, our results emphasize GCA’s robustness in evaluations of models trained under data constraints. In the complex landscapes of few-shot and zero-shot learning, where standard measurements become unstable due to increased model errors, GCA stands out as a reliable benchmark for precise assessment. We are convinced that the DST community will see long-term benefits from integrating GCA into their array of metrics for model benchmarking.
7. Limitations
We list two main limitations of our work as follows:
) We do not address partial credits at the slot level. Though GCA is more exhaustive than existing metrics, there is still room for improvement by partial credit of slot values; i.e. by calculating the similarity of ground-truth and predicted values.
) We do not report results with larger models. We have not conducted experiments with larger models. It would be interesting to see whether these results are consistent among different sizes of models.
8. Acknowledgements
This research was supported by the SINGA scholarship from A*STAR. We wish to express our profound gratitude to Prof. Min-Yen Kan from the National University of Singapore, School of Computing, for his invaluable contributions. This work would not have been possible without his support at both the ideation and writing stages. We would also like to thank anonymous reviewers for their insightful feedback on how to improve the paper.
9. Bibliographical References
- Chung et al. (2022) Hyung Won Chung, Le Hou, S. Longpre, Barret Zoph, Yi Tay, William Fedus, Eric Li, Xuezhi Wang, Mostafa Dehghani, Siddhartha Brahma, Albert Webson, Shixiang Shane Gu, Zhuyun Dai, Mirac Suzgun, Xinyun Chen, Aakanksha Chowdhery, Dasha Valter, Sharan Narang, Gaurav Mishra, Adams Wei Yu, Vincent Zhao, Yanping Huang, Andrew M. Dai, Hongkun Yu, Slav Petrov, Ed Huai hsin Chi, Jeff Dean, Jacob Devlin, Adam Roberts, Denny Zhou, Quoc V. Le, and Jason Wei. 2022. Scaling instruction-finetuned language models. ArXiv, abs/2210.11416.
- Dey et al. (2022) Suvodip Dey, Ramamohan Kummara, and Maunendra Desarkar. 2022. Towards fair evaluation of dialogue state tracking by flexible incorporation of turn-level performances. In Proceedings of the 60th Annual Meeting of the Association for Computational Linguistics (Volume 2: Short Papers), pages 318–324, Dublin, Ireland. Association for Computational Linguistics.
- Eric et al. (2020) Mihail Eric, Rahul Goel, Shachi Paul, Abhishek Sethi, Sanchit Agarwal, Shuyang Gao, Adarsh Kumar, Anuj Goyal, Peter Ku, and Dilek Hakkani-Tur. 2020. MultiWOZ 2.1: A consolidated multi-domain dialogue dataset with state corrections and state tracking baselines. In Proceedings of the Twelfth Language Resources and Evaluation Conference, pages 422–428, Marseille, France. European Language Resources Association.
- Feng et al. (2022) Yue Feng, Aldo Lipani, Fanghua Ye, Qiang Zhang, and Emine Yilmaz. 2022. Dynamic schema graph fusion network for multi-domain dialogue state tracking. In Proceedings of the 60th Annual Meeting of the Association for Computational Linguistics (Volume 1: Long Papers), pages 115–126, Dublin, Ireland. Association for Computational Linguistics.
- Heck et al. (2020) Michael Heck, Carel van Niekerk, Nurul Lubis, Christian Geishauser, Hsien-Chin Lin, Marco Moresi, and Milica Gasic. 2020. TripPy: A triple copy strategy for value independent neural dialog state tracking. In Proceedings of the 21th Annual Meeting of the Special Interest Group on Discourse and Dialogue, pages 35–44, 1st virtual meeting. Association for Computational Linguistics.
- Henderson et al. (2014) Matthew Henderson, Blaise Thomson, and Jason D. Williams. 2014. The second dialog state tracking challenge. In Proceedings of the 15th Annual Meeting of the Special Interest Group on Discourse and Dialogue (SIGDIAL), pages 263–272, Philadelphia, PA, U.S.A. Association for Computational Linguistics.
- Hung et al. (2022) Chia-Chien Hung, Anne Lauscher, Simone Ponzetto, and Goran Glavaš. 2022. DS-TOD: Efficient domain specialization for task-oriented dialog. In Findings of the Association for Computational Linguistics: ACL 2022, pages 891–904, Dublin, Ireland. Association for Computational Linguistics.
- Kim et al. (2020) Sungdong Kim, Sohee Yang, Gyuwan Kim, and Sang-Woo Lee. 2020. Efficient dialogue state tracking by selectively overwriting memory. In Proceedings of the 58th Annual Meeting of the Association for Computational Linguistics, pages 567–582, Online. Association for Computational Linguistics.
- Kim et al. (2022) Takyoung Kim, Hoonsang Yoon, Yukyung Lee, Pilsung Kang, and Misuk Kim. 2022. Mismatch between multi-turn dialogue and its evaluation metric in dialogue state tracking. In Proceedings of the 60th Annual Meeting of the Association for Computational Linguistics (Volume 2: Short Papers), pages 297–309, Dublin, Ireland. Association for Computational Linguistics.
- Lin et al. (2021a) Zhaojiang Lin, Bing Liu, Andrea Madotto, Seungwhan Moon, Zhenpeng Zhou, Paul Crook, Zhiguang Wang, Zhou Yu, Eunjoon Cho, Rajen Subba, and Pascale Fung. 2021a. Zero-shot dialogue state tracking via cross-task transfer. In Proceedings of the 2021 Conference on Empirical Methods in Natural Language Processing, pages 7890–7900, Online and Punta Cana, Dominican Republic. Association for Computational Linguistics.
- Lin et al. (2021b) Zhaojiang Lin, Bing Liu, Seungwhan Moon, Paul Crook, Zhenpeng Zhou, Zhiguang Wang, Zhou Yu, Andrea Madotto, Eunjoon Cho, and Rajen Subba. 2021b. Leveraging slot descriptions for zero-shot cross-domain dialogue StateTracking. In Proceedings of the 2021 Conference of the North American Chapter of the Association for Computational Linguistics: Human Language Technologies, pages 5640–5648, Online. Association for Computational Linguistics.
- Rastogi et al. (2020a) Abhinav Rastogi, Xiaoxue Zang, Srinivas Sunkara, Raghav Gupta, and Pranav Khaitan. 2020a. Towards scalable multi-domain conversational agents: The schema-guided dialogue dataset. Proceedings of the AAAI Conference on Artificial Intelligence, 34:8689–8696.
- Rastogi et al. (2020b) Abhinav Rastogi, Xiaoxue Zang, Srinivas Sunkara, Raghav Gupta, and Pranav Khaitan. 2020b. Towards scalable multi-domain conversational agents: The schema-guided dialogue dataset. In Proceedings of the AAAI Conference on Artificial Intelligence, volume 34, pages 8689–8696.
- Smith (2014) Ronnie Smith. 2014. Comparative error analysis of dialog state tracking. In Proceedings of the 15th Annual Meeting of the Special Interest Group on Discourse and Dialogue (SIGDIAL), pages 300–309, Philadelphia, PA, U.S.A. Association for Computational Linguistics.
- Wu et al. (2021) Chen Henry Wu, Yinhe Zheng, Xiaoxi Mao, and Minlie Huang. 2021. Transferable persona-grounded dialogues via grounded minimal edits. In Proceedings of the 2021 Conference on Empirical Methods in Natural Language Processing, pages 2368–2382, Online and Punta Cana, Dominican Republic. Association for Computational Linguistics.
- Ye et al. (2022) Fanghua Ye, Yue Feng, and Emine Yilmaz. 2022. ASSIST: Towards label noise-robust dialogue state tracking. In Findings of the Association for Computational Linguistics: ACL 2022, pages 2719–2731, Dublin, Ireland. Association for Computational Linguistics.
- Zhu et al. (2022) Qi Zhu, Bing Li, Fei Mi, Xiaoyan Zhu, and Minlie Huang. 2022. Continual prompt tuning for dialog state tracking. In Proceedings of the 60th Annual Meeting of the Association for Computational Linguistics (Volume 1: Long Papers), pages 1124–1137, Dublin, Ireland. Association for Computational Linguistics.
- Zou (2008) Guang Zou. 2008. Toward using confidence intervals to compare correlations. Psychological methods, 12:399–413.