Unifying Feature and Cost Aggregation with Transformers for Semantic and Visual Correspondence
Abstract
This paper introduces a Transformer-based integrative feature and cost aggregation network designed for dense matching tasks. In the context of dense matching, many works benefit from one of two forms of aggregation: feature aggregation, which pertains to the alignment of similar features, or cost aggregation, a procedure aimed at instilling coherence in the flow estimates across neighboring pixels. In this work, we first show that feature aggregation and cost aggregation exhibit distinct characteristics and reveal the potential for substantial benefits stemming from the judicious use of both aggregation processes. We then introduce a simple yet effective architecture that harnesses self- and cross-attention mechanisms to show that our approach unifies feature aggregation and cost aggregation and effectively harnesses the strengths of both techniques. Within the proposed attention layers, the features and cost volume both complement each other, and the attention layers are interleaved through a coarse-to-fine design to further promote accurate correspondence estimation. Finally at inference, our network produces multi-scale predictions, computes their confidence scores, and selects the most confident flow for final prediction. Our framework is evaluated on standard benchmarks for semantic matching, and also applied to geometric matching, where we show that our approach achieves significant improvements compared to existing methods.
1 Introduction
Finding visual correspondences between images is a central problem in computer vision, with numerous applications including simultaneous localization and mapping (SLAM) (Bailey & Durrant-Whyte, 2006), augmented reality (AR) (Peebles et al., 2021), and structure from motion (SfM) (Schonberger & Frahm, 2016). Given visually or semantically similar images, sparse correspondence approaches (Lowe, 2004) first detect a set of sparse points and extract corresponding descriptors to find matches across them. In contrast, dense correspondence (Philbin et al., 2007) aims at finding matches for all pixels. Dense correspondence approaches typically follow the classical matching pipeline of feature extraction and aggregation, cost aggregation, and flow estimation (Scharstein & Szeliski, 2002; Philbin et al., 2007).
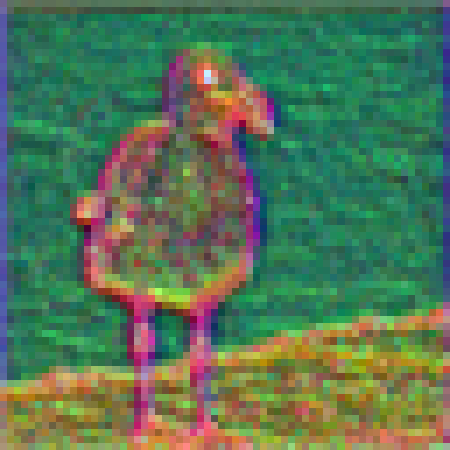
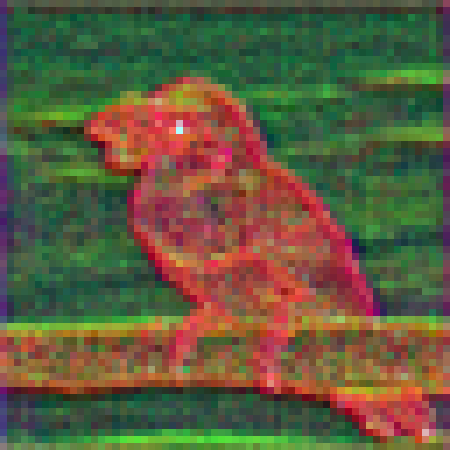
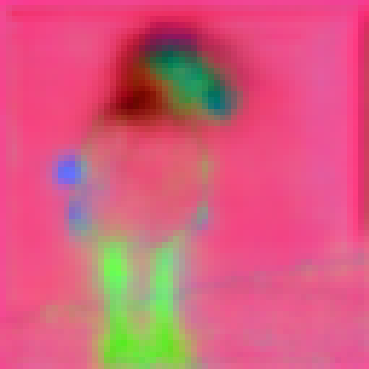
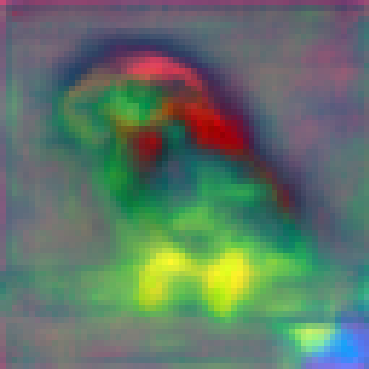
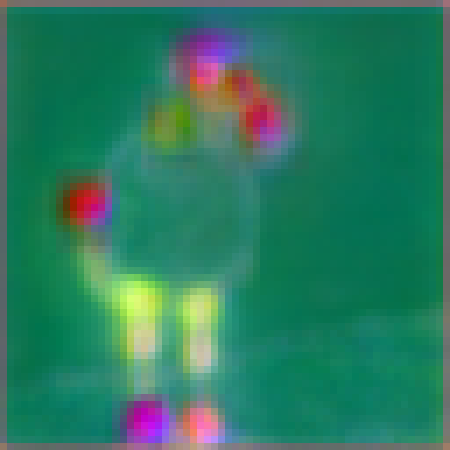
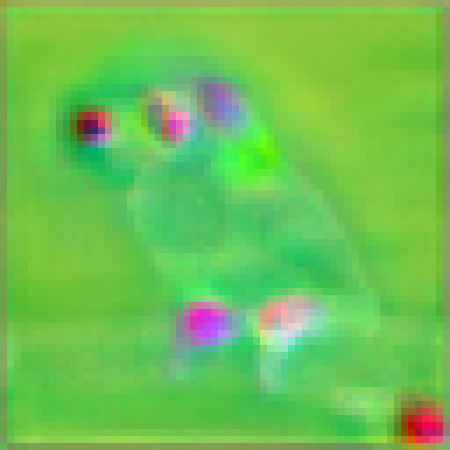
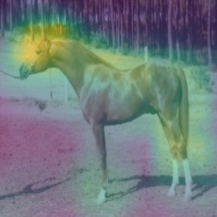
Much recent correspondence research (Sarlin et al., 2020; Sun et al., 2021; Jiang et al., 2021; Xu et al., 2021; Li et al., 2021; Cho et al., 2021; Min et al., 2021a; Huang et al., 2022b; Cho et al., 2022a) have utilized a means to benefit from either feature aggregation or cost aggregation. Feature aggregation, as illustrated in Fig. 1 (a), is a process that aims to not only integrate self-similar features within an image but also align similar features between the two images for matching. The advantages of feature aggregation have been made particularly evident in several attention- and Transformer-based matching networks (Vaswani et al., 2017; Sarlin et al., 2020; Sun et al., 2021; Xu et al., 2021; Jiang et al., 2021). Their accuracy in matching can be attributed to, as we show in Fig. 17 (e-f) and supported by previous studies (Sun et al., 2021; Amir et al., 2021), the learned position-dependent semantic features. While the visualization exhibits consistency among parts with the same semantics, dense matching often requires features with even greater discriminative power for more robust pixel-wise correspondence estimation, which is typically challenged by repetitive patterns and background clutters.
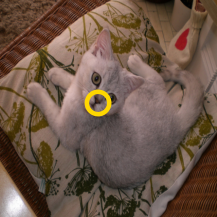
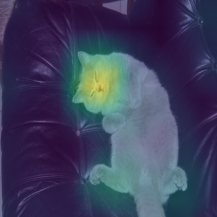
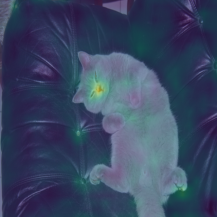
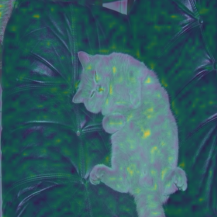
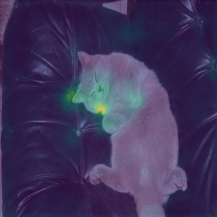
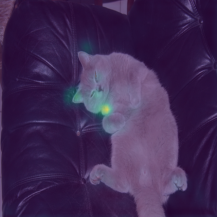
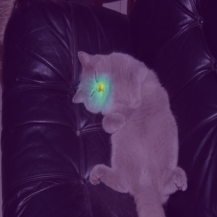
To compensate for, on the other hand, cost aggregation, as illustrated in Fig. 1 (b), has been adopted by numerous works (Rocco et al., 2018; Min et al., 2021b; Cho et al., 2021; Huang et al., 2022b; Cho et al., 2022a) for its favorable generalization ability (Song et al., 2021; Liu et al., 2022) and robustness to repetitive patterns and background clutter, which can be attributed to the matching similarities encoded in the cost volumes. These works can leverage the matching similarities to enforce smoothness and coherence in the disparity or flow estimates across neighboring pixels. However, it is important to note that, as highlighted in Fig. 3 (c-h), cost volumes often lack semantic context and exhibit relatively less consideration of spatial structure. This disparity arises due to the fact that the information encapsulated within cost volumes is established on the basis of pixel pairs, which could potentially lead to challenges in scenarios where such contextual cues play a pivotal role.
In this paper, we tackle the dense correspondence task by first performing a thorough exploration of feature aggregation and cost aggregation and their distinct characteristics. We then propose a simple yet effective architecture that can benefit from the potential advantages stemming from a more judicious use of both aggregation processes. The proposed architecture is a Transformer-based aggregation network, namely Unified Feature and Cost Aggregation Transformers (UFC), that models an integrative aggregation of feature descriptors and the cost volume, as illustrated in Fig. 1 (c).


This network consists of two stages, the first of which employs a self-attention layer to aggregate the descriptors and cost volume jointly. In this stage, the descriptors can help to disambiguate the noisy cost volume similarly to cost volume filtering (Hosni et al., 2012; Sun et al., 2018), and the cost volume can encourage the features to account for matching probabilities as an additional factor for alignment. For the subsequent step, we design a cross-attention layer that enables further aggregation aided by the outputs from earlier aggregations. This aggregated cost volume can guide the alignment with its sharpened matching distribution. These attention layers are interleaved. We further propose hierarchical processing to enhance the benefits one aggregation gains from the other. Finally, at inference time, our method estimates multi-scale predictions and their confidence scores to recover highly accurate flow.
We first evaluate the proposed method on the tasks of semantic matching and subsequently, we also substantiate that our framework achieves appreciable performance when applied to geometric matching. Our framework clearly outperforms prior works on all the major dense matching benchmarks, including HPatches (Balntas et al., 2017), ETH3D (Schops et al., 2017), SPair-71k (Min et al., 2019b), PF-PASCAL (Ham et al., 2017) and PF-WILLOW (Ham et al., 2016). We provide extensive ablation and analysis to validate our design choices.
2 Related Work
Feature Extraction and Aggregation.
Feature extraction involves detecting interest points and extracting the descriptors of the corresponding points. In traditional methods (Liu et al., 2010; Bay et al., 2006; Dalal & Triggs, 2005; Tola et al., 2009), the matching performance mostly relies on the quality of the feature detection and description methods, and outlier rejection across matched points is typically determined by RANSAC (Fischler & Bolles, 1981).
Learning-based feature extraction methods (DeTone et al., 2018; Ono et al., 2018; Dusmanu et al., 2019; Revaud et al., 2019) obtain dense deep features tailored for matching. These works have demonstrated that the quality of feature descriptors contributes substantially to matching performance. In accordance with this, recent matching networks (Sarlin et al., 2020; Min et al., 2019a; Lee et al., 2019; Hong & Kim, 2021; Min et al., 2020; Jiang et al., 2021; Sun et al., 2021; Xu et al., 2021) proposed effective means for feature aggregation. Notable sparse correspondence works include SuperGlue (Sarlin et al., 2020) and LOFTR (Sun et al., 2021), which employ graph- or Transformer-based self- and cross-attention for aggregation. Other methods are PUMP (Revaud et al., 2022) and ECO-TR (Tan et al., 2022), which are follow-up works of COTR (Jiang et al., 2021). These methods evaluate on dense correspondence benchmarks in a different way from previous works, using only the sparse and quasi-dense correspondences above certain confidence levels. We refer the readers to the supplementary material for a detailed discussion.
For dense correspondence, SFNet (Lee et al., 2019) and DMP (Hong & Kim, 2021) introduce adaptation layers after feature extraction to learn feature maps well-suited to matching and are evaluated on dense semantic and geometric matching. DKM (Edstedt et al., 2023) adopts Gaussian Processing Kernels for dense correspondence, and it demonstrates its effectiveness in pose estimation. In optical flow, GMFlow (Xu et al., 2021) leverages Transformer for feature aggregation, and its extension Xu et al. (2023) applies the method to stereo matching and depth estimation. In semantic correspondence, notable works include SCorrSAN (Huang et al., 2022a) proposes an efficient spatial context encoder to aggregate spatial context and feature descriptors, and MMNet Zhao et al. (2021) proposes a multi-scale matching network to learn discriminative pixel-level features.
Cost Aggregation.
In the dense correspondence literature, many works have designed their architectures for effective cost aggregation, which brings strong generalization power (Song et al., 2021; Liu et al., 2022). Recent works (Truong et al., 2020b; Hong & Kim, 2021; Jeon et al., 2020; Truong et al., 2021b) use 2D convolutions to establish correspondence while aggregating the cost volume with learnable kernels, while some works (Min et al., 2019a; 2020; Liu et al., 2020) utilize handcrafted methods, which include RHM (Cho et al., 2015) and the OT solver (Sinkhorn, 1967). NC-Net (Rocco et al., 2018) was the first to propose 4D convolutions for cost aggregation, and numerous works (Li et al., 2020; Yang & Ramanan, 2019; Huang et al., 2019; Rocco et al., 2020; Min et al., 2021a; b) leveraged or extended 4D convolutions.
Among Transformer-based networks, CATs (Cho et al., 2021) recently proposed to use Transformer (Vaswani et al., 2017) for cost aggregation, and its extension CATs++ (Cho et al., 2022a) combined convolutions and Transformer for an enhanced cost aggregation. VAT (Hong et al., 2022a) proposed 4D convolutional Swin transformer for cost aggregation that benefits from better generalization power and showed its effectiveness for semantic correspondence. NeMF (Hong et al., 2022b) incorporates an implicit neural representation into semantic correspondence and implicitly represents the cost volume to infer correspondences defined at arbitrary resolution. FlowFormer (Huang et al., 2022b) and STTR (Li et al., 2021) are Transformer-based cost aggregation networks specifically designed for optical flow or stereo matching.
3 Feature and Cost Aggregation
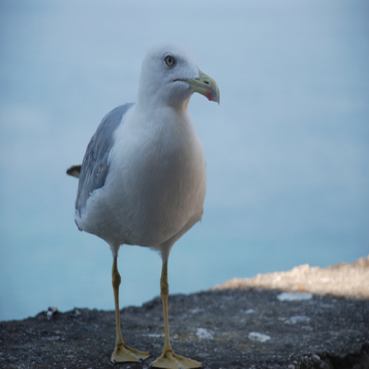
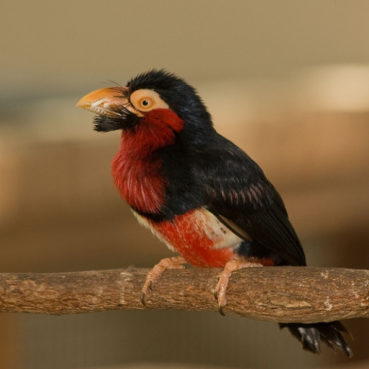
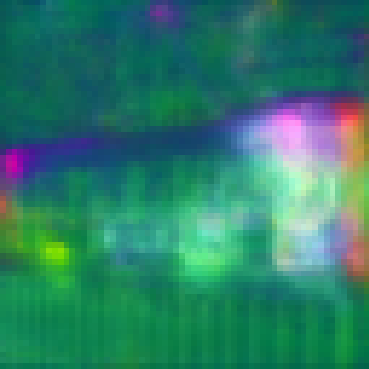
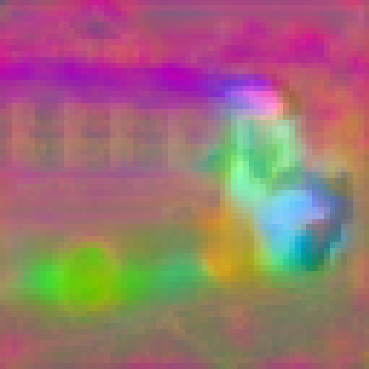
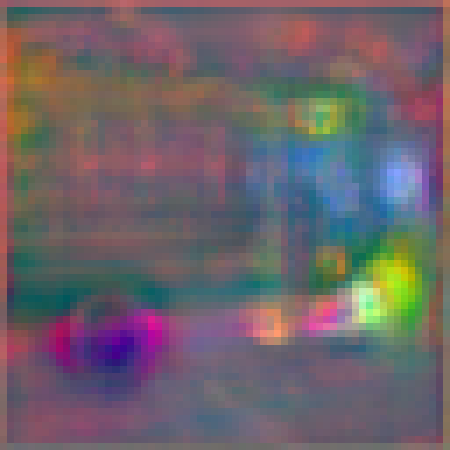
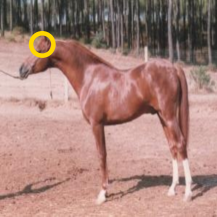
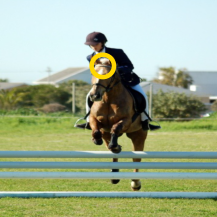
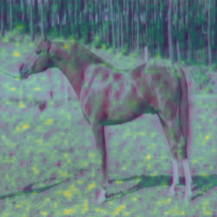
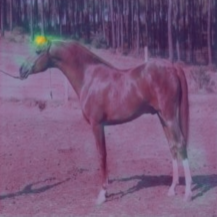
In this section, we examine the characteristics of feature and cost aggregation, which will later be verified empirically in Section 5.3. Fig. 17 and Fig. 3 present visualizations of feature maps and cost volumes at different stages of aggregation. Although there may be different types of aggregations, throughout this work, we focus on attention-based aggregations. From the visualizations, the following observations can be made.
The information encoded by features and cost volumes differ. Feature aggregation and cost aggregation thus exploit different information, which is exemplified in Fig. 17 (c-d) and Fig. 3 (c-e) where the spatial structure is preserved in the features while sparse spatial locations with higher similarity to the query point is highlighted in the cost volume. Due to the different information encoded in their inputs, the outputs of both aggregations have different characteristics. In Fig. 17, compared to raw features in (c-d), the feature aggregation in (e-f) makes the features of semantic parts, e.g., legs/claws and head, more consistent between the two birds. This is in agreement with observations in previous studies (Amir et al., 2021; Sun et al., 2021). On the other hand, compared to noisy cost volumes visualized in Fig. 3 (c-e), the aggregated cost volume in (h) is less noisy and more clearly highlights the most probable region for matching while less probable regions are suppressed. We additionally observe that each type of aggregation can have apparent effects on the other. Naturally, more robust descriptors can construct a less noisy cost volume as shown in Fig. 3 (f-g), and ease the subsequent cost aggregation process to promote more accurate correspondences. However, without a special model design, cost aggregation would not affect feature aggregation since it is performed after feature aggregation. Motivated by this, we proposed integrative aggregation, and its effects on feature maps are shown in Fig. 17 (g-h), where salient features become more distinguishable from each other, i.e., the left and right claws. This exemplifies that more discriminative feature representations that are more focused and that also preserve semantics and spatial structure can be learned and reveals that potential benefits from their integration can be realized.
From these observations, we propose in the following a simple yet effective architecture that makes prudent use of both feature and cost aggregation.



4 Methodology
4.1 Problem Formulation
Let us first denote a pair of visually or semantically similar images, i.e., the source and target, as and , the feature descriptors extracted from and as and , respectively, and the cost volume computed between the feature maps as . Given and , we aim to establish a dense correspondence field that is defined at all pixels and warps towards . Given features extracted from deep CNNs (He et al., 2016) or Transformers (Dosovitskiy et al., 2020), we can construct and store a cost volume that consists of all pairwise feature similarities with height and width : , where and index the source and target features, respectively. The dense correspondence field, , can then be determined from considering all .
4.2 Preliminaries: Self- and cross-attention
We briefly explain the attention mechanism, a core component we extend from. Given a sequence of tokens as an input, Transformer (Vaswani et al., 2017) first linearly projects tokens to obtain query, key and value embeddings. These are then fed into a scaled dot product attention layer, followed by Layer Normalization (LN) (Ba et al., 2016) and a feed-forward network or MLP, to produce an output with the same shape as the input. Each token is attended to by all the other tokens. This projections are formulated as:
| (1) |
where , and denote query, key and value projections, respectively, and denotes a token with a positional embedding. Subsequently, they pass through an attention layer:
| (2) |
where is the dimension of the key embedding. Note that the function can be defined in various ways (Wang et al., 2020; Liu et al., 2021; Katharopoulos et al., 2020; Lu et al., 2021; Wu et al., 2021). Self- and cross-attention are distinguished by their input to the key and value projections. Given a pair of input tokens, e.g., and , the input to the key and value projections of self-attention for is the same input, , but for cross-attention across and , the inputs to the key and value projection are .


4.3 Unified Feature and Cost Aggregation
Integrative Self-Attention.
Toward more judicious use of both aggregations, we first leverage the fact that both feature descriptors and cost volume encode different information. To this end, in the proposed integrative self-attention layer, as shown in Fig. 14, we first obtain a feature cost volume by concatenating and , where denotes concatenation.
This concatenation brings benefits from two perspectives. From the cost aggregation point of view, the feature map of the feature cost volume can disambiguate the initial noisy cost volume by referring to semantic-aware features as demonstrated in the stereo matching literature (Yoon & Kweon, 2006; Hosni et al., 2012; He et al., 2011), i.e., cost volume filtering. From the feature aggregation point of view, the cost volume explicitly represents the similarity of features in one image with respect to the features in the other, and accounting for it drives the features in each image to become more compatible with those of the other. As the iterations unfold, this process will encourage both aggregations to benefit each other. In the end, the resultant feature representations will be more robust and discriminative as shown in Fig. 17 (g-h).
To compute self-attention, we take a different approach from other works (Sun et al., 2021; Cho et al., 2021) to define the query, key and value embeddings. Concretely, we define two independent value embeddings, specifically one for feature projection and the other for cost volume projection. Formally, we define the query, key and values as:
| (3) |
where and denote the value embeddings of feature descriptors and the cost volume, respectively. After computing an attention map by applying softmax over the query and key dot product, we use it to aggregate feature and cost volume with and using Eq. 2 as follows:
| (4) |
Note that any type of attention computation can be utilized, i.e., additive (Bahdanau et al., 2014) or dot product (Vaswani et al., 2017), while in practice we use the linear kernel dot product with the associative property of matrix products (Katharopoulos et al., 2020). The outputs of this self-attention are denoted as , , and .
Cross-Attention with Matching Distribution.
In the proposed cross-attention layer, the aggregated features and cost volume are explicitly used for further aggregation, and we condition both feature descriptors on both input images via this layer. By exploiting the outputs of the self-attention layer, the cross-attention layer performs cross-attention between feature descriptors for further feature aggregation using the improved feature descriptors , and enhanced cost volume from earlier aggregations.
As shown in Fig. 14, we first apply convolution to the input cost volume and treat the output as a cross-attention map, since applying a softmax function over the cost volume is tantamount to obtaining an attention map. In this way, an enhanced aggregation is enabled, as the input cost volume is transformed to represent a sharpened matching distribution. With a cross-attention map and value for the attention score defined as and , respectively, the subsequent attention process for cross-attention is then defined as follows:
| (5) |
The outputs of this cross-attention are denoted as and , and is constructed using and . The proposed attention layers are interleaved, and they are stacked times to facilitate the aggregations and increase the model capacity.

4.4 Coarse-to-Fine Formulation
To improve the robustness of fine-scale estimates and enhance the benefits one aggregation gains from the other, we extend our architecture to a coarse-to-fine approach through pyramidal processing, as done in (Jeon et al., 2018; Melekhov et al., 2019; Truong et al., 2020b; Hong & Kim, 2021). We first use a coarse pair of refined feature maps and aggregated cost volume, and similar to (Zhao et al., 2021) that learns complementary correspondence by adding the cost volume of the previous scale, we progressively learn complementary descriptors and correspondences and encourage the coarser outputs to enhance the subsequent aggregations.
Formally, given the outputs of the attention block at each level, and , where denotes the -th level, we upsample the aggregated features using bilinear interpolation and add them to the raw feature descriptors extracted from and defined at the next level: , where is defined similarly. Note that we let the output cost volumes of self- and cross-attention at each level, and , undergo convolution and residual connections, i.e., to facilitate the training process. Then, we define the next-level cost volume as .
Finally, given the features and at each level, we compute the cost volume, and the sum of all cost volumes across all levels are added up to obtain the final output that is used to estimate the final flow field, as shown in the bottom of Fig. 5. We empirically find that increasing and appreciably boosts correspondence performance. However, there also exists a speed-accuracy trade-off of choosing and , for which we provide an analysis in the supplementary material.
4.5 Inference: Dense Zoom-in
At the inference phase, we leverage multi-scale predictions to predict highly accurate correspondences. The goals of this approach are two-fold: to prevent a large memory increase when processing high-resolution input image pairs, e.g., HD or Full HD, and to capture possible fine-grained correspondences missed by the coarse-to-fine design.
Dense zoom-in consists of three stages. For the first stage, UFC takes an input image pair and uses the output flow to coarsely align the source image to the target image as similarly done in (Shen et al., 2020). Unlike RANSAC-Flow (Shen et al., 2020), we do not resort to finding a homography transformation, but rather rely on the output flow itself. We empirically find that for images with extreme geometric deformations, reliable homography transformations may not be found.
Subsequently, we evenly partition the coarsely aligned source image and the target image into local windows, where is a hyperparameter. Each pair of partitioned local windows at the same location is then used to find more fine-grained correspondences by feeding them into UFC to obtain local flow fields. Note that in this stage, we also compute a cycle-consistency confidence score Jiang et al. (2021) that will be used in the final decision-making process. To enable multi-scale inference, we choose multiple , e.g., , for which we provide an ablation study in the supplementary material. We then perform transitive composition Zhou et al. (2016) using the coarse flow and each of the multi-scale flows. Finally, using the confidence values of composited flows at each pixel, we select the flow with the highest confidence score. This selection is performed for every pixel and results in a final dense flow map.
5 Experiments
| Methods | Train | Keypoint | Feat. Agg. | Cost Agg. | SPair-71k | PF-PASCAL | PF-WILLOW | |||||||||
| Image | Annotation | PCK @ | PCK @ | PCK @ | PCK @ | |||||||||||
| Reso. | Reso. | 0.01 | 0.03 | 0.05 | 0.1 | 0.15 | 0.05 | 0.1 | 0.15 | 0.05 | 0.1 | 0.05 | 0.1 | |||
| DHPF | 240 240 | 240 | - | RHM | 1.74 | 11.0 | 20.9 | 37.3 | 47.5 | 75.7 | 90.7 | 95.0 | 49.5 | 77.6 | - | 71.0 |
| SCOT | - | Max 300 | - | OT-RHM | - | - | - | 35.6 | - | 63.1 | 85.4 | 92.7 | - | - | 47.8 | 76.0 |
| CHM | 240 240 | 240 | 2D Conv. | 6D Conv. | 2.25 | 14.9 | 27.2 | 46.3 | 57.5 | 80.1 | 91.6 | 94.9 | 52.7 | 79.4 | - | 69.6 |
| CATs | 256 256 | 256 | - | Trans. | 1.90 | 13.8 | 27.7 | 49.9 | 61.7 | 75.4 | 92.6 | 96.4 | 50.3 | 79.2 | 40.7 | 69.0 |
| MMNet-FCN | 224 320 | 224 320 | Conv. + Trans. | - | 2.80 | 18.8 | 33.3 | 50.4 | 61.2 | 81.1 | 91.6 | 95.9 | - | - | - | - |
| PWarpC-NC-Net | 400 400 | Ori | - | 4D Conv. | 2.55 | 17.1 | 31.6 | 52.0 | 61.8 | 79.2 | 92.1 | 95.6 | - | - | 48.0 | 76.2 |
| SCorrSAN | 256 256 | 256 | Linear | - | - | - | - | 55.3 | - | 81.5 | 93.3 | 96.6 | 54.1 | 80.0 | - | - |
| VAT | 512 512 | 512 | - | 4D Conv. + Trans. | 3.17 | 19.6 | 35.0 | 55.5 | 65.1 | 78.2 | 92.3 | 96.2 | 52.8 | 81.6 | 42.3 | 71.3 |
| CATs++ | 512 512 | 512 | - | 4D Conv. + Trans. | 4.31 | 25.0 | 40.7 | 59.8 | 68.5 | 84.9 | 93.8 | 96.8 | 56.7 | 81.2 | 47.0 | 72.6 |
| TransforMatcher | 240 240 | 240 | - | Trans. | - | - | - | 53.7 | - | 80.8 | 91.8 | - | - | 76.0 | - | 65.3 |
| NeMF | 512 512 | Ori | - | 4D Conv. + Trans. | 3.2 | 19.5 | 34.2 | 53.6 | - | 80.6 | 93.6 | - | - | - | 60.8 | 75.0 |
| UFC | 512 512 | Ori | Integrative Transformer | 8.40 | 34.1 | 48.5 | 64.4 | 72.1 | 88.0 | 94.8 | 97.9 | 58.6 | 81.2 | 50.4 | 74.2 | |
| Methods | Feat.Agg. | Cost.Agg. | HPatches Original | ETH3D | |||||||||||||
| AEPE | PCK | AEPE | |||||||||||||||
| I | II | III | IV | V | Avg. | 5px | rate=3 | rate=5 | rate=7 | rate=9 | rate=11 | rate=13 | rate=15 | Avg. | |||
| COTR | Trans. | - | - | - | - | - | - | 7.75 | 91.10 | 1.66 | 1.82 | 1.97 | 2.13 | 2.27 | 2.41 | 2.61 | 2.12 |
| PUMP | - | 4D Conv. | - | - | - | - | - | 2.87 | 97.14 | 1.77 | 2.81 | 2.39 | 2.39 | 3.56 | 3.87 | 4.57 | 3.05 |
| ECO-TR | Trans. | - | - | - | - | - | - | 2.52 | 90.85 | 1.48 | 1.61 | 1.72 | 1.81 | 1.89 | 1.97 | 2.06 | 1.87 |
| COTR+Interp. | Trans. | - | - | - | - | - | - | 7.98 | 86.33 | 1.71 | 1.92 | 2.16 | 2.47 | 2.85 | 3.23 | 3.76 | 2.59 |
| UFC + (C) | Integrative Transformer | 0.87 | 1.29 | 1.37 | 3.19 | 1.92 | 1.73 | 98.76 | 1.45 | 1.59 | 1.64 | 1.76 | 1.82 | 1.90 | 1.95 | 1.73 | |
| GLU-Net | - | 2D Conv. | 1.55 | 12.66 | 27.54 | 32.04 | 52.47 | 25.05 | 78.54 | 1.98 | 2.54 | 3.49 | 4.24 | 5.61 | 7.55 | 10.78 | 5.17 |
| GLU-Net-GOCor | - | Hand-crafted | 1.29 | 10.07 | 23.86 | 27.17 | 38.41 | 20.16 | 81.43 | 1.93 | 2.28 | 2.64 | 3.01 | 3.62 | 4.79 | 7.80 | 3.72 |
| DMP | 2D Conv. | 2D Conv. | 3.21 | 15.54 | 32.54 | 38.62 | 63.43 | 30.64 | 63.21 | 2.43 | 3.31 | 4.41 | 5.56 | 6.93 | 9.55 | 14.20 | 6.62 |
| PDCNet (MS) | - | 2D Conv. | 1.15 | 7.43 | 11.64 | 25.00 | 30.49 | 15.14 | 91.41 | 1.60 | 1.79 | 2.00 | 2.26 | 2.57 | 2.90 | 3.56 | 2.38 |
| GMFlow | Trans. | - | 4.72 | 26.46 | 40.75 | 62.49 | 79.80 | 42.85 | 69.50 | 1.64 | 1.86 | 2.12 | 2.36 | 3.49 | 5.62 | 10.64 | 3.96 |
| COTR | Trans. | - | 19.65 | 33.81 | 45.81 | 62.03 | 66.28 | 45.52 | 5.10 | 8.76 | 9.86 | 11.23 | 12.44 | 13.77 | 14.94 | 16.09 | 12.44 |
| PDC-Net+ (MS) | - | 2D Conv. | - | - | - | - | - | - | - | 1.58 | 1.76 | 1.96 | 2.16 | 2.49 | 2.73 | 3.24 | 2.27 |
| UFC | Integrative Transformer | 1.91 | 6.13 | 5.62 | 6.36 | 19.44 | 7.88 | 89.36 | 1.54 | 1.72 | 1.99 | 2.18 | 2.58 | 2.66 | 3.01 | 2.24 | |
5.1 Semantic Matching
We first evaluate ours on semantic matching, where large intra-class variations and background clutters pose additional challenges to matching. We use three standard benchmarks: SPair-71k (Min et al., 2019b), PF-PASCAL (Ham et al., 2017) and PF-WILLOW (Ham et al., 2016). We follow the evaluation protocol of (Cho et al., 2022b). The results are summarized in Table 1, where UFC outperforms others for all the benchmarks at almost all PCKs, showing robustness to the above challenges. While VAT (Hong et al., 2022a) and NeMF (Hong et al., 2022b) perform better at , we stress that VAT evaluates at higher resolution and NeMF specializes in fine-grained correspondences. Also, we note that our performance is slightly inferior to SCOT (Liu et al., 2020) and PWarPC (Truong et al., 2022) for , but this is compensated for by the superior performance at lower alpha, i.e., 0.05, and the fact that PF-PASCAL (Ham et al., 2017) and PF-WILLOW (Ham et al., 2016) are small-scale datasets with a limited number of image pairs. Moreover, we highlight that for SPair-71k (Min et al., 2019b), the largest dataset in semantic correspondence with extreme viewpoint and scale difference, UFC outperforms competitors at all PCKs.
5.2 Geometric Matching
We next show that our method also performs very well in geometric matching. Following the evaluation protocol of (Truong et al., 2021b), we report the results on HPatches (Balntas et al., 2017) and ETH3D (Schops et al., 2017) in Table 2. From the results, our method clearly outperforms existing dense matching networks, including those that perform additional optimization (Truong et al., 2020a; Hong & Kim, 2021; Truong et al., 2021b) and inference strategies (Jiang et al., 2021; Truong et al., 2021b), and a representative optical flow method, GMFlow (Xu et al., 2021). Note that UFC excels at finding correspondences under extreme geometric deformations, i.e., scene IV and V. Interestingly, as UFC outperforms others at all intervals of ETH3D that consist of image sequences with varying magnitudes of geometric transformations, this indicates that it can also perform well in optical flow settings. This is supported by the results of GMFlow (Xu et al., 2021), where we consistently achieve better performance. To ensure a fair comparison to COTR (Jiang et al., 2021) and its follow-up works (Revaud et al., 2022; Tan et al., 2022), we present results from a variant of our method, denoted as (C). Moreover, we also include COTR to represent a truly dense version of COTR (Jiang et al., 2021), and we observe that UFC clearly performs better.
5.3 Quantitative comparison between aggregation strategies
| HPatches | SPair-71k | ||
| AEPE | = 0.1 | ||
| (I) | Feature self-att. | 78.2 | 36.1 |
| (II) | Feature self-att. and cross-att. | 59.9 | 38.5 |
| (III) | Cost self-att. | 51.8 | 33.6 |
| (IV) | Feature self-att. + cost self-att. | 36.8 | 51.7 |
| (V) | Feature self- and cross-att. + cost self-att. | 26.2 | 56.5 |
Figures 17 and 3 qualitatively show that the information both aggregations exploit and the output they generate differ. Here, we empirically show that these lead to appreciable performance differences. Table 3 (I-III) compares different aggregation strategies that are trained and evaluated on both tasks. Note that for these variants, we do not include any module for boosting performance, e.g., coarse-to-fine, multi-level or multi-scale features, and maintain a similar number of learnable parameters. Pytorch-like pseudocodes and additional visualizations are given in the supplementary material. From the results, we find that each aggregation strategy yields apparently different results in two tasks as reported in (I-III). A particularly illustrative comparison is (I) vs. (III), where only self-attention is performed on features or the cost volume, which clearly differentiate them. As expected, we also observe that performing cross-attention improves performance.
In the last two rows, we report the results of variants that utilize both feature and cost aggregation. (V) is our integrative aggregation, and (IV) is a naïve sequential aggregation where feature aggregation is followed by cost aggregation. They both achieve large performance boosts, as expected since the resultant cost volume in Fig. 3 (f) and (h) includes less noisy and more concentrated scores compared to (c-e), while integrative aggregation clearly performs better. From these quantitative comparisons, we highlight that the two types of aggregation serve different purposes that lead to apparent performance differences, and the potential benefits arising from their relationship can be further exploited with our proposed design.
5.4 Ablation Study
| Components | HPatches | SPair-71k | |
|---|---|---|---|
| AEPE | = 0.1 | ||
| (I) | Baseline | 36.8 | 51.7 |
| (II) | Integrative self-att. | 32.8 | 54.7 |
| (III) | Integrative self- and cross-att. | 22.8 | 58.4 |
| (IV) | + matching distribution. | 18.7 | 59.9 |
| (V) | + hierarchical processing | 10.9 | 64.4 |
| (VI) | + dense zoom-in | 7.88 | 64.4 |
In this ablation study, we verify the need for each component of our method. Table 4 presents quantitative results of each variant on both geometric and semantic matching. The baseline represents a variant equipped with self- and cross-attention on feature maps. From (II) to (VI), each proposed component is progressively included. We control the number of learnable parameters for each variant to be similar.
Comparing (I) and (II), we find that the proposed integrative self-attention layer benefits from joint aggregation of features and cost volume, achieving improved performance on both tasks. We next find that each component clearly helps to boost performance. Interestingly, we find dramatic improvements when cross-attention is included (III), indicating that explicit conditioning between input images is helpful. This further enhanced by using the aggregated cost volume as a cross-attention map (IV). We empirically find that our dense zoom-in brings marginal gain for semantic matching. We believe the sparse keypoint evaluation metric and the relatively small resolution images of the benchmark disturb harnessing the advantages of our inference strategy.
6 Conclusion
In this paper, we introduced a simple yet effective dense matching approach, Unified Feature and Cost Aggregation with Transformers (UFC), that capitalizes on the distinct advantages of the two types of aggregation. We further devise an enhanced aggregation through cross-attention with matching distribution. This method is formulated in a coarse-to-fine manner, yielding an appreciable performance boost. We have shown that our approach exhibits high speed and efficiency and that it surpasses all other existing works on several benchmarks, establishing new state-of-the-art performance.
Acknowledgement
This research was supported by the MSIT, Korea (IITP-2024-2020-0-01819, ICT Creative Consilience Program, RS-2023-00227592, Development of 3D Object Identification Technology Robust to Viewpoint Changes), and National Research Foundation of Korea (NRF-2021R1A6A1A03045425).
Unifying Feature and Cost Aggregation with Transformers for Semantic and Visual Correspondence
Sunghwan Hongequal contribution , Seokju Cho∗, Seungryong Kim††Corresponding author
Korea University
{sunghwan,seokjucho,seungryongkim}@korea.ac.kr
&Stephen Lin
Microsoft Research Asia
stevelin@microsoft.com
Overview
In the following, we first provide more implementation details in Section A. Then, we provide details on evaluation metrics and datasets in Section B. We then explain the training procedure in more depth in Section C. Subsequently, we provide additional experimental results and ablation study in Section D. We then provide clarifications to the evaluation procedure adopted by COTR (Jiang et al., 2021) and its follow-up works in Section E. We also provide Pytorch-Like psuedo-codes in Section LABEL:F. Finally, we present qualitative results for all the benchmarks in Section F and a discussion of future work in Section G.
Appendix A Implementation Details
A.1 Network Architectures
To extract features, we use ResNet-101 (He et al., 2016) for semantic matching, and VGG-16 (Simonyan & Zisserman, 2014) for geometric matching, consistent with prior works (Min et al., 2020; 2021a; Cho et al., 2021; Hong et al., 2022a; Truong et al., 2020b; a; 2021b). We select three feature maps from the last convolutional block, namely 3x, 4x, and 5x, with channel dimensions of 2048, 1024, and 512, respectively. To reduce computational complexity, we project each feature map to smaller dimensions of 384, 256, and 128, respectively, before constructing a cost volume and passing it to our integrative aggregation block. Bilinear interpolation is used to adjust the spatial dimensions of intermediate outputs. The resolutions at each levels are 16 16, 32 32 and 64 64, respectively. For the final output flow map, we use a soft-argmax operator with temperature set to 0.02.
A.2 Other Implementation Details
COTR Implementation Details.
In the main table, we report the results of COTR (Jiang et al., 2021) without zoom-in and confidence thresholding. Here, we provide the implementation details for how we obtained the results.
To adapt the input pair of images for use in our evaluation, we resize them to 256 256, which matches the resolution used by COTR (Jiang et al., 2021). Rather than selecting sparse coordinates for finding correspondences, we input all coordinates defined at the original resolution of the images, resulting in dense correspondences. This approach involves feed-forwarding all coordinates in parallel, which speeds up the process. We then compute the average endpoint error (AEPE) for all correspondences, masking any invalid correspondences as per conventional evaluation protocols (Truong et al., 2020b; a; 2021b). Note that our evaluation does not take into account the zoom-in technique used in COTR. We also evaluate dense correspondence rather than the original sparse or quasi-dense evaluation method adopted by COTR (Jiang et al., 2021), which we detail in Section E.

GMFlow Inference Details.
To evaluate GMFlow on HPatches (Balntas et al., 2017) and ETH3D (Zhao et al., 2021), we use the weights given at the official implementation page. However, processing HPatches at its original resolution requires an enormous amount of memory, even when using a high-end GPU such as the 80GB A100. Therefore, we interpolate the input image pairs using bilinear interpolation to match the size of the crops used during training (320 896), before feeding them into GMFlow (Xu et al., 2021). We use the weights trained on Sintel (Butler et al., 2012) with refinement strategy to obtain the best results.
Since there are numerous hyperparameters that can affect model performance, i.e., padding factor, window sizes for Swin Transformer (Liu et al., 2021) and scale factor, we choose the same hyperparameters that were used to obtain the pre-trained weight. Specifically, we set padding factor to 32, upsample factor to 4, scale factor to 2, attention split list to (2,8), correlation radius list to (-1,4) and flow propagation list to (-1,1). We keep all other hyperparameters at their default values. We then evaluate the model using the same evaluation procedure as in previous works (Truong et al., 2020b; a; 2021b).
PDC-Net Inference Details.
To evaluate PDC-Net (Truong et al., 2021b) on HPatches (Balntas et al., 2017) and ETH3D (Schops et al., 2017), we simply use the pre-trained weights and the official implementation codes. Note that the only hyperparameters we change at inference are GOCor (Truong et al., 2020a) hyperparameters, for which we set the number of iterations for global and local correlation map optimization to 3 and 7, respectively. The rest of the hyperparameters remain as the default values.
A.3 Dense Zoom-In
We provide an overview of dense zoom-in used at inference phase, in Fig. 6.
Appendix B Evaluation Metrics and Datasets
B.1 Geometric Matching
Compared Methods.
There are two groups of methods we compare to. The first group includes COTR (Jiang et al., 2021), PUMP (Revaud et al., 2022) and ECO-TR (Tan et al., 2022). The second group includes GLU-Net (Truong et al., 2020b), GOCor (Truong et al., 2020a), DMP (Hong & Kim, 2021), PDC-Net (Truong et al., 2021b), PDC-Net+ (Truong et al., 2021a), and they are trained in a self-supervised manner on either DPED-CityScape-ADE (Ignatov et al., 2017; Cordts et al., 2016; Zhou et al., 2019) or MegaDepth (Li & Snavely, 2018) except for GMFlow (Xu et al., 2021). For the second group, the evaluation is done using https://github.com/PruneTruong/DenseMatching.
Evaluation Metric.
For the evaluation metric, we use the average end-point error (AEPE), computed by averaging the Euclidean distance between the ground-truth and estimated flow, and percentage of correct keypoints (PCK), computed as the ratio of estimated keypoints within a threshold of the ground truth to the total number of keypoints. More specifically, AEPE is computed using the following equation: , where represents a ground-truth dense flow map and represents a dense predicted flow map.
HPatches.
Hpatches (Balntas et al., 2017) consists of images with different views of the same scenes. Each sequence contains a source and five target images with different viewpoints and the corresponding ground-truth flows. Generally, the later scenes, i.e., IV and V, consist of more challenging target images. We use images of high resolutions ranging from 450 600 to 1,613 1,210.
ETH3D
Unlike Hpatches (Balntas et al., 2017), ETH3D (Schops et al., 2017) consists of real 3D scenes, where the image transformations are not constrained to a homography. This multi-view dataset contains 10 image sequences ranging from 480 752 to 514 955. The authors of ETH3D (Schops et al., 2017) additionally provide a set of sparse image correspondences, for which we follow the protocol of (Truong et al., 2020b) by sampling the image pairs at different intervals to evaluate on varying magnitudes of geometric transformations. We evaluate on 7 intervals in total, each interval containing approximately 500 image pairs, or 600K to 1000K correspondences. Generally, the image pairs are more challenging at a higher rate, i.e., rate 13 or 15, as shown in Fig. 10 and Fig. 11.
B.2 Semantic Matching
Compared Methods.
We compare our methods to semantic matching methods, which are all trained in a supervised manner using ground-truth keypoints. DHPF (Min et al., 2020), SCOT (Liu et al., 2020), CHM (Min et al., 2021a), CATs (Cho et al., 2021), MMNet (Zhao et al., 2021), PWarpC-NC-Net (Truong et al., 2022; Rocco et al., 2018), SCorrSAN (Huang et al., 2022a), VAT (Hong et al., 2022a), CATs++ (Cho et al., 2022b), TransforMatcher (Kim et al., 2022) and NeMF (Hong et al., 2022b) are trained with SPair-71k (Min et al., 2019b) when evaluated on SPair-71k and they are trained on PF-PASCAL (Ham et al., 2017) when evaluated on PF-PASCAL and PF-WILLOW (Ham et al., 2016). Note that all the methods adopt ResNet-101 except for MMNet (Zhao et al., 2021).
Evaluation Metric.
For semantic matching, following (Rocco et al., 2018; Min et al., 2019a; 2020; Cho et al., 2021; 2022a), we transfer the annotated keypoints in the source image to the target image using the dense correspondence between the two images. The percentage of correct keypoints (PCK) is computed for evaluation. Note that higher PCK values are better. Concretely, given predicted keypoint and ground-truth keypoint , we count the number of predicted keypoints that satisfy the following condition: , where denotes Euclidean distance; denotes a threshold value; and denote height and width of the object bounding box or the entire image. Note that we additionally reported results of PCK @ to compensate for the fact that (Min et al., 2020; 2021a; Cho et al., 2021; Hong et al., 2022a; Huang et al., 2022a) chose thresholds different from other works (Liu et al., 2020; Lee et al., 2019; Rocco et al., 2018; 2017) for PF-WILLOW (Ham et al., 2016).
SPair-71k.
SPair-71k (Min et al., 2019b) is a large-scale benchmark for semantic correspondence, which consists of 18 object categories of 70,958 image pairs with extreme and diverse viewpoints, scale variations, and rich annotations for each image pair. Ground-truth annotations for object bounding boxes, segmentation masks and keypoints are available. For the evaluation, we follow the conventional evaluation protocol (Min et al., 2019a) of using a test split of 12,234 image pairs.
PF-PASCAL and PF-WILLOW
PF-PASCAL (Ham et al., 2017) is a dataset introduced as an extension for PF-WILLOW (Ham et al., 2016). It consists of 1,351 image pairs of 20 image categories, while PF-WILLOW (Ham et al., 2016) consists of 900 image pairs of 4 image categories. PF-PASCAL (Ham et al., 2017) is a more challenging dataset than others, i.e., TSS (Taniai et al., 2016) or PF-WILLOW (Ham et al., 2016), for semantic correspondence evaluation, as it additionally exhibits large appearance, scene layout, scale and clutter changes. For evaluation, we use the test split of PF-PASCAL (Ham et al., 2017) and PF-WILLOW (Ham et al., 2016).
Appendix C Training Details
In this section, we provide training details for both semantic and geometric matching. We employ an Intel Core i7-10700 CPU and RTX-3090 GPUs for training.
C.1 Dense Geometric Matching
For geometric matching, we adopt two-stage training. At the first stage, we freeze the backbone network and only train UFC using DPED-CityScape-ADE (Ignatov et al., 2017; Cordts et al., 2016; Zhou et al., 2019). This stage is similar to the training procedure of GOCor-GLU-Net (Truong et al., 2020a). More specifically, due to the limited amount of dense correspondence data, most matching networks resort to self-supervised training, where synthetic warps provide dense correspondences. To this end, we adopt the same training procedure to GOCor-GLU-Net (Truong et al., 2020a) that consists of pairs of images created by synthetically warping the image according to random affine, homography or TPS transformations. We crop the images to 512 512, and in total, we use 40K image pairs for the first stage of training. We set the learning rate to 3e-4, use AdamW (Loshchilov & Hutter, 2017) and iterate for 50 epochs with the batch size set to 16. We freeze the backbone in this stage.
For the second stage, we continue from the best model from the first stage, which was chosen by cross-validation. For the dataset, we use the MegaDepth dataset, which consists of 196 different scenes reconstructed from about 1M internet images using COLMAP (Schonberger & Frahm, 2016) and combine this with the synthetic data. For training, we sample up to 500 random images from 150 different scenes in which the overlap is at least 30% with the sparse SfM point cloud. We also include random independently moving objects sampled from the COCO (Lin et al., 2014) dataset on top of the synthetic data. Moreover, we also utilize perturbation data as we found it beneficial to include in the dataset. Finally, for the validation dataset, we sample up to 80 random images pairs from 25 different scenes. We resize the images to 512 512 in consistency with the first stage. For the second stage, we train the whole network, set the learning rate to 1e-4, use AdamW (Loshchilov & Hutter, 2017) and iterate for 175 epochs with the batch size set to 16.
Dense Semantic Matching
To ensure a fair comparison, following (Min et al., 2021a; Cho et al., 2021), when evaluating on SPair-71k (Min et al., 2019b) we train the proposed method on the training split of SPair-71k (Min et al., 2019b), and when evaluating on PF-PASCAL (Ham et al., 2017) and PF-WILLOW (Ham et al., 2016) we train on the training split of PF-PASCAL (Ham et al., 2017). We only train the UFC module and freeze the backbone network. We apply random augmentation (Buslaev et al., 2020) as done in (Cho et al., 2021). We set the learning rate to 1e-4, use AdamW (Loshchilov & Hutter, 2017) as an optimizer, set the batch size to 24, and iterate for 50 epochs for SPair-71k (Min et al., 2019b) and 300 epochs for PF-PASCAL (Ham et al., 2017). The best model is obtained through cross-validation.
Appendix D Additional Quantitative Results and Ablation Study
Computational complexity.
| Methods | Memory | Run-time | # of param. | |
|---|---|---|---|---|
| [GB] | [s] | [M] | ||
| HPatches | COTR | 5.7 | up to 216.0 | 18.5 |
| GMFlow | OOM (80.0 ) | OOM | 3.5 | |
| GMFlow 111 | 17.8 | 0.12 | 3.5 | |
| PDC-Net (D) | 2.4 | 1.72 | 10.8 | |
| PDC-Net+ (MS) | OOM(24.0 ) | OOM | 10.8 | |
| UFCgeometric | 4.9 | 3.1 | 15.5 | |
| SPair-71k | MMNet | 4.9 | 0.17 | 251.3 |
| CATs | 1.6 | 0.05 | 4.6 | |
| VAT | 3.8 | 0.19 | 3.3 | |
| CATs++ | 3.1 | 0.26 | 5.5 | |
| UFCsemantic | 3.5 | 0.17 | 14.5 | |
Here, we examine the computational complexity of the proposed approach relative to other methods. In Table 5, we report memory consumption, run time and number of learnable parameters. Note that memory consumption is in Gigabytes measuring maximum GPU memory utilization at the inference phase, run-time is in seconds, and the number of learnable parameters is in Millions.
In Table 5, UFC is able to consolidate large resolution images from HPatches (Balntas et al., 2017), i.e., 1,613 1,210, with only 4.9 GB memory consumption, which is a large saving compared to competitors (Xu et al., 2021; Truong et al., 2021a; Jiang et al., 2021). For inference time per image pair, UFC runs 2x faster than PDC-Net, while approximately 100x faster than COTR. The overall efficiency of UFC stems from: adjusted the resolution of the intermediate cost volumes, , to the coarsest resolution within the coarse-to-fine design, efficient attention computation, adequate hyperparameters set for and finally, compared to (Zhao et al., 2021; Cho et al., 2021; 2022b; Hong et al., 2022a) that use a large number of feature maps, typically leveraging all the feature maps from x to x, UFC only uses 3 feature maps, each used for each level .
Ablation study on image resolution
Here, we show additional results of our method UFC trained and evaluated at different resolutions on SPair-71k (Min et al., 2019b). As done in CATs++ (Cho et al., 2022a), we train and evaluate at 240, 256, 400 and 512 to directly compare with competitors, each of which train and evaluate at different resolutions, i.e., 240 for CHM (Min et al., 2021a), 256 for CATs (Cho et al., 2021), 400 for PMNC (Lee et al., 2021) and 512 for CATs++ (Cho et al., 2022a). The results are shown in Fig. 7, where UFC still outperforms the competitors.

Ablation study on and .
We show how the performance, memory consumption, run time and the number of learnable parameters vary as we set different and . The measured units are similar to Tab. 6, but run-time is instead measured in milliseconds, since zoom-in is excluded for these results. The results are shown in Table 6. We design our model that for each level , a user can freely set the depth similar to other Transformers (Vaswani et al., 2017; Liu et al., 2021). Simply, if we increase the depth, this will lead to increasing the capacity of our model. Note that when the value of exceeds 3, a more efficient approach is to avoid computing the entire cost volume . If were explicitly computed, it would have been used as a residual. However, in this case, we choose not to use it as a residual. This way, we can extend our architecture to process at higher resolution without introducing large memory consumption.
| N | AEPE | Memory | Run-time | # of param. | |
|---|---|---|---|---|---|
| [GB] | [ms] | [M] | |||
| Hpatches | (1,0,0) | 24.8 | 1.3 | 117.6 | 5.7 |
| (2,0,0) | 18.7 | 1.4 | 141.6 | 10.4 | |
| (1,1,1) | 18.2 | 2.5 | 158.6 | 8.3 | |
| (2,2,1) | 13.2 | 2.6 | 193.2 | 14.5 | |
| (2,2,2) | 10.9 | 2.9 | 200.2 | 15.5 | |
| (3,3,3) | 10.1 | 3.6 | 269.1 | 22.6 | |
| (1,1,1,1) | 12.1 | 13.4 | 162.3 | 8.73 | |
| N | PCK | Memory | Run-time | # of param. | |
| [GB] | [ms] | [M] | |||
| SPair-71k | (1,0,0) | 55.4 | 1.6 | 89.8 | 5.7 |
| (2,0,0) | 59.9 | 1.7 | 120.8 | 10.4 | |
| (1,1,1) | 63.7 | 2.8 | 142.2 | 8.3 | |
| (2,2,1) | 64.4 | 3.5 | 168.6 | 14.5 | |
| (2,2,2) | 62.5 | 3.9 | 189.4 | 15.5 | |
| (3,3,3) | 59.8 | 4.6 | 237.4 | 22.6 | |
| (1,1,1,1) | 63.1 | 14.4 | 171.5 | 8.85 | |
The effects of varying are that generally, we observe apparent improvements in performance as it is increased, but as the model gets heavier, it will face slower inference time and increased memory consumption. Also, it is notable that the number of learnable parameters can have significant effects on the memory consumption for training and the generalization power, which can be a limitation if the model capacity is increased. To alleviate this, we choose to sacrifice some performance for greater efficiency. The depths can be controlled easily by users depending on whether they prefer efficiency or performance. However, it should be noted that increases in depths will not always have a positive influence on the performance as shown for the semantic matching results. We suspect that the inferior results are caused by the overfitting problem and the lack of data in the semantic matching task. On the other hand, as we increase , accurate matching is promoted, as shown in the performance gaps among and .
Effects of varying .
In Table 7, we summarize the effects of varying , a hyperparameter used for dense zoom-in at inference. HPatches (Balntas et al., 2017) is used in measuring memory and run time. We take the maximum GPU memory utilization and average the run time. From the experiments, we find that varying has minor effects on performance while it has a large influence on memory and run time. This means that input images having resolutions similar to HPatches (Balntas et al., 2017) and ETH3D (Schops et al., 2017) do not require higher that leads to unnecessarily increased memory and run time; rather, smaller should be chosen. Note that to measure the maximum GPU utilization at , we use 80GB A100 as RTX-3090 lacks GPU capacity for this configuration. Because of this, we omit the run-time, as it is unfair to compare with other configurations. For semantic matching, we empirically find that varying barely has an impact on the performance, while increasing the complexity. This is likely due to the relatively small resolutions of the image pairs in the standard benchmarks (Min et al., 2019b; Ham et al., 2016; 2017).
Appendix E Discussions
Sparse and Quasi-Dense Evaluation.
In this section, we clarify the difference between the evaluation procedures adopted by COTR (Jiang et al., 2021) and its follow-up works (Revaud et al., 2022; Tan et al., 2022) to those of other existing works (Hong & Kim, 2021; Truong et al., 2020b; a; 2021b; Melekhov et al., 2019; Shen et al., 2020). COTR (Jiang et al., 2021) is one of the first works to use Transformer to find correspondences between images. Its follow-up works, including ECO-TR (Tan et al., 2022) and PUMP (Revaud et al., 2022), extend the work by improving performance or speed, or by reducing computations. These works attained state-of-the-art performance that significantly surpass the previous works, highlighting the effectiveness of these methods.
However, in order to compare with existing dense matching networks on dense correspondence datasets (Balntas et al., 2017; Schops et al., 2017), they first find sparse correspondences based on the confidence scores, where the correspondences below certain thresholds are discarded as mentioned in COTR (Jiang et al., 2021). Using only the sparse correspondences, AEPE or PCK is computed and compared to other works, which means that most of the erroneous correspondences that can significantly affect the metrics are not taken into account. On top of this, the densification is performed using only the confident sparse correspondences, and this version is indicated as ”+interp” or dense version in their papers. The metrics are then calculated using only the points within the convex hull, and the points outside of the interpolated regions are discarded in the evaluation.
We find that this differs from conventional dense evaluation. Instead, this is more to be classified as “semi-dense” or “quasi-dense”, which should be evaluated separately from existing dense methods. Although PUMP (Revaud et al., 2022) presents an extrapolation method to produce fully dense correspondence in their official implementation, the results reported in the paper appear to be computed using the confident quasi-dense flow maps, which clearly give it an apparent advantage similar to COTR (Jiang et al., 2021) and ECO-TR (Tan et al., 2022). Qualitative examples are shown in Fig. 8. We find that in the evaluation, COTR and its follow-up works have advantages over other existing dense matching works.
| k | AEPE | Memory | Run-time | |
|---|---|---|---|---|
| HPatches (Balntas et al., 2017) | ETH3D (Schops et al., 2017) | [GB] | [s] | |
| (2, 3) | 7.79 | 2.57 | 4.9 | 3.13 |
| (2, 3, 4) | 7.90 | 2.49 | 6.2 | 6.05 |
| (3, 4) | 7.89 | 2.47 | 6.0 | 5.32 |
| (3, 4, 5) | 7.88 | 2.33 | 14.8 | 4.63 |
| (4, 5) | 7.99 | 2.42 | 14.2 | 8.13 |
| (4, 5, 6) | 7.90 | 2.33 | 32.5 | - |
Although COTR (Jiang et al., 2021) explicitly mentions in a footnote that their performance cannot directly be compared to existing dense methods, the presentation in the paper may lead to some confusion that complicates comparisons, especially when PUMP (Revaud et al., 2022) and ECO-TR (Tan et al., 2022) do not address this. Therefore, we provide these clarifications to reduce further potential confusion.
Appendix F Qualitative Results
Appendix G Future Works
In this work, we explored distinctive characteristics of both feature and cost aggregations with Transformers. From the findings, we proposed a simple yet effective architecture that benefits from their synergy. However, more advanced techniques can be incorporated to further boost the performance. For example, as future work, we believe incorporating local-correlation maps to represent higher resolution cost volume would further improve the efficiency and performance improvements can be expected if is allowed to be increased given cheaper costs to represent cost volumes. However, a simple replacement of all the global correlations within the current architecture with that of local inevitably risks losing some information, which may degrade the performance. This means that a careful design would be necessary to achieve both high efficiency and performance. Another interesting extension is that as our model currently does not explicitly model matchability or uncertainty, it may have some disadvantages when handling occlusions. To compensate, we could design to output pixel-wise matchability scores and incorporate them into our framework, which we leave as future work.


References
- Amir et al. (2021) Shir Amir, Yossi Gandelsman, Shai Bagon, and Tali Dekel. Deep vit features as dense visual descriptors. arXiv preprint arXiv:2112.05814, 2(3):4, 2021.
- Ba et al. (2016) Jimmy Lei Ba, Jamie Ryan Kiros, and Geoffrey E Hinton. Layer normalization. arXiv preprint arXiv:1607.06450, 2016.
- Bahdanau et al. (2014) Dzmitry Bahdanau, Kyunghyun Cho, and Yoshua Bengio. Neural machine translation by jointly learning to align and translate. arXiv preprint arXiv:1409.0473, 2014.
- Bailey & Durrant-Whyte (2006) Tim Bailey and Hugh Durrant-Whyte. Simultaneous localization and mapping (slam): Part ii. IEEE robotics & automation magazine, 13(3):108–117, 2006.
- Balntas et al. (2017) Vassileios Balntas, Karel Lenc, Andrea Vedaldi, and Krystian Mikolajczyk. Hpatches: A benchmark and evaluation of handcrafted and learned local descriptors. In Proceedings of the IEEE conference on computer vision and pattern recognition, pp. 5173–5182, 2017.
- Bay et al. (2006) Herbert Bay, Tinne Tuytelaars, and Luc Van Gool. Surf: Speeded up robust features. In European conference on computer vision, pp. 404–417. Springer, 2006.
- Buslaev et al. (2020) Alexander Buslaev, Vladimir I Iglovikov, Eugene Khvedchenya, Alex Parinov, Mikhail Druzhinin, and Alexandr A Kalinin. Albumentations: fast and flexible image augmentations. Information, 2020.
- Butler et al. (2012) Daniel J Butler, Jonas Wulff, Garrett B Stanley, and Michael J Black. A naturalistic open source movie for optical flow evaluation. In European conference on computer vision, pp. 611–625. Springer, 2012.
- Cho et al. (2015) Minsu Cho, Suha Kwak, Cordelia Schmid, and Jean Ponce. Unsupervised object discovery and localization in the wild: Part-based matching with bottom-up region proposals. In Proceedings of the IEEE conference on computer vision and pattern recognition, pp. 1201–1210, 2015.
- Cho et al. (2021) Seokju Cho, Sunghwan Hong, Sangryul Jeon, Yunsung Lee, Kwanghoon Sohn, and Seungryong Kim. Cats: Cost aggregation transformers for visual correspondence. In Thirty-Fifth Conference on Neural Information Processing Systems, 2021.
- Cho et al. (2022a) Seokju Cho, Sunghwan Hong, and Seungryong Kim. Cats++: Boosting cost aggregation with convolutions and transformers. IEEE Transactions on Pattern Analysis and Machine Intelligence, pp. 1–20, 2022a. doi: 10.1109/TPAMI.2022.3218727.
- Cho et al. (2022b) Seokju Cho, Sunghwan Hong, and Seungryong Kim. Cats++: Boosting cost aggregation with convolutions and transformers. arXiv preprint arXiv:2202.06817, 2022b.
- Cordts et al. (2016) Marius Cordts, Mohamed Omran, Sebastian Ramos, Timo Rehfeld, Markus Enzweiler, Rodrigo Benenson, Uwe Franke, Stefan Roth, and Bernt Schiele. The cityscapes dataset for semantic urban scene understanding. In Proceedings of the IEEE conference on computer vision and pattern recognition, pp. 3213–3223, 2016.
- Dalal & Triggs (2005) Navneet Dalal and Bill Triggs. Histograms of oriented gradients for human detection. In CVPR Workshops), 2005.
- DeTone et al. (2018) Daniel DeTone, Tomasz Malisiewicz, and Andrew Rabinovich. Superpoint: Self-supervised interest point detection and description. In Proceedings of the IEEE conference on computer vision and pattern recognition workshops, pp. 224–236, 2018.
- Dosovitskiy et al. (2020) Alexey Dosovitskiy, Lucas Beyer, Alexander Kolesnikov, Dirk Weissenborn, Xiaohua Zhai, Thomas Unterthiner, Mostafa Dehghani, Matthias Minderer, Georg Heigold, Sylvain Gelly, et al. An image is worth 16x16 words: Transformers for image recognition at scale. arXiv preprint arXiv:2010.11929, 2020.
- Dusmanu et al. (2019) Mihai Dusmanu, Ignacio Rocco, Tomas Pajdla, Marc Pollefeys, Josef Sivic, Akihiko Torii, and Torsten Sattler. D2-net: A trainable cnn for joint description and detection of local features. In Proceedings of the IEEE/cvf conference on computer vision and pattern recognition, pp. 8092–8101, 2019.
- Edstedt et al. (2023) Johan Edstedt, Ioannis Athanasiadis, Mårten Wadenbäck, and Michael Felsberg. Dkm: Dense kernelized feature matching for geometry estimation. In Proceedings of the IEEE/CVF Conference on Computer Vision and Pattern Recognition, pp. 17765–17775, 2023.
- Fischler & Bolles (1981) Martin A Fischler and Robert C Bolles. Random sample consensus: a paradigm for model fitting with applications to image analysis and automated cartography. Communications of the ACM, 24(6):381–395, 1981.
- Ham et al. (2016) Bumsub Ham, Minsu Cho, Cordelia Schmid, and Jean Ponce. Proposal flow. In CVPR, 2016.
- Ham et al. (2017) Bumsub Ham, Minsu Cho, Cordelia Schmid, and Jean Ponce. Proposal flow: Semantic correspondences from object proposals. IEEE transactions on pattern analysis and machine intelligence, 2017.
- He et al. (2011) Kaiming He, Christoph Rhemann, Carsten Rother, Xiaoou Tang, and Jian Sun. A global sampling method for alpha matting. In CVPR 2011, pp. 2049–2056. IEEE, 2011.
- He et al. (2016) Kaiming He, Xiangyu Zhang, Shaoqing Ren, and Jian Sun. Deep residual learning for image recognition. In Proceedings of the IEEE conference on computer vision and pattern recognition, 2016.
- Hong & Kim (2021) Sunghwan Hong and Seungryong Kim. Deep matching prior: Test-time optimization for dense correspondence. In Proceedings of the IEEE/CVF International Conference on Computer Vision (ICCV), 2021.
- Hong et al. (2022a) Sunghwan Hong, Seokju Cho, Jisu Nam, Stephen Lin, and Seungryong Kim. Cost aggregation with 4d convolutional swin transformer for few-shot segmentation. arXiv preprint arXiv:2207.10866, 2022a.
- Hong et al. (2022b) Sunghwan Hong, Jisu Nam, Seokju Cho, Susung Hong, Sangryul Jeon, Dongbo Min, and Seungryong Kim. Neural matching fields: Implicit representation of matching fields for visual correspondence. Advances in Neural Information Processing Systems, 35:13512–13526, 2022b.
- Hosni et al. (2012) Asmaa Hosni, Christoph Rhemann, Michael Bleyer, Carsten Rother, and Margrit Gelautz. Fast cost-volume filtering for visual correspondence and beyond. IEEE transactions on pattern analysis and machine intelligence, 35(2):504–511, 2012.
- Huang et al. (2019) Shuaiyi Huang, Qiuyue Wang, Songyang Zhang, Shipeng Yan, and Xuming He. Dynamic context correspondence network for semantic alignment. In ICCV, 2019.
- Huang et al. (2022a) Shuaiyi Huang, Luyu Yang, Bo He, Songyang Zhang, Xuming He, and Abhinav Shrivastava. Learning semantic correspondence with sparse annotations. In Proceedings of the European Conference on Computer Vision(ECCV), 2022a.
- Huang et al. (2022b) Zhaoyang Huang, Xiaoyu Shi, Chao Zhang, Qiang Wang, Ka Chun Cheung, Hongwei Qin, Jifeng Dai, and Hongsheng Li. Flowformer: A transformer architecture for optical flow. arXiv preprint arXiv:2203.16194, 2022b.
- Ignatov et al. (2017) Andrey Ignatov, Nikolay Kobyshev, Radu Timofte, Kenneth Vanhoey, and Luc Van Gool. Dslr-quality photos on mobile devices with deep convolutional networks. In Proceedings of the IEEE International Conference on Computer Vision, pp. 3277–3285, 2017.
- Jeon et al. (2018) Sangryul Jeon, Seungryong Kim, Dongbo Min, and Kwanghoon Sohn. Parn: Pyramidal affine regression networks for dense semantic correspondence. In Proceedings of the European Conference on Computer Vision (ECCV), pp. 351–366, 2018.
- Jeon et al. (2020) Sangryul Jeon, Dongbo Min, Seungryong Kim, Jihwan Choe, and Kwanghoon Sohn. Guided semantic flow. In ECCV. Springer, 2020.
- Jiang et al. (2021) Wei Jiang, Eduard Trulls, Jan Hosang, Andrea Tagliasacchi, and Kwang Moo Yi. Cotr: Correspondence transformer for matching across images. In Proceedings of the IEEE/CVF International Conference on Computer Vision, pp. 6207–6217, 2021.
- Katharopoulos et al. (2020) Angelos Katharopoulos, Apoorv Vyas, Nikolaos Pappas, and François Fleuret. Transformers are rnns: Fast autoregressive transformers with linear attention. In International Conference on Machine Learning, pp. 5156–5165. PMLR, 2020.
- Kim et al. (2022) Seungwook Kim, Juhong Min, and Minsu Cho. Transformatcher: Match-to-match attention for semantic correspondence. In Proceedings of the IEEE/CVF Conference on Computer Vision and Pattern Recognition, pp. 8697–8707, 2022.
- Lee et al. (2021) Jae Yong Lee, Joseph DeGol, Victor Fragoso, and Sudipta N Sinha. Patchmatch-based neighborhood consensus for semantic correspondence. In Proceedings of the IEEE/CVF Conference on Computer Vision and Pattern Recognition, pp. 13153–13163, 2021.
- Lee et al. (2019) Junghyup Lee, Dohyung Kim, Jean Ponce, and Bumsub Ham. Sfnet: Learning object-aware semantic correspondence. In CVPR, 2019.
- Li et al. (2020) Shuda Li, Kai Han, Theo W Costain, Henry Howard-Jenkins, and Victor Prisacariu. Correspondence networks with adaptive neighbourhood consensus. In Proceedings of the IEEE/CVF Conference on Computer Vision and Pattern Recognition, pp. 10196–10205, 2020.
- Li et al. (2021) Zhaoshuo Li, Xingtong Liu, Nathan Drenkow, Andy Ding, Francis X Creighton, Russell H Taylor, and Mathias Unberath. Revisiting stereo depth estimation from a sequence-to-sequence perspective with transformers. In Proceedings of the IEEE/CVF International Conference on Computer Vision, pp. 6197–6206, 2021.
- Li & Snavely (2018) Zhengqi Li and Noah Snavely. Megadepth: Learning single-view depth prediction from internet photos. In Proceedings of the IEEE Conference on Computer Vision and Pattern Recognition, pp. 2041–2050, 2018.
- Lin et al. (2014) Tsung-Yi Lin, Michael Maire, Serge Belongie, James Hays, Pietro Perona, Deva Ramanan, Piotr Dollár, and C Lawrence Zitnick. Microsoft coco: Common objects in context. In European conference on computer vision, 2014.
- Liu et al. (2022) Biyang Liu, Huimin Yu, and Guodong Qi. Graftnet: Towards domain generalized stereo matching with a broad-spectrum and task-oriented feature. In Proceedings of the IEEE/CVF Conference on Computer Vision and Pattern Recognition, pp. 13012–13021, 2022.
- Liu et al. (2010) Ce Liu, Jenny Yuen, and Antonio Torralba. Sift flow: Dense correspondence across scenes and its applications. IEEE transactions on pattern analysis and machine intelligence, 33(5):978–994, 2010.
- Liu et al. (2020) Yanbin Liu, Linchao Zhu, Makoto Yamada, and Yi Yang. Semantic correspondence as an optimal transport problem. In Proceedings of the IEEE/CVF Conference on Computer Vision and Pattern Recognition, 2020.
- Liu et al. (2021) Ze Liu, Yutong Lin, Yue Cao, Han Hu, Yixuan Wei, Zheng Zhang, Stephen Lin, and Baining Guo. Swin transformer: Hierarchical vision transformer using shifted windows. arXiv preprint arXiv:2103.14030, 2021.
- Loshchilov & Hutter (2017) Ilya Loshchilov and Frank Hutter. Decoupled weight decay regularization. arXiv preprint arXiv:1711.05101, 2017.
- Lowe (2004) David G Lowe. Distinctive image features from scale-invariant keypoints. International journal of computer vision, 60(2):91–110, 2004.
- Lu et al. (2021) Jiachen Lu, Jinghan Yao, Junge Zhang, Xiatian Zhu, Hang Xu, Weiguo Gao, Chunjing Xu, Tao Xiang, and Li Zhang. Soft: Softmax-free transformer with linear complexity. arXiv preprint arXiv:2110.11945, 2021.
- Melekhov et al. (2019) Iaroslav Melekhov, Aleksei Tiulpin, Torsten Sattler, Marc Pollefeys, Esa Rahtu, and Juho Kannala. Dgc-net: Dense geometric correspondence network. In WACV, 2019.
- Min et al. (2019a) Juhong Min, Jongmin Lee, Jean Ponce, and Minsu Cho. Hyperpixel flow: Semantic correspondence with multi-layer neural features. In Proceedings of the IEEE/CVF International Conference on Computer Vision, 2019a.
- Min et al. (2019b) Juhong Min, Jongmin Lee, Jean Ponce, and Minsu Cho. Spair-71k: A large-scale benchmark for semantic correspondence. arXiv preprint arXiv:1908.10543, 2019b.
- Min et al. (2020) Juhong Min, Jongmin Lee, Jean Ponce, and Minsu Cho. Learning to compose hypercolumns for visual correspondence. In Computer Vision–ECCV 2020: 16th European Conference, Glasgow, UK, August 23–28, 2020, Proceedings, Part XV 16. Springer, 2020.
- Min et al. (2021a) Juhong Min, Seungwook Kim, and Minsu Cho. Convolutional hough matching networks for robust and efficient visual correspondence. arXiv preprint arXiv:2109.05221, 2021a.
- Min et al. (2021b) Juhong Min, Seungwook Kim, and Minsu Cho. Convolutional hough matching networks for robust and efficient visual correspondence. arXiv preprint arXiv:2109.05221, 2021b.
- Ono et al. (2018) Yuki Ono, Eduard Trulls, Pascal Fua, and Kwang Moo Yi. Lf-net: Learning local features from images. Advances in neural information processing systems, 31, 2018.
- Peebles et al. (2021) William Peebles, Jun-Yan Zhu, Richard Zhang, Antonio Torralba, Alexei Efros, and Eli Shechtman. Gan-supervised dense visual alignment. arXiv preprint arXiv:2112.05143, 2021.
- Philbin et al. (2007) James Philbin, Ondrej Chum, Michael Isard, Josef Sivic, and Andrew Zisserman. Object retrieval with large vocabularies and fast spatial matching. In CVPR. IEEE, 2007.
- Revaud et al. (2019) Jerome Revaud, Philippe Weinzaepfel, César De Souza, Noe Pion, Gabriela Csurka, Yohann Cabon, and Martin Humenberger. R2d2: repeatable and reliable detector and descriptor. arXiv preprint arXiv:1906.06195, 2019.
- Revaud et al. (2022) Jérome Revaud, Vincent Leroy, Philippe Weinzaepfel, and Boris Chidlovskii. Pump: Pyramidal and uniqueness matching priors for unsupervised learning of local descriptors. In Proceedings of the IEEE/CVF Conference on Computer Vision and Pattern Recognition, pp. 3926–3936, 2022.
- Rocco et al. (2017) Ignacio Rocco, Relja Arandjelovic, and Josef Sivic. Convolutional neural network architecture for geometric matching. In CVPR, 2017.
- Rocco et al. (2018) Ignacio Rocco, Mircea Cimpoi, Relja Arandjelović, Akihiko Torii, Tomas Pajdla, and Josef Sivic. Neighbourhood consensus networks. arXiv preprint arXiv:1810.10510, 2018.
- Rocco et al. (2020) Ignacio Rocco, Relja Arandjelović, and Josef Sivic. Efficient neighbourhood consensus networks via submanifold sparse convolutions. In ECCV, 2020.
- Sarlin et al. (2020) Paul-Edouard Sarlin, Daniel DeTone, Tomasz Malisiewicz, and Andrew Rabinovich. Superglue: Learning feature matching with graph neural networks. In CVPR, 2020.
- Scharstein & Szeliski (2002) Daniel Scharstein and Richard Szeliski. A taxonomy and evaluation of dense two-frame stereo correspondence algorithms. International journal of computer vision, 2002.
- Schonberger & Frahm (2016) Johannes L Schonberger and Jan-Michael Frahm. Structure-from-motion revisited. In Proceedings of the IEEE conference on computer vision and pattern recognition, pp. 4104–4113, 2016.
- Schops et al. (2017) Thomas Schops, Johannes L Schonberger, Silvano Galliani, Torsten Sattler, Konrad Schindler, Marc Pollefeys, and Andreas Geiger. A multi-view stereo benchmark with high-resolution images and multi-camera videos. In Proceedings of the IEEE Conference on Computer Vision and Pattern Recognition, pp. 3260–3269, 2017.
- Shen et al. (2020) Xi Shen, François Darmon, Alexei A Efros, and Mathieu Aubry. Ransac-flow: generic two-stage image alignment. In European Conference on Computer Vision, pp. 618–637. Springer, 2020.
- Simonyan & Zisserman (2014) Karen Simonyan and Andrew Zisserman. Very deep convolutional networks for large-scale image recognition. arXiv preprint arXiv:1409.1556, 2014.
- Sinkhorn (1967) Richard Sinkhorn. Diagonal equivalence to matrices with prescribed row and column sums. The American Mathematical Monthly, 1967.
- Song et al. (2021) Xiao Song, Guorun Yang, Xinge Zhu, Hui Zhou, Zhe Wang, and Jianping Shi. Adastereo: A simple and efficient approach for adaptive stereo matching. In Proceedings of the IEEE/CVF Conference on Computer Vision and Pattern Recognition, pp. 10328–10337, 2021.
- Sun et al. (2018) Deqing Sun, Xiaodong Yang, Ming-Yu Liu, and Jan Kautz. Pwc-net: Cnns for optical flow using pyramid, warping, and cost volume. In CVPR, 2018.
- Sun et al. (2021) Jiaming Sun, Zehong Shen, Yuang Wang, Hujun Bao, and Xiaowei Zhou. Loftr: Detector-free local feature matching with transformers. In Proceedings of the IEEE/CVF conference on computer vision and pattern recognition, pp. 8922–8931, 2021.
- Tan et al. (2022) Dongli Tan, Jiang-Jiang Liu, Xingyu Chen, Chao Chen, Ruixin Zhang, Yunhang Shen, Shouhong Ding, and Rongrong Ji. Eco-tr: Efficient correspondences finding via coarse-to-fine refinement. In European Conference on Computer Vision, pp. 317–334. Springer, 2022.
- Taniai et al. (2016) Tatsunori Taniai, Sudipta N Sinha, and Yoichi Sato. Joint recovery of dense correspondence and cosegmentation in two images. In Proceedings of the IEEE conference on computer vision and pattern recognition, pp. 4246–4255, 2016.
- Tola et al. (2009) Engin Tola, Vincent Lepetit, and Pascal Fua. Daisy: An efficient dense descriptor applied to wide-baseline stereo. IEEE transactions on pattern analysis and machine intelligence, 32(5):815–830, 2009.
- Truong et al. (2020a) Prune Truong, Martin Danelljan, Luc V Gool, and Radu Timofte. Gocor: Bringing globally optimized correspondence volumes into your neural network. Advances in Neural Information Processing Systems, 33:14278–14290, 2020a.
- Truong et al. (2020b) Prune Truong, Martin Danelljan, and Radu Timofte. Glu-net: Global-local universal network for dense flow and correspondences. In Proceedings of the IEEE/CVF conference on computer vision and pattern recognition, pp. 6258–6268, 2020b.
- Truong et al. (2021a) Prune Truong, Martin Danelljan, Radu Timofte, and Luc Van Gool. Pdc-net+: Enhanced probabilistic dense correspondence network. arXiv preprint arXiv:2109.13912, 2021a.
- Truong et al. (2021b) Prune Truong, Martin Danelljan, Luc Van Gool, and Radu Timofte. Learning accurate dense correspondences and when to trust them. In Proceedings of the IEEE/CVF Conference on Computer Vision and Pattern Recognition, 2021b.
- Truong et al. (2022) Prune Truong, Martin Danelljan, Fisher Yu, and Luc Van Gool. Probabilistic warp consistency for weakly-supervised semantic correspondences. arXiv preprint arXiv:2203.04279, 2022.
- Vaswani et al. (2017) Ashish Vaswani, Noam Shazeer, Niki Parmar, Jakob Uszkoreit, Llion Jones, Aidan N Gomez, Łukasz Kaiser, and Illia Polosukhin. Attention is all you need. In Advances in neural information processing systems, 2017.
- Wang et al. (2020) Sinong Wang, Belinda Z Li, Madian Khabsa, Han Fang, and Hao Ma. Linformer: Self-attention with linear complexity. arXiv preprint arXiv:2006.04768, 2020.
- Wu et al. (2021) Chuhan Wu, Fangzhao Wu, Tao Qi, Yongfeng Huang, and Xing Xie. Fastformer: Additive attention can be all you need. arXiv preprint arXiv:2108.09084, 2021.
- Xu et al. (2021) Haofei Xu, Jing Zhang, Jianfei Cai, Hamid Rezatofighi, and Dacheng Tao. Gmflow: Learning optical flow via global matching. arXiv preprint arXiv:2111.13680, 2021.
- Xu et al. (2023) Haofei Xu, Jing Zhang, Jianfei Cai, Hamid Rezatofighi, Fisher Yu, Dacheng Tao, and Andreas Geiger. Unifying flow, stereo and depth estimation. IEEE Transactions on Pattern Analysis and Machine Intelligence, 2023.
- Yang & Ramanan (2019) Gengshan Yang and Deva Ramanan. Volumetric correspondence networks for optical flow. Advances in neural information processing systems, 32, 2019.
- Yoon & Kweon (2006) Kuk-Jin Yoon and In So Kweon. Adaptive support-weight approach for correspondence search. IEEE transactions on pattern analysis and machine intelligence, 28(4):650–656, 2006.
- Zhao et al. (2021) Dongyang Zhao, Ziyang Song, Zhenghao Ji, Gangming Zhao, Weifeng Ge, and Yizhou Yu. Multi-scale matching networks for semantic correspondence. In Proceedings of the IEEE/CVF International Conference on Computer Vision, pp. 3354–3364, 2021.
- Zhou et al. (2019) Bolei Zhou, Hang Zhao, Xavier Puig, Tete Xiao, Sanja Fidler, Adela Barriuso, and Antonio Torralba. Semantic understanding of scenes through the ade20k dataset. International Journal of Computer Vision, 127(3):302–321, 2019.
- Zhou et al. (2016) Tinghui Zhou, Philipp Krahenbuhl, Mathieu Aubry, Qixing Huang, and Alexei A Efros. Learning dense correspondence via 3d-guided cycle consistency. In Proceedings of the IEEE Conference on Computer Vision and Pattern Recognition, pp. 117–126, 2016.