FishNet: Deep Neural Networks for Low-Cost Fish Stock Estimation
Abstract
Fish stock assessment often involves manual fish counting by taxonomy specialists, which is both time-consuming and costly. We propose an automated computer vision system that performs both taxonomic classification and fish size estimation from images taken with a low-cost digital camera. The system first performs object detection and segmentation using a Mask R-CNN to identify individual fish from images containing multiple fish, possibly consisting of different species. Then each fish species is classified and the predicted length using separate machine learning models. These models are trained on a dataset of 50,000 hand-annotated images containing 163 different fish species, ranging in length from 10cm to 250cm. Evaluated on held-out test data, our system achieves a intersection over union on the fish segmentation task, a top-1 classification accuracy on single fish species classification, and a cm mean error on the fish length estimation task.
Keywords Computer Vision Fish Stock Estimation Image Segmentation Image Classification Size Estimation.
1 Introduction
Predictions that all of the world’s stocks of commercially important fish could collapse by the year 2048 [1] have been tempered by recent evidence that fish stocks are recovering in many high-income countries [2]. This turnaround is typically attributed to stringent catch limits backed by an accurate scientific assessment of the number of fish in a particular stock (population). It is challenging to set a limit on catch appropriately unless scientists know how many fish are actually present in a wild population. Despite progress in many high-income countries, the majority of the world’s fisheries remain “unassessed” and the prognosis for these fisheries is concerning: populations are declining and are on a trajectory towards functional extinction [3]. One of the major barriers to performing fish stock assessment in the developing world is the cost. The federal government in the US spends approximately million a year on fish stock assessment [4], which excludes spending by state governments on assessment of stocks within nautical miles of the coast (state waters). As an example, the average cost of a fish stock assessment performed by NOAA’s Pacific Islands Fisheries Science Center in Honolulu is million, which exceeds the total value of many developing country fisheries.
Costly stock assessment also prevents many well-managed fisheries from accessing lucrative markets for sustainable seafood. For example, the Marine Stewardship Council (MSC), which endorses seafood with its blue eco-label requires a detailed stock assessment of the fishery for certification. In [5], the authors argue that the high costs of certification remain a barrier to many fisheries in Latin America and the Caribbean accessing the benefits of seafood ecolabels. For example, there is only one fishery certified as sustainable in Indonesia by the MSC, and this is, in part, because the species being targeted (yellowfin tuna) occurs throughout the Pacific Ocean; the expensive assessment of this stock is performed by an intergovernmental body, funded by the US, Australia, France, Japan, and a number of other countries. Here we propose a methodology for drastically reducing the cost of fisheries stock assessment by combining citizen science with machine learning.
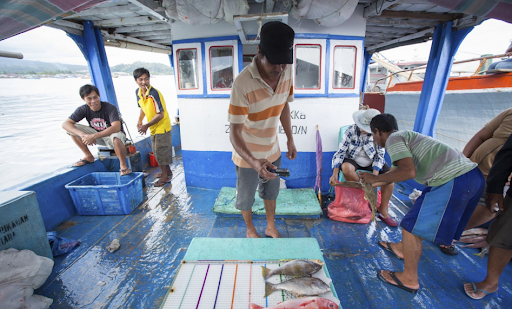
Advances in digital photography, computer vision, and artificial intelligence (AI) make automating fish-stock estimation an attractive alternative. In this work, we develop and evaluate a prototype system for predicting fish species and length in a tropical snapper-grouper fishery in Indonesia. This is one of the most difficult fisheries in the world in which to perform a stock assessment, with small-scale fishers catching over a hundred different species, using a variety of fishing gear, spread across Indonesia’s 17,000 different islands. As part of a participatory science program, The Nature Conservancy in Indonesia gave small-scale fishers digital cameras and asked them to photograph all their catch against a consistent background with color-coded measurement scales, as seen in Figure 1. A team of marine biologists then identified the species and length of fish from the photographs, resulting in 300,000 images of over one million fish, each hand-labeled for fish species and length. Because the system requires no special equipment beyond a digital camera and a standardized board with fiduciary markings, the approach is a feasible and financially practical solution to the problem of fish stock estimation at scale.
2 Related Work
Taxonomic Classification: Modern computer vision systems such as Facebook’s Detectron2 [6] use deep neural network models to perform object detection, segmentation, and classification. These models are pre-trained on the ImageNet-1k dataset and can be fine-tuned to application-specific tasks through transfer learning. Previous work has used this approach to classify fish for fish stock estimation [7, 8, 9, 10, 11], but previous efforts have not attempted this task in a setting without specialized equipment, using only a basic handheld digital camera. This work is also the first to test fish stock estimation on a dataset of this size with a large number of fish species, while addressing all the required components of a successful stock estimation, namely taxonomic classification and size estimation. In [7, 12], the authors use pre-trained Convolutional Neural Network (CNN) architectures and the Fish4Knowledge Ground-Truth dataset [13] for fish species classification. The dataset contains a much smaller number of images (27,370) of underwater fish extracted from video recordings. The Fish4Knowledge dataset also only contains images of 23 species in comparison to the 163 different species this work addresses. In [14], an automatedframework is demonstrated to detect, classify, and track fish using high-resolution imaging sonar and underwater videos; this work is similar to ours in that it addresses the classification and counting of multiple fish, but it only focuses on eight fish species and does not estimate the size of each fish.
The authors of [15] adopt a similar approach using underwater video for detection and fish count estimation. This system requires significantly more cost as underwater images require specialized cameras and hardware, and processing video requires significantly more computation. The work of [16] resembles ours most closely in that they perform detection, multi-fish segmentation, classification, and size estimation. They however do this on a much smaller dataset (DeepFish) of 1,291 labeled images containing 7,339 fish of 59 different species [16] compared to our 1.2M images of more than 160 species. They also focus on the retail side of the problem where measurements and labeling are derived from fish markets and the fish are market-sized as opposed to all fish caught at sea (which is more relevant for fish stock assessment). The work of [16] also only focuses on images containing multiple fish (multi-fish images) but all fish in the image are assumed to be from the same species. In contrast, our system is more flexible in that we allow for identification and size estimation of each fish in an image containing fish from multiple species. Furthermore, their focus is on large fish such as bluefin tuna, yellowfin tuna, sharks, and sting rays, while our system is trained to identify fish ranging in size from 10cm to above 200cm.
Fish Size Estimation: Estimating the size of a fish from an image is aided by the inclusion of a reference object of known length (a fiduciary marker). In this work, 10cm length rectangular color areas on the sides of each measuring board are used. These act as fiduciary markers to guide the estimation of the fish size. In [17], a mask R-CNN similar to the one used in this work is used to detect and measure the length of fish heads and bodies, but only for a single species. In [18], the authors place three ArUco fiduciary markers of different sizes on polypropylene sheets, along with the fish to be measured. The authors extend their work in [19], by using the same three fiduciary markers and estimating fish length using standard smartphone cameras. They use mask R-CNN to detect and segment objects of interest. Their work is evaluated on a much smaller dataset of 1,000 images, of fewer fish species than we address, and does not explicitly address species classification as all fish are of the same species, which is a vital component for general automated fish stock estimation. The system we propose is very general and evaluated on a much larger variety of fish species (163) and fish sizes (10cm to more than 200cm).
3 Methods
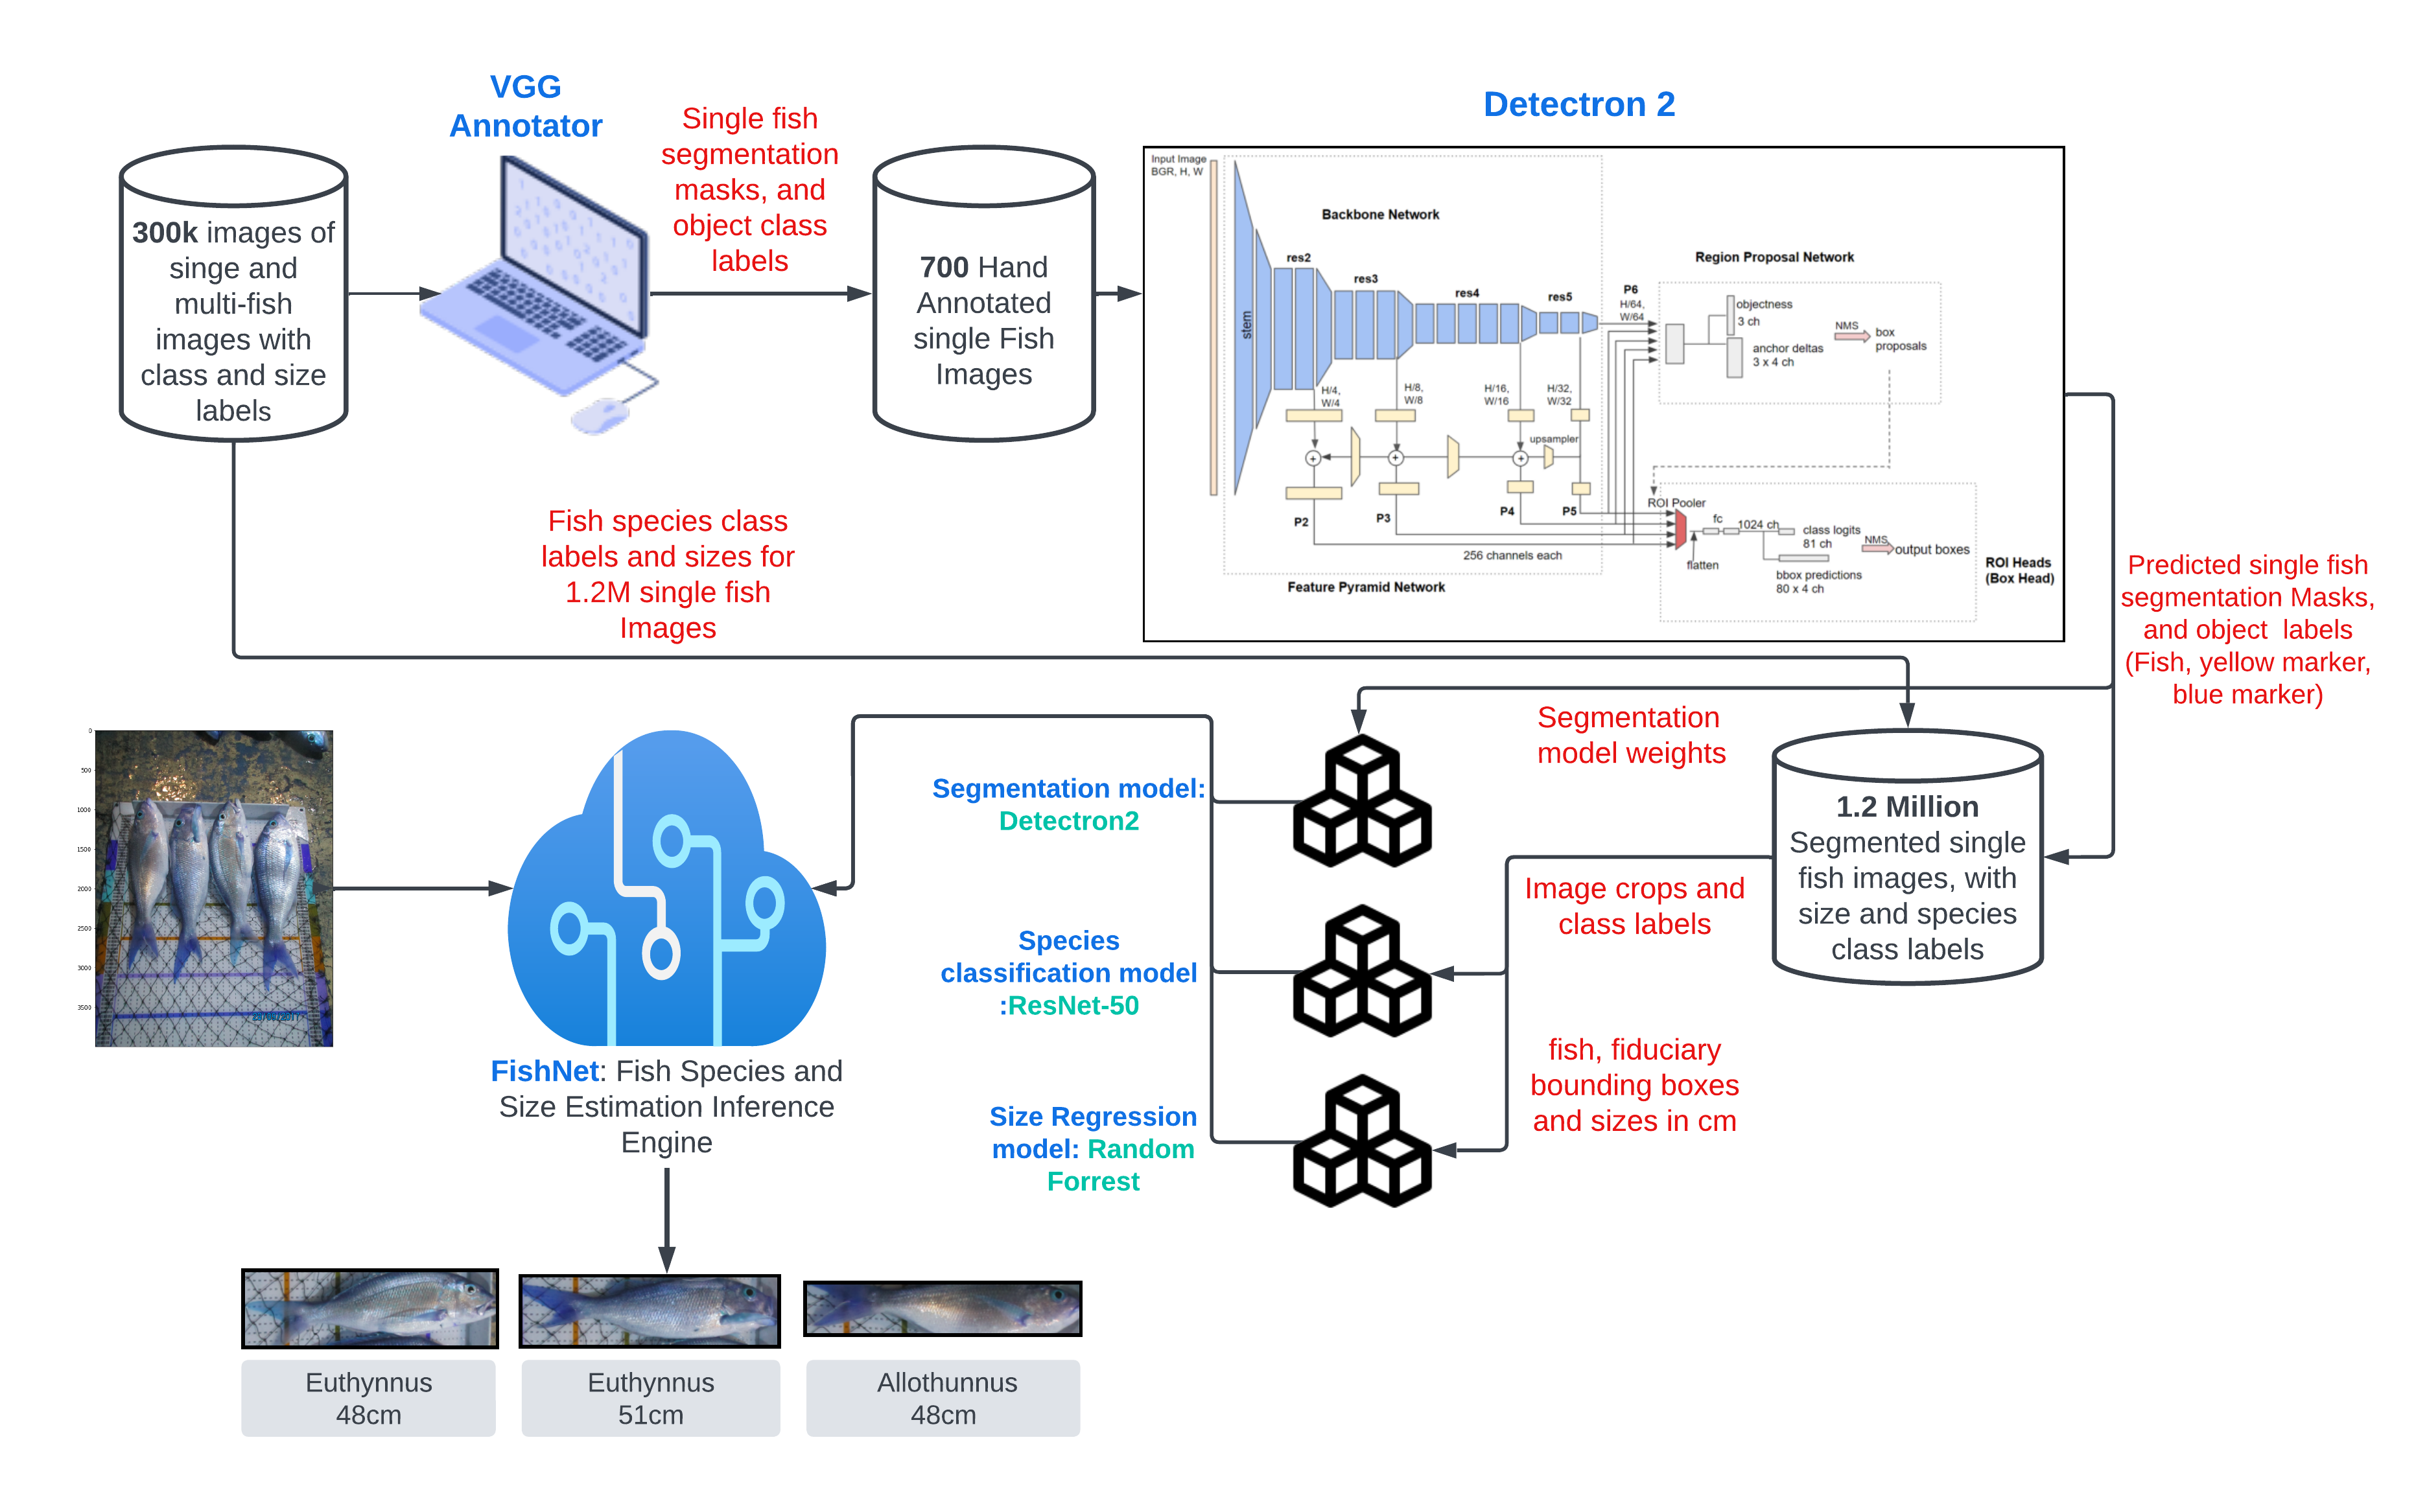
In this section, we outline the implementation details for data collection, image segmentation, classification, and fish length regression. Figure 2 portrays the complete FishNet system including the different models and outputs, along with the datasets used to train them.
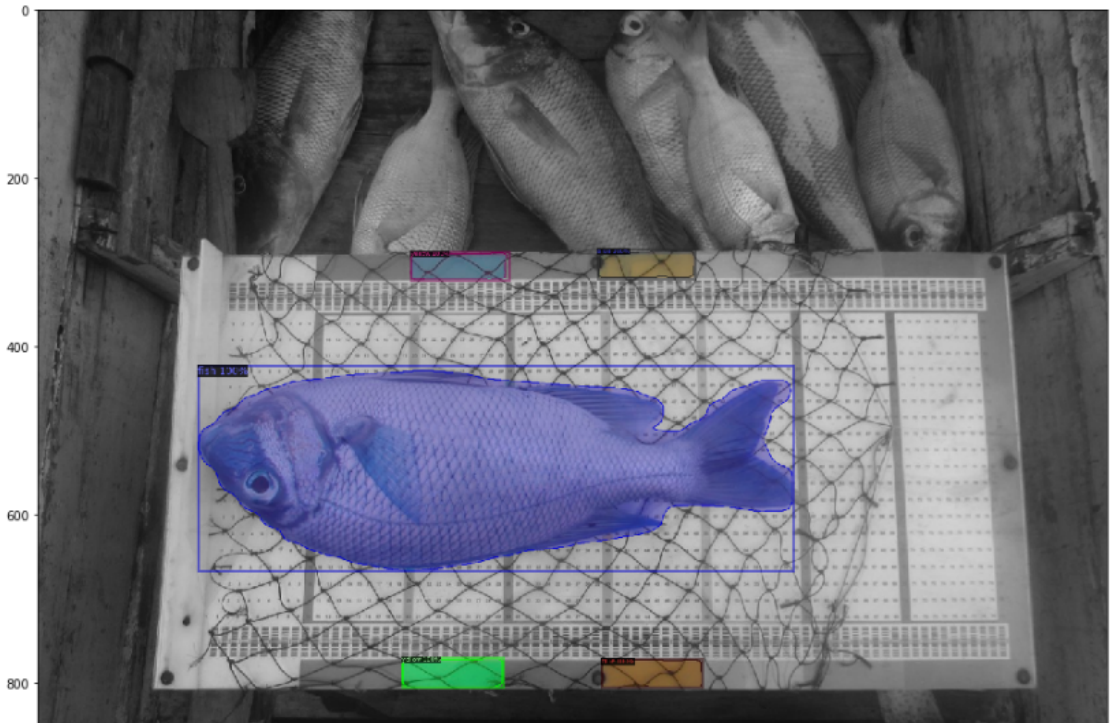
3.1 Data Collection
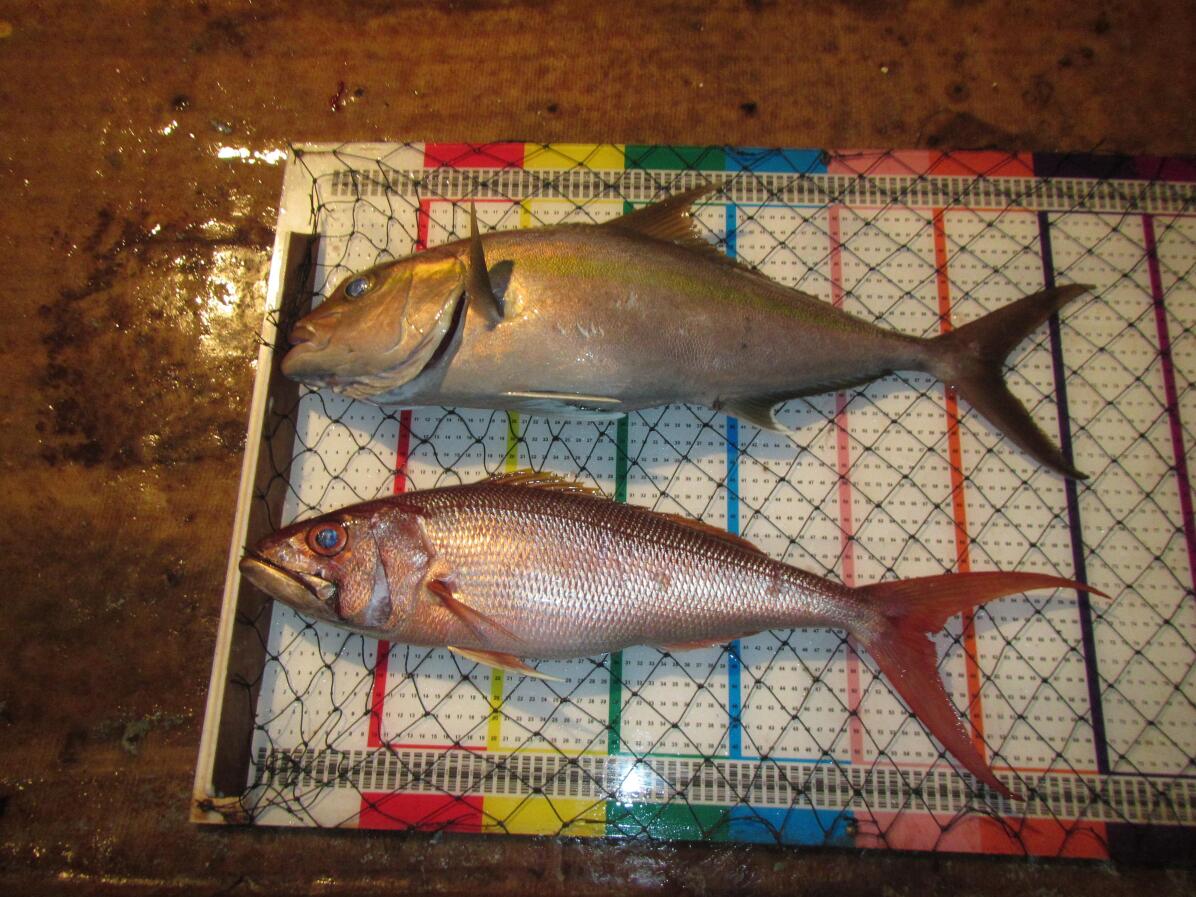
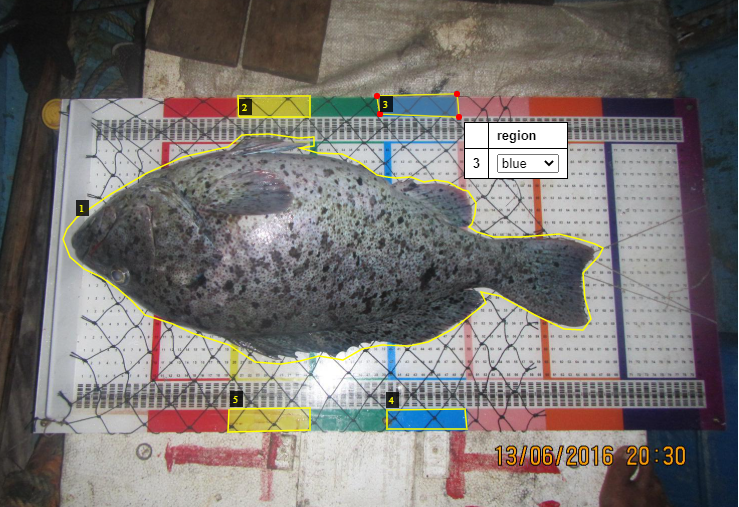
CODRS (Crew Operated Data Recording Systems) is a program run by The Nature Conservancy’s Indonesia office. Data on species and size distributions of catch (as needed for length-based stock assessments) are collected via photographs taken on digital cameras by crew onboard fishing vessels. The fish are positioned over standardized measuring boards (1-by-0.8m) before the photographs are taken so their length can be easily inferred (see Figure 3). The whiteboard, with multi-colored markings every 10 cm serves as a fiduciary marker for scale and perspective. The images often contain multiple fish and photographs are taken from a variety of distances, angles, and lighting conditions based. At the end of each month, the memory card from each camera is handed over for processing of the images by fish identification experts working for The Nature Conservancy. Processing includes identification of the species and length of the fish, double-checking by a data quality control coordinator, and storage in an online database known as i-Fish. Participation in the program is voluntary and fishers receive a stipend for participating. Over 300 vessels have cooperated and contributed to the database. From over 300,000 photographs, approximately million fish have been hand-labeled in this way, with 163 different species represented. Large-scale data-labeling projects nearly always contain some errors. In this work, one source of error is that photographs containing multiple fish are not always consistently labeled in the dataset in the same order/orientation relative to how fish are seen in the photograph. In most images, fish are labeled from top-to-bottom, left to right, but many examples were found in which this is not the case. Thus, the species annotations for images containing a single fish are assumed to be reliable, while the species annotations for images containing multiple fish are assumed to be noisy.
3.2 Image Segmentation
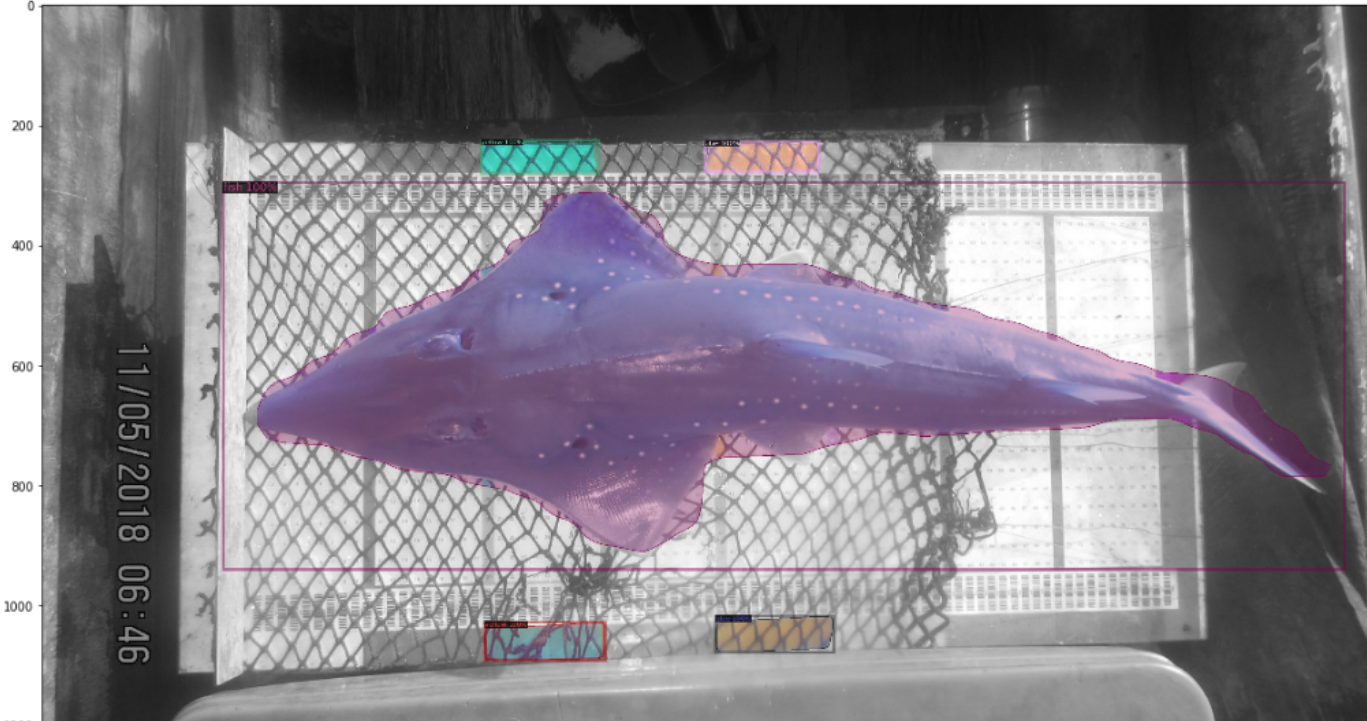
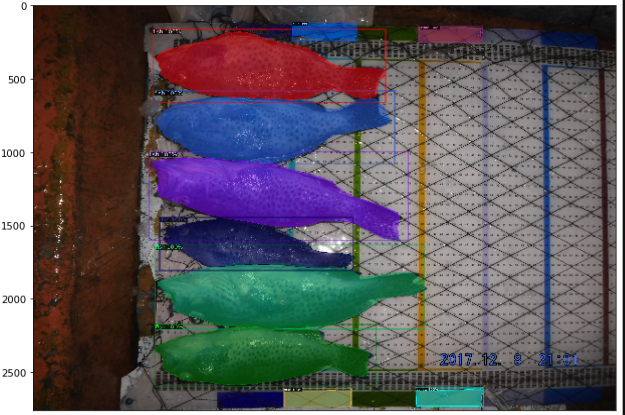
Since most images in our sample contain multiple fish, our approach first applies an object detection and segmentation model to localize and set a bounding box and a segmentation mask around individual fish and fiduciary color boxes. We then perform species classification and length regression for each detected fish. Separate machine learning models perform each of these three tasks. The detection and segmentation model is pre-trained on Microsoft Common Objects in Context (MS COCO) dataset and fine-tuned on a small dataset of images that we self-annotate. This is done by segmenting fish and a set of fiduciary markers: four 3-by-10 cm colored boxes (two yellow and two blue), that are located on the edges of the presentation board. These markers are chosen because at least one of the four is readily identifiable in most of the images. Using the Visual Geometry Group (VGG) Image Annotation (VIA) tool [20], we sampled 700 random images containing multiple fish of the same species in the same image, and we annotated these with polygon outlines of the three different types of object: (1) fish; (2) yellow colored boxes; (3) blue-colored boxes. When these objects are partially occluded (e.g. by humans, their shadows, or fishing nets), the shape of these objects is inferred by the annotator (Figure 5).
The annotations are used to fine-tune an object-recognition and segmentation model with a Resnet-50 backbone [21] using Facebook’s Detectron2 [6]. Detectron2, written in Pytorch, is a collection of re-implementations of state-of-the-art object-detection algorithms including the Mask R-CNN [22] model that we use in this work. Mask R-CNN trains a single convolutional neural network for pixel-wise segmentation, classification, and bounding box regression. In mask R-CNN, a pre-defined number of regions of interest (ROIs) are proposed, of adjacent pixels similar in color, texture, and intensity from the features learned by a stack of convolutional layers. The network is then trained to minimize the classification and segmentation losses of the best ROIs. Once ROIs with very high probabilities of containing objects are found, a fully connected layer is added to predict the x and y coordinates of a rectangular region that most tightly encloses the objects with high confidence. Given a new image, the trained model produces a list of detected objects, each with the following information: (1) the predicted class (fish, yellow color box, or blue color box) which comes from the softmax of the classification fully connected layer; (2) a bounding box that represents the smallest rectangular region that completely contains the detected object; (3) a pixel-wise segmentation mask; and lastly (4) an object-level classification. At inference time, the system uses the predicted segmentation mask to crop out images of individual fish, and these cropped images are used as input to the classification and size regression models.
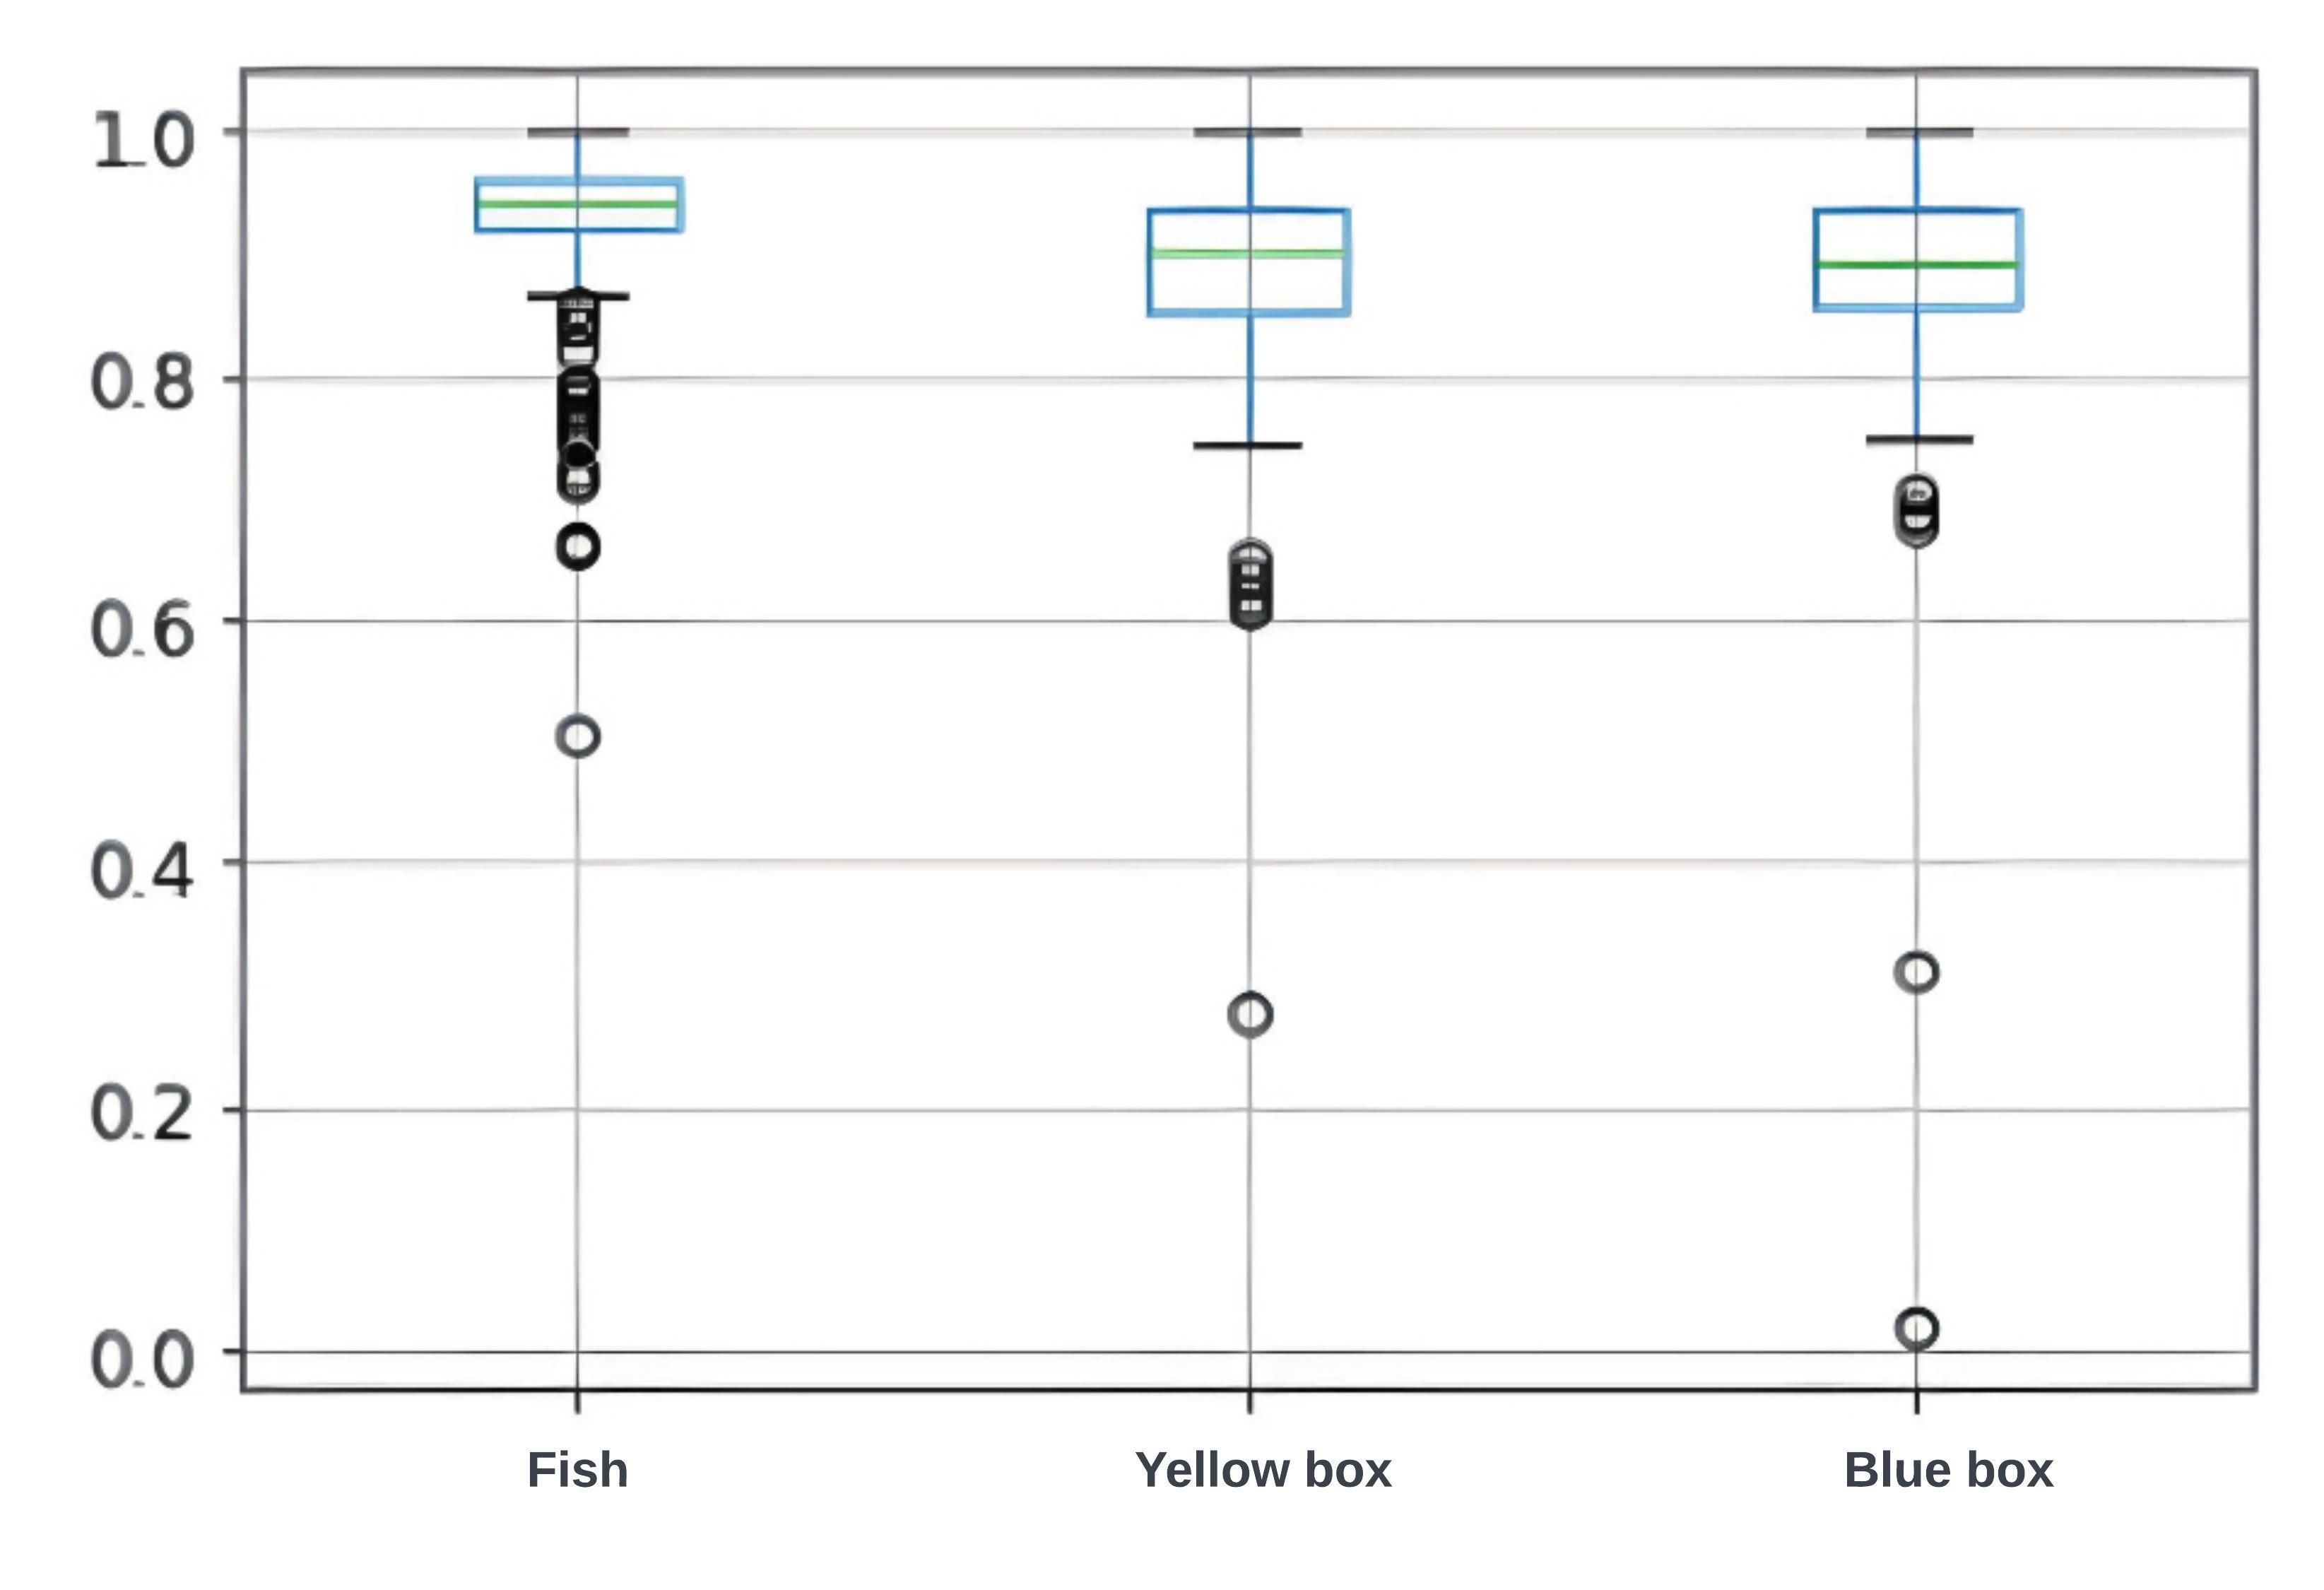
We evaluated the segmentation model in terms of accuracy and the Intersection over Union (IoU) score on the held-out validation set images. These metrics inform us of how often we are detecting and correctly assigning objects, as well as how well the segmentation mask covers the object since these outputs directly feed into the length estimation algorithm. A high IoU score (near ) means the bounding boxes fully and tightly enclose the fish, and this will result in better data for the downstream classification and regression tasks.
3.3 Species Classification
For species classification, we fine-tune a pre-trained ResNet-50 model on cropped images containing a single fish. This model is trained on the subset of 50,000 images that only contain a single fish (for which the species annotations are reliable). The baseline model is first trained on the whole image, including all the background surrounding the fish. Since the ultimate goal is to classify fish species even in cases where there are multiple fish in an image, we make use of the segmentation output of the Detectron2 model to crop out the bounding box and segmentation mask around each fish, as well as the locations of the colored fiduciary boxes. We use these as inputs in training the classifier and length estimation models. As a result, the second model is trained only on the area inside the bounding box containing the detected fish from the instance segmentation model. While the first model can capitalize on surrounding objects to better assign species classes, this is not always desirable as we need the model to actually only use fish image features and not background cues. For this reason, it is the latter of the two models that is better suited for application on images of more than one fish as it is trained purely on trimmed images of individual fish. We use 40,000 images (80%) for training, and a 10,000 (20%), as a held-out test set for evaluating the model. During training, several augmentation strategies are used to improve generalization; these are listed in Table 1.
| Transformation | Range/Value |
|---|---|
| Intensity normalization | [0,1] |
| Random Rotation | [0,] |
| Width, length, channel shift and random zoom | [0, 0.2] |
| Shear | [0, 0.3] |
| Feature-wise normalization and horizontal flip | Yes |
| Fill mode | nearest |
| Re-scale |
For species classification, We fine-tune a pre-trained ResNet-50 model on images of single fish for epochs using a dataset of images. The classifier is fine-tuned with a learning rate of 0.005. The learning rate is reduced linearly by when the validation set error does not decrease for 10 epochs. Model training was stopped after 100 epochs or when the validation loss does not decrease for 20 epochs. At inference time, no random transformations are applied, but the images are first cropped to the size of the bounding box of each segmented fish, then re-scaled to . For the training, validation, and test sets, all pixel values are divided by to be in the range .
3.4 Fish Size Estimation
Length regression is performed in two steps. First, we use the outputs of Detectron2 to detect and locate fish, and the colored fiduciary markers. The markers are of fixed and known size on every board, and thus provide scale information — our strategy is to detect these markings to aid in the length prediction task. For each image with one or more fish, we restrict the problem to images with at least one visible Fiduciary color marker, this is necessary as the images are not captured from a single view distance and angle. We then extract features from the output of the segmentation model based on the current image and use these to train a random forest regression model to predict the size of the fish in centimeters. This regression model takes in a list of features derived from segmentations. These features are listed below and include the lengths of the bounding boxes and segmentation masks of the fish and fiduciary markers, along with the confidence scores. Using the combination of these features adds redundancy and enables the model to make better predictions when there is occlusion or bad lighting.
-
1.
Color Boxes: Color box count, median color box length, mean color box length, median color box segment length, and maximum color box segment length.
-
2.
Detected Fish: The confidence score for each fish object, length of the bounding box around the fish, and length of the segment mask of the fish. We use both since the segmentation mask can sometimes be slightly shorter than the actual fish object as we do not achieve a 100% IoU on fish segmentation.
3.5 Multi-fish Classification
After running the fine-tuned Detectron2 model on the 1.2M dataset and achieving a fish detection rate of , we looked at the confusion matrix of the number of fish objects the model detects versus the actual number of objects in each image. This analysis is important in understanding the margin of error in the cases where we do not detect fish. It can also aid in discovering whether the model focuses only on fish on a board as trained, and not any other fish in the background outside the board as depicted in Figure 9(b) (a).
3.6 Multi-fish image dataset
The construction of this dataset depends heavily on the accuracies of two prior processes: (1) the process of labeling the fish by taxonomic experts and (2) how well the trained segmentation model generalizes to images with multiple fish. As mentioned before, assigning labels from a list onto each fish on multi-fish images turns out to have not always been done consistently during labeling. Some images are labeled top to bottom, while others bottom up or right to left depending on the orientation of the board and the position of the photographer when the picture was taken. Some engineering is required to be able to match fish to labels to a reasonable level of confidence though more work is still required due to noisy labels.
3.6.1 Fish to label matching
For images with one or two fish, matching the labels to the fish is trivial as there are only 1 or two possible combinations. In cases where the detection and segmentation model detects fewer fish than we have on a board, such images are excluded from our target dataset at this time. For images with three fish and above on a board, we use a trained single fish species classifier’s log-likelihood on each image and take the combination with the highest likelihood as the correct orientation. Once the dataset of 1.2M fish is labeled following this procedure, we then train a species classifier on it to achieve an top-1 accuracy. A likely reason for the drop in performance is the error inherent in our matching process. With these promising results on multi-fish images, we seek better ways of getting to a complete 1.2M fish dataset with little to no uncertainty in the labels. These features are used as inputs to a random forest regression model with trees, Gini criterion, a maximum tree depth of 10, and a mean squared error loss function. The model hyperparameters were selected using 5-fold cross-validation on the training set of images, then evaluated on the held-out test set of images.
4 Results
Using held out data for evaluation, we quantify each component of our system: detection, segmentation, species classification, and length regression. Since the annotations for multi-fish images are noisy, we perform separate experiments for images containing one vs. multiple fish.
4.1 Detection and Segmentation
The trained model is able to detect fish in the image of the time while detecting the fiduciary markers correctly of the time. The IoU of the predicted segmentation masks has a mean of (median ) for fish and a mean of (median ) for the fiduciary markers as depicted in the box and whisker plot in Figure 7. Figure 6 is an example of predictions on an image where a high IoU is achieved for all the fiduciary markers and fish on the board. The performance of the detection and segmentation model is important because it impacts the performance of the species classification and length regression models. A good IoU score means the bounding boxes fully and tightly enclose the fish, and this will result in better training data for length estimation in the case of single fish images. In the case of multi-fish images, both classification and regression are affected by a bad IoU from the Detectron2 in that having bounding boxes that do not tightly enclose the fish will result in an overestimation of the lengths, and lead to parts of one fish appearing in the crop of another fish that could be of a different species, hence making it harder to learn critical features that explain the differences in species.
4.2 Single Fish Length Regression
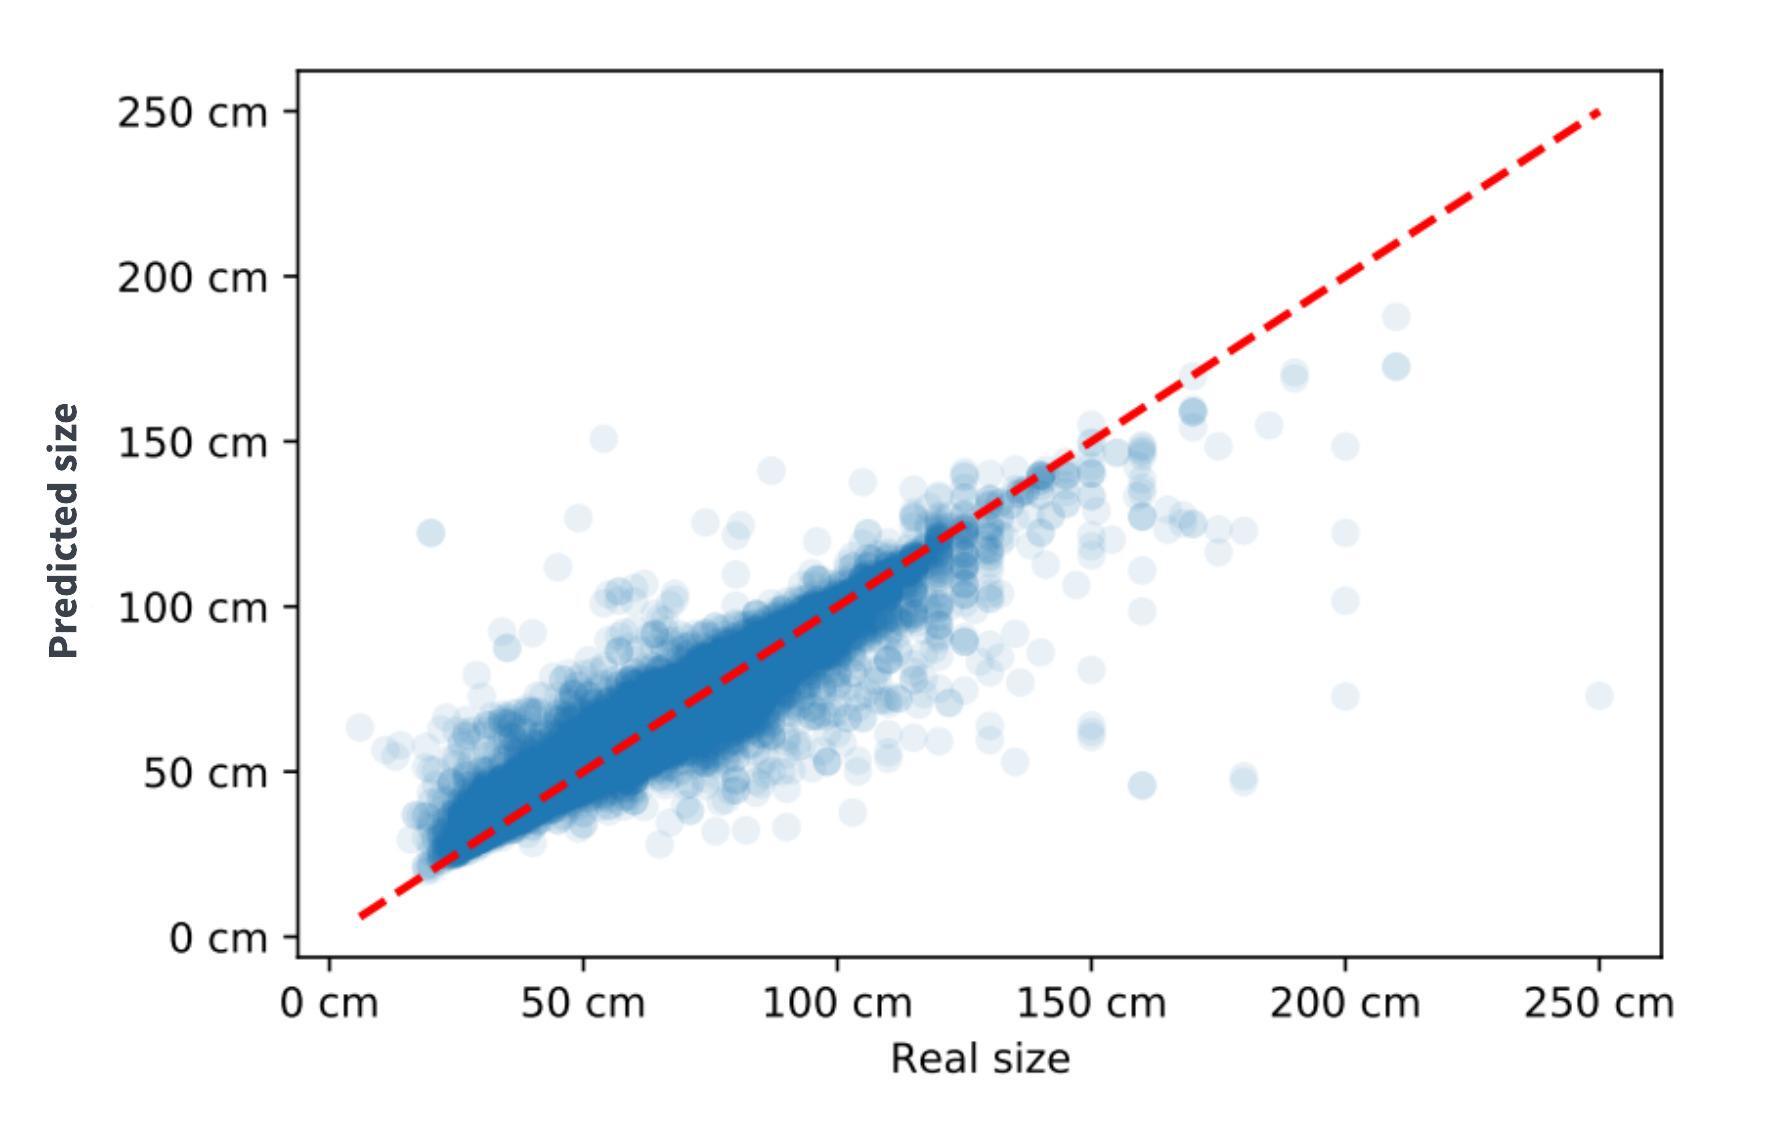
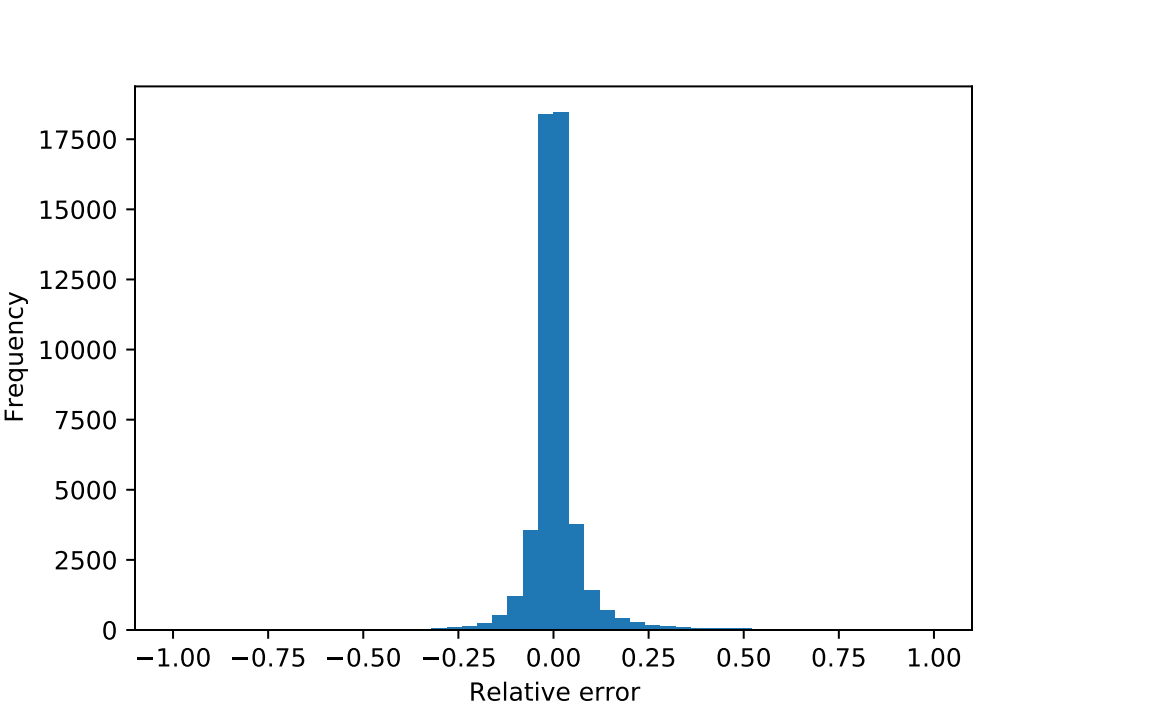
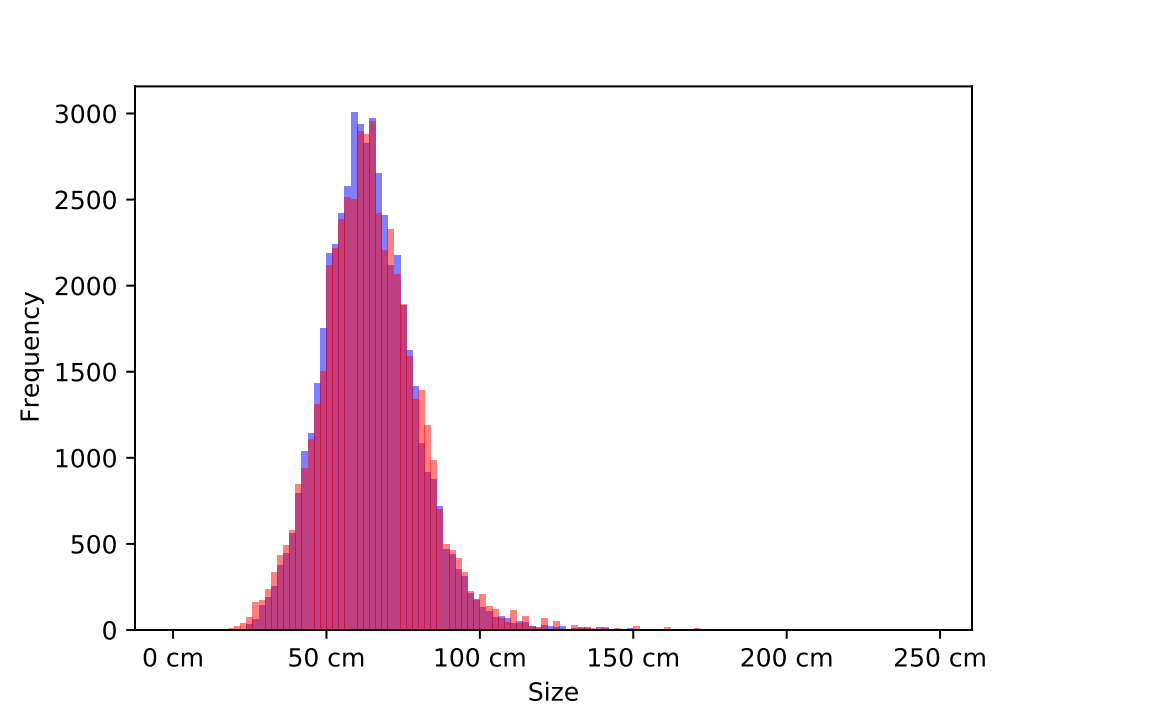
Five-fold cross-validation produced a Mean Absolute Error (MAE) of cm and a coefficient of determination () of 79%. Figure 8(c) (a) shows a scatter plot of the predicted lengths of the fish against the true labels on the validation set. In the figure, predictions are accurate, especially for mid-sized fish (60 - 100cm), which form the majority of the validation set as shown in the distribution of size in Figure 8(c) (c). On the longer end of the spectrum, the model tends to underestimate sizes, and this could primarily be due to a lack of large fish training examples for the model to learn from. This problem can be solved to a large extent by having more large fish in the training dataset or applying oversampling techniques on large fish images. Figure 8(c) (b) shows the relative errors are centered around zero with a very small deviation. Figures 8(c) (b) and 8(c) (c) both reveal that the errors are symmetrically distributed around zero. This is critical for accurate length-based fish stock assessment methods, which evaluate the proportion of a population above or below certain length-based thresholds (such as size-at-maturity). We can expect similar results on a larger dataset drawn from a reasonably similar distribution.
4.3 Multiple Fish
At this point, we only apply models trained on the single fish images to the complete dataset as a baseline with future improvements in mind that will be discussed in Section 5. In Figure 9(b)(b), out of the 300,000 images with multiple fish, we detect the exact number of fish in of prediction instances, predicting over the actual count in , and predicting less than the actual count in of images.
4.3.1 Multi-fish Classification
After running the fine-tuned Detectron2 model on the 1.2M dataset and achieving a fish detection rate of , we looked at the confusion matrix of the number of fish objects the model detects versus the actual number of objects in each image. This analysis is important in understanding the margin of error in the cases where we do not detect fish. It can also aid in discovering whether the model focuses only on fish on a board as trained, and not any other fish in the background outside the board as depicted in Figure 9(b) (a).
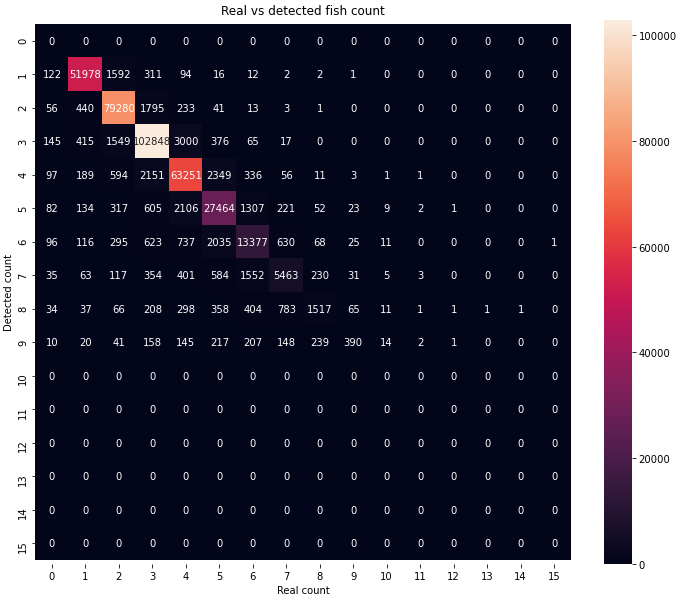
The confusion matrix heat-map in Figure 9(b) (b), illustrates that the detection model is mostly off by or fish when it under or over-predicts fish instances. It also shows that the more fish on a board, the more likely the model is to predict the wrong count of fish objects. This happens more often with smaller-sized fish than it does with larger fish as more small fish can be placed on a board in such a manner that they overlap. The single fish dataset is only a small subset of the larger dataset of 300,000 images containing 1.2 million fish. The whole dataset is labeled and represents the largest known annotated collection for the tasks of fish species classification and length regression. The labels for images with a large number of fish on one board are not straightforward to assign to the placement of fish on the board, so some level of analysis is required to assign the labels correctly. With further fine-tuning of the segmentation model, we are able to run species classification and length regression on each fish instance in a picture. This allows us to train both the classifier and length estimator on a much larger dataset of 1.2 million fish. Table 2 shows classification accuracy results on the complete 1.2M dataset. Performance on images with one or two fish is consistent and slightly better than that on the validation split of the 50,000 single fish images discussed in Section 3.3. Performance drops significantly from three fish upwards. This can be explained by the observation that it is smaller fish that are packed onto the board in groups of three or more, and these smaller-sized fish are not very well represented in the single fish images training data, as can be seen in the size distribution in Figure 8(c) (c). To combat this problem, we seek to compile a dataset of all M fish images, extracted using the trained segmentation model, and cropped out as individual fish. Once this dataset is compiled, it will form the largest labeled dataset of fish images with over 160 different species represented.
| Number of Fish | 1 | 2 | 3 | 4 | 5 | 6 | 7 |
| Top-1 Accuracy % | 95 | 91 | 81 | 72 | 68 | 68 | 66 |
5 Discussion and Future Research
This paper presents methods and results for object detection, fish species classification, and size estimation through transfer learning on a large collection of fish images generously provided by Yayasan Konservasi Alam Nusantara. It also introduces work being done towards the “ImageNet of fish: FishNet, a large collection of labeled fish images”. This will greatly improve the predictive capabilities of DL models for marine life that could eventually be deployed to help in fish stock assessments, greatly reducing both the time and cost required to perform assessments. We make the trained segmentation and classification models publicly available on Hugging Face. Based on our findings, an avenue for future research involves considering deep learning-based algorithms in the presence of label noise, as well as deep active learning methods for image segmentation and classification with a noisy labeling oracle [23, 24, 25]. Considering the considerable progress in contrastive learning, we hypothesize the use of semi-supervised representation learners as well as noise-robust learning algorithms would be useful for making progress in fish stock estimation with the use of DL models [26], especially in the label noise setting.
Acknowledgement
We acknowledge the David and Lucile Packard Foundation for supporting this experiment and the CODRS data collection program (run by Yayasan Konservasi Alam Nusantara). The CODRS program has also received support from the Walton Family Foundation and the USAID Indonesia SNAPPER program(Cooperative Agreement No. AID497A1600011). We wish to thank technicians from People and Nature Consulting International for their help with the collection and labeling of the images. We also thank the group of over 500 Indonesian fishers who took pictures of their catch during their work at sea.
References
- [1] Boris Worm, Edward B Barbier, Nicola Beaumont, J Emmett Duffy, Carl Folke, Benjamin S Halpern, Jeremy BC Jackson, Heike K Lotze, Fiorenza Micheli, Stephen R Palumbi, et al. Impacts of biodiversity loss on ocean ecosystem services. Science, 314(5800):787–790, 2006.
- [2] Boris Worm, Ray Hilborn, Julia K Baum, Trevor A Branch, Jeremy S Collie, Christopher Costello, Michael J Fogarty, Elizabeth A Fulton, Jeffrey A Hutchings, Simon Jennings, et al. Rebuilding global fisheries. Science, 325(5940):578–585, 2009.
- [3] Christopher Costello, Daniel Ovando, Ray Hilborn, Steven D Gaines, Olivier Deschenes, and Sarah E Lester. Status and solutions for the world’s unassessed fisheries. Science, 338(6106):517–520, 2012.
- [4] R. Merrick and R. Methot. Noaa’s cost of fish stock assessments. National Oceanic and Atmospheric Administration, 2016.
- [5] Mónica Pérez-Ramírez, Mauricio Castrejón, Nicolás L Gutiérrez, and Omar Defeo. The marine stewardship council certification in latin america and the caribbean: A review of experiences, potentials and pitfalls. Fisheries Research, 182:50–58, 2016.
- [6] Yuxin Wu, Alexander Kirillov, Francisco Massa, Wan-Yen Lo, and Ross Girshick. Detectron2. https://github.com/facebookresearch/detectron2, 2019.
- [7] E. Prasetyo, N. Suciati, and C. Fatichah. Multi-level residual network vggnet for fish species classification. Journal of King Saud University - Computer and Information Sciences, 34(8, Part A):5286–5295, 2022.
- [8] R. Dhruv, J. Sushant, and S. Indu. Underwater fish species classification using convolutional neural network and deep learning. In 2017 Ninth International Conference on Advances in Pattern Recognition (ICAPR), pages 1–6, 2017.
- [9] C. Guang, S. Peng, and S. Yi. Automatic fish classification system using deep learning. In 2017 IEEE 29th International Conference on Tools with Artificial Intelligence (ICTAI), pages 24–29, 2017.
- [10] U. Oguzhan, K. Diclehan, and T. Mehmet. A large-scale dataset for fish segmentation and classification. In 2020 Innovations in Intelligent Systems and Applications Conference (ASYU), pages 1–5, 2020.
- [11] B. Amanullah, A. Mushstaq, G. Faqir, B. Sadia, and A. Ibrar. Fish image segmentation algorithm (fisa) for improving the performance of image retrieval system. International Journal of Advanced Computer Science and Applications, 8, 01 2017.
- [12] Hongwei Qin, Xiu Li, Jian Liang, Yigang Peng, and Changshui Zhang. Deepfish: Accurate underwater live fish recognition with a deep architecture. Neurocomputing, 187:49–58, 2016.
- [13] Jessica Yun-Heh Chen-Burger, Robert Fisher, Daniela Giordano, Lynda Hardman, and Fang-Pang Lin. Fish4Knowledge Ground-Truth dataset. Online, 2012. Available at: https://homepages.inf.ed.ac.uk/rbf/fish4knowledge/.
- [14] V. Kandimalla, M. Richard, F. Smith, J. Quirion, L. Torgo, and C. Whidden. Automated detection, classification and counting of fish in fish passages with deep learning. In Frontiers in Marine Science, 2022.
- [15] Rod Connolly, David Fairclough, Eric Jinks, Ellen Ditria, Gary Jackson, Sebastian Lopez-Marcano, Andrew Olds, and Kristin Jinks. Improved accuracy for automated counting of a fish in baited underwater videos for stock assessment. Frontiers in Marine Science, 8, 10 2021.
- [16] Garcia-D’Urso Nahuel, Alejandro Galán Cuenca, Paula Pérez-Sánchez, Pau Climent i Pérez, Andrés Guilló, Jorge Azorin-Lopez, Marcelo Saval-Calvo, Juan Guillén-Nieto, and Gabriel Soler-Capdepón. The deepfish computer vision dataset for fish instance segmentation, classification, and size estimation. Scientific Data, 9:287, 06 2022.
- [17] A. Alvarez-Ellacurı´a1, M. Palmer1, I. Catala´n, and J. Lisani. Image-based, unsupervised estimation of fish size from commercial landings using deep learning. ICES Journal of Marine Science (2020), 77(4):1330–1339, 2019.
- [18] G. Monkman, K. Hyder, M.J. Kaiser, and F. Vidal. Using machine vision to estimate fish length from images using regional convolutional neural networks. Methods in Ecology and Evolution), 10(12):2045–2056, 2019.
- [19] G. Monkman, K. Hyder, M.J. Kaiser, and F. Vidal. Accurate estimation of fish length in single camera photogrammetry with a fiducial marker. ICES Journal of Marine Science (2020), 77(6):2245–2254, 2020.
- [20] Abhishek Dutta and Andrew Zisserman. The VIA annotation software for images, audio and video. In Proceedings of the 27th ACM International Conference on Multimedia, 2019.
- [21] Kaiming He, Xiangyu Zhang, Shaoqing Ren, and Jian Sun. Deep residual learning for image recognition. In Proceedings of the IEEE conference on computer vision and pattern recognition, pages 770–778, 2016.
- [22] K. He, G. Gkioxari, P. Dollár, and R. Girshick. Mask r-cnn. In 2017 IEEE International Conference on Computer Vision (ICCV), pages 2980–2988, 2017.
- [23] B. Han, Q. Yao, X. Yu, G. Niu, M. Xu, W. Hu, I. Tsang, and M. Sugiyama. Co-teaching: Robust training of deep neural networks with extremely noisy labels. In 32nd Conference on Neural Information Processing Systems, NIPS’18, pages 8536–8546. Curran Associates Inc., 2018.
- [24] Z. Chicheng and C. Kamalika. Active learning from weak and strong labelers. In C. Cortes, N. Lawrence, D. Lee, M. Sugiyama, and R. Garnett, editors, Advances in Neural Information Processing Systems, volume 28. Curran Associates, Inc., 2015.
- [25] D. Jun and L.C X. Active learning with human-like noisy oracle. In 2010 IEEE International Conference on Data Mining, pages 797–802, 2010.
- [26] Z. Evgenii, B. Chaim, M. Avi, B. Alex, and L. Or. Contrast to divide: Self-supervised pre-training for learning with noisy labels. In 2022 IEEE/CVF Winter Conference on Applications of Computer Vision (WACV), pages 387–397, 2022.