Attractive carbon black dispersions: structural and mechanical responses to shear
Abstract
The rheological behavior of colloidal dispersions is of paramount importance in a wide range of applications, including construction materials, energy storage systems and food industry products. These dispersions consistently exhibit non-Newtonian behaviors, a consequence of intricate interplays involving colloids morphology, volume fraction, and inter-particle forces. Understanding how colloids structure under flow remains a challenge, particularly in the presence of attractive forces leading to clusters formation. In this study, we adopt a synergistic approach, combining rheology with ultra small-angle X-ray scattering (USAXS), to probe the flow-induced structural transformations of attractive carbon black (CB) dispersions and their effects on the viscosity. Our key findings can be summarized as follow. First, testing different CB volume fractions, in the high shear rate hydrodynamic regime, CB particles aggregate to form fractal clusters. Their size conforms to a power law of the shear rate, , with . Second, drawing insights from the fractal structure of clusters, we compute an effective volume fraction and find that microstructural models adeptly account for the hydrodynamic stress contributions. We identify a critical shear rate and a critical volume fraction , at which the clusters percolate to form a dynamical network. Third, we show that the apparent yield stress measured at low shear rates inherits its properties from the percolation point. Finally, through data scaling and the integration of the Einstein’s viscosity equation, we revisit and discuss the Caggioni-Trappe-Spicer model, revealing a significant connection between its empirical parameters and the structural properties of CB dispersions under flow.
I Introduction
Colloidal dispersions are encountered in numerous application fields, for instance as cement paste in construction industry Chougnet et al. (2008), as drilling muds during extraction operations Morariu, Teodorescu, and Bercea (2022), as flowable electrodes used for energy storage Alfonso et al. (2021), or as oil in water emulsions in food industry Genovese, Lozano, and Rao (2007); Xi et al. (2019). In the aforementioned examples, predicting and controlling the viscosity of the dispersions is of key importance to optimize their use. The rheological behavior of colloidal dispersions is usually non-Newtonian, and depends on the shape, volume fraction and interaction potential between the particles Mewis and Wagner (2011). In scenario with low volume fractions and strong attractive forces, colloidal dispersions become unstable, and particles of radius aggregate into "flocs" or "clusters" of radius . These clusters exhibit a fractal structure and the number of particles in a cluster scales as Lazzari et al. (2016):
| (1) |
with the fractal dimension of clusters. Because of their fractal nature, clusters cannot continue growing indefinitely as the volume they occupy increases faster than the available space. Therefore, there may come a point where the spheres enclosing the clusters reach a random close packing limit. At this limit, the spatial separation between the clusters approaches zero, allowing them to interconnect through the outermost particles on their respective surfaces Zaccone et al. (2014). This outcome is valid at rest Haw et al. (1995) and under shear Xie et al. (2010). The shear-dependent structure of clusters is a crucial factor for understanding the dispersion properties, whether the dispersion is at rest or subjected to shear.
Under quiescent conditions, aggregation is driven by the thermal energy. The aggregation rate is either limited by particles diffusion Weitz and Oliveria (1984) or by the reaction probability upon collision Schaefer et al. (1984), leading to loosely structured clusters Lazzari et al. (2016) with . When the volume fraction is sufficiently high, further aggregation of clusters leads to the formation of a space-spanning network called a "gel", that displays an elastic modulus and a yield stress Trappe and Sandkühler (2004).
When attractive dispersions experience flow, clusters tend to condense, resulting in Sonntag and Russel (1986); Zaccone et al. (2009); Massaro et al. (2020). The equilibrium cluster size is determined by the balance between the viscous drag force acting on a particle () and the attractive forces holding particles together (). This balance is quantified by the Mason number, expressed as Mewis and Wagner (2009):
| (2) |
with (m) the particle radius, the shear rate and a viscosity that we will define later. (N.m) and (m) are the depth and width of the attractive interaction potential, respectively. An important question revolves around the nature of the viscous force involved in Eq. 2 and the stress experienced by clusters. From the dependence of the cluster size with the shear rate, it was argued that clusters are sufficiently distant, and that the fluid stress was the primary factor Sonntag and Russel (1986); Varga and Swan (2018) with the viscosity of the background fluid. An alternative proposition suggests that interactions between clusters would lead to a substantial increase in hydrodynamic stress Hipp, Richards, and Wagner (2021) and that the dispersion viscosity that must be taken into account in Eq. 2 to explain the equilibrium cluster size. This debate underscores the complex interplay of factors involved in cluster formation and behavior in attractive colloidal dispersions submitted to flow. The choice between the fluid stress or the dispersion stress as the key determinant might depends on the characteristics of the dispersion system and the experimental conditions. In all cases, the Mason number was effectively reported to control the cluster size at high shear Bouthier et al. (2023); Hipp, Richards, and Wagner (2021); Varga and Swan (2018).
Under this framework, the structuring degree of the dispersion is set by the flow, and in return the flow is affected by the structure of the dispersion. These reversible and time-dependent flow-induced structural changes are called "thixotropy" Mewis and Wagner (2009). Macroscopically, attractive dispersions usually show two regimes, depending on the value. At high , the shear rate dependence of the cluster size leads to a shear thinning behavior and the clusters size was reported to scale as
| (3) |
where is the breaking exponent. There are yet no consensus on the value of the breaking exponent . Wessel and Ball Wessel and Ball (1992) first proposed that the maximum cluster size should scale with the hydrodynamic stress with . More complex models distinguish highly deformable clusters from rigid clusters, yielding and , respectively Snabre and Mills (1996); Potanin (1993). Recently, Bouthier et al. Bouthier et al. (2023) proposed that should vary with the fractal dimension of clusters, with . Besides analytical calculations, experiments Hipp, Richards, and Wagner (2021); Sonntag and Russel (1986); Hunter and Frayne (1980); Brakalov (1987) and simulation Varga and Swan (2018); Ruan, Chen, and Li (2020) results have reported values for ranging from 0.2 to 1. At low values of , the cluster size becomes independent of the shear rate Varga and Swan (2018) as clusters fill the space, forming a transient network and leading to an apparent yield stress . Varga and Swan Varga and Swan (2018) proposed that percolation would occur at a critical value of the Mason number, with the volume fraction of particles.
In practice, the rheological properties of attractive dispersions are assessed by applying a given shear rate and measuring the resulting stress with . To assess the dependence of the dispersions viscosity with the shear rate, a flow curve test is commonly conducted. This test consists in applying a stepwise increment in shear rate with a given step duration . Due to the thixotropic nature of attractive dispersions, a finite amount of time is necessary to reach the equilibrium viscosity. Consequently, a rapid increase in shear rate will only characterize the transient viscosity. Flow curves, whether represented as or , are usually described using the Herschel-Bulkley model Herschel and Bulkley (1926):
| (4) |
where is the yield stress (Pa), a critical shear rate and an empirical exponent. This empirical model effectively captures both the yield stress and the shear-thinning behavior of attractive dispersions with . However, it does not provides any microscopic interpretation of its parameters as it dismiss the cluster properties. In more developed models, like structural kinetics model Mewis and Wagner (2009), the rheological parameters of the constitutive equation are set as a function of a structural parameter , comprised between 0 and 1 for a totally broken or fully developed cluster structure, respectively. By introducing kinetics equation for , the structural kinetics models efficiently capture the time-dependent properties of dispersions, but the parameter cannot be easily related with any physical aspects of the microstructure. In population balanced models Jeldres, Fawell, and Florio (2018), a partial differential equation tracks the evolution of the size distribution function with respect to time. The equation includes terms that represent the rates of various particle interactions or transformations. Solving this equation provides insights into the evolution of the distribution of particle sizes over time and under different flow conditions.
In this study, we choose to focus on microstructural models, which directly rely on structural changes that can experimentally be measured. In such models, the shear stress is decomposed as a sum of an elastic and an hydrodynamic contribution, so that . The elastic stress originates from the network and is typically treated as a constant, derived from the particle interactions and the cluster properties De Rooij et al. (1994); Potanin et al. (1995). The hydrodynamic stress is calculated by introducing an effective volume fraction of clusters . is the equivalent volume fraction of spheres, considering the fractal structure of clusters De Rooij et al. (1994); Potanin et al. (1995); Wolthers et al. (1996):
| (5) |
where is the volume fraction of primary particles and is a scaling constant usually approximated as unity. Then, various models have been used to relate with the viscosity of the dispersion Quemada and Berli (2002); Silbert, Melrose, and Ball (1999); Mewis and Wagner (2009); Varadan and Solomon (2001). Assuming that the viscosity dependence on the volume fraction follows the one of a hard sphere dispersion, a generalized viscosity equation for concentrated regimes can be used, Quemada (1978); Genovese (2012) such as the one proposed by Krieger and Dougherty Krieger and Dougherty (1959):
| (6) |
with the maximum packing fraction of hard spheres, typically .
In summary, a significant body of work aimed to establish connections between the cluster properties and the viscosity of colloidal dispersions. However, few studies have probed both aspects simultaneously and structural characterizations are lacking. Consequently, the validity of microstructural models has not been thoroughly tested Mewis and Wagner (2009) and some questions have still to be answered: How the cluster properties change with shear rate? Are cluster properties driven by stress or shear rate? Is the decomposition of the stress into an elastic and hydrodynamic contribution sufficient to model a flow curve?
To address these questions, we follow an experimental approach with carbon black (CB) dispersions in oil, chosen as study model. Such dispersions present peculiar and fundamental rheological properties Gibaud, Divoux, and Manneville (2020); Richards, Ramos, and Liu (2023); Trappe and Weitz (2000) including rheopexy Ovarlez et al. (2013); Helal, Divoux, and McKinley (2016); Hipp, Richards, and Wagner (2019), delayed yielding Gibaud, Frelat, and Manneville (2010); Grenard et al. (2014), fatigue Gibaud et al. (2016); Perge et al. (2014), rheo-conductive properties Richards et al. (2017), sensitivity to flow cessations Dagès et al. (2022); Bouthier and Gibaud (2023) and rheo-acoustic properties Gibaud et al. (2020); Dagès et al. (2021). Furthermore, CB dispersions directly find utility in numerous applications such as ink Liu et al. (2021), cement Li, Xiao, and Ou (2006) or semi-solid flow batteries Liu and Richards (2023).
The paper is structured as follows. We initially characterize the flow properties of CB dispersions using rheology across a range of volume fractions spanning from 0.6% to 4.1%. Then, we examine the structural features of these dispersions under flow conditions using ultra small-angle X-ray scattering (USAXS) Panine, Gradzielski, and Narayanan (2003). Finally, we establish a relationship between the shear-dependent viscosity of the dispersions and their structural parameters by employing microstructural models.
II Material and methods
II.1 Carbon black dispersions
CB particles (Vulcan®PF, Cabot, density ) were dispersed in mineral oil (RTM17 Mineral Oil Rotational Viscometer Standard, Paragon Scientific, viscosity mPa.s at C, density ) at mass fractions ranging from 1.5 to 10 () Dagès et al. (2022). The corresponding volume fractions of CB particles were calculated as . After mixing, dispersions were sonicated during 2h in an ultrasonic bath (Ultrasonic cleaner, DK Sonic®, United-Kingdom) to ensure that all particles were fully dispersed.
II.2 Rheology
Experiments were carried out with two stress controlled rheometers: () a Haake RS6000 (Thermo Scientific) and () a MCR 301 (Anton Paar), both equipped with a Couette geometry composed of concentric polycarbonate cylinders (inner diameter 20 mm, outer diameter 22 mm and height 40 mm).
All rheological measurements were performed at 25∘C. After loading the CB dispersion, a preshear, s-1, was first applied during 60 s to erase any shear history. Then, a flow curve test was performed by ramping downward from 1000 to 0.01 s-1 (10 pts per decade) with a duration s/pts and measuring the resulting stress . A downward ramping of the shear rate was chosen to prevent heterogeneous flows (e.g. shear banding) usually observed for yield stress fluids in the vicinity of the yield stress Divoux, Grenard, and Manneville (2013). We varied and probed 50 and 100 s/pts and found that the flow curves were identical down to s-1 (see Appendix, Fig. 6). For shear rates s-1 a stationary regime is rapidly found as observed in Dagès et al. (2022). Below s-1, the rheology is not stationary and wall slip, sedimentation Hipp, Richards, and Wagner (2019) or shear banding Gibaud, Frelat, and Manneville (2010) may occur. It is noteworthy that Hipp et al. Hipp, Richards, and Wagner (2021) also performed flow curve tests on CB dispersions. However, they constructed "self-similar flow curves" through a series of rheological measurements that differ from a continuous ramping of the shear rate as performed here. Consequently, the shear history undergone by the CB dispersions before each shear rate is significantly different.
II.3 Ultra Small angle X-ray scattering (USAXS)
The microstructural characteristics of the CB dispersion were probed using rheo-USAXS measurements conducted at the ID02 beamline within the European Synchrotron Radiation Facility (ESRF) in Grenoble, France Narayanan et al. (2022). The incident X-ray beam, with a wavelength of 0.1 nm, was collimated to dimensions of 50 m vertically and 100 m horizontally. Utilizing an Eiger2 4M pixel array detector, two-dimensional scattering patterns were acquired. The subsequent data reduction process is detailed in Panine, Gradzielski, and Narayanan (2003). The scattering intensity was derived by subtracting the two-dimensional scattering profiles of the carbon black dispersions and the mineral oil. Importantly, the resulting scattering intensity remained isotropic throughout this study (see Appendix, Fig. 9) and an azimuthal average was performed to obtain a one-dimensional . Measurements were conducted in both radial and tangential configurations, yielding equivalent results due to the isotropic nature of the dispersions microstructure over the tested -range.
II.4 Transmission electron microscopy
A diluted dispersion of CB in absolute ethanol () was prepared and 5 µL were deposited on a carbon grid (Carbon Film CF300-Cu, Electron Microscopy Science, England) and left to dry in a dust free environment. Individual CB particles were then imaged by transmission electron microscopy (TEM) using a JEOL JEM 1400 microscope. A representative set of CB particle images is displayed in Fig. 8 in Appendix.
II.5 Characterization of carbon black particles
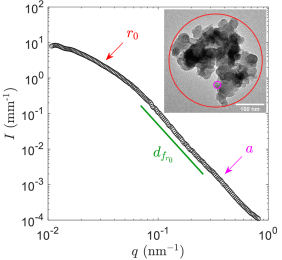
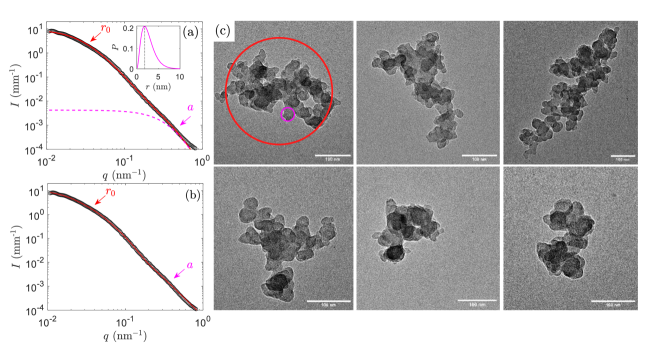
The CB particles were analyzed using TEM and USAXS. As shown in the TEM images in inset of Fig.1, CB particles are composed of nodules of radius that are fused to form primary aggregates of radius Dannenberg, Paquin, and Gwinnell (2000). These two length scales, and nm-1 are also identified on the form factor of the CB particles, measured on a diluted sample ( 10-4) at rest (Fig.1). The power law scaling at intermediate is related to the fractal dimension of the primary aggregates . Having tested different models to fit the USAXS data (see Fig. 8 in Appendix), we estimate nm, nm and . Vulcan PF particles are therefore small and compact aggregates in comparison with other CB particles previously reported (e.g. nm for Vulcan XC-72 Richards et al. (2017); Dagès et al. (2021)). We note that the flow does not impact the integrity of CB particles, as evidence in Fig. 3a-b, where remains constant for nm-1.
III Results and discussion
III.1 Rheological properties of carbon black dispersions
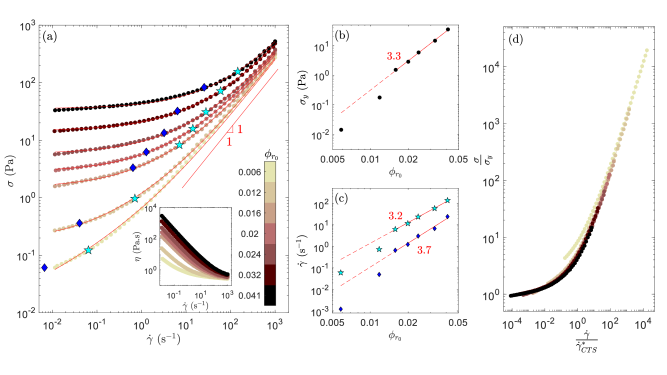
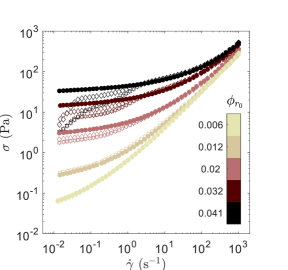
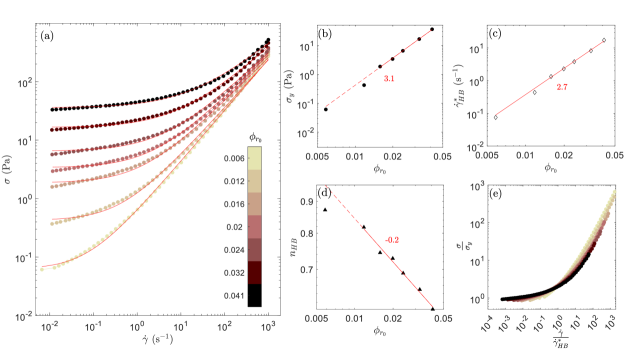
We first examine the influence of the particles volume fraction on the flow behavior of the CB dispersions. Fig. 2a displays the flow curves for dispersions with ranging from 0.6 to 4.1%. In Fig. 2a, the flow curve exhibits a similar trend for all the tested volume fractions: a shear-thinning behavior at high shear rates and the presence of a dynamic yield stress at low shear rates. The dynamic yield stress increases with (Fig. 2b) and its existence can even be debated at the lowest volume fraction (). Dynamic oscillatory shear experiments indicate that the minimum particle volume fraction required to form a gel is , a value consistent across different pre-shear histories (data not presented).
To quantitatively assess the impact of on the flow curves, two empirical models were employed: the Herschel-Bulkley Herschel and Bulkley (1926) model and the Caggioni-Trappe-Spicer model Caggioni, Trappe, and Spicer (2020). The Herschel-Bulkley model fit is not entirely satisfactory, especially for (see Appendix, Fig. 7). Improved fits are obtained with the Caggioni-Trappe-Spicer model (CTS) Caggioni, Trappe, and Spicer (2020):
| (7) |
where is the yield stress (Pa), a critical shear rate (s-1) and a viscosity (Pa.s). In addition to taking into account the elastic component represented by the yield stress , this model incorporates a Newtonian viscous stress at high shear rates, . Furthermore, it introduces a "plastic" dissipation mechanism, where the stress scales with the square root of the shear rate, serving as an intermediate regime between the purely viscous and purely elastic behaviors. The elastic and plastic regimes are separated by a critical shear rate . A second critical shear rates can be obtained as . It corresponds to the point at which the stress contribution of the high shear viscosity equals the yield stress. Caggioni, Trappe, and Spicer (2020) In Eq. 7, the high shear viscosity can be calculated with the Einstein’s viscosity Einstein (1905) , given that both the fluid viscosity and are known. This approximation is reasonable since all the values of under consideration remain low.
The CTS model yields a satisfactory fit with only two adjustable parameters, namely and , displayed as function of in Fig 2b-c. In the case of gelling dispersions (i.e. ), the yield stress follows a scaling law , consistent with findings in other colloidal gel systems Piau et al. (1999). roughly follows the same power law, . Using and as scaling factors for the and axes, the flow curves can be rescaled onto a single master curve (Fig. 2e), provided that . This master curve implies a consistent microstructural scenario along the entire flow curve for all volume fractions. Furthermore, the observed relationships indicates that the initial volume fraction of CB particles completely accounts for both the horizontal and vertical shifts of the flow curves as the volume fraction varies. This is noteworthy given the structural complexity expected for attractive dispersions. In the next section, our objective is to characterize the structure of CB dispersions and to provide insights into how influences the flow characteristics of these dispersions.
III.2 Microstructure of the carbon black dispersions under shear
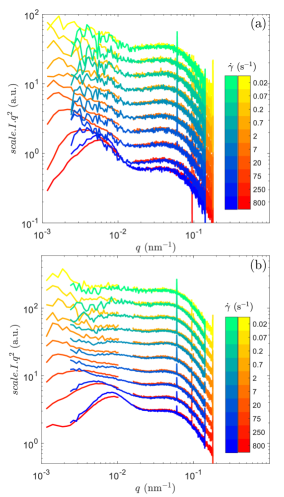
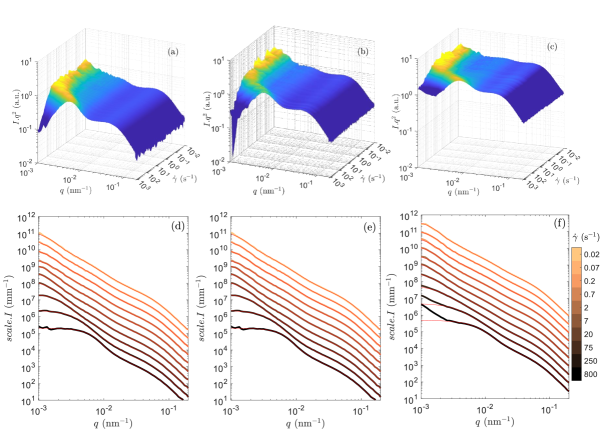
The structural analysis of CB dispersions was conducted using USAXS at three volume fractions, namely = 0.6, 1.2 and 3.2%. We recorded the scattering intensity as function of the scattering wave number within the range of 1. to 2. nm-1 during flow curve measurements. It is noteworthy that exhibited isotropic behavior for all measurements (see Appendix, Fig.9), ruling out any anisotropic structuring over the probed length scales. This isotropic behavior aligns with previous observations in CB dispersions Hipp, Richards, and Wagner (2021); Dagès et al. (2022). Consequently, our analysis focuses on the azimuthally averaged intensity .
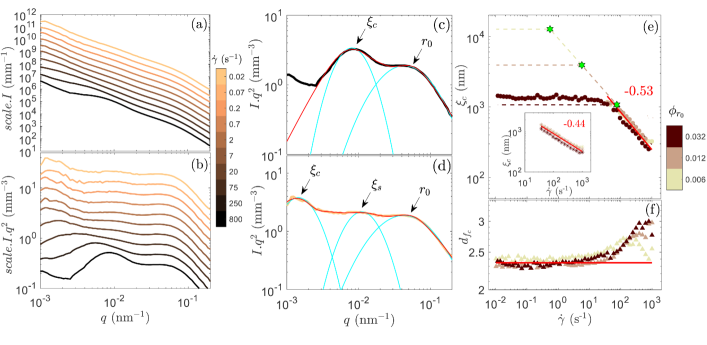
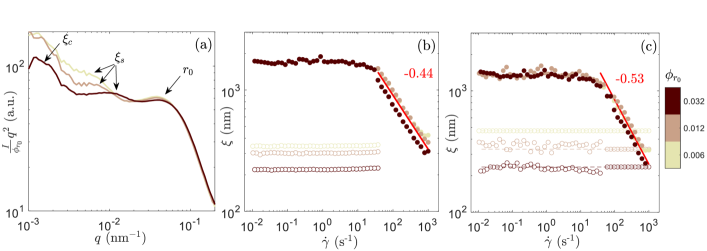
Fig. 3a presents at various shear rate values for . Similar scattering patterns were observed for dispersions at lower volume fractions, and they displayed the same shear rate dependence (see Appendix, Fig. 10). Upon transitioning from high to low shear rates, the scattering curves exhibit two and then three distinct bumps. These features become more pronounced in the Kratky representation ( ), where the bumps are transformed into peaks (Fig. 3b). At higher values (i.e. nm-1), the first bump corresponds to the form factor of the CB particles of size , as evidenced in Fig.1. Notably, the position of this bump is independent of the shear rate as shear does not alter the size of the CB particles.
As previously stated, the scattering curves exhibit two characteristic lengths at high shear rates, denoted as and (Fig. 3c-d), and an intermediate length scale becomes apparent at lower shear rates (approximately 75 s-1). For a precise and empirical determination and and their relationship with , we conducted fitting procedures on the peaks observed in the Kratky representation (Fig. 3c-d). These fittings were carried out using a log-normal function Baeza et al. (2013):
| (8) |
where describes a log-normal function of average position , width and amplitude . The estimated radius () are displayed for = 0.006, 0.012 and 0.032 in Fig. 14b in Appendix.
The shear-dependent size is attributed to the form factor of clusters, formed through the aggregation of CB particles, consistent with previous reports on CB dispersions Dagès et al. (2022); Richards et al. (2017); Hipp, Richards, and Wagner (2021). At high shear rates, typically s-1, the lack of structure factor at low indicates that these clusters are independant from each other (Fig. 3a-b and Fig. 10 in Appendix). Let us first focus on = 0.032. At high shear rates, is inversely proportional to the shear rate according to , where nm/sm and (inset of Fig. 3e). Below a critical shear rate of about 50 s-1, becomes constant with a critical value close to 2 µm. This behavior coincides well with the simulation of Varga et al. Varga and Swan (2018) where a similar scaling with and was found. The evolution of at lower volume fractions ( = 0.006 and 0.012) is similar to the one observed at = 0.032. At high shear rates, the data even superimpose. However, at lower shear rates, data are lacking because the peak in corresponding to shifts to values lower than the minimum accessible in the USAXS experiments. Based on simulations studies Varga and Swan (2018), for = 0.006 and 0.012, one can expect that the scaling holds down to a critical shear rate lower than 50 s-1 and that the cluster size converges to values much larger than 2 µm. For = 0.006 and 0.012, extrapolations of (Fig. 3e) will be justified during the microstructural analysis developed in the next section.
So far, the present results show that the cluster size is governed by the background fluid stress, in agreement with Sonntag and Russel (1986); Varga and Swan (2018). This is in contrast to the proposition in Bouthier and Gibaud (2023); Hipp, Richards, and Wagner (2021), where the dispersion stress was proposed as the determining factor (see Appendix, Fig. 12 for an evolution of ).
is found to be independent of the shear rate and slightly diminishes as increases (see Appendix, Fig.14). The exact interpretation of remains uncertain. In the context of CB gels at rest, had previously been considered either as the separation distance between two neighboring clusters, with the idea that clusters interpenetrate due to the fact that Dagès et al. (2022), or as an intermediate cluster size contributing to the construction of clusters with a size of Bouthier and Gibaud (2022). Alternatively, as proposed in the context of colloidal gelation under quiescent conditions, could represent the distance over which particles are transported to the growing cluster. In this case, is attributed to a correlation hole corresponding to the size of the depleted region surrounding the clusters Carpineti, Giglio, and Degiorgio (1995); Narayanan et al. (2020). Given that is smaller that , it could also represent the depletion at the aggregation length scale.
To extract the fractal dimension of clusters, the scattering data were fitted with a modified two-level Beaucage model Keshavarz et al. (2021); Dagès et al. (2022), accounting for the scattering of the particles and of the clusters (see Appendix, section E). To account for the intermediate level , the cluster-level term was multiplied by an empirical structure factor to account for some correlated region Keshavarz et al. (2021). The modified Beaucage model provides a good fit of the experimental data for all volume fractions (Fig. 3c-d and Fig. 10 in Appendix). Fig. 3e-f display the cluster sizes and fractal dimensions as function of the shear rate. The cluster sizes obtained from the modified Beaucage model correspond well with the values obtained from the model free analysis, also displayed in Fig. 3e. The power law fit of yields , confirming that the value of the breaking exponent is about . In Fig. 3f, the fractal dimension shows a non-monotonic evolution with the shear rate. Overall, is close to 3 at high shear rates and tends toward a constant value = 2.35 when decreases. Determining at high shear rates presents notable challenges for two primary reasons. First, in vs. , is determined by the power-law relationship observed between the bumps associated with and . At high shear rates, where and are in close proximity, this power-law behavior extends over a relatively limited range, resulting in insufficient statistical data for accurate determination of . Secondly, when examining the structure factor (see Appendix, Fig. 13), an anticorrelation peak is observed at nm-1 resulting from attractive interactions among the CB particles. This anticorrelation peak is not accounted by the modified Beaucage model, which leads to an overestimation of . At low shear rate, the extended distance between the bumps associated to and to allows for a more reliable determination of . Moving forward, we disregards the values of obtained at high shear. The fractal dimension is assumed to remain constant and equal to for all and across the entire range of shear rates ( s-1), a value which aligns with values predicted by theoretical models Zaccone et al. (2009); Conchuir et al. (2014) and those obtained through other experimental determinations Sonntag and Russel (1986); Hipp, Richards, and Wagner (2021).
Because of the complexity of the SAXS data, the structural analysis proposed here contains many simplifications. Nonetheless, from this approach, we have extracted the general trend of the structuring of CB dispersions under flow: the cluster size is a function of the shear rate so that with approximated to , and the fractal dimension of clusters is considered to be constant with . The analysis developed thereafter relies on this approximations and suffice to model the flow curves.
III.3 Modeling the hydrodynamic regime of the flow curve based on the cluster structure.
In the previous section, rheo-USAXS measurements have shown that CB dispersions undergo an hydrodynamic regime at high shear rates. In this regime, for all , the cluster size scales as with and their fractal dimension remains constant at . For the lowest volume fractions, due to experimental limitations, the cluster size cannot be measured beyond 2 µm and the extent of the hydrodynamic regime is not directly accessible. To address this limitation, the cluster size is extrapolated based on the relationship observed in Fig. 3e. Using the measured and extrapolated microstructural parameters of the CB dispersions, an hydrodynamic stress is calculated using Eq. 5 for and Eq. 6 for . The scaling factor in Eq. 5 was calculated Ehrl, Soos, and Lattuada (2009) as leading to .
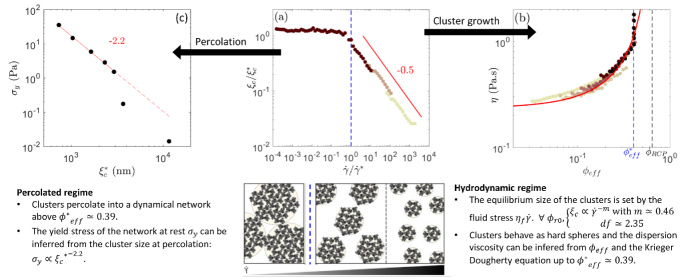
As reported in Fig. 4a, captures well the flow curves down to a critical shear rate , identified when becomes lager than the dispersion stress . Indeed, extrapolation of the cluster size leads to an increase of up to . This point is interpreted as a percolation point where the cluster growth becomes restricted by percolation into a dynamic network, with an effective volume fraction and and effective yield stress . Consequently, for , the cluster size is assumed to become constant and equals at , as depicted in Fig. 3e where is pointed out by stars. This analysis is consistent with the scattering data at , where the cluster sizes at low shear rates are available. Fig. 5b displays the dispersion viscosity vs , the effective volume fraction of clusters. The collapse of viscosity onto a master curve confirms that the rheology of the CB dispersions depends on the shear dependent volume fraction of clusters. The Krieger-Dougherty fit (red line) accurately describes the dispersions behavior up to approximately , which sets the upper limit in effective volume fraction of the hydrodynamic regime.
III.4 Properties of the percolation point (, ).
The values of , , and are plotted as function of in Fig. 4b-e. As mentioned in the previous section, these parameters relate of the structure of dispersions when clusters are assumed to percolate into a dynamic network.
In Fig. 4b, , obtained from the microstructural approach and , obtained from the CTS model, are overlaid for . Thus, , used to rescale the flow curves in Fig. 2, is now identified as the shear rate at witch clusters percolate. In Fig. 4c, is constant for all . This value is lower than the random close packing fraction of hard spheres, as illustrated on Fig. 5. Percolation below random close packing has been previously reported for non-Brownian dispersions with adhesive constrains at an "adhesive close packing" fraction Richards, O’Neill, and Poon (2021). Varga et al. Varga and Swan (2018) have proposed that a critical value for a percolated network could be obtained as . Assuming that , the critical shear rate should scales with with a power exponent given that . This is consistent with the observed scaling observed in Fig. 4b.
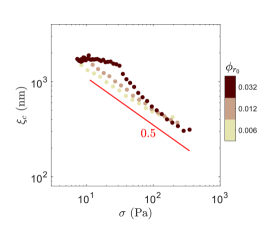
As shown in Fig. 4d, the cluster size at percolation decreases with as is reached at higher shear for the highest volume fractions. In fractal aggregation theories Shih et al. (1990); Wu and Morbidelli (2001), it is assumed that the gel network is built of closely packed clusters at which directly yields . For CB dispersions, but is constant and the observed scaling aligns well with given that (Fig. 4d). Fig. 4e compares the dependency of , measured in the zero shear rate limit, and on . Interestingly, both quantities exhibit a similar scaling pattern with respect to . This observation supports the idea that the value of is a direct outcome of the percolation point. Indeed, when is plotted against (Fig. 5(c)), it is found that a close match to what one would expect Bouthier et al. (2023): for a network of characteristic size . It is worth mentioning that, when the measuring time of the flow curve increases (see Fig. 6 in Appendix), this direct dependence between and is probably lost as structural rearrangements may occur at low shear rates.
To sum up, in Fig. 2 the flow curve of CB dispersions at various have been rescaled using a critical shear rate and as scaling factors for the and axis, respectively. Now, the origin of this scaling can be understood on a microstructural basis. The critical shear rate corresponds to the dynamic percolation of clusters at . The decrease of the cluster size at percolation is then responsible for the increase of with , as the network structure in the zero shear limit is inherited from the percolation point. When approaches , dispersions no longer displays a yield stress and the structuring at low shear is somewhat different. The percolation point, defined by , , , and , holds significant importance in understanding the flow behavior of CB particles, being the transition point between the hydrodynamic regime and the dynamic percolation of clusters. In Fig. 5a, at various can be normalized onto a master curve using the percolation point coordinates, i.e. and , as scaling factors for the and axis, respectively. The experimental results display on Fig. 5a are fully consistent with simulations performed in Varga and Swan (2018).
IV Conclusion and perspectives
A series of rheo-USAXS experiments was conducted on CB dispersions with to investigate the response of attractive colloidal dispersions to mechanical shear. These experiments involved rapidly changing the shear rate from high to low values, revealing a microstructural scenario depicted in Fig. 5.
In the hydrodynamic regime, attractive CB particles assemble into clusters with a fractal dimension of , and their size inversely scales with the shear rate as , where is approximately equal to 0.5. The size of these clusters is primarily determined by the fluid stress, represented by , where is the fluid background viscosity. The viscous contribution of the clusters can be approximated by the one of a hard sphere dispersion and the viscosity of CB dispersions can be calculated using the Krieger-Dougherty equation, provided we replace the CB particle volume fraction by an effective volume fraction of clusters . This hydrodynamic regime persists down to a critical point characterized by coordinates (, ). Although this model capture well the interplay between structure and rheology, the dynamics underlying this process remain to be fully understood. Specifically, what mechanisms drive cluster growth as the shear rate decreases? It might involves a balance between the aggregation of clusters upon collision and a feedback erosion process driven by the shear rate that restricts cluster size Zaccone et al. (2011).
At this juncture point (, ), the cluster growth stops and their effective volume fraction stabilizes at , irrespective of . We propose that at , clusters percolate into a dynamic network. This hypothesis gains support from the observation that closely tracks variations in the dynamical yield stress . When increases, the clusters size at percolation decreases, leading to a higher . In essence, the properties of dispersions in the limit where are inherited from the percolation point. As a result, the dynamic percolation point is a key parameter to explain the mechanical response of CB dispersions under shear. While the cluster growth in the hydrodynamic regime proceeds independently of the volume fraction, the percolation of clusters at a constant determines both the critical shear rate and the yield stress of the flow curve.
Microstructural models have traditionally partitioned the stress response of attractive dispersions into an hydrodynamic and an elastic contributions De Rooij et al. (1994); Potanin et al. (1995) and a robust and self-consistent comprehension of these two regimes has been established for CB dispersions. However, in Fig. 4a, it is clear that the hydrodynamic regime does not extent to low shear rates, in the vicinity of , and that an additional contribution is required to model the flow curve at intermediate shear rates (). Previously, we have stressed that the cluster size at percolation was maintained when is further decreased. It pictures the idea that, during the intermediate regime, the structure of the dispersion is shear-independent and composed of large and crowded clusters, comparable with the flow of adhesive non-Brownian dispersions. Based on the phenomenological model of Wyart and Cates Wyart and Cates (2014), constraint-based rheology was shown to successfully model all types of flow curves Guy et al. (2018). In this framework, particle sliding and rolling are constrained by adhesive and/or frictional contacts that are accounted by a shear-dependent jamming point . For adhesive non-Brownian dispersions, experimental results Richards et al. (2020) highlight the coupling between adhesion and friction to account for the shear-thinning and yield stress of the dispersions. In the case of attractive Brownian dispersions, for , the flow of sticky clusters may be successfully modeled using constraint-based rheology. The challenge probably lies in rationalizing the contribution of adhesion and friction in these systems. An alternative method for modeling this plastic regime would involve describing the elastic stress contribution of the dynamic network with a network percolation loss rate that decreases with respect to a characteristic time of .
Additional research is needed to characterize the intermediate regime. Colloidal systems that are optically transparent would be particularly advantageous, as they would allow for the characterization of mesoscopic structures (with 2 µm) using optical microscopy or dynamic light scattering. Besides, measuring the viscoelastic properties of the suspensions during shear using orthogonal superposition rheometry Wang and Ewoldt (2022) may bring further insights to the shear stress contribution during flow curve tests. Finally, it would be beneficial to validate the approach used in this paper and compare our findings with those from other attractive colloidal systems subjected to flow. Given the thixotropic behavior of Carbon black dispersions and attractive colloidal dispersions in general, it would also be interesting to study the impact of the flow curve protocol in such frameworks. We have indeed opted to continuously decrease the shear rate. If we were to continuously decrease the shear stress instead, would the control parameter still be the shear rate? Alternatively, one could perform discrete jumps from a higher shear rate to a lower one. In this scenario, would the cluster size be determined by the initial or final value of the shear rate? It is observed that at lower shear rates, the viscosity decreases over time Wang and Ewoldt (2022). Is this behavior attributed to slip at the boundaries of the Couette cell or to the restructuring of the clusters and the network over time?
Author Contributions
JB and TG carried out the experiments. JB analysed the data. TG, LVB and AP helped JB analyzing the data. TG and JB wrote the paper. TG designed and managed the project.
Conflicts of interest
There are no conflicts to declare.
Acknowledgements
The authors are especially grateful to the ESRF for beamtime at the beamline ID02 (proposal SC-5236) and Theyencheri Narayanan for the discussions and technical support during the USAXS measurements. The authors thank Szilvia Karpati (ENS de Lyon) and the CIQLE (Centre d’Imagerie Quantitative Lyon-Est) microscopy platform for their help with the electron microscopy imaging of the CB particles. The authors express their appreciation for valuable discussions held with Thibaut Divoux and Sébastien Manneville. This work was supported by the Région Auvergne-Rhône-Alpes “Pack Ambition Recherche", the LABEX iMUST (ANR-10-LABX-0064) of Université de Lyon, within the program "Investissements d’Avenir" (ANR-11-IDEX-0007), the ANR grants (ANR-18-CE06-0013 and ANR-21-CE06-0020-01). This work benefited from meetings within the French working group GDR CNRS 2019 “Solliciter LA Matière Molle" (SLAMM).
V Appendix
V.1 Effect of the duration on the flow curve
As shown in Fig. 6, the shape of the flow curve depends on the shear duration applied to measure each point. Two regimes can be distinguished depending on the shear rate: at high shear rate ( s-1), the stress response is independent on while at low shear rate ( s-1) and for high volume fractions of CB particles , a drop of the stress can be observed. The drop is all the more important that is large.
V.2 Herschel-Bulkley model
In Fig. 7, the Herschel-Bulkley model provides an acceptable fit of the data. However the Herschel-Bulkley model is less efficient that the CTS model to capture the data at intermediate shear rate, around s-1. Notably, the critical shear rate shows a different scaling with in comparison with obtained from the CTS model (Fig. 7c). As pointed in Caggioni, Trappe, and Spicer (2020), the CTS model gets rid of the nonphysical power exponent (Fig. 7d) by introducing a high shear viscosity (Eq. 7).
V.3 Form factor
The form factor of the CB particles was measured with SAXS on a diluted sample () at rest and fitted using different models.
In Fig. 8a, the form factor of the CB particles is described as a combination of a particle form factor , accounting for the nodules, and a fractal structure factor , accounting for the primary aggregates, with . is modeled as the form factor of polydisperse spheres with a log-normal distribution Aragón and Pecora (1976) and is modeled as a mass fractal structure factor Teixeira (1988). The fit yields nm, nm, = 2.85. The radius of gyration of a fractal aggregate is given by Teixeira (1988): which yields nm.
In Fig. 8b, the form factor of the CB particles is modeled using a two-level Beaucage model. The first level models the particles of size nm. The second level models the primary aggregate of size nm and fractal dimension = 2.78.
In both cases, the fit results compares well with the CB particles TEM images in Fig. 8c. The characterization of the Vulcan PF particles presented here confirms that these particles are small and compact in comparison with other CB particles previously reported (e.g. 180 nm for Vulcan XC-72 Richards et al. (2017); Dagès et al. (2021)).
V.4 Anisotropy
Fig. 9 displays the scattering curves of CB dispersions, azimuthally averaged either in the flow direction or in the vorticity direction. For the blue-green curves, corresponding to the vorticity direction, the low region is reduced because of the rectangular shape of the beamstop used. At all shear rates, the superimposition of the curves in both directions indicates the absence of anisotropic structure, also reported by Hipp, Richards, and Wagner (2021) for CB dispersions in oil.
V.5 Modified Beaucage model
The intensity spectrum may be fitted by a modified two-level Beaucage model Beaucage (1995, 1996); Keshavarz et al. (2021); Dagès et al. (2022); Bouthier and Gibaud (2023) through:
| (9) |
with
| (10) |
This model accounts for the presence of three distinct bumps observed in corresponding to the length scales , , and arranged in ascending order. The two-level Beaucage model combines the scattering contribution from the clusters with a size and a fractal dimension with the contribution from the CB particle of size . To account for the intermediate length scale , revealed at low shear rate, the cluster intensity is multiplied by an ad-hoc structure factor , resulting in an increase in scattering at intermediate . This structure factor is a function that exhibits a peak at and reaches a maximum value of . Away from , it gradually converges to 1. While this choice of is straightforward, it is not entirely satisfactory as it fails to meet thermodynamic limits. Specifically, equals 1, whereas it should be proportional to the isothermal compressibility. In Fig. 10, we show the fit of the scattering intensity of the CB dispersions using the modified two-level Beaucage model.
Hipp et al. Hipp, Richards, and Wagner (2021) also study the formation of sheared clusters of carbon black particles. They have characterized the cluster properties using small angle neutron scattering (SANS) and fit their data with the following model:
| (11) |
with
| (12) |
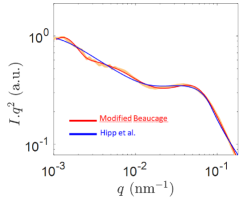
where is the form factor of the nodule (Guinier Porod) of size . is a mass fractal model Teixeira (1988) used to fit the form factor of the CB particles as insecable fractal cluster of size and fractal dimension composed of spheres of size . is a mass fractal model Teixeira (1988) used to fit fractal clusters of size and fractal dimension composed of the CB particles. Although the CB particles and the solvent used by Hipp et al. differ from ours, we attempted to fit our data with their model. In contrast to the modified two-level Beaucage model, the Hipp et al. model does not incorporate the intermediate length scale . As depicted in Fig. 11, the Hipp et al. model does not provide a good fit to the SAXS data, it misses by construction and tends to underestimate . This justifies our preference for the modified Beaucage model over the model proposed by Hipp et al. Hipp, Richards, and Wagner (2021)
V.6 Evolution of with
In Fig. 12, we observe that does not scale with .
V.7 Structure factor
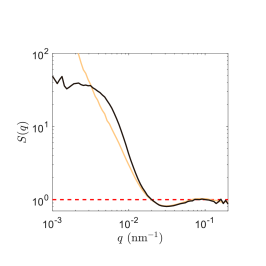
The structure factor of the CB dispersion is obtained by dividing the the scattering intensity of the CB dispersion at by the CB particles form factor measured at as shown in Fig 8. displays an anticorrelation peak at nm-1, associated with attractive interactions among the CB particles the background oil.
V.8 Evolution of and with and
The dependence of the length scales and with and was investigated using (i) a model free analysis (Eq. 8) and (ii) a two-level modified Beaucage model (Eq. 10). and are displayed as function of on Fig. 14b-c. Both approaches show that for s-1, increases with as with , highlighting the robustness of this result. Below s-1, is found to be constant ( µm) at . For lower volume fraction we believe the cluster size increases beyond the range of length scales that can be probed by the SAXS set-up. In the microstructural analysis developed in section III for the Fig. 4, we have extrapolated the values of using up to the limit when .
In Fig. 14b-c, is found to be independent of the shear rate and slightly diminishes as increases. The dependence of with is also illustrated in Fig. 14a.
References
- Chougnet et al. (2008) A. Chougnet, T. Palermo, A. Audibert, and M. Moan, “Rheological behaviour of cement and silica suspensions: Particle aggregation modelling,” Cement and Concrete Research 38, 1297–1301 (2008).
- Morariu, Teodorescu, and Bercea (2022) S. Morariu, M. Teodorescu, and M. Bercea, “Rheological investigation of polymer/clay dispersions as potential drilling fluids,” Journal of Petroleum Science and Engineering 210, 110015 (2022).
- Alfonso et al. (2021) M. S. Alfonso, H. Parant, J. Yuan, W. Neri, E. Laurichesse, K. Kampioti, A. Colin, and P. Poulin, “Highly conductive colloidal carbon based suspension for flow-assisted electrochemical systems,” iScience 24, 102456 (2021).
- Genovese, Lozano, and Rao (2007) D. B. Genovese, J. E. Lozano, and M. A. Rao, “The rheology of colloidal and noncolloidal food dispersions,” Journal of Food Science 72 (2007), 10.1111/j.1750-3841.2006.00253.x.
- Xi et al. (2019) Z. Xi, W. Liu, D. J. McClements, and L. Zou, “Rheological, structural, and microstructural properties of ethanol induced cold-set whey protein emulsion gels: Effect of oil content,” Food Chemistry 291, 22–29 (2019).
- Mewis and Wagner (2011) J. Mewis and N. J. Wagner, “Colloidal suspension rheology,” Colloidal Suspension Rheology 9780521515, 1–393 (2011).
- Lazzari et al. (2016) S. Lazzari, L. Nicoud, B. Jaquet, M. Lattuada, and M. Morbidelli, “Fractal-like structures in colloid science,” Advances in Colloid and Interface Science 235, 1–13 (2016).
- Zaccone et al. (2014) A. Zaccone, H. Winter, M. Siebenbürger, and M. Ballauff, “Linking self-assembly, rheology, and gel transition in attractive colloids,” Journal of Rheology 58, 1219–1244 (2014).
- Haw et al. (1995) M. Haw, M. Sievwright, W. C. Poon, and P. Pusey, “Cluster-cluster gelation with finite bond energy,” Advances in colloid and interface science 62, 1–16 (1995).
- Xie et al. (2010) D. Xie, H. Wu, A. Zaccone, L. Braun, H. Chen, and M. Morbidelli, “Criticality for shear-induced gelation of charge-stabilized colloids,” Soft Matter 6, 2692–2698 (2010).
- Weitz and Oliveria (1984) D. Weitz and M. Oliveria, “Fractal structures formed by kinetic aggregation of aqueous gold colloids,” Physical review letters 52, 1433 (1984).
- Schaefer et al. (1984) D. W. Schaefer, J. E. Martin, P. Wiltzius, and D. S. Cannell, “Fractal geometry of colloidal aggregates,” Physical Review Letters 52, 2371 (1984).
- Trappe and Sandkühler (2004) V. Trappe and P. Sandkühler, “Colloidal gels—low-density disordered solid-like states,” Current opinion in colloid & interface science 8, 494–500 (2004).
- Sonntag and Russel (1986) R. C. Sonntag and W. B. Russel, “Structure and breakup of flocs subjected to fluid stresses. I. Shear experiments,” Journal of Colloid And Interface Science 113, 399–413 (1986).
- Zaccone et al. (2009) A. Zaccone, M. Soos, M. Lattuada, H. Wu, M. U. Bäbler, and M. Morbidelli, “Breakup of dense colloidal aggregates under hydrodynamic stresses,” Physical Review E - Statistical, Nonlinear, and Soft Matter Physics 79, 061401 (2009).
- Massaro et al. (2020) R. Massaro, G. Colombo, P. Van Puyvelde, and J. Vermant, “Viscoelastic cluster densification in sheared colloidal gels,” Soft Matter 16, 2437–2447 (2020).
- Mewis and Wagner (2009) J. Mewis and N. J. Wagner, “Thixotropy,” Advances in Colloid and Interface Science 147-148, 214–227 (2009).
- Varga and Swan (2018) Z. Varga and J. W. Swan, “Large scale anisotropies in sheared colloidal gels,” Journal of Rheology 62, 405–418 (2018).
- Hipp, Richards, and Wagner (2021) J. B. Hipp, J. J. Richards, and N. J. Wagner, “Direct measurements of the microstructural origin of shear-thinning in carbon black suspensions,” Journal of Rheology 65, 145–157 (2021).
- Bouthier et al. (2023) L.-V. Bouthier, R. Castellani, S. Manneville, A. Poulesquen, R. Valette, and E. Hachem, “Aggregation and disaggregation processes in clusters of particles under flow: Simple numerical and theoretical insights,” Physical Review Fluids 8, 023304 (2023).
- Wessel and Ball (1992) R. Wessel and R. C. Ball, “Fractal aggregates and gels in shear flow,” Physical Review A 46, 3008–3011 (1992).
- Snabre and Mills (1996) P. Snabre and P. Mills, “I. Rheology of weakly flocculated suspensions of rigid particles,” Journal de Physique III 6, 1811–1834 (1996).
- Potanin (1993) A. A. Potanin, “On the computer simulation of the deformation and breakup of colloidal aggregates in shear flow,” Journal of colloid and interface science 157, 399–410 (1993).
- Hunter and Frayne (1980) R. J. Hunter and J. Frayne, “Flow behavior of coagulated colloidal sols. v. dynamics of floc growth under shear,” Journal of Colloid and Interface Science 76, 107–115 (1980).
- Brakalov (1987) L. Brakalov, “A connection between the orthokinetic coagulation capture efficiency of aggregates and their maximum size,” Chemical Engineering Science 42, 2373–2383 (1987).
- Ruan, Chen, and Li (2020) X. Ruan, S. Chen, and S. Li, “Structural evolution and breakage of dense agglomerates in shear flow and taylor-green vortex,” Chemical Engineering Science 211, 115261 (2020).
- Herschel and Bulkley (1926) W. H. Herschel and R. Bulkley, “Konsistenzmessungen von gummi-benzollösungen,” Kolloid-Zeitschrift 39, 291–300 (1926).
- Jeldres, Fawell, and Florio (2018) R. I. Jeldres, P. D. Fawell, and B. J. Florio, “Population balance modelling to describe the particle aggregation process: A review,” Powder technology 326, 190–207 (2018).
- De Rooij et al. (1994) R. De Rooij, A. A. Potanin, D. Van Den Ende, and J. Mellema, “Transient shear viscosity of weakly aggregating polystyrene latex dispersions,” The Journal of Chemical Physics 100, 5353–5360 (1994).
- Potanin et al. (1995) A. A. Potanin, R. De Rooij, D. Van Den Ende, and J. Mellema, “Microrheological modeling of weakly aggregated dispersions,” The Journal of Chemical Physics 102, 5845–5853 (1995).
- Wolthers et al. (1996) W. Wolthers, M. H. G. Duits, D. van den Ende, and J. Mellema, “Shear history dependence of the viscosity of aggregated colloidal dispersions,” Journal of Rheology 40, 799–811 (1996).
- Quemada and Berli (2002) D. Quemada and C. Berli, “Energy of interaction in colloids and its implications in rheological modeling,” Advances in colloid and interface science 98, 51–85 (2002).
- Silbert, Melrose, and Ball (1999) L. Silbert, J. Melrose, and R. Ball, “The rheology and microstructure of concentrated, aggregated colloids,” Journal of Rheology 43, 673–700 (1999).
- Varadan and Solomon (2001) P. Varadan and M. J. Solomon, “Shear-induced microstructural evolution of a thermoreversible colloidal gel,” Langmuir 17, 2918–2929 (2001).
- Quemada (1978) D. Quemada, “Rheology of concentrated disperse systems II. A model for non-newtonian shear viscosity in steady flows,” Rheologica Acta 1978 17:6 17, 632–642 (1978).
- Genovese (2012) D. B. Genovese, “Shear rheology of hard-sphere, dispersed, and aggregated suspensions, and filler-matrix composites,” Advances in Colloid and Interface Science 171-172, 1–16 (2012).
- Krieger and Dougherty (1959) I. M. Krieger and T. J. Dougherty, “A Mechanism for Non-Newtonian Flow in Suspensions of Rigid Spheres,” Transactions of the Society of Rheology 3, 137–152 (1959).
- Gibaud, Divoux, and Manneville (2020) T. Gibaud, T. Divoux, and S. Manneville, “Encyclopedia of Complexity and Systems Science,” (Springer, 2020) Chap. Nonlinear mechanics of colloidal gels: creep, fatigue and shear-induced yielding, pp. 1–24.
- Richards, Ramos, and Liu (2023) J. J. Richards, P. Z. Ramos, and Q. Liu, “A review of the shear rheology of carbon black suspensions,” Frontiers in Physics , 1–11 (2023).
- Trappe and Weitz (2000) V. Trappe and D. A. Weitz, “Scaling of the viscoelasticity of weakly attractive particles,” Physical Review Letters 85, 449–452 (2000).
- Ovarlez et al. (2013) G. Ovarlez, L. Tocquer, F. Bertrand, and P. Coussot, “Rheopexy and tunable yield stress of carbon black suspensions,” Soft Matter 9, 5540–5549 (2013).
- Helal, Divoux, and McKinley (2016) A. Helal, T. Divoux, and G. H. McKinley, “Simultaneous rheoelectric measurements of strongly conductive complex fluids,” Physical Review Applied 6, 064004 (2016).
- Hipp, Richards, and Wagner (2019) J. B. Hipp, J. J. Richards, and N. J. Wagner, “Structure-property relationships of sheared carbon black suspensions determined by simultaneous rheological and neutron scattering measurements,” Journal of Rheology 63, 423–436 (2019).
- Gibaud, Frelat, and Manneville (2010) T. Gibaud, D. Frelat, and S. Manneville, “Heterogeneous yielding dynamics in a colloidal gel,” Soft Matter 6, 3482–3488 (2010).
- Grenard et al. (2014) V. Grenard, T. Divoux, N. Taberlet, and S. Manneville, “Timescales in creep and yielding of attractive gels,” Soft matter 10, 1555–1571 (2014).
- Gibaud et al. (2016) T. Gibaud, C. Perge, S. B. Lindström, N. Taberlet, and S. Manneville, “Multiple yielding processes in a colloidal gel under large amplitude oscillatory stress,” Soft Matter 12, 1701–1712 (2016).
- Perge et al. (2014) C. Perge, N. Taberlet, T. Gibaud, and S. Manneville, “Time dependence in large amplitude oscillatory shear: A rheo-ultrasonic study of fatigue dynamics in a colloidal gel,” Journal of Rheology 58, 1331–1357 (2014).
- Richards et al. (2017) J. J. Richards, J. B. Hipp, J. K. Riley, N. J. Wagner, and P. D. Butler, “Clustering and Percolation in Suspensions of Carbon Black,” Langmuir 33, 12260–12266 (2017).
- Dagès et al. (2022) N. Dagès, L. V. Bouthier, L. Matthews, S. Manneville, T. Divoux, A. Poulesquen, and T. Gibaud, “Interpenetration of fractal clusters drives elasticity in colloidal gels formed upon flow cessation,” Soft Matter 18, 6645–6659 (2022), arXiv:2203.08675 .
- Bouthier and Gibaud (2023) L.-V. Bouthier and T. Gibaud, “Three length-scales colloidal gels: The clusters of clusters versus the interpenetrating clusters approach,” Journal of Rheology 67, 621–633 (2023).
- Gibaud et al. (2020) T. Gibaud, N. Dagès, P. Lidon, G. Jung, L. C. Ahouré, M. Sztucki, A. Poulesquen, N. Hengl, F. Pignon, and S. Manneville, “Rheoacoustic Gels: Tuning Mechanical and Flow Properties of Colloidal Gels with Ultrasonic Vibrations,” Physical Review X 10, 1–21 (2020), 011028, 1905.07282 .
- Dagès et al. (2021) N. Dagès, P. Lidon, G. Jung, F. Pignon, S. Manneville, and T. Gibaud, “Mechanics and structure of carbon black gels under high-power ultrasound,” Journal of Rheology 65, 477–490 (2021), arXiv:2011.06809 .
- Liu et al. (2021) L. Liu, Z. Shen, X. Zhang, and H. Ma, “Highly conductive graphene/carbon black screen printing inks for flexible electronics,” Journal of colloid and interface science 582, 12–21 (2021).
- Li, Xiao, and Ou (2006) H. Li, H.-g. Xiao, and J.-p. Ou, “Effect of compressive strain on electrical resistivity of carbon black-filled cement-based composites,” Cement and Concrete Composites 28, 824–828 (2006).
- Liu and Richards (2023) Q. Liu and J. J. Richards, “Rheo-electric measurements of carbon black suspensions containing polyvinylidene difluoride in n-methyl-2-pyrrolidone,” Journal of Rheology 67, 647–659 (2023).
- Panine, Gradzielski, and Narayanan (2003) P. Panine, M. Gradzielski, and T. Narayanan, “Combined rheometry and small-angle x-ray scattering,” Review of Scientific Instruments 74, 2451–2455 (2003).
- Divoux, Grenard, and Manneville (2013) T. Divoux, V. Grenard, and S. Manneville, “Rheological hysteresis in soft glassy materials,” Physical Review Letters 110, 1–7 (2013), arXiv:1207.3953 .
- Caggioni, Trappe, and Spicer (2020) M. Caggioni, V. Trappe, and P. T. Spicer, “Variations of the Herschel–Bulkley exponent reflecting contributions of the viscous continuous phase to the shear rate-dependent stress of soft glassy materials,” Journal of Rheology 64, 413–422 (2020).
- Narayanan et al. (2022) T. Narayanan, M. Sztucki, T. Zinn, J. Kieffer, A. Homs-Puron, J. Gorini, P. Van Vaerenbergh, and P. Boesecke, “Performance of the time-resolved ultra-small-angle x-ray scattering beamline with the extremely brilliant source,” Journal of Applied Crystallography 55, 98–111 (2022).
- Dannenberg, Paquin, and Gwinnell (2000) E. M. Dannenberg, L. Paquin, and H. Gwinnell, “Carbon Black,” in Kirk-Othmer Encyclopedia of Chemical Technology (John Wiley & Sons, Ltd, 2000).
- Einstein (1905) A. Einstein, Eine neue bestimmung der moleküldimensionen, Ph.D. thesis, ETH Zurich (1905).
- Piau et al. (1999) J.-M. Piau, M. Dorget, J.-F. Palierne, and A. Pouchelon, “Shear elasticity and yield stress of silica–silicone physical gels: Fractal approach,” Journal of Rheology 43, 305–314 (1999).
- Baeza et al. (2013) G. P. Baeza, A. C. Genix, C. Degrandcourt, L. Petitjean, J. Gummel, M. Couty, and J. Oberdisse, “Multiscale filler structure in simplified industrial nanocomposite silica/SBR systems studied by SAXS and TEM,” Macromolecules 46, 317–329 (2013).
- Bouthier and Gibaud (2022) L.-V. Bouthier and T. Gibaud, “Three length scales colloidal gels: the clusters of clusters versus the interpenetrating clusters approach,” arXiv (2022), arXiv:2210.10505 .
- Carpineti, Giglio, and Degiorgio (1995) M. Carpineti, M. Giglio, and V. Degiorgio, “Mass conservation and anticorrelation effects in the colloidal aggregation of dense solutions,” Physical Review E 51, 590 (1995).
- Narayanan et al. (2020) T. Narayanan, R. Dattani, J. Möller, and P. Kwaśniewski, “A microvolume shear cell for combined rheology and x-ray scattering experiments,” Review of Scientific Instruments 91 (2020).
- Keshavarz et al. (2021) B. Keshavarz, D. G. Rodrigues, J. B. Champenois, M. G. Frith, J. Ilavsky, M. Geri, T. Divoux, G. H. McKinley, and A. Poulesquen, “Time-connectivity superposition and the gel/glass duality of weak colloidal gels,” Proceedings of the National Academy of Sciences of the United States of America 118 (2021), 10.1073/pnas.2022339118.
- Conchuir et al. (2014) B. O. Conchuir, Y. M. Harshe, M. Lattuada, and A. Zaccone, “Analytical model of fractal aggregate stability and restructuring in shear flows,” Industrial and Engineering Chemistry Research 53, 9109–9119 (2014).
- Ehrl, Soos, and Lattuada (2009) L. Ehrl, M. Soos, and M. Lattuada, “Generation and geometrical analysis of dense clusters with variable fractal dimension,” Journal of Physical Chemistry B 113, 10587–10599 (2009).
- Richards, O’Neill, and Poon (2021) J. A. Richards, R. E. O’Neill, and W. C. Poon, “Turning a yield-stress calcite suspension into a shear-thickening one by tuning inter-particle friction,” Rheologica Acta 60, 97–106 (2021), arXiv:2007.05433 .
- Shih et al. (1990) W. H. W. Y. Shih, W. H. W. Y. Shih, S. I. Kim, J. Liu, and I. A. Aksay, “Scaling behavior of the elastic properties of colloidal gels,” Physical Review A 42, 4772–4779 (1990).
- Wu and Morbidelli (2001) H. Wu and M. Morbidelli, “Model relating structure of colloidal gels to their elastic properties,” Langmuir 17, 1030–1036 (2001).
- Zaccone et al. (2011) A. Zaccone, D. Gentili, H. Wu, M. Morbidelli, and E. Del Gado, “Shear-driven solidification of dilute colloidal suspensions,” Phys. Rev. Lett. 106, 138301 (2011).
- Wyart and Cates (2014) M. Wyart and M. E. Cates, “Discontinuous shear thickening without inertia in dense non-brownian suspensions,” Physical Review Letters 112 (2014), 10.1103/PhysRevLett.112.098302, arXiv:1311.4099 .
- Guy et al. (2018) B. M. Guy, J. A. Richards, D. J. Hodgson, E. Blanco, and W. C. Poon, “Constraint-Based Approach to Granular Dispersion Rheology,” Physical Review Letters 121, 128001 (2018), arXiv:1807.11356 .
- Richards et al. (2020) J. A. Richards, B. M. Guy, E. Blanco, M. Hermes, G. Poy, and W. C. K. Poon, “The role of friction in the yielding of adhesive non-Brownian suspensions,” Journal of Rheology 64, 405–412 (2020), arXiv:1910.07958 .
- Wang and Ewoldt (2022) Y. Wang and R. H. Ewoldt, “New insights on carbon black suspension rheology – anisotropic thixotropy and anti-thixotropy,” arXiv:2202.05772 , 1–31 (2022), arXiv:2202.05772 .
- Aragón and Pecora (1976) S. R. Aragón and R. Pecora, “Theory of dynamic light scattering from polydisperse systems,” The Journal of Chemical Physics 64, 2395–2404 (1976).
- Teixeira (1988) J. Teixeira, “Small-angle scattering by fractal systems,” Journal of Applied Crystallography 21, 781–785 (1988).
- Beaucage (1995) G. Beaucage, “Approximations Leading to a Unified Exponential/Power-Law Approach to Small-Angle Scattering,” Journal of Applied Crystallography 28, 717–728 (1995).
- Beaucage (1996) G. Beaucage, “Small-Angle Scattering from Polymeric Mass Fractals of Arbitrary Mass-Fractal Dimension,” Journal of Applied Crystallography 29, 134–146 (1996).