Spectral Energy Distributions of Disc-Embedded Accreting Protoplanets
Abstract
Many dozens of protoplanetary discs show signatures of sculpting by planets. To help find these protoplanets by direct imaging, we compute their broadband spectral energy distributions, which overlap with the JWST (James Webb Space Telescope) and ALMA (Atacama Large Millimeter Array) passbands. We consider circumplanetary spherical envelopes, and combinations of circumplanetary discs and envelopes, heated by protoplanet accretion and external irradiation. Searches with JWST’s NIRCam (Near-Infrared Camera) and the blue portion of MIRI (Mid-Infrared Instrument) are most promising since 300–1000 K protoplanets outshine their 20–50 K circumstellar environs at wavelengths of 2–20 m. Detection is easier if circumplanetary dust settles into discs (more likely for more massive planets) or is less abundant per unit mass gas (because of grain growth or filtration). At wavelengths longer than 20 m, circumplanetary material is difficult to see against the circumstellar disc’s surface layers that directly absorb starlight and reprocess it to the far-infrared. Such contaminating circumstellar emission can be serious even within the evacuated gaps observed by ALMA. Only in strongly depleted regions, like the cavity of the transitional disc PDS 70 where two protoplanets have been confirmed, may long-wavelength windows open for protoplanet study. We compile a list of candidate protoplanets and identify those with potentially the highest accretion luminosities, all peaking in the near-infrared.
keywords:
planets and satellites: formation – planets and satellites: general – planets and satellites: fundamental parameters – protoplanetary discs – planet–disc interactions1 Introduction
For planet formation to mature as an empirical science, it needs to be grounded in observations of forming planets. To date, detections of planets accreting from their parent circumstellar discs have been few. The transitional disc system PDS 70 hosts two Jupiter-mass protoplanets, b and c, which radiate primarily in the near-infrared (Keppler et al. 2018; Wang et al. 2020, 2021, and references therein). These objects exhibit millimeter-wave excesses from circumplanetary dust (Isella et al. 2019; Benisty et al. 2021), and Balmer line and broadband ultraviolet excesses indicating ongoing accretion (Haffert et al., 2019; Aoyama & Ikoma, 2019; Hashimoto et al., 2020; Aoyama et al., 2021; Zhou et al., 2021). Aside from PDS 70b and c, just a handful of potential protoplanets have been imaged, e.g. around AS 209 in the millimetre (Bae et al., 2022), and around MWC 758, AB Aur, and HD 169142 in the near-infrared (Wagner et al. 2023; Currie et al. 2022; Hammond et al. 2023). So far these planet candidates lack the multi-wavelength coverage needed to strengthen their candidacy and determine whether they are still in the process of forming (read: accreting). Helping to fill in the panchromatic picture is a goal of this paper.
Why aren’t there more confirmed accreting protoplanets? It is not for want of candidate protoplanetary discs. Dozens of discs with morphological or kinematic signatures suggestive of gravitational forcing by planets have been searched (e.g. Zurlo et al., 2020; Asensio-Torres et al., 2021; Andrews et al., 2021; Cugno et al., 2023a, b). Are we looking for protoplanets at the right wavelengths? How important is dust extinction? What about contaminating light from the surrounding circumstellar disc?
We address these questions by modeling the spectral energy distributions (SEDs) of accreting protoplanets and their environments. Early SED calculations considered simple power-law circumplanetary discs and ignored background circumstellar material (e.g. Zhu 2015; Eisner 2015). More recent attempts are analytic and consider circumplanetary discs surrounded by spherical envelopes of varying density profiles (Adams & Batygin 2022; Taylor & Adams 2024), or are numerical and rely on 3D radiative transfer and/or hydrodynamic simulations (Szulágyi et al. 2018a, b; Chen & Szulágyi 2022; Krieger & Wolf 2022). We adopt an intermediate, semi-analytic approach that tries to balance realism with efficient exploration of parameter space and easy physical interpretation.
Flows around planets can be more spherical or disc-like depending on how energy and angular momentum are transported (e.g. Fung et al. 2019; Krapp et al. 2022). We consider both geometries in simplified limits, and calibrate our models against numerical simulations (Choksi et al. 2023, Li et al. 2023). For the most part we concentrate on a parameter space inspired by the DSHARP survey of circumstellar discs (Andrews et al., 2018; Huang et al., 2018) and their candidate protoplanets (Zhang et al. 2018): super-Earths to sub-Jupiters (10-100 ) embedded in low-density circumstellar gaps at orbital distances of 100 au. We consider how circumplanetary discs are heated externally by radiation from planetary accretion shocks and internally by viscous dissipation, and how circumplanetary spherical envelopes reprocess radiation from short to long wavelengths. We model only the broadband SED redward of the optical (not the ultraviolet excess or line emission from the accretion shock; cf. Aoyama et al. 2021 and references therein), with an eye toward assessing detection prospects for the Atacama Large Millimeter Array (ALMA) and the James Webb Space Telescope (JWST).
Section 2 describes how we compute SEDs in spherical and disc geometries. Section 3 presents our results across parameter space, and provides a test application to PDS 70c. We summarize and discuss in section 4.
| Parameter Name | Description | Value(s) |
|---|---|---|
| Host star mass | ||
| Host star effective temperature | 4500 K | |
| Host star radius | 2.5 | |
| System age | 1 | |
| Protoplanet orbital radius | {100, 300} au | |
| Circumstellar disc aspect ratio at 100 au | 0.1 | |
| Circumstellar disc gas surface density at | {, , } | |
| Dust-to-gas ratio | ||
| Protoplanet mass | ||
| Protoplanet radius, normalised by Thorngren et al. (2019) mass-radius relation | ||
| Shakura-Sunyaev viscosity parameter in CPD |
2 SED Model
We consider a planet orbiting a star of mass , effective temperature K, and radius . These stellar properties derive from evolutionary tracks evaluated at a system age (Choi et al., 2016). The planet is on a circular orbit with radius au in the midplane of a circumstellar disc (CSD). The local CSD height is , the sound speed , and the midplane temperature K, where is the Keplerian orbital frequency, is the gravitational constant, is Boltzmann’s constant, is the gas mean molecular weight, and is the mass of the hydrogen atom. The local surface density (inside whatever gap the planet may have opened) is assumed to be and the volume density at the midplane is . These fiducial parameters are broadly consistent with observations of DSHARP gaps (e.g. Choksi & Chiang 2022; Choksi et al. 2023, and references therein). Alternate choices are listed in Table 1 and tested in Section 3.3.
We calculate SEDs of accreting protoplanets of mass (cf. Szulágyi et al. 2018a who focus on more massive planets). Sub-Jupiter masses are typically indicated by the widths of observed disc gaps (Dong & Fung, 2017; Zhang et al., 2018). Our parameters are such that the disc height is always greater than the planet’s Bondi radius
| (1) |
In this “subthermal” regime, the planet’s gravitational sphere of influence is its Bondi sphere (not its Hill sphere) and we can neglect the vertical density gradient of the background disc (e.g. Choksi et al. 2023). Most suspected gap-opening planets from DSHARP are subthermal (table 1 of Choksi et al. 2023).
The planet’s mass accretion rate is assumed to be its time-averaged rate over its age:
| (2) |
We assume the planet has entered the hydrodynamic “runaway” phase of growth, during which flows can accelerate to supersonic speeds (e.g. Ginzburg & Chiang 2019a, and references therein). At a distance from the planet’s centre, the accreting gas passes through a shock into the planet’s (nearly hydrostatic) atmosphere, converting its bulk kinetic energy into heat. The post-shock emission is assumed to be from a blackbody of luminosity and temperature
| (3) | ||||
| (4) |
where is the Stefan-Boltzmann constant. Equation (4) agrees qualitatively with radiation-hydrodynamic simulations of accretion shocks, which find of the accretion power thermalises immediately (Aoyama et al. 2020, their appendix A.1.2 and equation A5; see also Marleau et al. 2017 and Berardo et al. 2017). Note that standard “cold start” or “hot start” cooling models of planets passively radiating into empty space do not apply for the actively accreting protoplanets of interest here (cf. Zhu 2015; Szulágyi et al. 2018a). We do not explicitly model non-thermal (ultraviolet and line) emission from the accretion shock (Aoyama et al. 2021). Such radiation would also be thermalised if the planet’s surroundings (at ) are optically thick, as they typically are for our models.
The protoplanet’s size is essentially given by . We set
| (5) |
where and are the radius and mass of Jupiter. The expression in square brackets is a mass-radius relation fit to gas giants that are Gyrs old (Thorngren et al., 2019). We introduce the parameter because protoplanets may not have finished contracting. We test , values similar to those predicted by protoplanet cooling models at ages of 1-10 Myr (figs. 2 and 4 of Ginzburg & Chiang, 2019b).
The blackbody radiation from the accretion shock is re-processed by dust exterior to into the emergent SED. We consider two dust distributions: circumplanetary spheres (CPSs, section 2.1) and circumplanetary discs (CPDs, section 2.2; these models actually combine discs + spheres). For spherical dust geometries, we use the Monte Carlo radiative transfer code radmc3d (Dullemond et al., 2012). For disc geometries, we add heating from viscous dissipation to the two-layer irradiated disc model of Chiang & Goldreich (1997). To measure the accreting protoplanet’s SED, it must be detected against the spectrum of re-processed starlight emitted by the local circumstellar disc (CSD); the latter is computed in section 2.3.
2.1 Circumplanetary sphere (CPS) models
Over radial distances to measured from the planet centre, the gas density is taken from the spherically symmetric, isothermal, Bondi solution:
| (6) |
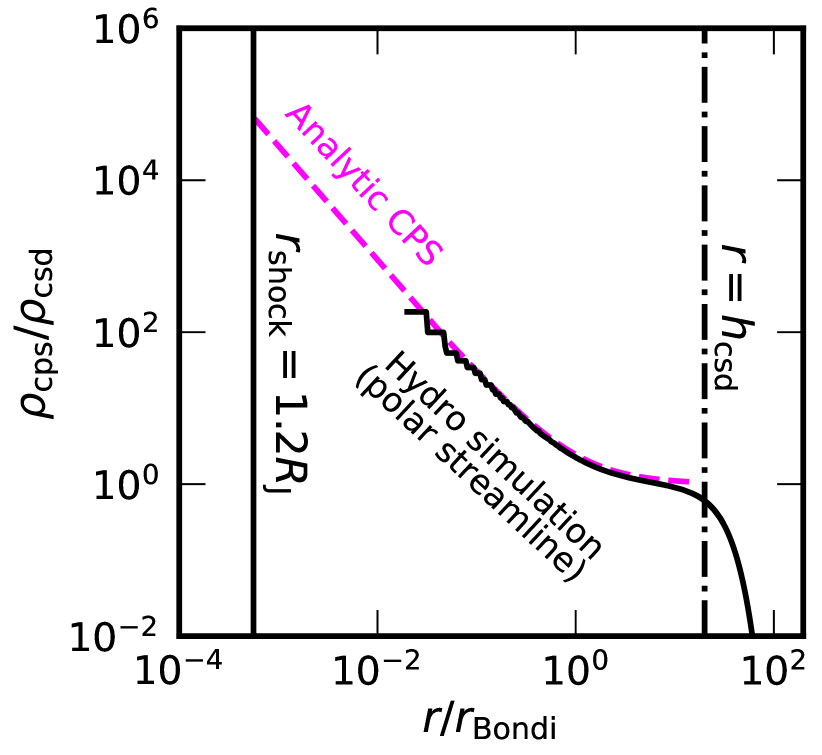
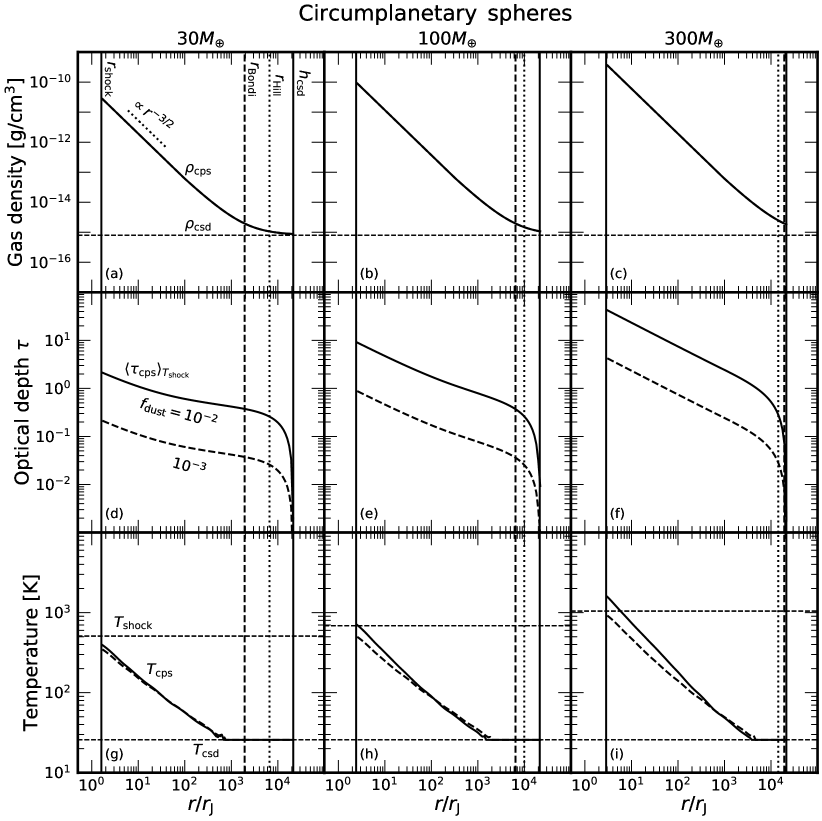
where , and and are branches of the Lambert function (Bondi 1952; Cranmer 2004). When , (free-fall); in the opposite limit, asymptotes to the background . Figure 1 shows that is at least an order of magnitude smaller than . Our analytic helps us capture the region near which dominates the optical depth (), and which can be difficult to resolve in numerical simulations (cf. Szulágyi et al., 2018a, b; Szulágyi et al., 2019).
Our adopted in equation (6) corresponds to mass inflow at the classic Bondi rate
| (7) |
which hydrodynamic simulations of subthermal planet-disc interactions support — Figure 1 shows how equation (6) reproduces data from a 3D, global (non-shearing-box), isothermal simulation by Choksi et al. (2023; see also D’Angelo et al. 2003 and Machida et al. 2010). Note that we distinguish here between the inflow rate (given by Bondi) and the net planetary accretion rate (given by equation 2). In principle, much of the gas entering a planet’s gravitational sphere of influence (, dominated by polar streamlines) can also exit it (, dominated by equatorial streamlines; Ormel et al. 2015; Cimerman et al. 2017; Béthune & Rafikov 2019; Choksi et al. 2023). For our fiducial model parameters, is smaller than by factors of 10-100 (see also fig. 13 of Choksi et al. 2023). We also consider the limiting case , which appears to apply to PDS 70bc (section 3.4).
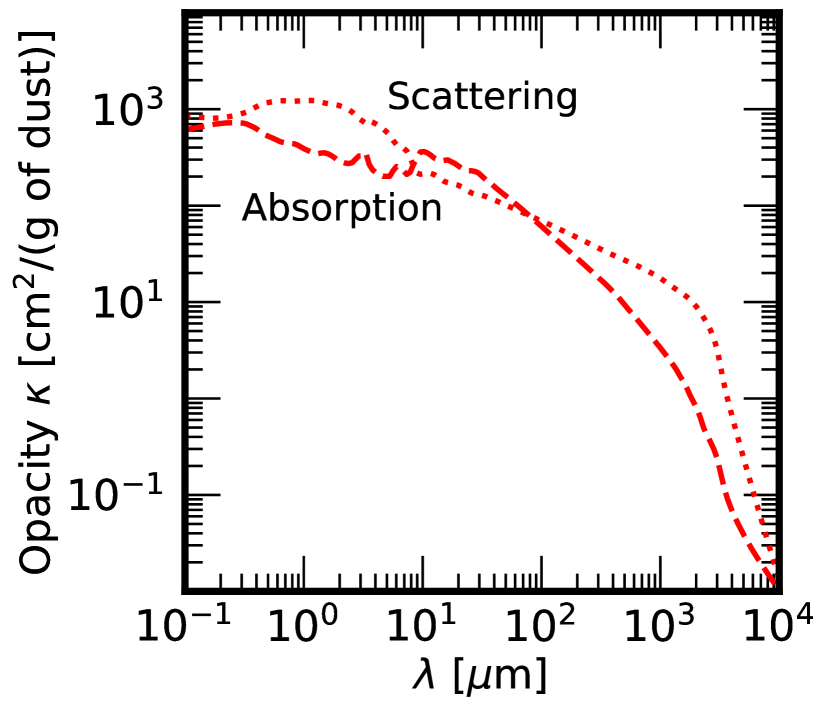
Dust and gas are assumed uniformly mixed throughout the CPS (cf. Krapp et al. 2022 who consider non-uniform mixtures). We explore a solar dust-to-gas ratio of , as well as a subsolar ratio of since dust may be filtered out of planet-carved gaps (e.g. Dong et al., 2017). We assume dust grains follow the fiducial size distribution adopted by the DSHARP collaboration (orange curve in fig. 5 of Birnstiel et al. 2018). We calculate dust absorption opacities using the dsharp-opac package,111https://github.com/birnstiel/dsharp_opac. Our main results are presented without including gas opacity or dust scattering, for simplicity. In appendix B we show how including dust scattering does not change our conclusions about protoplanet detectability.
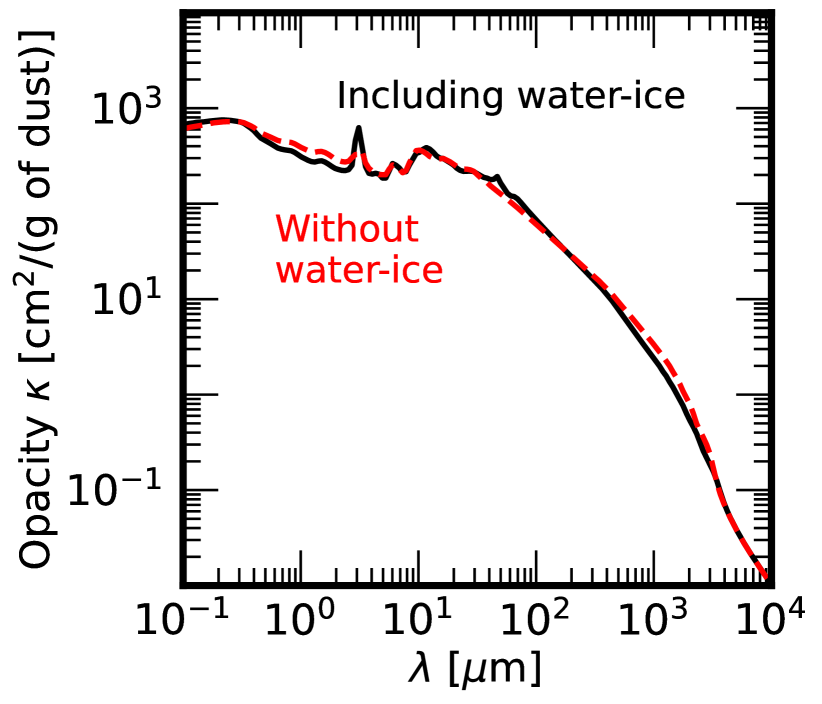
Figure 2 plots the dust opacity vs. wavelength for grains with and without water ice. The main effect of including water ice is to boost the opacity around 2.7 m. By default, we compute SEDs using the opacity curve that includes water ice. We check this assumption post-facto by measuring from radmc3d the dust temperature where photons of wavelength m reach radial optical depth unity (starting from outside the CPS and integrating toward the centre). If this temperature exceeds the ice sublimation temperature of 150 K, we rerun radmc3d using the opacity curve excluding water ice.
Radiative transfer with radmc3d is performed in spherical coordinates centred on the planet, for radius and polar and azimuthal angles and , respectively. The number of grid cells is (assuming spherical symmetry). The spacing between neighboring radial cells grows in proportion to the distance from the planet according to , where is the inner edge of the th cell. The planet is modeled as a point source with the blackbody SED defined by equations (3) and (4). The planet source emits photon “packages” across 30 wavelength bins uniformly distributed in log-space between 0.1 m and 104m.
We use radmc3d’s mctherm routine to calculate the dust temperature vs. , and feed this into the sed routine to obtain the emergent SED , where is distance to the source, is photon wavelength, and is flux per unit wavelength. When computing the CPS SED, we only include emission from cells for which exceeds the background temperature . The background CSD emission is accounted for in section 2.3.
2.2 Circumplanetary disc (CPD) models
We model CPDs that are heated both internally by viscous dissipation, and externally by radiation from the planet and the star (cf. Zhu 2015 who consider only viscous heating). The CPD is assumed to be truncated by the planet’s magnetosphere at an inner radius , similar to values obtained by Ginzburg & Chiang (2020) for planets with accretion-powered, convective dynamos (their fig. 5 and equation 9). The CPD extends to an outer radius where by definition its interior temperature reaches the background circumstellar disc temperature . At , the dust distribution reverts to a spherically symmetric CPS (section 2.1).
The CPD has the steady-state surface density
| (8) |
where is the Shakura & Sunyaev (1973) viscosity parameter, is the sound speed at the midplane temperature , and is the disc’s vertical height in hydrostatic equilibrium with the planet’s gravity. We test .
We assume the energy released by viscous dissipation is transported out by radiative diffusion, so that the midplane is heated to
| (9) |
where and is the dust-only opacity averaged over the Planck function at temperature . For simplicity we fix in CPD models. The temperature ceiling at 1500 K accounts for how dust sublimation thermostats the midplane temperature (D’Alessio et al., 1998, 1999). Using the wavelength-dependent dsharp-opac opacities excluding water ice (section 2.1), we numerically solve equations (8) and (9) for , , and , and verify post-facto our assumption that the CPD is optically thick. For reference, when the opacity is constant and dust has not sublimated, , , and . The last scaling implies the CPD is flared but only barely so.
The portion of the CPD energy budget from passive reprocessing is computed following Chiang & Goldreich (1997) and Chiang et al. (2001). Grains in the disk surface layers are directly exposed to radiation from the planet and attain the equilibrium temperature
| (10) |
Half the radiation emitted by the surface grains is directed away from the CPD to be reprocessed by the surrounding CPS. The other half is directed into the CPD interior, heating it to a minimum temperature
| (11) |
which neglects the contribution from viscous heating (to be added below), and which assumes the interior is optically thick. Here
| (12) |
is the angle at which radiation from the planet grazes the CPD photosphere at height above the midplane. The ratio is a logarithm on the order of a few, and we fix it to be 3. Note the irradiation grazing angle is assumed to depend on which is set by viscous heating, rather than as in a purely passive disc; this assumption is safe since is the highest disc temperature in our models.
Equation (11) accounts only for passive reprocessing and neglects viscous heating. Accounting only for viscous heating gives an effective (photospheric) temperature for the CPD of . We combine these heating terms to estimate a net interior temperature :
| (13) |
which ensures energy flux conservation.
The SED for a CPD viewed face-on is computed as
| (14) |
where is the intensity per unit wavelength emitted from disc radius . The contributions to are from the optically thick disc interior and the optically thin surface:
| (15) |
where is the Planck function evaluated at temperature , and the factor multiplying is the optical depth of the optically thin surface layer. For , we use opacities that include water ice if K, and otherwise do not. We define to be the location where (the lowest computed temperature of the disc) crosses the system floor temperature of .
To the CPD SED we add the planet SED:
| (16) |
The emission from the planet+CPD is re-processed by a CPS dust shell from . The SED emerging from the shell is computed using radmc3d by excising the inner from a CPS model, and placing at a point source whose SED is given by equation (16) for the planet + face-on CPD. The procedure is otherwise the same as in section 2.1. Since in reality the CPD is less bright when viewed edge-on, using the face-on CPD SED to isotropically heat the surrounding CPS overestimates the emergent SED. The error, however, is only on the order of unity for a shell that is optically thick to CPD radiation, and less for a shell that is optically thin.
2.3 Local circumstellar disc (CSD)
We compute the SED of a circular patch of the CSD, of area , centred on the planet. The CSD SED is determined by passive re-processing of starlight and not by viscous dissipation which is typically not competitive with stellar irradiation beyond au (Chiang & Goldreich, 1997).
We divide the CSD into an interior at temperature and an exposed surface layer at temperature . We set K, about twice (e.g. fig. 5 of Chiang et al. 2001). The SED of a patch of area is
| (17) |
where and is the angle at which stellar radiation strikes the CSD photosphere at height above the midplane. We take and (Chiang & Goldreich, 1997; Chiang et al., 2001); together these yield . Because K, we use opacities that include water ice. Note that we have not assumed the CSD interior to be optically thick.
Scattered starlight from the CSD is not explicitly modeled but we assess its significance here. For a blackbody star of luminosity whose SED peaks at wavelength , we estimate the starlight scattered off an area of the CSD surface as
| (18) |
where is the broadband Rayleigh-Jeans stellar luminosity at wavelength , and is the dust scattering efficiency or albedo. For , m, m (corresponding to the F444W passband of JWST’s Near-Infrared Camera), and , we have . The scattering albedo is a sensitive function of dust grain radius and wavelength; in the Rayleigh limit , . For CSD surface grains of size m, , well below the emitted thermally by circumplanetary material (depending on planet mass and other parameters; see section 3). By contrast, for m, scattering may be in the geometric limit and on the order of unity; then and scattered near-infrared starlight may overpower circumplanetary emission in some cases. At mid-infrared and longer wavelengths, scattered starlight is unlikely to introduce significant confusion because of the dependence in .
3 Results
We review SEDs of pure circumplanetary sphere (CPS) models in section 3.1, and combined circumplanetary disc (CPD) + sphere models in section 3.2. In those sections we concentrate on the effects of varying planet mass and dust-to-gas ratio ; other parameters of protoplanet radius , stellocentric radius , and circumstellar disc surface density are explored in section 3.3. An application of our model to the protoplanet PDS 70c is presented in section 3.4.
3.1 SEDs of circumplanetary spheres (CPSs)
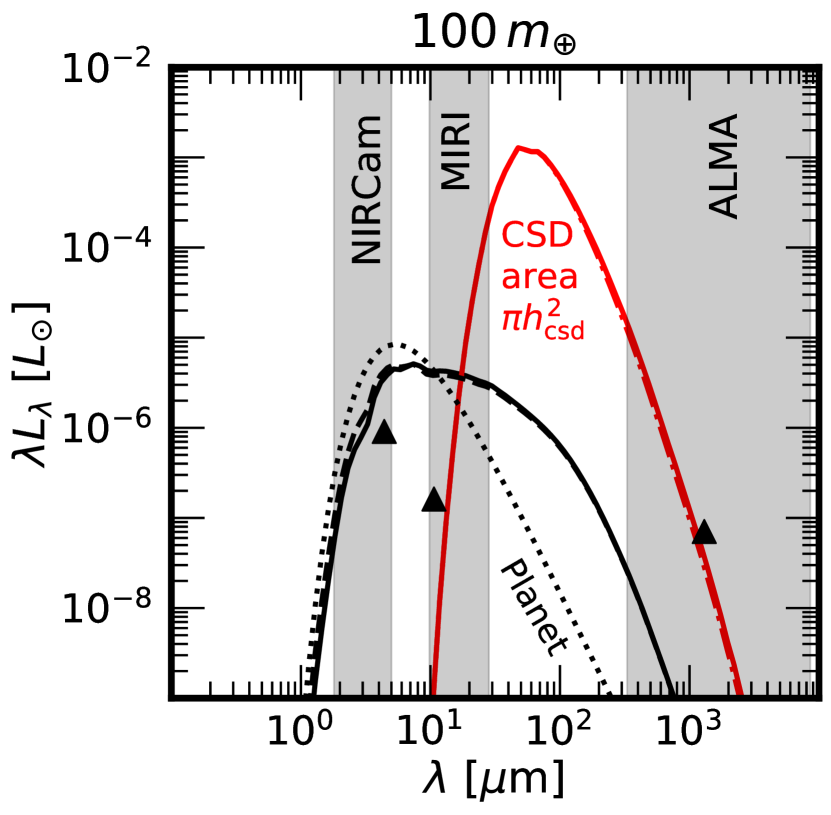
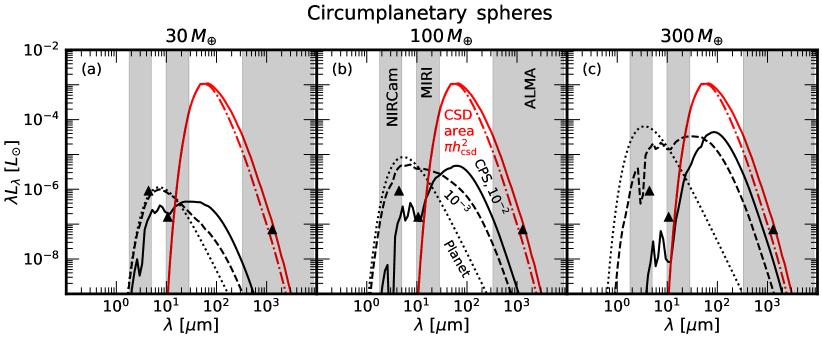
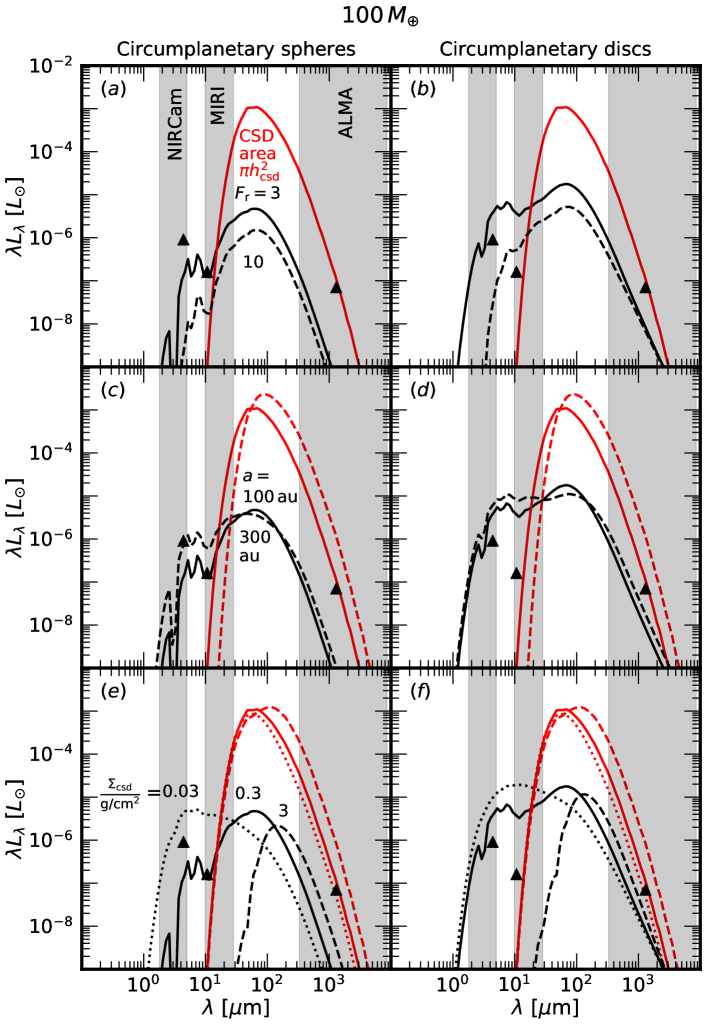
Figure 3 shows SEDs for accreting protoplanets of different masses surrounded by spherically symmetric dust envelopes. For protoplanets that are times puffier than mature (cooled) planets, most of the accretion shock power is radiated at wavelengths 3-6 m (dotted curves in Fig. 3), corresponding to temperatures -1000 K. Radiation at these near-infrared wavelengths is attenuated by dust extinction from the CPS (solid and dashed black curves). More massive planets are more heavily obscured because they pull down more gas and dust into their Bondi spheres (Figure 4a-c), with optical depths ranging from 0.1-10 (Fig. 4d-f). The CPS photospheres are cold enough to retain water ice on grains ( K; Fig. 4g-i); the 2.7 m vibrational resonance from ice appears in absorption (Fig. 3, middle and right panels) and can carve out significant amounts of near-infrared flux. The intercepted near-infrared power is re-processed out to wavelengths 10-1000 m.
Fig. 3 shows that for m, the local circumstellar disc (CSD, red curve) is orders of magnitude brighter than the CPS. Prospects for directly imaging an embedded planet are much better at m where contamination from the CSD is weaker. Fig. 3 plots detection limits for near-infrared coronographic imaging with JWST’s NIRCam (the James Webb Space Telescope’s near-infrared camera) and MIRI (mid-infrared instrument). At m, protoplanets more massive than Saturn () may be bright enough to be detected with NIRCam against the glare of their host stars, if the dust-to-gas ratio in the circumplanetary environment is sufficiently sub-solar. A similar statement applies at m for imaged with MIRI.
3.2 SEDs of circumplanetary discs (CPDs)
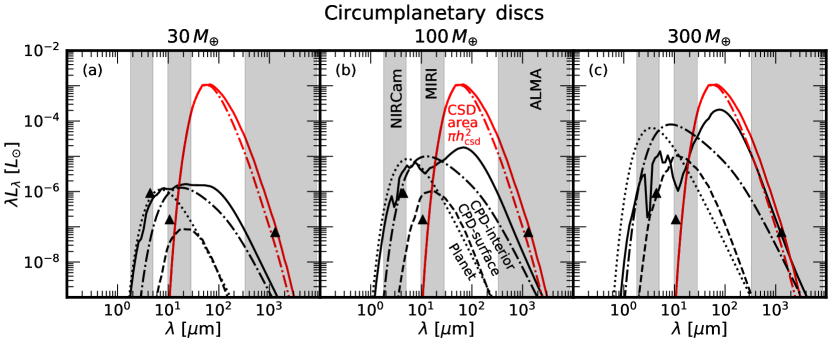
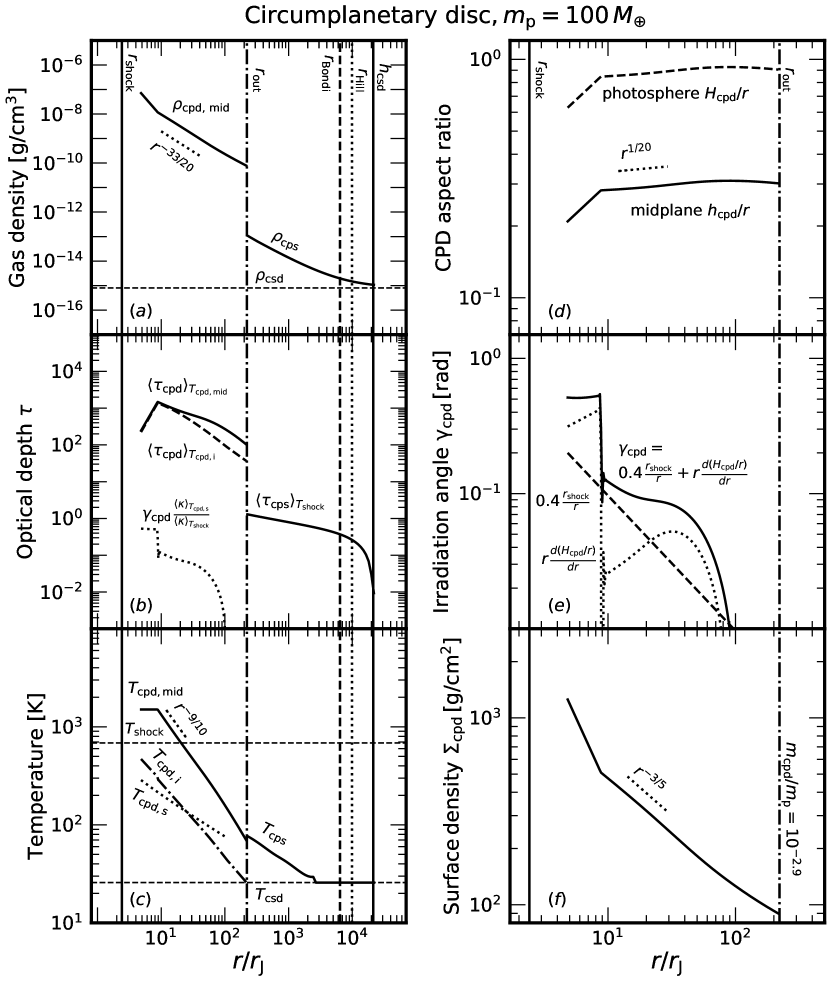
Figure 5 shows SEDs for protoplanets surrounded by circumplanetary discs. Our CPDs are largely self-luminous: most of the emission arises from the viscously heated CPD interior (dash-dotted curve), not from surface layers that reprocess radiation from the central planet (dashed curve). Figure 6 diagnoses why. Our CPDs flare only weakly (; Fig. 6d), keeping the radiation grazing angle low (Fig. 6e), and by extension the optical depth of the surface layers low (Fig. 6b, dotted curve). If our CPD were perfectly flat (i.e. had a grazing angle ), internal heating would exceed external irradiation by about an order of magnitude.222The scalings of effective temperature with radius are identical () between a viscously heated disc accreting at some steady rate, and a perfectly flat disc passively reprocessing light from a central source powered by accretion at the same rate (e.g. Shu 1992). But the order-unity coefficients are such that the emitted fluxes () of the former exceed those of the latter by about a factor of 10.
The CPD emission, which peaks in the mid-infrared (shifting in Fig. 5 from -30 m to 5-10 m as the planet mass increases and CPD temperatures increase), is reprocessed into the far-infrared at m by the surrounding CPS (Fig. 5 solid curve). In our model, higher planet masses have denser CPS envelopes which convert more of the emission from short wavelengths to long. For our model, the CPS is marginally optically thick to near-infrared light from the central accretion shock (Fig. 6b, solid curve to the right), for our assumed . Lowering by factors of 10–100 would render the CPS optically thinner and boost the emergent near-infrared power at the expense of the far-infrared power (while not much changing the emission from the underlying CPD which is robustly optically thick; Fig. 6b, solid curve to the left).
As in spherically symmetric pure-CPS models, the emergent SED from CPD models is masked by circumstellar (CSD) emission longward of 20 m (red curve in Fig. 5). We conclude that, regardless of how circumplanetary material is spatially distributed, detection prospects for embedded planets are best at m, where emission from the relatively hot accretion shock (plus radiation from the planet’s interior) stands out against the cooler circumstellar disc. The planetary near-infrared emission is less extincted when circumplanetary material is flattened into a face-on disc; Saturn and higher-mass planets can conceivably be detected with JWST NIRCam in our CPD models (Fig. 5) but may not be in our CPS models (Fig. 3). At m, detection of 30 planets with MIRI appears possible in both CPD and CPS models.
3.3 Other model parameters
Figure 7 explores how CPS and CPD SEDs depend on the normalised protoplanet size , orbital radius , and background gas surface density . We vary these parameters one at a time while holding the others fixed at , the values used in Figs. 3-6.
Puffier protoplanets (larger ) are more difficult to detect because they have lower accretion luminosities (at fixed and ) and therefore less emission overall (Fig. 7a-b). Increasing the planet’s orbital radius does not much affect the emergent SED in either CPS or CPD models (Fig. 7c-d). However, farther from the star, the CSD is cooler (at au we set K) and so its SED shifts to longer wavelengths, opening up the possibility of detecting protoplanet emission against the CSD background with MIRI (JWST’s mid-infrared instrument). A lower background surface density reduces the extinction from the CPS (or outer CPS shell in CPD models), allowing more of the near-infrared flux from the accreting protoplanet to emerge unimpeded (Fig. 7e-f).
We found that changing the disc viscosity parameter from to does not noticeably affect the SED (data not shown). Increasing reduces the mass in the CPD (at assumed fixed , but the CPD emission is independent of mass insofar as it comes mostly from the photosphere of the optically thick interior.
3.4 Application to PDS 70c
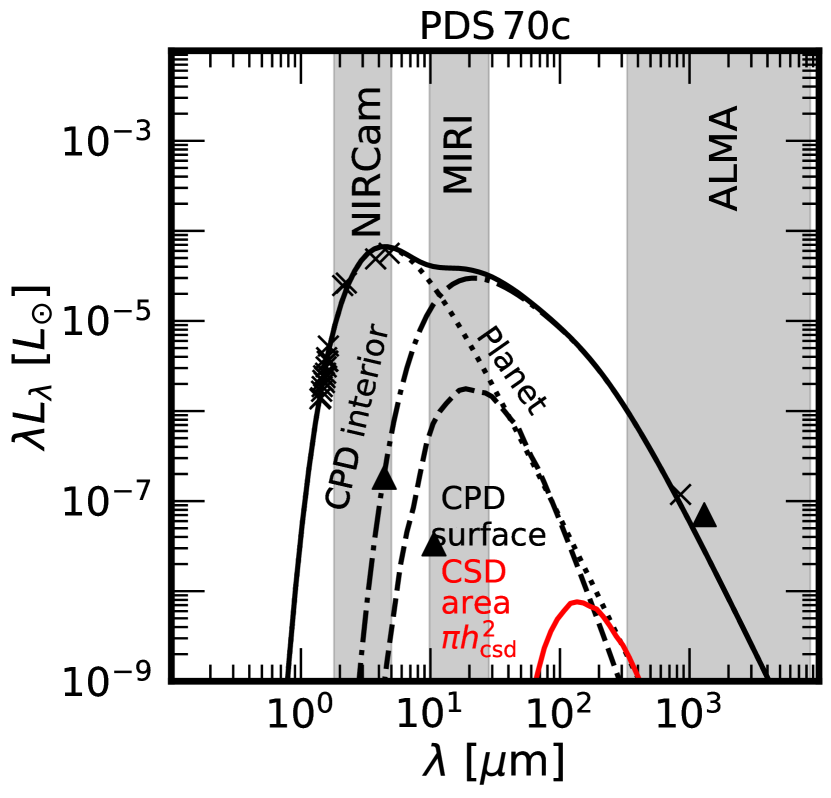
We apply our model to reproducing the SED of PDS 70c, a confirmed protoplanet of mass - and age Myr (for these and other parameters of the PDS 70 system, see Choksi et al. 2023, Choksi & Chiang 2022, and references therein). The planet is located 34 au from a star within a transitional circumstellar disc cavity of surface density g/cm2, dust-to-gas ratio , and temperature K (Portilla-Revelo et al. 2023). Given the above parameters, PDS 70c is “superthermal”, i.e. its gravitational sphere of influence is limited not to its Bondi sphere but to its Hill sphere, whose radius exceeds the CSD gas scale height. Accordingly, most of the CSD material should accrete into the Hill sphere at lower planet latitudes, closer to the disc midplane (see e.g. figure 7 of Choksi et al. 2023). Thus we consider a pure-CPD model for PDS 70c, omitting the surrounding CPS shell on Bondi scales. (We do not model PDS 70b, but note that its mass and observed near-infrared and mm-wave brightness are similar to those of PDS 70c; see, e.g., Choksi & Chiang 2022.)
Figure 8 shows our model SED (solid curve) fitted by eye to the observations (crosses). All the near-infrared fluxes from to 4 m originate from the accretion shock, a spherical blackbody of mass and radius , accreting at rate . These values are broadly consistent with those inferred by Wang et al. (2020). Our adopted accretion rate is within a factor of 2 of the theoretical maximum of computed according to equation (18) of Choksi et al. (2023) for our parameters.
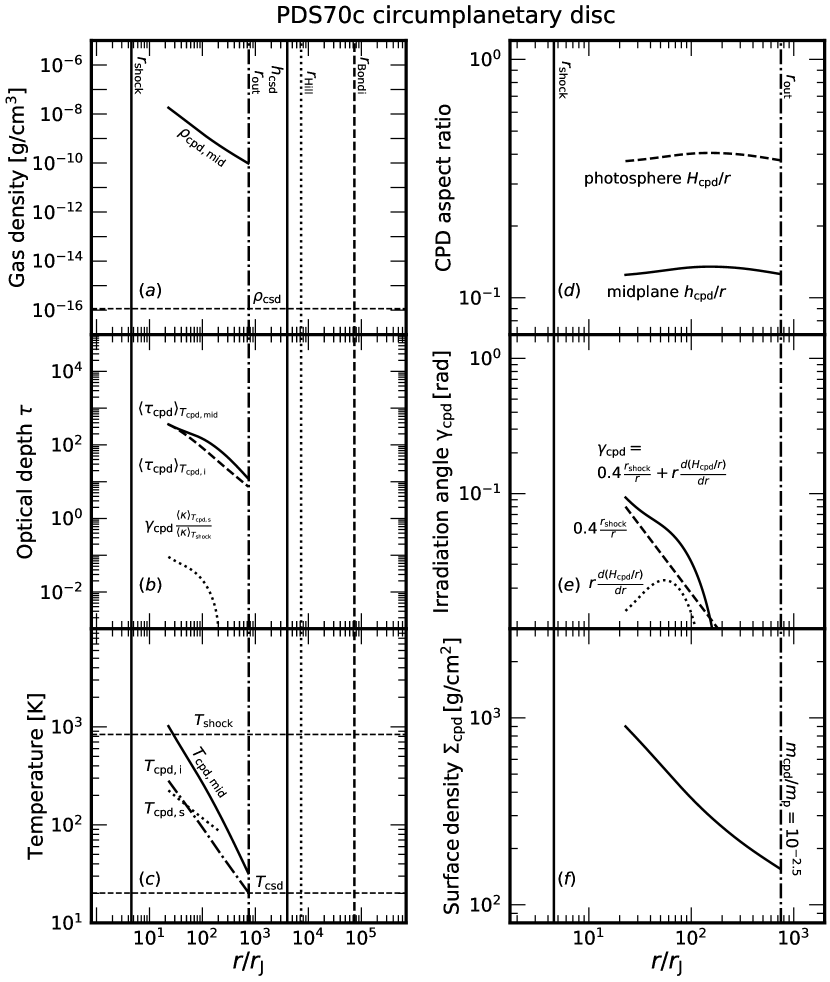
The mm-wave flux measurement from the Atacama Large Millimeter Array (ALMA; Benisty et al. 2021) can be reproduced with a viscously heated CPD extending to an outer radius of 700 , about 1/10 the Hill radius, small enough to avoid being resolved by ALMA. The CPD easily outshines local circumstellar disc material which is optically thin even to host stellar radiation (thus only the first term on the right-hand side of equation 17 need be accounted for, for an assumed K). For our assumed , the CPD mass is . For further model details, see Figure 9.
| (1) | (2) | (3) | (4) | (5) | (6) | (7) | (8) | (9) | (10) | (11) | (12) | (13) |
| Name | ||||||||||||
| Sz 114 | 0.17 | 39 | … | 0.01-0.02 | 0.01-0.02 | 290-340 | 10-20 | 0.2-0.4 | ||||
| GW Lup | 0.46 | 74 | … | 0.007-0.03 | 0.003-0.02 | 200-300 | 15-23 | 0.06-0.6 | ||||
| Elias 20 | 0.48 | 25 | … | 0.03-0.07 | 0.03-0.08 | 400-500 | 10-13 | 1-4 | ||||
| Elias 27 | 0.49 | 69 | … | 0.01-0.07 | 0.01-0.08 | 300-500 | 10-20 | 0.4-6 | ||||
| RU Lup | 0.63 | 29 | … | 0.03-0.07 | 0.07-0.1 | 500-600 | 9-10 | 2-4 | ||||
| SR 4 | 0.68 | 11 | … | 0.2-2 | 0.2-3 | 600-2000 | 3-8 | 20-700 | ||||
| Elias 24 | 0.8 | 55 | … | 0.5-5 | 0.2-2 | 700-2000 | 3-7 | 40-1000 | ||||
| TW Hya-G1 | 0.8 | 21 | 0.04-3 | 0.03-0.3 | 0.003-0.03 | 200-400 | 10-20 | 1-30 | ||||
| TW Hya-G2 | 0.8 | 85 | 0.008-0.2 | 0.02-0.2 | 0.002-0.02 | 200-300 | 20-30 | 0.5-10 | ||||
| Sz 129 | 0.83 | 41 | … | 0.02-0.03 | 0.004-0.008 | 200-300 | 19-22 | 0.1-0.3 | ||||
| DoAr 25-G1 | 0.95 | 98 | … | 0.07-0.1 | 0.03-0.05 | 390-430 | 12-13 | 2-4 | ||||
| DoAr 25-G2 | 0.95 | 125 | … | 0.02-0.03 | 0.008-0.02 | 280-330 | 15-19 | 0.3-0.7 | ||||
| IM Lup | 1.1 | 117 | 0.1-10 | 0.03-0.1 | 0.07-0.2 | 500-600 | 8-10 | 2-8 | ||||
| AS 209-G1 | 1.2 | 9 | … | 0.2-2 | 0.2-2 | 600-2000 | 3-8 | 20-700 | ||||
| AS 209-G2 | 1.2 | 99 | 0.04-0.4 | 0.1-0.7 | 0.1-0.7 | 500-900 | 6-10 | 8-100 | ||||
| 1.2 | 240 | 0.0002-0.1 | 0.01-0.05 | 0.01-0.05 | 300-400 | 10-20 | 0.4-3 | |||||
| HD 142666 | 1.58 | 16 | … | 0.03-0.3 | 0.003-0.03 | 200-400 | 10-20 | 0.2-5 | ||||
| HD 169142 | 1.65 | 37 | 0.1-0.2 | 0.1-1 | 0.01-0.1 | 300-600 | 8-20 | 2-40 | ||||
| 1.9 | 100 | … | 3-100 | 0.3-10 | 1000-9000 | 0.6-5 | 100-20000 | |||||
| HD 143006-G1 | 1.78 | 22 | … | 1-20 | 0.3-5 | 900-4000 | 1-6 | 60-4000 | ||||
| HD 163296-G1 | 2.0 | 10 | … | 0.1-0.7 | 0.01-0.07 | 300-500 | 10-20 | 2-30 | ||||
| HD 163296-G2 | 2.0 | 48 | 1-40 | 0.3-2 | 0.03-0.2 | 400-900 | 6-10 | 9-200 | ||||
| HD 163296-G3 | 2.0 | 86 | 0.1-20 | 0.03-1 | 0.003-0.1 | 200-600 | 8-20 | 0.4-50 | ||||
| 2.0 | 137 | 0.2-7 | 0.002-1 | 0.0002-0.1 | 100-700 | 8-40 | 0.01-80 | |||||
| 2.0 | 108 | 0.5-10 | 0.2 | 0.02 | -6.0 | 300.0 | 10.0 | 6.0 | ||||
| 2.0 | 260 | 0.1-2 | 0.01-2 | 0.001-0.2 | 200-800 | 6-30 | 0.1-200 | |||||
| AB Aur | 2.4 | 94 | … | 9-100 | 4-60 | 3000-20000 | 0.3-2 | 2000-100000 | ||||
| PDS 70b | 0.88 | 22 | 0.0008-0.08 | 1-10 | 0.2-2 | 700-2000 | 2-7 | 70-2000 | ||||
| PDS 70c | 0.88 | 34 | 0.0008-0.08 | 1-10 | 0.2-2 | 700-2000 | 2-7 | 70-2000 |
4 Summary and Discussion
To aid ongoing efforts to directly image protoplanets, we have computed the broadband spectral energy distributions (SEDs) of planets embedded within and accreting from their parent circumstellar discs. The accreting protoplanet is modeled as a spherical blackbody, emitting radiation shortward of a few microns wavelength. The longer wavelength emission, from the mid-infrared to the radio, arises from circumplanetary dust whose distribution can be spherical or disc-like. From numerical simulations (e.g. Choksi et al. 2023 and references therein), it seems plausible that more spherical, Bondi-sized envelopes surround lower-mass subthermal planets (sub-Jupiters orbiting outside 10 au from their host stars). Higher-mass superthermal planets may be orbited by discs filling a fraction of their Hill radii. Circumplanetary dust reprocesses light from the central accreting protoplanet, and can also be heated locally by dissipative processes.
A lesson learned from our modeling is that circumplanetary material is hard to see against the background circumstellar disc at wavelengths longer than 10 microns. The protoplanet has to contend with a typically flared circumstellar disc which intercepts an order-unity fraction of light from its host star. A patch of the circumstellar disc, located near the planet and having dimensions on the order of a scale height, can emit up to 0.1% of the stellar luminosity. Most of that power emerges from the uppermost layer of the circumstellar disc which directly absorbs starlight at visible wavelengths, reprocessing it to the same long wavelengths characterizing circumplanetary material. Even the circumstellar gaps observed by the Atacama Large Millimeter Array (ALMA) may be optically thick to incident starlight, thereby emitting strongly from mid-infrared to radio wavelengths. Such contaminating light may frustrate searches for protoplanets using ALMA or the long-wavelength portion of the James Webb Space Telescope’s Mid-Infrared Instrument (MIRI). Previous protoplanet SED models omitted consideration of background circumstellar disc light (e.g. Zhu 2015; Adams & Batygin 2022; Taylor & Adams 2024) or may not have resolved the circumstellar disc surface layers where starlight is absorbed (e.g. section 2.2 of Szulágyi et al. 2019 and section 2.3 of Krieger & Wolf 2022).
The good news is that protoplanets may outshine enshrouding circumstellar discs at shorter wavelengths, in the near-infrared, since protoplanet temperatures of 1000 K are much greater than circumstellar disc temperatures of 30 K. Detectability of the planet photosphere or accretion shock is expected to rise sharply with planet mass. The larger the mass, the higher the cooling luminosity; the higher the accretion luminosity; and the less extincted the planet’s light may be, as more of the circumplanetary dust is in a disc than in an envelope. Table 2 compiles protoplanets hypothesized to reside within gapped discs, and provides estimates for their accretion rates, luminosities, shock temperatures, and peak blackbody fluxes (assuming no extinction). The brightest candidate sources all peak in the near-infrared, presenting potential targets for JWST’s Near-Infrared Camera (NIRCam) and the short-wavelength portion of MIRI. Near-infrared searches are in progress (e.g. Cugno et al. 2023b). Even at these shorter wavelengths, though, detection may be thwarted by circumplanetary dust extinction, unless dust-to-gas ratios are substantially subsolar (Fig. 3, middle panel) and/or dust settles into a disc (Fig. 5, middle panel). Near-infrared starlight scattered off the circumstellar disc may also introduce confusion, but probably only for lower mass protoplanets.
Radiation at infrared and shorter wavelengths traces protoplanet gas accretion, the dynamics of which are not completely understood. Of particular interest are the growth rates when planet gas masses exceed solid core masses; in this hydrodynamic (a.k.a. runaway) regime, how accretion plays out determines the final masses of gas giants. Recent work has established an upper bound on the hydrodynamic growth rate (Choksi et al. 2023; Li et al. 2023) but the extent to which actual accretion rates approach the theoretical maximum has yet to be calculated from first principles. At issue are mechanisms for angular momentum transport within circumplanetary discs; candidate mechanisms include a Lindblad torque from the host star (Zhu et al. 2016; Xu & Goodman 2018), and self-gravity (Gammie 2001). Although the case remains tenuous, the protoplanet PDS 70c may be accreting at nearly the maximum rate, predicted to be from equation (18) of Choksi et al. (2023). This rate is within a factor of two of the planet’s time-averaged accretion rate (see also fig. 13 of Choksi et al. 2023). It also yields an accretion luminosity of order that appears consistent with the observed near-infrared SED (Wang et al. 2020) and the observed mm-wave flux measured by Benisty et al. (2021), as we have shown with our SED model (Fig. 8; see a similar no-extinction, circumplanetary disc scenario in section 3.3 of Choksi & Chiang 2022). Unexplained in this picture is why the mm excess detected around the sibling protoplanet PDS 70b, though similar in total flux to PDS 70c, is more spatially extended (Isella et al., 2019; Benisty et al., 2021). Also puzzling is why an accretion-powered ultraviolet excess is observed for PDS 70b but not for PDS 70c (Zhou et al. 2021). Perhaps accretional excesses, like line emission for accreting protostars, are time-variable. Filling in the gaps in our understanding will require filling in the gaps in the SEDs, which should be possible across all wavelengths, including the mid-infrared, for sources like PDS 70c and b that are relatively unobscured by their host circumstellar discs.
Acknowledgements
We thank Til Birnstiel, Brendan Bowler, Gabriele Cugno, Gabriel Dominique-Marleau, Kees Dullemond, Gaspard Duchêne, Haochang Jiang, Jane Huang, Ya-Ping Li, Wenbin Lu, Ruth Murray-Clay, and Daniel Thorngren for useful exchanges. Financial support was provided by NSF AST grant 2205500 and a Simons Investigator award, and an NSF Graduate Research Fellowship to NC.
Data availability
Data and codes are available upon request of the authors.
References
- Adams & Batygin (2022) Adams F. C., Batygin K., 2022, ApJ, 934, 111
- Andrews et al. (2011) Andrews S. M., Wilner D. J., Espaillat C., Hughes A. M., Dullemond C. P., McClure M. K., Qi C., Brown J. M., 2011, ApJ, 732, 42
- Andrews et al. (2018) Andrews S. M., et al., 2018, ApJ, 869, L41
- Andrews et al. (2021) Andrews S. M., et al., 2021, arXiv e-prints, arXiv:2105.08821
- Aoyama & Ikoma (2019) Aoyama Y., Ikoma M., 2019, ApJ, 885, L29
- Aoyama et al. (2020) Aoyama Y., Marleau G.-D., Mordasini C., Ikoma M., 2020, arXiv e-prints, arXiv:2011.06608
- Aoyama et al. (2021) Aoyama Y., Marleau G.-D., Ikoma M., Mordasini C., 2021, ApJ, 917, L30
- Asensio-Torres et al. (2021) Asensio-Torres R., et al., 2021, A&A, 652, A101
- Bae et al. (2022) Bae J., et al., 2022, ApJ, 934, L20
- Benisty et al. (2021) Benisty M., et al., 2021, ApJ, 916, L2
- Berardo et al. (2017) Berardo D., Cumming A., Marleau G.-D., 2017, ApJ, 834, 149
- Béthune & Rafikov (2019) Béthune W., Rafikov R. R., 2019, MNRAS, 488, 2365
- Birnstiel et al. (2018) Birnstiel T., et al., 2018, ApJ, 869, L45
- Boccaletti et al. (2022) Boccaletti A., et al., 2022, A&A, 667, A165
- Bondi (1952) Bondi H., 1952, MNRAS, 112, 195
- Carter et al. (2023) Carter A. L., et al., 2023, ApJ, 951, L20
- Chen & Szulágyi (2022) Chen X., Szulágyi J., 2022, MNRAS, 516, 506
- Chiang & Goldreich (1997) Chiang E. I., Goldreich P., 1997, ApJ, 490, 368
- Chiang et al. (2001) Chiang E. I., Joung M. K., Creech-Eakman M. J., Qi C., Kessler J. E., Blake G. A., van Dishoeck E. F., 2001, ApJ, 547, 1077
- Choi et al. (2016) Choi J., Dotter A., Conroy C., Cantiello M., Paxton B., Johnson B. D., 2016, ApJ, 823, 102
- Choksi & Chiang (2022) Choksi N., Chiang E., 2022, MNRAS, 510, 1657
- Choksi et al. (2023) Choksi N., Chiang E., Fung J., Zhu Z., 2023, MNRAS, 525, 2806
- Christiaens et al. (2024) Christiaens V., et al., 2024, arXiv e-prints, p. arXiv:2403.04855
- Cimerman et al. (2017) Cimerman N. P., Kuiper R., Ormel C. W., 2017, MNRAS, 471, 4662
- Cranmer (2004) Cranmer S. R., 2004, American Journal of Physics, 72, 1397
- Cugno et al. (2023a) Cugno G., et al., 2023a, arXiv e-prints, p. arXiv:2308.11714
- Cugno et al. (2023b) Cugno G., et al., 2023b, A&A, 669, A145
- Currie et al. (2022) Currie T., et al., 2022, Nature Astronomy, 6, 751
- D’Alessio et al. (1998) D’Alessio P., Cantö J., Calvet N., Lizano S., 1998, ApJ, 500, 411
- D’Alessio et al. (1999) D’Alessio P., Calvet N., Hartmann L., Lizano S., Cantó J., 1999, ApJ, 527, 893
- D’Angelo et al. (2003) D’Angelo G., Kley W., Henning T., 2003, ApJ, 586, 540
- Dong & Fung (2017) Dong R., Fung J., 2017, ApJ, 835, 146
- Dong et al. (2017) Dong R., Li S., Chiang E., Li H., 2017, ApJ, 843, 127
- Dullemond et al. (2012) Dullemond C. P., Juhasz A., Pohl A., Sereshti F., Shetty R., Peters T., Commercon B., Flock M., 2012, RADMC-3D: A multi-purpose radiative transfer tool, Astrophysics Source Code Library, record ascl:1202.015 (ascl:1202.015)
- Eisner (2015) Eisner J. A., 2015, ApJ, 803, L4
- Fung et al. (2019) Fung J., Zhu Z., Chiang E., 2019, ApJ, 887, 152
- Gammie (2001) Gammie C. F., 2001, ApJ, 553, 174
- Garufi et al. (2018) Garufi A., et al., 2018, A&A, 620, A94
- Ginzburg & Chiang (2019a) Ginzburg S., Chiang E., 2019a, MNRAS, 487, 681
- Ginzburg & Chiang (2019b) Ginzburg S., Chiang E., 2019b, MNRAS, 490, 4334
- Ginzburg & Chiang (2020) Ginzburg S., Chiang E., 2020, MNRAS, 491, L34
- Haffert et al. (2019) Haffert S. Y., Bohn A. J., de Boer J., Snellen I. A. G., Brinchmann J., Girard J. H., Keller C. U., Bacon R., 2019, Nature Astronomy, 3, 749
- Hammond et al. (2023) Hammond I., Christiaens V., Price D. J., Toci C., Pinte C., Juillard S., Garg H., 2023, MNRAS,
- Hashimoto et al. (2020) Hashimoto J., Aoyama Y., Konishi M., Uyama T., Takasao S., Ikoma M., Tanigawa T., 2020, AJ, 159, 222
- Huang et al. (2018) Huang J., et al., 2018, ApJ, 869, L42
- Isella et al. (2019) Isella A., Benisty M., Teague R., Bae J., Keppler M., Facchini S., Pérez L., 2019, ApJ, 879, L25
- Keppler et al. (2018) Keppler M., et al., 2018, A&A, 617, A44
- Keppler et al. (2019) Keppler M., et al., 2019, A&A, 625, A118
- Krapp et al. (2022) Krapp L., Kratter K. M., Youdin A. N., 2022, ApJ, 928, 156
- Krieger & Wolf (2022) Krieger A., Wolf S., 2022, A&A, 662, A99
- Li et al. (2023) Li Y.-P., Chen Y.-X., Lin D. N. C., 2023, MNRAS, 526, 5346
- Machida et al. (2010) Machida M. N., Kokubo E., Inutsuka S.-I., Matsumoto T., 2010, MNRAS, 405, 1227
- Marleau et al. (2017) Marleau G.-D., Klahr H., Kuiper R., Mordasini C., 2017, ApJ, 836, 221
- Mesa et al. (2019) Mesa D., et al., 2019, A&A, 632, A25
- Ormel et al. (2015) Ormel C. W., Shi J.-M., Kuiper R., 2015, MNRAS, 447, 3512
- Portilla-Revelo et al. (2023) Portilla-Revelo B., et al., 2023, A&A, 677, A76
- Shakura & Sunyaev (1973) Shakura N. I., Sunyaev R. A., 1973, A&A, 500, 33
- Shu (1992) Shu F. H., 1992, Physics of Astrophysics, Vol. II. University Science Books
- Szulágyi et al. (2018a) Szulágyi J., Plas G. v. d., Meyer M. R., Pohl A., Quanz S. P., Mayer L., Daemgen S., Tamburello V., 2018a, MNRAS, 473, 3573
- Szulágyi et al. (2018b) Szulágyi J., Plas G. v. d., Meyer M. R., Pohl A., Quanz S. P., Mayer L., Daemgen S., Tamburello V., 2018b, MNRAS, 473, 3573
- Szulágyi et al. (2019) Szulágyi J., Dullemond C. P., Pohl A., Quanz S. P., 2019, MNRAS, 487, 1248
- Tannirkulam et al. (2008) Tannirkulam A., et al., 2008, ApJ, 689, 513
- Taylor & Adams (2024) Taylor A. G., Adams F. C., 2024, arXiv e-prints, p. arXiv:2403.05662
- Thorngren et al. (2019) Thorngren D. P., Marley M. S., Fortney J. J., 2019, arXiv e-prints, p. arXiv:1909.09207
- Wagner et al. (2023) Wagner K., et al., 2023, Nature Astronomy,
- Wang et al. (2020) Wang J. J., et al., 2020, AJ, 159, 263
- Wang et al. (2021) Wang J. J., et al., 2021, AJ, 161, 148
- Xu & Goodman (2018) Xu W., Goodman J., 2018, MNRAS, 480, 4327
- Zhang et al. (2018) Zhang S., et al., 2018, ApJ, 869, L47
- Zhou et al. (2021) Zhou Y., et al., 2021, AJ, 161, 244
- Zhou et al. (2022) Zhou Y., et al., 2022, ApJ, 934, L13
- Zhou et al. (2023) Zhou Y., et al., 2023, AJ, 166, 220
- Zhu (2015) Zhu Z., 2015, ApJ, 799, 16
- Zhu et al. (2016) Zhu Z., Ju W., Stone J. M., 2016, ApJ, 832, 193
- Zurlo et al. (2020) Zurlo A., et al., 2020, A&A, 633, A119
Appendix A New Data in Table 2
Table 2 includes entries for candidate protoplanets in MWC 758 and AB Aur which are not found in the corresponding table in Choksi et al. (2023). We describe here the data underlying these new entries.
A.1 MWC 758
Wagner et al. (2023) identified a near-infrared point source and potential protoplanet in the disc around the star MWC 758. The mass of the star is and its age is (Garufi et al. 2018; note that the latter value is larger than the pre-Gaia value quoted in Wagner et al. 2023). The point source has a projected separation from the star of au (Wagner et al., 2023). The mass range quoted in Table 2 covers the range of masses for which Wagner et al. (2023) obtained acceptable fits to the near-infrared photometry (their fig. 3). Andrews et al. (2011) fit the mm-wave SED of the CSD and found at the location of the planet. We estimate the local midplane temperature assuming the CSD is vertically isothermal and in hydrostatic equilibrium.
A.2 AB Aur
Currie et al. (2022) identified a spatially resolved source at optical/near-infrared wavelengths in the AB Aur disc which they argue arises from an embedded protoplanet (but see Zhou et al. 2022, 2023 for an alternate interpretation). We use the planet and system properties listed in their table 1. The mass of the star is and its age is . The source has a projected separation from the star of au. The lower limit on the planet mass comes from modeling by Currie et al. (2022) of the source’s observed SED. The upper limit derives from Gaia and Hipparcos astrometry of the host star. We set K, as determined by Tannirkulam et al. (2008) from their fits to the infrared-to-mm CSD SED (their fig. 13).
Appendix B Dust scattering in CPS models
To assess the importance of light scattering by dust grains in our circumplanetary sphere (CPS) models, we reran our CPS model with isotropic dust scattering included in radmc3d. Figure 10 plots the scattering opacity as a function of wavelength for the same grain size distribution we used to calculate absorption opacities. Figure 11 shows the emergent CPS SED with and without scattering. Including scattering reduces slightly the amount of planetary radiation that escapes the CPS. For a dust-to-gas ratio of , the reduction in brightness in the F444W and F1065C bandpasses is at most 10%, not enough to change our conclusion that protoplanets could be detectable with NIRCam or the blue edge of MIRI. Also unchanged is our conclusion that longward of about 20 m, the CPS emission is masked by the circumstellar disc.