The Dynamic, Chimeric Inner Disk of PDS 70
Abstract
Transition disks, with inner regions depleted in dust and gas, could represent later stages of protoplanetary disk evolution when newly-formed planets are emerging. The PDS 70 system has attracted particular interest because of the presence of two giant planets at tens of au orbits within the inner disk cavity, at least one of which is itself accreting. However, the region around PDS 70 most relevant to understanding the planet populations revealed by exoplanet surveys of middle-aged stars is the inner disk, which is the dominant source of the system’s excess infrared emission but only marginally resolved by ALMA. Here we present and analyze time-series optical and infrared photometry and spectroscopy that reveal the inner disk to be dynamic on timescales of days to years, with occultation of sub-micron dust dimming the star at optical wavelengths and 3–5 µm emission varying due to changes in disk structure. Remarkably, the infrared emission from the innermost region (nearly) disappears for 1 year. We model the spectral energy distribution of the system and its time variation with a flattened warm (K) disk and a hotter (1200K) dust that could represent an inner rim or wall. The high dust-to-gas ratio of the inner disk relative to material accreting from the outer disk, means that the former could be a chimera consisting of depleted disk gas that is subsequently enriched with dust and volatiles produced by collisions and evaporation of planetesimals in the inner zone.
1 Introduction
CD-40 8434 (PDS 70), first identified as a T Tauri star based on its infrared excess (Gregorio-Hetem et al., 1992), has emerged as a key object in studies of late-stage protoplanetary disk evolution and planet formation. The star possesses a highly structured disk with gaps in both dust and gas (Long et al., 2018; Keppler et al., 2019) within which orbit two giant planets (Keppler et al., 2018; Haffert et al., 2019), both of which exhibit signatures of circumplanetary dust and/or accretion (Haffert et al., 2019; Christiaens et al., 2019; Isella et al., 2019; Hashimoto et al., 2020; Zhou et al., 2021; Benisty et al., 2021).
PDS 70 also hosts an inner disk interior to the two planets; its 10 au extent is only marginally resolved by ALMA at sub-mm wavelengths (Keppler et al., 2019). Dust in this disk dominates the emission from this system in the mid-infrared (3-25µm) and spectroscopy by Spizter and JWST find a dust temperature of 400–600K and strong crystalline silicate emission at 10 µm (Perotti et al., 2023). The disk is gas-poor but not gas-free (Long et al., 2018; Keppler et al., 2019; Facchini et al., 2021; Skinner & Audard, 2022; Portilla-Revelo et al., 2023); CO (and HCO+) was detected at mm wavelengths (Portilla-Revelo et al., 2023) but not the 4.6-µm fundamental band (Perotti et al., 2023) or its 2.3-µm overtone (Long et al., 2018). H2O and CO2 have been detected in emission with JWST (Perotti et al., 2023). Based on the mm-wave CO and continuum emission, Portilla-Revelo et al. (2023) estimated a gas-to-dust ratio of 10 , compared to the canonical ISM ratio of 100. Gas could originate in the outer disk and passing through the gap via a “bridge" suggested by ALMA imaging (Keppler et al., 2019). Micron-sized dust grains that are dynamically coupled to the gas can be carried into the inner disk, but condensation of silicates and ices at 30K in the outer disk and trapping of large particles in a pressure bump at its inner edge is predicted to deplete that gas.
Although Balmer H and X-ray emission from the star lie within the range of non-accreting weak-lined T Tauri stars (Joyce et al., 2020) and far-UV continuum emission from accretion shocks is absent (Skinner & Audard, 2022), the reversed profile of the H line and fluorescent H2 emission point to primordial disk gas and low-level ( M⊙ yr-1) accretion (Thanathibodee et al., 2020; Skinner & Audard, 2022). Absorption in the 1.083 µm He I triplet and emission in the forbidden [O I] 6300Å line (Campbell-White et al., 2023) reveal a wind that could drive this accretion (Thanathibodee et al., 2020).
Like many other T Tauri stars, emission from PDS 70 is variable (Batalha et al., 1998), and this variability is a probe of conditions in the inner disk. Sources of variability among T Tauri stars include; at optical wavelengths, accretion, rotation of the spotted stellar surface, and occultation by dust (Herbst et al., 1994; Cody et al., 2014); at 3–5 µm, hot dusty structures near the inner disk rim; and at longer wavelengths by time-dependent self-shadowing of the disk (Muzerolle et al., 2009). In some systems, anti-correlated “see-saw" variability of infrared emission around a pivot at µm is observed. The mid-infrared continuum of PDS 70 differs significantly in Spizter and JWST spectra obtained 15 years apart (Perotti et al., 2023). Photometry of PDS 70 by the WISE mission shows 0.15 mag variability in 25 µm emission over two one-day intervals that is anti-correlated with that at 3.4 and 4.6 µm.111Shadowing could also be responsible for asymmetric HCO+ emission from the outer disk of PDS 70 (Long et al., 2018), but the asymmetry seems conserved between two observations separated by over a year and it is unlikely these are shadows from the inner disk.
Here we present time-series photometry and spectroscopy of PDS 70 that more fully reveal its variability, and the nature of its inner disk. We propose that the variability and its time-dependence is a manifestation of the mode of accretion at the mobile inner edge of the disk, and is driven by variation in the stellar magnetic field and/or disk feedbacks on 1 year timescales. We also propose that the inner disk is a “chimera", consisting of depleted primordial gas mixed with the solid and gaseous products from the collisions, disintegration, and evaporation of planetesimals.
2 Observations and Data Reduction
2.1 TESS photometry
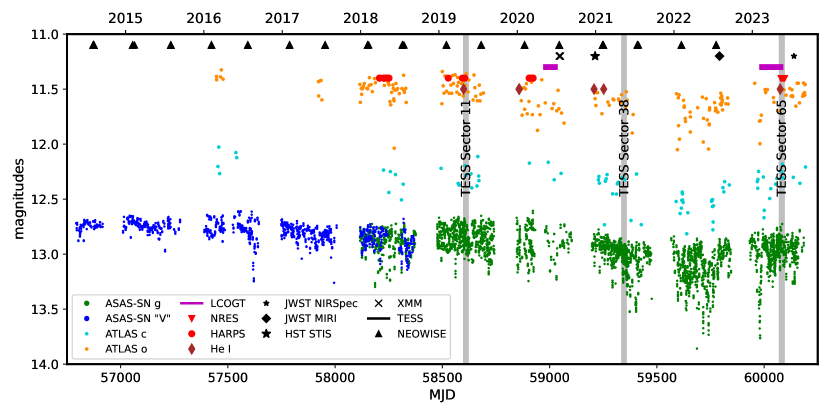
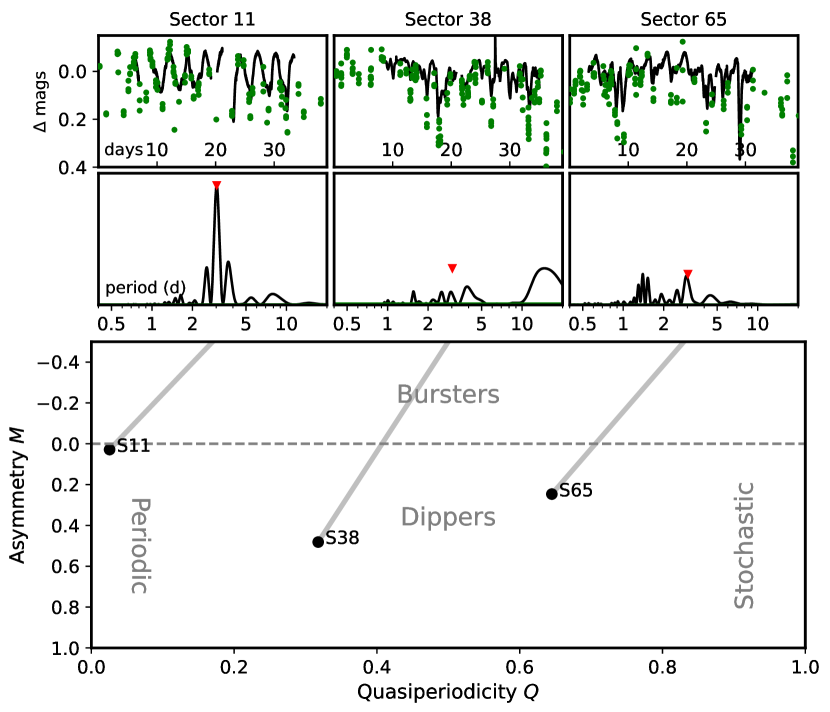
The TESS mission (Ricker et al., 2014) observed PDS 70 during Sectors 11 (23 April to 20 May 2019), 38 (29 April to 26 May 2021), and 65 (4 May to 2 June 2023, Fig. 1). Two-minute cadence PDCSAP lightcurves from Sectors 11 and 65 processed by the TESS mission and the 10-minute cadence Science Processing Operations Center (SPOC) lightcurve from Sector 38 were retrieved from the Mikulski Archives for Space Telescopes (Fig. 1). For each lightcurve, we performed a Lomb-Scargle periodograms (Scargle, 1982) and computed the asymmetry and quasi-periodicity parameters defined by Cody et al. (2014).
To evaluate the photometry stability of TESS photometry between sectors we identified 12 stars within 20’ and 0.5 magnitudes of the Gaia -band brightness of PDS 70 that have both Sector 11 and 38 lightcurves available (Sector 65 lightcurves of these stars were not available at that time of this manuscript’s preparation) and compared the median PDCSAP values. The median absolute deviation is 1.2%, much smaller than the observed variation for PDS 70.
2.2 LCOGT Photometry
We analyzed photometry obtained by the 0.4-m and 1-m telescope network of the Las Cumbres Global Observatory Telescope (LCOGT) as part of the Key Project “Catch a Fading Star: Probing the Planet-Forming Zones of Circumstellar Disks with LCO" (KEY-2020-007), as well as previous observations from the public LCOGT archive. 1-m and 0.4-m observations were made between 14 May and 23 June 2020 and 15 Feb and 11 May 2023, respectively (Fig. 1). Each 0.4-m telescope was equipped with an SBIG 6303 detector with 0".571 pixels and a 29’19’ field of view (FOV), while the 1-m telescopes are equipped with Sinistro 4K2 detectors with 0".389 pixels and have a 26’26’ FOV. Exposures were obtained through Sloan (4760Å) and (7720Å) filters with integration times of 10/5 sec (1-m) 280/50 sec (0.4-m).222Observations were obtained through other filters, but and provide ample wavelength baseline while avoiding variable H emission at 6563Å and systematics due to detector “fringing” in the far red. Pointings were designed to maximize the number of comparison stars of comparable brightness.
Images were automatically processed (bias removal, flat-fielding) using the BANZAI pipeline (McCully et al., 2018); source identification and aperture photometry was performed with SExtractor routines (Bertin & Arnouts, 1996). Instrumental magnitudes were calculated from count rates in an optimal elliptical Kron aperture (Kron, 1980). Lightcurves were produced using the procedures described in Gaidos et al. (2022) and summarized in Appendix A. and band lightcurves were combined into reddening-vs-dimming plots by pairing observations obtained within 60 minutes of each other (the typical cadence of our observations was 6 hr). We performed weighted linear regression of reddening vs. -band magnitude with three-sigma outlier rejection. We also rejected points that were brighter or fainter than all other points by 0.3 mags. The former filters flares which are frequent on very young, rapidly rotating stars, the latter filters erroneous -band measurements due to confusion with unrelated fainter sources that appears as variation in -band not accompanied by any -band variation, and produce slope-one excursion in a - vs. -band diagram. Uncertainties in slope were calculated by fitting Monte Carlo representations of the data constructed by bootstrap sampling with replacement.
2.3 ASAS-SN photometry
ASAS-SN is a distributed ground-based transient survey (e.g., Holoien et al., 2017) with five stations of four telescopes in both hemispheres plus two more telescopes at the Cerro Tololo International Observatory (CTIO) in Chile, one at McDonald Observatory in Texas, USA, and one at the South African Astrophysical Observatory in Sutherland, South Africa. Each ASAS-SN telescope is a 14-cm Nikon telephoto lenses with a back-illuminated, 20482 CCD camera with a 4.474.47-degree field of view. A transition from Cousins -band (5420Å) to Sloan -band (4750Å) filters occurred over 2017–2018, with a one-year overlap of observations in both passbands. Currently, ASAS-SN observes the entire visible sky every clear night to a depth of mag (Shappee et al., 2014; Kochanek et al., 2017; Hart et al., 2023). For a given visit ASAS-SN takes three dithered, tandem 90-sec exposures. All images are processed by a fully-automated reduction pipeline (Shappee et al. 2014). For the photometry used in this work we use the publicly accessible ASAS-SN Sky Patrol version 1 aperture photometry lightcurves333https://asas-sn.osu.edu/ (Kochanek et al., 2017). This tool performs forced aperture photometry at any position of the sky using a 2-pixel radius (16″) aperture in the IRAF apphot package. We note that PDS 70 is near the optimum brightness for ASAS-SN photometric precision (see Fig. 3 in Hart et al., 2023).
2.4 ATLAS photometry
The Asteroid Terrestrial Impact Last Alert System (ATLAS; Tonry et al., 2018) utilizes four 0.5-m f/2 Wright Schmidt telescopes, two in Hawai’i on Haleakalā and Mauna Loa, one in South Africa, and one in Chile. During typical survey operations, the telescopes obtain four 30-sec exposures per field each night, allowing the survey to cover the observable sky at daily cadence for equatorial targets and a two-day cadence for polar regions. ATLAS operates with two broad filters, the “cyan" () filter (5290Å) and the “orange" () filter (6750Å, Tonry et al., 2018). We obtained ATLAS light curves of PDS 70 from the ATLAS forced point-spread function (PSF) photometry service444https://fallingstar-data.com/forcedphot/, and specifically from the reduced images, prior to the subtraction of a reference image. After excluding epochs with poor data quality and rejecting outliers, we combined the intra-night epochs using a weighted mean to obtain deeper limits and more robust detections. Due to the southern declination of PDS 70, the effective cadence is low prior to ATLAS’s expansion to the southern hemisphere in January 2022.
2.5 WISE photometry
We obtained multi-epoch photometry produced by the WISE Cryogenic (Wright et al., 2010) mission and post-cryogenic NEOWISE (Mainzer et al., 2011) and NEOWISE Reactivation (Mainzer et al., 2014) missions from the NASA IPAC InfraRed Science Archive (IRSA). WISE cryogenic observations were made in four channels (W1–W4, centered at 3.4, 4.6, 12, and 25 µm), while NEOWISE data includes only channels W1 and W2. Magnitudes were converted to flux densities using the zero-magnitude fluxes for flat-spectrum objects published in the Explanatory Supplements to release products for the respective surveys (Cutri et al., 2013, 2015).
2.6 LCOGT NRES spectroscopy
Optical (3800-8600Å), high-resolution () spectra were obtained with the Network of Robotic Echelle Spectrographs (NRES; Siverd et al., 2018) spectrograph on the 1-m node of LCOGT at CTIO between 13 May and 2 June 2023. Exposure times were 1800 sec, and the median SNR in the vicinity of the H- line was 3-9 per spectral pixel. We performed median filtering of each spectrum and then fit a Gaussian to the smoothed version over the wavelength range 6560–6565.5Å. The equivalent width (EW) of the H- line was computed from the Gaussian fits.
2.7 HARPS spectroscopy
Twenty-two optical spectra (3780–6910Å) of PDS 70, obtained with the High Accuracy Radial velocity Planet Searcher (HARPS) spectrograph on the ESO 3.6-m telescope (Mayor et al., 2003) between 29 March 2018 and 15 March 2022, were retrieved from the ESO Archive Science Portal. The spectral resolution is 120,000 and the median SNR in the vicinity of the H line is 15-30 pix-1, with most near 30. These spectra were processed by the HARPS pipeline555https://www.ls.eso.org/lasilla/sciops/3p6/harps/manuals.html.
3 Results
3.1 Variability of PDS 70 from circumstellar dust
TESS lightcurves from three 27-day sectors over 4 years (2019–2023, Fig. 2) show photometric behavior that evolved from strongly periodic variability in Sector 11, with a 3.03 day signal previously identified as the stellar rotation period (Thanathibodee et al., 2020), to stochastic, asymmetric variability with weak or no periodicity and dimming events lasting 1 day in Sectors 38 and 65 (insets of Fig. 2). The bottom panel of Fig. 2 shows that, after 2019, the lightcurves’ quasi-periodicity parameter (the fraction of variability not captured by the dominant periodic signal; Cody et al., 2014) increases, while their asymmetry parameter (the skew between the 10th and 90th percentile in the brightness distribution; Cody et al., 2014) moves to positive values (more dimming than brightening) characteristic of T Tauri “dipper" stars that experience transient occultation by circumstellar dust (Cody et al., 2014; Ansdell et al., 2016).
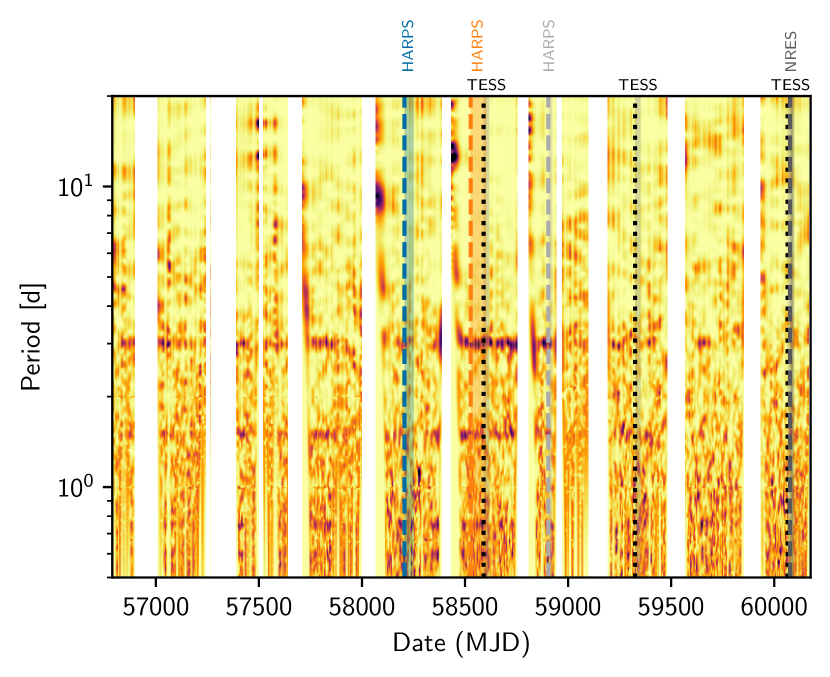
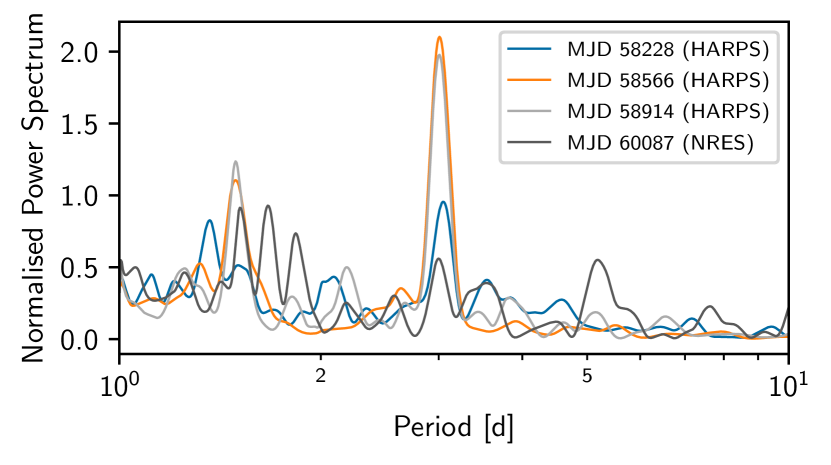
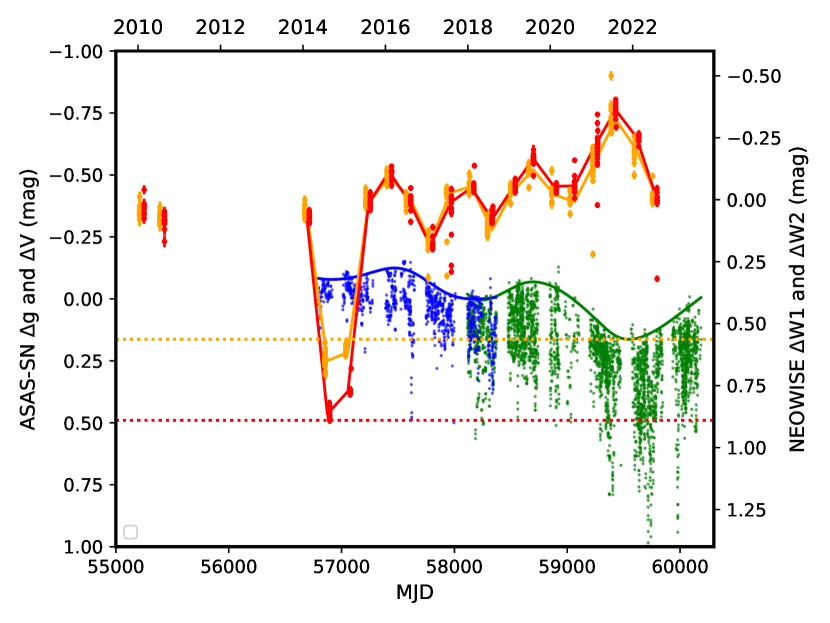
Both the ASAS-SN and ATLAS photometry show dipper-like variability that increases in amplitude after late 2019, although some of this difference is due to the ASAS-SN change from the - -band filters where scattering by dust (at shorter wavelengths) is greater (Fig. 1). The ASAS-SN data also contain a periodic signal: The upper panel of Fig. 3 shows the Lomb-Scargle wavelet-transform power spectrum of the time-series photometry using using a Gabor-Morlet wavelet, with the parameter governing the trade-off between time and frequency resolution set to . Each band-pass is separately normalised to yield the same median value within the period of overlap. Spectral power at the rotational period of 3 days, and its overtones, emerges at MJD 57500, peak at around MJD 58520, and diminishes thereafter.
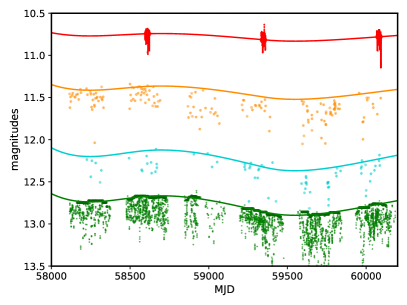
Time-series photometry in Sloan - and -bands obtained in 2020 with the 1-m LCOGT telescope array and nearly three years later with the 0.4-m array also contain dipping behavior (upper panels of Fig. 4). The slopes of the reddening-dimming trends constructed from these lightcurves (lower panels of Fig. 4) are consistent with occultation by dust, are much shallower than that seen among YSOs due to variable accretion or flaring (0.8; Gaidos et al. in prep), and have greater amplitude than the typical variability produced by rotation and spots . The best-fit slopes of the two reddening-dimming trends (black lines in in Fig. 4) differ significantly and are slightly shallower than the ISM value (blue lines).
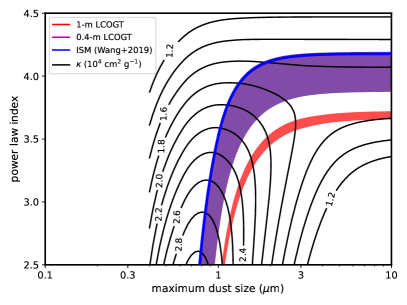
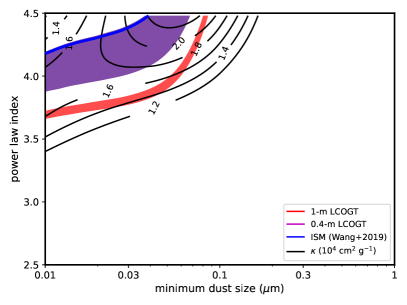
We inferred the dust size distribution by comparing these slopes to calculations of absorption and Mie scattering from a power-law particle size distribution with the complex optical constants of Budaj et al. (2015). We assumed a pure forsterite composition but the results do not change qualitatively with other silicate-dominated compositions because the extinction is primarily due to scattering. We used the template spectrum of a K7 solar-metallicity dwarf from the library of Kesseli et al. (2016) and Sloan pass-band response functions from the filter service of the Spanish Virtual Observatory. We considered two scenarios for the size distribution; one appropriate for the upper layers of a protoplanetary disk which has evolved from an ISM-like distribution where the maximum size of grains is limited by growth vs. settling; and the second appropriate for a debris disk where dust is produced by a collisional cascade and has a power-law distribution with index close to 3.5 (e.g., Williams & Wetherill, 1994; Tanaka et al., 1996) and a minimum size is set by Poynting-Robertson drag, radiation blow-out, or gas drag. Filled contours corresponding to the observed range of reddening-extinction slopes for PDS 70 as well as the ISM are plotted vs. maximum or minimum particle size in Fig. 5. Also plotted are contours of total opacity (scattering plus absorption) in units of cm2 g-1. Either scenario requires the presence of sub-micron grains; the presence of larger grains is allowed, but only if the size distribution is steeper than canonical ().
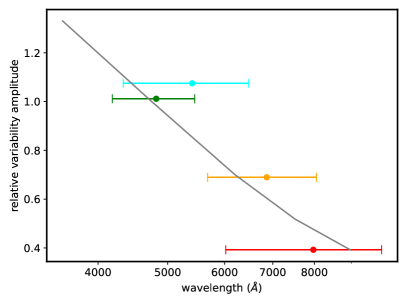
Rapid (days) variability of PDS 70 is superposed on longer-term variation. Figure 1 shows there is an envelope of maximum brightness which is most obvious in the ASAS-SN lightcurves, but is also present in ATLAS and TESS data. We fit the envelope of ASAS-SN data by moving a 100-day window over the data, recording the third brightest value with the mean time, and fitting a cubic spline with a smoothing parameter to those points. The number of knots in the spline was adjusted by the algorithm so that the of the spline fit was . We then fit this spline curve to the other, much sparser ATLAS photometry, allowing only the overall amplitude to vary. In the case of TESS we calculated medians of the brightest 90-99 percentile values for each sector and fit these three points. The inter-sector variation of PDS 70 recorded by TESS is 6.8%, 5.5 times the standard deviation seen among nearby stars (Sec. 2.1). The ASAS-SN, ATLAS, and TESS traces are plotted as the solid curves in Fig. 6a and the relative amplitudes of the curves are plotted vs. the passband wavelength in Fig. 6b. The wavelength dependence is consistent with scattering by ISM-like dust (black curve).
The cryogenic WISE and post-cryogenic NEOWISE 3.4 µm (W1) and 4.6 µm (W2) lightcurves of PDS 70 also contains variation on year-long timescales, with emission appearing to increase as the star dims in the optical (Fig. 7). Most notable is the 0.7–0.9 mag drop in emission for the duration of two consecutive day-long intervals in mid-2014 and early 2015 separated by about 6 months. The emission in both channels falls to a level close to that predicted for the photosphere flux (horizontal dashed lines in Fi.g 7). This does not appear to be a systematic: the WISE photometric quality flag (ph_qual) is set to "A" and the contamination and confusion flags (cc_flags) are set to zero for all observations, and the 10% of observations where frame quality score (frame_qual) is 0 do not correspond to the epochs in question. Moreover, the lightcurves of 2MASS J14083163-4121372 and UCAC4 244-066151, the two nearest stars (= 4’.6 and 6’.8) of comparable brightness ( = 1.6 and 1.2 mag) show no such dimming during this or any interval of NEOWISE observations. There is no comparable dimming in the ASAS-SN -band lightcurve at these epochs (Fig. 7), thus ruling out obscuration of the inner disk (and thus also the central star) by some external occulting object. This event is exceedingly unlikely to be two or more eclipses (e.g., by an equal-mass binary) because the dimming is consistent over 2 days, an eclipse longer than this would require a very wide orbit that would be statistically unlikely to be eclipsing. Also, it is unlikely that NEOWISE would observe two successive eclipses and no others. Thus the variation must come from disk emission. Similar drops have been found in the NEOWISE lightcurves of some Herbig Ae/Be stars (Mei et al., 2023). It is remarkable that after the drop the emission recovers to a level close to that before the event.
3.2 Spectroscopic variability due to accretion
NRES spectra contain persistent emission in the Balmer line of H I. The equivalent width (EW) of the line varied between 0.48 and 1.87Å, characteristic of weak-lined T Tauri stars (Barrado y Navascués & Martín, 2003), with no obvious correlation with the optical variability of the star as monitored by TESS (Fig. 8). Nor does there appear to be any correlation with stellar rotational phase (adopting a period of 3.03 days) although the phase coverage is limited. This range of EW overlaps with but is shifted higher than the range found by Thanathibodee et al. (2020) from HARPS spectra obtained in 2018.
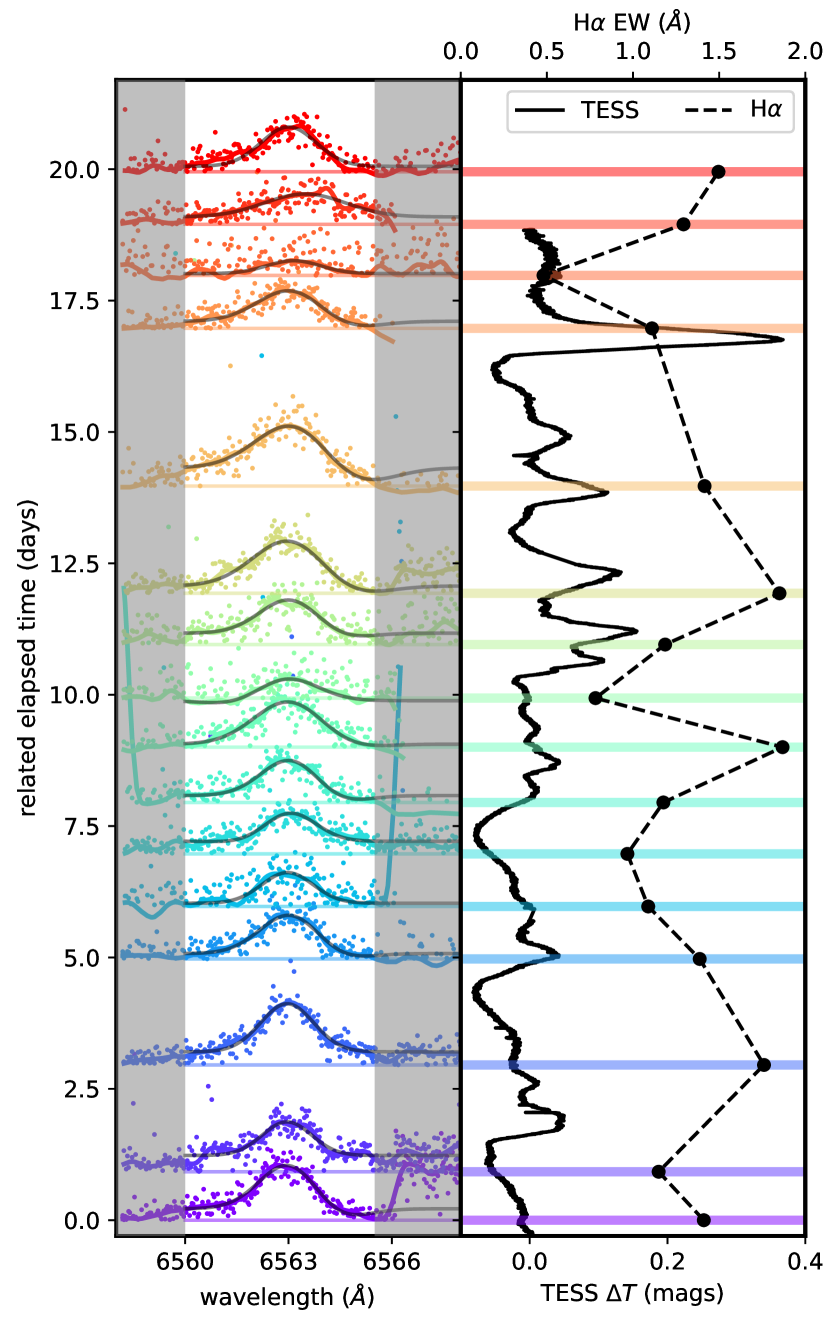
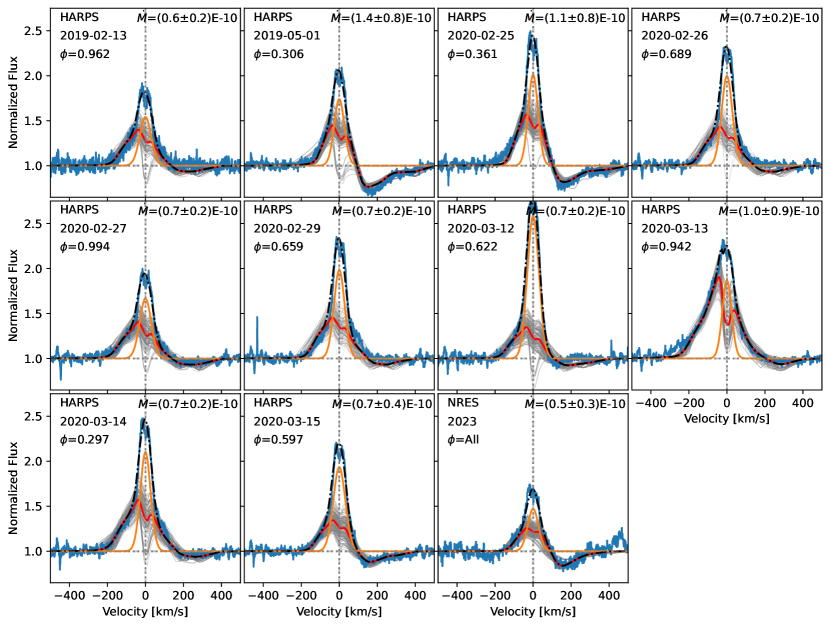
We adopted the procedure of Thanathibodee et al. (2023) to determine the magnetospheric accretion properties from the detailed profile of the H line. This procedure is appropriate for weak-lined T Tauri stars and low accretors like PDS 70 where stellar chromosphere makes a significant or dominant (and variable) contribution to the total H emission. Methods based on line luminosity alone (e.g., Alcalá et al., 2014) do not disambiguate chromospheric and accretion emission and cannot be reliably applied PDS 70, especially since its H EW is comparable to that of non-accreting “template" stars. We fit each HARPS profile, plus the summed low-signal NRES profiles, with a grid of magnetospheric accretion flow models generated by the code of Muzerolle et al. (2001). The parameters of the model and their ranges are described in detail by Thanathibodee et al. (2020). These include accretion rate (), maximum flow temperature K), magnetospheric truncation radius R∗), accretion flow width R∗), and the inclination of the magnetic axis (). The last is nominally the same as the known stellar inclination (50 deg) at each epoch, but was allowed to vary in case the stellar rotation and magnetic axes are not aligned. The model line profiles were convolved by the instrumental resolutions before fitting. As in Thanathibodee et al. (2023), we assumed that the cores of the lines are dominated by chromospheric emission, as expected for the low accretion rate of PDS 70, and we modeled emission with a Gaussian profile. We determined the parameters by non-linear least-squares fitting the combined Gaussian and model profile with the Python Scipy curve_fit function, which uses the Trust Region Reflective algorithm (Branch et al., 1999). The best-fit parameters of a given observation were taken to be the mean form the 100 fits with the lowest . Figure 9 shows the the H lines observed by HARPS at each epoch plus the summed NRES observations (blue lines), along with the best-fit models The inferred accretion rate and the relative rotational phases (using a 3.03-day rotation period and arbitrary zero point) are reported. The model does not reproduce some features on a few nights due to the assumed simple geometry (zero-obliquity, axisymmetric, dipolar flow), whereas real accretion flows may be much more complex, as predicted by MHD simulations and suggested by observations (e.g., Romanova et al., 2003, 2021; Zhu et al., 2024; Pouilly et al., 2021). The red-shifted absorption is particularly sensitive to the geometry, especially at low accretion rates when flows are expected to have low density and low optical depth (Thanathibodee et al., 2023).
4 Synthesis and model of the inner disk
4.1 Nature of the optical variability
Any model for the inner disk of PDS 70 should explain (1) the rapid optical variability due to sub-micron dust that evolves between periodic and aperiodic/stochastic behavior; (2) the long-term variability in both the baseline optical brightness and 3-5 µm emission, also due to dust (although not necessarily the same dust), including the disappearance of the latter for up to one year; and (3) a persistently low but not significantly variable rate of accretion based on H line profiles. It should also explain (4) the presence of primordial H and He, as evidenced by UV H2 line emission (Skinner & Audard, 2022), a reversed H profile, and a reversed He I profile (Thanathibodee et al., 2019); and (5) a low gas-to-dust ratio based on sub-mm CO and continuum emission (Long et al., 2018), and the presence of CO2 and H2O (Perotti et al., 2023).
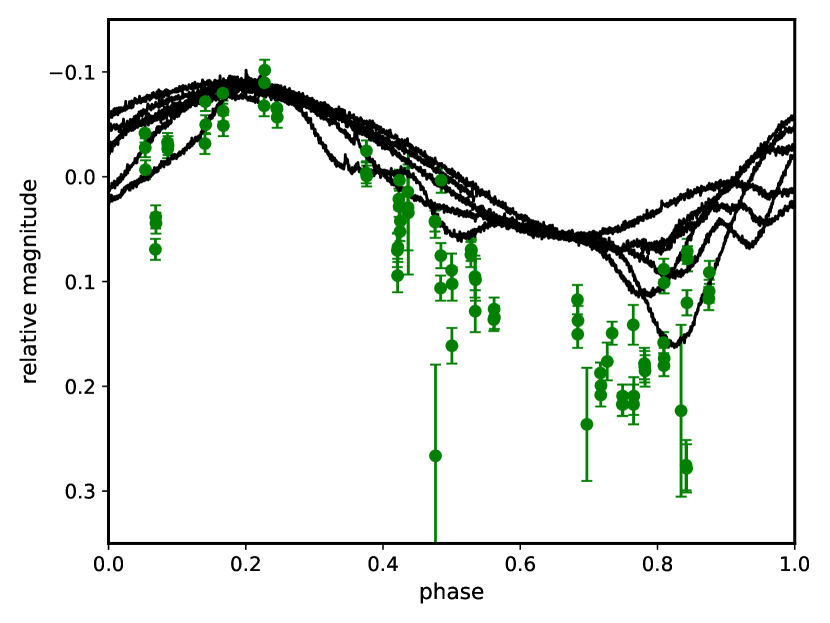
PDS 70 is optically variable on timescale of hours to days and its variability has evolved from between purely periodic to aperiodic “dipper"-like behavior over the timescale of years (Figs. 2 and 3). While the periodic behavior during TESS Sector 11 suggests rotational variability by spots, its large and wavelength-dependent amplitude (0.2 mags peak-to-peak in the TESS passband and larger in ASAS-SN data) and “scalloped" lightcurve morphology (Fig. 10) is similar to that seen around other young low-mass stars. This morphology been explained by scattering by sub-micron dust trapped by the stellar magnetic field at the co-rotation radius, where the orbital period equals the stellar rotation period (Stauffer et al., 2017, 2018; Zhan et al., 2019; Günther et al., 2022). In contrast, the later aperiodic variability of PDS 70 suggests occultation by dust located exterior to the co-rotation radius (Donati et al., 2019). The periodic signal (and its upper harmonic) was already present in ASASA-SN data by May 2014, peaked in intensity for about two years beginning mid-2018, then decreased in intensity and disappearing by March 2021, suggesting changes in the innermost location of dust relative to the co-rotation radius. Our multi-band LCOGT photometry unambiguously indicates that scattering by sub-micron dust is responsible for this dimming (Fig. 4), at least during the most recent aperiodic phase. Superposed on this pattern of rapid variability is an envelope of smoother variation in brightness on the timescale of 1 year (Fig. 6a). The trend of decreasing amplitude with increase wavelength (Fig. 6b) suggests that this also is due to sub-micron circumstellar dust. Such long-term variability is not highly unusual around T Tauri stars (e.g., Grankin et al., 2007; Rigon et al., 2017).
Thanathibodee et al. (2019) combined the 3-day period from the TESS Sector 11 lightcurve with a rotational line broadening of km sec-1 from high-resolution spectra to estimate a stellar inclination of deg, consistent with the inclination of the ALMA-resolved outer disk ( deg; Keppler et al., 2019). If the inner disk is aligned with stellar rotation, then disk dust will intercept the line of sight to the star only if it is diverted well above the midplane, e.g., by the stellar magnetic field. This can occur where the disk gas is (partially) ionized, magnetic field pressure dominates over viscous stresses or ram pressure produced by accretion, and if dust is dynamically coupled to the gas. This diversion truncates the disk, and if this truncation occurs inside the co-rotation radius then disk material loses angular momentum to the star and magnetospheric accretion will occur, i.e. through “funnels" onto the star (Bouvier et al., 2007). If truncation occurs outside the co-rotation then some of the disk can be accelerated away from the star and above the mid-plane in a magnetohydrodynamic wind, with a remainder accreted onto the star in “propeller accretion". We discuss the potential mechanisms and timescale of this evolution in Secs. 4.4 and 5.2.
4.2 Nature of the infrared variability
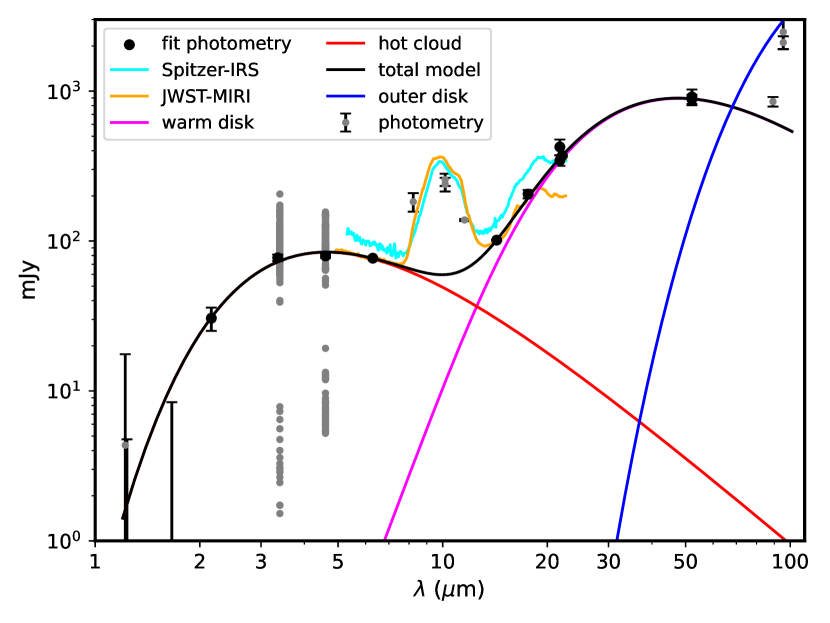
To describe the infrared emission and its variability in terms of this scenario we constructed a spectral energy distribution (SED) of the inner disk from photometry cataloged by the Virtual Observatory SED Analyzer, fit a solar-metallicity BT-SETTL stellar photosphere model (Allard et al., 2012) with CFIST solar abundances (Caffau et al., 2011) at wavelengths µm (where the disk contribution is negligible), and subtracted the best-fit model (=4000K, , ) from the photometry at longer wavelengths (Fig. 11). We then fit a disk model consisting of a “warm", optically-thick disk with a power-law temperature distribution with semi-major axis, plus an isothermal structure representing a “hot" interior disk wall or ring. The second component is motivated in part by the shape of the SED, and by the need for occulting dust close to the star to produce the dipper-like variability; at the 3.03-day co-rotation radius the blackbody equilibrium temperature is 1500K.
We fixed the inner disk inclination to that of the outer disk (51.7 deg; Keppler et al., 2019), motivated by the agreement with the stellar inclination (Thanathibodee et al., 2020), leaving five free parameters: hot component area and temperature , outer disk edge , temperature at the inner disk edge, and power-law index . For this fit we omitted the NEOWISE data (see below), photometry between 7.7 and 13.1 µm which is affected by silicate emission, as well as IRAS photometry at 100 µm, which is dominated by emission from the outer disk that starts at 50 au where the blackbody temperature would be 30K (blue curve in Fig. 11). We also omitted DENIS -band photometry which is somewhat higher than 2MASS (see Sec. 5.4). We included mean values in the ranges 5–7.7µm and 13.1–15.5µm from the JWST MIRI spectrum in lieu of the actual spectrum. A satisfactory fit (, 5 d.o.f.) was found for K, au2, K, au, and , and is plotted as the black curve in Fig. 11.
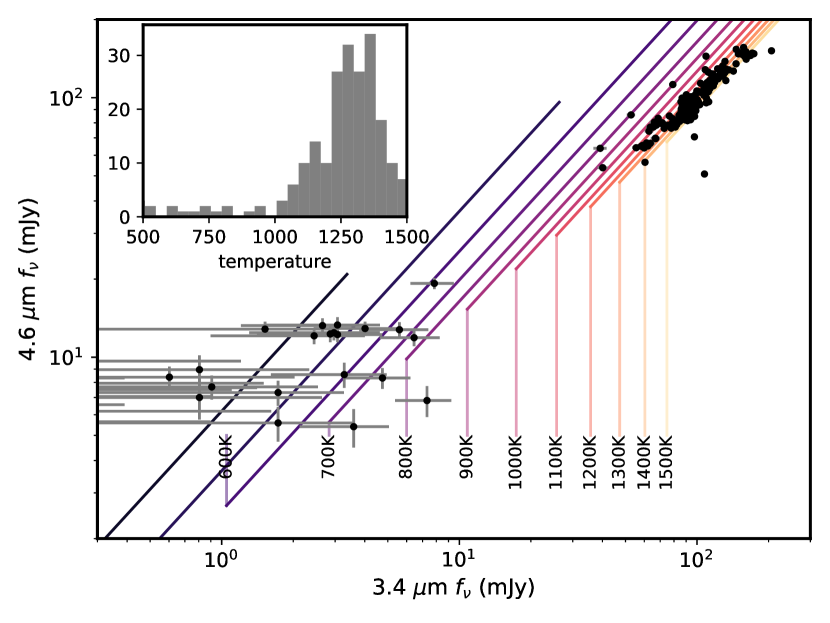
Variability in the NEOWISE 3.4 and 4.6 µm photometry on day- to year-timescales (Fig. 7) implies that the hot dust component must evolve. We modeled this variability by subtracting the warm disk component, assuming it is not variable or if it changes at all, does not contribute significantly at these wavelengths (Fig. 11), and that emission from the hot component can be described as a single but variable temperature. Figure 12 shows the variation in the W1 and W2 fluxes after the photosphere and small and constant warm disk contribution is removed, as well as curves of blackbody emission for a fixed temperature. The inset shows the distribution of best-fit temperatures, indicating the relatively narrow dispersion between 1000 and 1500K. The residual emission (if any) during the low emission state in 2014-2015 is consistent with emission at only 500K (points in lower-left of Fig. 12), and thus is likely a result of variation in or imperfect subtraction of the warm disk component.
Some T Tauri stars exhibit variability at longer µm that is anti-correlated with emission at shorter wavelengths; this “see-saw" variability is thought to arise from shadowing of the disk by a dynamic inner “wall", which intercepts and re-processes stellar radiation that is otherwise incident on the disk further out (Muzerolle et al., 2009; Espaillat et al., 2011; Flaherty et al., 2012; Fernandes et al., 2018). Indeed, Perotti et al. (2023) found a 30% difference in the continuum emission of PDS 70 between Spizter and JWST spectra. In WISE photometry from the cryogenic mission, emission in the W4 (25µm) channel is significantly anti-correlated with that in W1 and W2 (, Spearman rank test) but the variation is small and observations span just two one-day intervals.
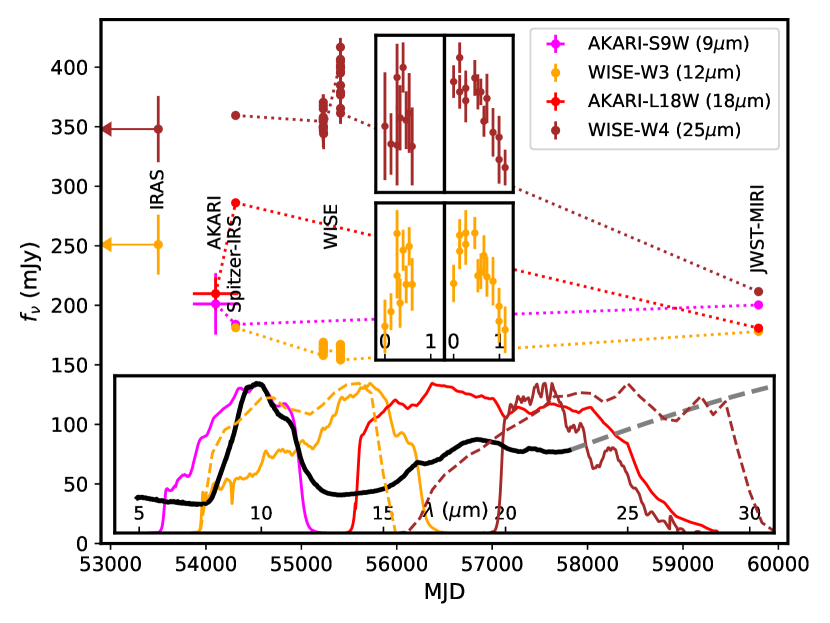
We revisited variability in emission at µm with 12- and 25-µm photometry from the IRAS Faint Source Catalog based on its all-sky survey (Neugebauer et al., 1984; Moshir & et al., 1990), 9- and 18-µm photometry from the AKARI mission (Ishihara et al., 2010), 12- and 25-µm photometry from the cryogenic WISE mission (Wright et al., 2010; Cutri et al., 2013), and synthetic photometry in the AKARI and WISE passbands using the Spizter-IRS and JWST-MIRI spectra (Fig. 13). IRAS data were obtained 23 years before the next observations, and AKARI photometry is based on 3–4 observations over the span of 477 days. Spizter and JWST spectra extend to and the WISE 25-µm channel is incompletely covered, so we extrapolated using a scaled version of the best-fit curve in Fig. 11. (The estimated fluxes are not sensitive to the exact form of the extrapolation.)
While the flux in the 9-µm AKARI passband has been stable since 2006–2007, emission at longer wavelengths show significant variation. The apparent elevated flux at 12 µm observed by IRAS is likely due to a broader bandpass (dashed yellow line in lower inset of Fig. 13) that includes the 10 µm silicate emission feature. The estimated 25-µm flux of JWST is significantly lower than that from Spizter, echoing the results of Perotti et al. (2023), and the Spizter emission is consistent with both earlier IRAS and later WISE photometry. Moreover this decline is also manifest in estimated 18-µm fluxes, probably because the ARAKI bandpass overlaps with the WISE 25-µm one (bottom inset of Fig. 13).
In addition, rapid variation (0.15 mag over 1 day) is present in multi-epoch WISE W3 and W4 photometry (upper insets of Fig. 13). Emission from these wavelengths is coming from cool (K) dust at distances where the orbital period is yr and thus the variation is faster than any dynamical timescale. Shadowing by a variable inner disk wall could explain the short timescale, however, on long timescales, the overall decline at longer wavelengths is not mirrored by a contemporaneous increase in flux at 3.4 or 4.6 µm (as in the case of see-saw variability). There is an overall increase in emission at these wavelengths over the duration of the NEOWISE mission but the most recent released values were obtained only 16 days before the JWST observations, and are similar to those obtained during the WISE cryogenic mission, when simultaneously measured 25-µm fluxes were similar to the Spizter values. One reason for the lack of see-saw variability may be the moderate disk inclination (50 deg); inclinations may be required for a single fulcrum wavelength to appear in the time-dependent SED (Bryan et al., 2019).
4.3 Variability in accretion
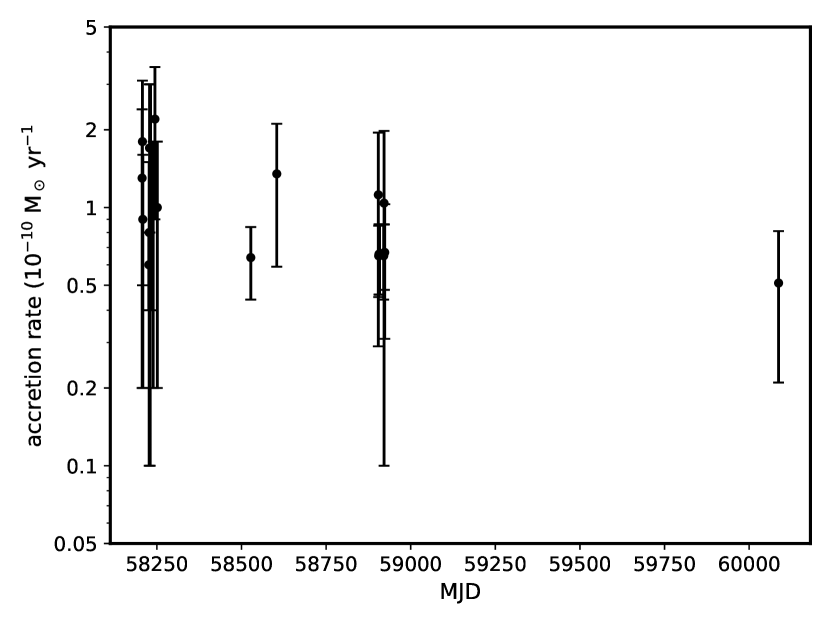
The accretion rate inferred from model-fitting of the Balmer H line was consistently below a few times M⊙ yr-1 over a baseline of nearly three years (Fig. 14), at the lower end of the observed distribution among T Tauri stars (Hartmann et al., 1998; Manara et al., 2022). However, due to the large uncertainties in the values, we are unable to detect significant variation ( for ). The large uncertainties are due to the degeneracy with the gas temperature, which is unconstrained and subject to vary with changes in the magnetospheric accretion radius (see Sec. 4.4)
4.4 Model-based synthesis
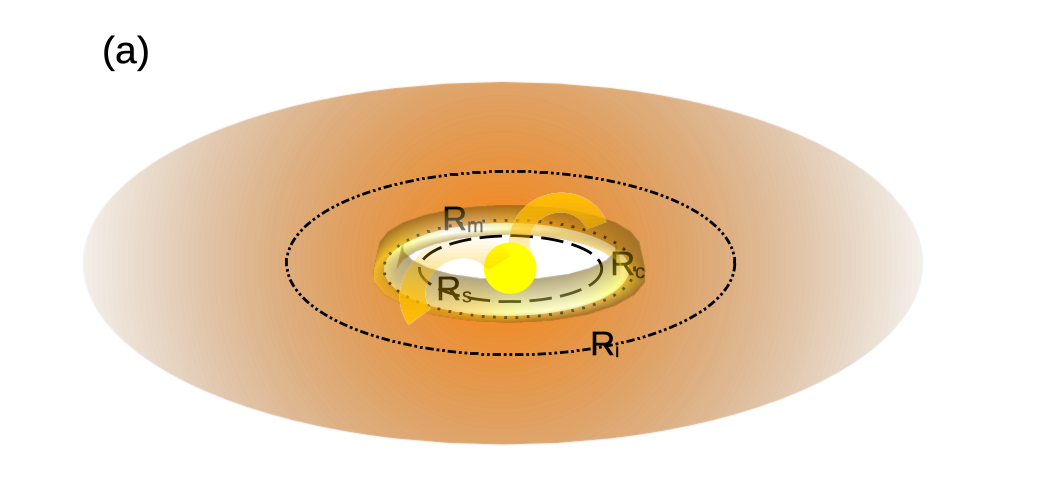
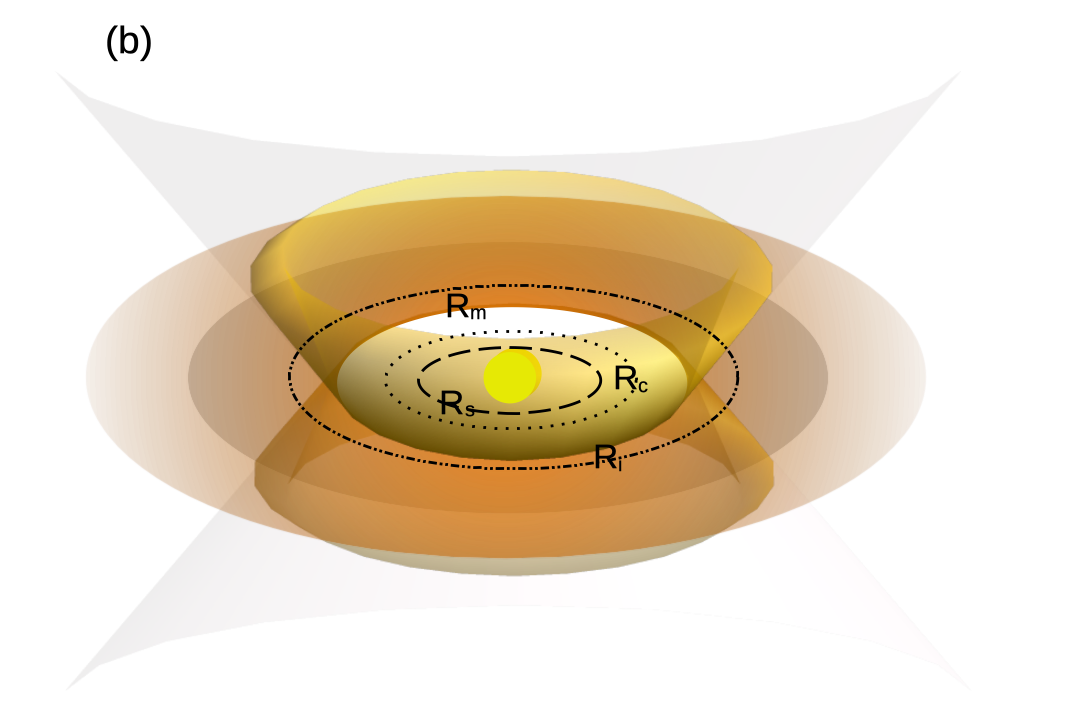
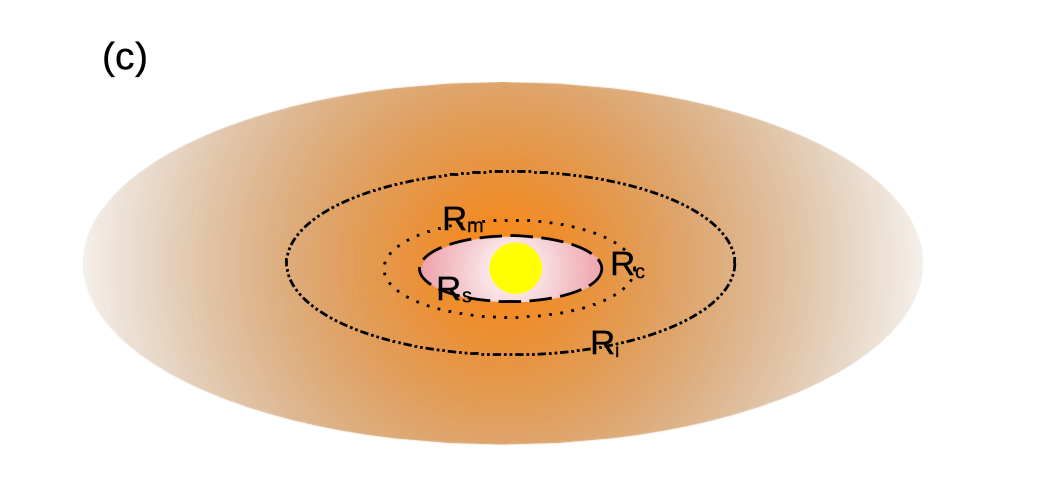
We describe the dynamic behavior of PDS 70 in terms of the relative location of four locations in the disk: (1) the co-rotation radius inside or outside of which disk loses or gains angular momentum through magnetic coupling to the star; (2) the truncation radius where the disk is vertically diverted by the large-scale stellar magnetic field; (3) the disk ionization radius interior to which the disk is affected by the magnetic field; and (4) the dust sublimation radius . Figure 15 illustrates this behavior (described in more detail below). Liffman et al. (2020) proposed an analogous scenario to explain the variable infrared emission of the pre-transition disk LRLL 31, i.e., from a dust “fan" ejected from the inner disk by a jet/wind. In their model, variation in accretion rate drives variation of the disk truncation radius and the speed of the wind, which in turn controls the height of the dust fan and thus the level of infrared emission.
If the truncation radius is exterior to the dust sublimation radius, dust that is dynamically bound to the diverted gas could produce both the optical and infrared variability, by scattering along the line of sight, and emission, respectively. Whether the flow is magnetically “funneled" onto the star (Fig. 15a) or diverted into a “propeller" outflow and wind (Fig. 15b) then depends on the whether the truncation radius is interior or exterior to the co-rotation radius given by:
| (1) |
where and are the the stellar radius and mass in solar units (Ustyugova et al., 2006; Bessolaz et al., 2008). Takasao et al. (2022) carried out three-dimensional magnetohydrodynamic (MHD) simulations of this phenomenon and found that the magnetic truncation radius closely followed the scaling relationship proposed by Ghosh & Lamb (1979):
| (2) |
where is the large scale dipole field evaluated at the stellar surface (in kG), and the accretion rate is in units of yr-1.
We adopted a value of 0.44 kG for the large-scale dipole field evaluated at the stellar surface of 22% of the total field strength as found by Lavail et al. (2019) to be typical (see discussion in Gehrig et al., 2022). The total field strength was in turn based on a relation with the Rossby number , the period rotation (3.03 d, Thanathibodee et al., 2020) normalized by the convective turnover time , i.e. “slow" rotator relation in Table 2 of Reiners et al. (2022). The convective turnover time was estimated as 21.7 d by scaling the solar value with luminosity (Jeffries et al., 2011), yielding . For accretion rate we adopted the range of 0.6–2.2 yr-1 found by Thanathibodee et al. (2020).
A third boundary is the radius at which mid-plane temperatures reach 1000K and alkali metals become partially ionized. This could also be a transition from region of low turbulent (eddy) viscosity (“dead zone") to a high diffusion region where the magnetorotational instability (MRI) drives turbulence (Desch & Turner, 2015). At this point, disk models predict a pressure maximum, and the potential for trapping of solids with sizes such that the Stokes number (ratio of stopping time to orbital time) St will be (Dzyurkevich et al., 2010). Depending on grain growth and collisional fragmentation, this could lead to a concentration of dust at the pressure bump and depletion elsewhere in the disk. The maximum Stokes number (collisional case) is:
| (3) |
where and are the internal density and size of the dust, and is the mass surface density of gas. Using the relationship for the mass accretion rate in an “alpha turbulent disk" , where is the turbulent viscosity parameter, the sound speed, and the vertical scale height of the gas, and the relationship between , temperature , and Keplerian orbital period , Eqn. 3 can be re-expressed as:
| (4) |
Taking the mid-plane temperature to be 1000K, this results in the scaling:
| (5) |
where is in and is in au. For and , only cm-sized particles will achieve St and be trapped. Thus the dust responsible for the variability and infrared excess is not itself trapped at any dead zone boundary, but it could be produced by fragmentation of trapped particles. Ueda et al. (2019) explored the conditions for dust trapping, finding a limiting turbulent parameter in the dead zone that is a function of the dust fragmentation velocity.
We calculated the semi-major axis of dust in radiative equilibrium with the star with temperatures that are below the dust condensation temperature but above 1000K. The lower limit is the minimum temperature consistent with the observations (see Fig. 13) and is also the temperature at which disk gas starts to ionize (i.e., constituent potassium and sodium) and becomes influenced by the stellar magnetic field. Condensation temperature varies with disk gas pressure and composition, which also changes depending on what has already condensed out is possibly removed from equilibrium with the gas by gravitational settling, and growth into planetesimals; we adopt values of 1290-1500K depending on the mineral (Lodders, 2003; Wood et al., 2021).
Equilibrium temperatures depend on grain size and composition through the absorption (= emission) cross-sections integrated over the stellar SED and 1200K infrared emission (Eqn. 6) using the wavelength-dependent optical coefficients of Budaj et al. (2015). From radiative equilibrium, the dust sublimation radius is
| (6) |
where is the stellar effective temperature, and is the absorption cross-section averaged over the entire stellar spectrum. We considered Fe-free forsterite (MgSiO2) and enstatite (MgSiO3) as well as olivine and pyroxenes, magnesium silicates with Fe substituting for 20–50% of Mg. The optical absorption cross-sections of the latter are significantly higher due to the presence of Fe (Budaj et al., 2015) and their equilibrium temperatures will be higher at the same stellar distance.
If the accretion rate is low or the magnetic field is strong, then magnetic pressure overcomes disk ram pressure, the truncation radius moves outward to the distance where the disk temperature is 1000K, since below this temperature the disk ceases to be ionized and respond to the stellar magnetic field. The truncation radius remains at approximately this distance and the flow and resulting IR emission should be relatively stable. If accretion rates are sufficiently high or the magnetic field is weak, then the magnetic truncation radius can migrate inside the condensation temperature of the dust, and gas diverted above the mid-plane in magnetospheric flow would be dust free (Fig. 15c). If magnetically-diverted, dusty accretion flows are responsible for the dipper-like variability of PDS 70, then, during this latter, dipping should cease. Based on the ASAS-SN data (Figs. 1 and 3) the interval at MJD 57000 would appear to be more quiescent, but the lack of data at earlier times makes this conclusion tentative.
The likelihood that dust will occult the star and the emitting area of its infrared emission, will depend on the vertical distance which dust reaches above the mid-plane. This is set by the balance of gas drag (i.e., Epstein drag, Li et al., 2022) and vertical stellar gravity:
| (7) |
where is the local gas density and is the wind half-opening angle (up to 30 deg for a magnetized wind, Blandford & Payne, 1982). Assuming axisymmetric flow away from the disk plane from the truncation radius and at the sound speed in a layer that is one gas scale height thick;
| (8) |
which leads to the relation for the geometric area subtended by the dusty flow:
| (9) |
where is in g cm-3. The optical depth of the flow will be
| (10) |
where is the dust-to-gas ratio by mass and is the optical constant averaged over the emission spectrum (e.g. a blackbody at 1200K). This leads to
| (11) |
where is the mean atomic weight of the gas (1.85 for a solar composition). We calculated the effective emitting area as .
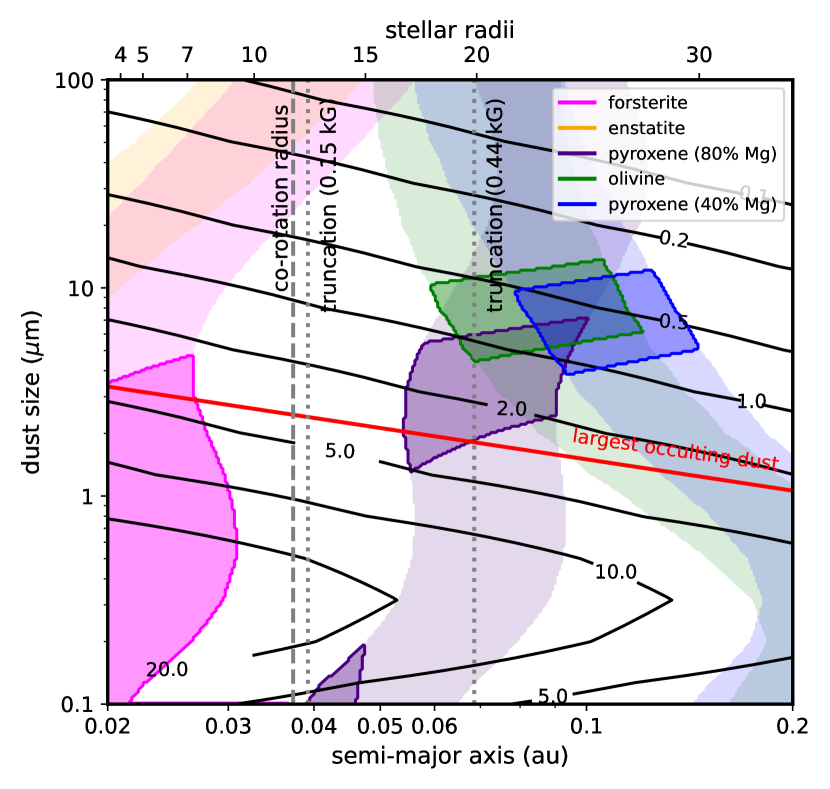
Figure 16 shows regions of semi-major axis vs. grain size where the temperature is between 1000–1400K and the effective emitting area is in the range inferred from black-body fitting to the WISE 3.4- and 4.6-µm photometry ( au2; Fig. 7); each region is specific to an assumed dust composition (color-coded). The positions of the co-rotation radius and the disk truncation radius for two values of the large-scale dipole magnetic field evaluated at the surface are indicated as vertical lines. The total optical depth due to scattering and absorption in the Sloan band-pass from the same dust structure (integrating over the stellar SED and response function) is shown as the black contours in Fig. 16. Finally, we assumed that the inner disk is co-planar with the outer disk ( deg; Keppler et al., 2019) and with the star’s rotation axis ( deg; Thanathibodee et al., 2020) so that occultation along our line of sight does not occur unless the dust reaches a height (red line in Fig. 16).
Large (1 µm) dust with olivine and pyroxene compositions will have temperatures in the necessary temperature range at the predicted magnetic truncation radius, whereas small grains will remain too cool or will vaporize (Fig. 16). Forsterite and enstatite of any size will be too cool at the relevant distances (Fig. 16). More exotic compositions such as graphite and metallic iron (not shown) can also satisfy the temperature/flux constraints, but these are expected to readily condense only in a strongly reducing, H-rich disk. The presence of H2O and CO2 and absence of detectable organic molecules (Perotti et al., 2023) indicates oxidizing (low C/O ratio) conditions in the inner disk, more favorable to the condensation of Fe-rich magnesium silicates.
5 Discussion and Summary
5.1 A Disk Wind
Optical and infrared spectra of PDS 70 contain evidence for a disk wind, i.e. emission in the forbidden line of O I at 6300Å (Campbell-White et al., 2023) and an inverse P Cygni-like profile with blue-shifted absorption in the metastable triplet of He I at 1.083 µm (Thanathibodee et al., 2019). The former is exceptionally high compared to stars with disks with similar accretion luminosity, is highly broadened (FWHM 90 km s-1) relative to nearly all disks, and slightly blue-shifted (8 km s-1). This suggests emission from a wind arising 0.1–0.2 au from the star (Campbell-White et al., 2023), a distance that overlaps with our predictions for the disk truncation and dust emission radii (Fig. 16).
While red-shifted absorption in either H or triplet He I would correspond to gas inside the co-rotation radius accreting onto the star, the combination of emission and blue-shifted absorption and emission in the He I triplet line is typically produced by a stellar wind (Edwards et al., 2006). Variable, blue-shifted (-35 to -110 km s-1) and red-shifted (140 km sec-1) absorption components are seen in He I spectra of PDS 70 obtained at three epochs prior to MJD=58900 (Thanathibodee et al., 2020, 2022), indicative of magnetospheric accretion. After MJD=58900, when the photometric behavior has transitioned from a periodic to aperiodic dipper-like behavior, He I spectra at two separate epochs at the end of 2020/early 2021 lack any red-shifted absorption and instead have red-shifted emission and strong blue-shifted absorption, suggestive of a disk wind (Campbell-White et al., 2023). This is also coincident with a decrease in the baseline stellar brightness and rise in infrared emission (Fig. 6). A spectrum obtained with the iSHELL infrared spectrograph on IRTF in mid-May 2023 (R. Lee, pers. comm.) shows the return of magnetospheric accretion signatures, contemporaneous with the re-emergence of a weak periodic signal (Figs. 1 and 3), increase in the baseline optical brightness, and decline in infrared emission (Fig. 6). This is consistent with a dusty wind as the source of both the variable emission and optical emission, although not necessarily the same dust at the same distance along the wind. We caution that the available spectroscopy has limited rotational phase coverage and non-axisymmetric flow could be also be responsible for the observed changes.
We propose that the fluorescent UV H2 emission detected by Skinner & Audard (2022) also emerges from this wind. For one thing, a wind would screen the disk itself from the Lyman- photons that pump such emission, precluding it from being the source. Such emission is common among classical T Tauri stars, generally arises from the inner (1 au) disk region (Arulanantham et al., 2021; France et al., 2023), and a correlation with the narrow-line component of forbidden atomic emission, i.e. [O I] (Gangi et al., 2023) suggests a connection with winds. Fluorescent H2 emission is rare among weak-lined and low-accreting T Tauri stars; another notable exception is EP Cha (RECX-11, France et al., 2012), which is also a “dipper" star.
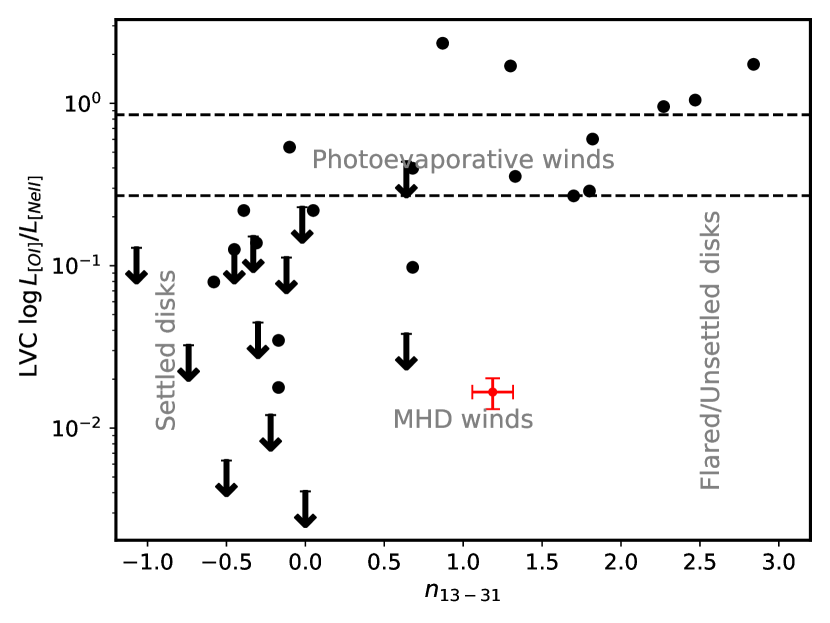
In addition to the [O I] 6300Å line, emission in mid-IR forbidden lines of Ne II (12.81 µm) and Ne III (12.55 µm), whose high ionization potentials mean they can only arise from very hot, escaping gas, are excellent tracers of photoevaporative winds from the disks of T Tauri stars. Pascucci et al. (2020) has proposed that anemic Ne emission relative to O emission can be explained in terms of an inner MHD wind shielding the disk further out from the hard stellar X-rays that heat the gas (the O I primarily arising from the MHD wind). Variability in Ne emission from SZ Cha has been interpreted in the context of a screening wind (Espaillat et al., 2023). Both Ne lines are detected in MIRI spectrum of PDS 70, but are weak, and the Ne III line is blended with H2O lines. The flux in the Ne II line ( erg s-1 cm-2, and the red point in Fig. 17) is well below that expected for its [O I] emission based on models of photoevaporative winds (dashed lines in Fig. 17; Ercolano & Owen, 2010), presumably due to the presence of the wind at the time of the JWST observation666Portilla-Revelo et al. (in prep.) find a modestly higher value of erg s-1 cm-2 (G. Perotti, pers. comm.).
5.2 Timescales and drivers of accretion variability
If the primary source of optical dimming and 3–5 µm emission is dust that is kinematically coupled to magnetized gas in an accretion flow and/or wind from the inner disk, then while variation (i.e., dimming) on the timescale of days can be explained by orbital motion, variation on time scales of months to years, i.e., much longer than the orbital time at the inner disk edge, must be caused by changes in either the geometry of that flow or dust loading of the gas. In principle, variation in accretion could drive these changes (Eqn. 2). We are unable to detect significant variability in accretion rate based on modeling of the H profile (Fig. 14), but any (detected) variation could also simply reflect changes in the relative amounts of flow through a wind vs. accretion onto the star, rather than the rate through the disk.
At least three timescales are relevant to variable accretion of disk gas (Fischer et al., 2022): the dynamical time scale, which can be as short as 1 day at the inner disk edge (too short to be relevant), the viscous diffusion time, which is at least times the orbital time (too long), and the thermal time, which is times longer and thus months to years near the inner disk edge (perhaps just right). In addition, there is a magnetic (Ohmic) diffusion time scale (e.g., Liffman et al., 2020) where is the permittivity of free space, the electrical conductivity, and the relevant scale length, e.g. disk scale height.
In a low-accretion, passively heated disk, disk ionization will depend on irradiation by the star (optical and X-rays) (Jankovic et al., 2021). The viscous time scale for a turbulent (e.g., MRI-driven) -disk disk hotter than 1000K is at least a century:
| (12) |
This might create a positive, destabilizing feedback: disk shadowing could lead to suppression of the MRI close to the star, a lower accretion rate, expanded truncation radius, elevated disk rim, and more disk shadowing. However, again, this cannot explain the year-long variability seen in the optical and infrared.777This is distinct from any self-shadowing instability of the disk surface (Dullemond, 2000; Melon Fuksman & Klahr, 2022).
Variation in the strength of the large-scale dipole field (i.e., stellar magnetic cycle) could also move the disk truncation radius with respect to the co-rotation radius. Armitage (1995) showed that magnetic cycles could produce variability in accretion and emission among T Tauri stars, especially in the ultraviolet, and could even be responsible for accretion-driven outbursts (Armitage, 2016). Magnetic cycles are widespread among solar-type stars; little is known about the magnetic behavior of cooler, fully-convective pre-main sequence objects, but Finociety et al. (2023) report variation of a factor of three in the dipole strength of the T Tauri star V1298 Tau over three years. Full 3-d simulations of fully-convective main sequence M dwarfs (as analogs) suggest that the overall behavior is similar to that of partially-convective stars (e.g., Käpylä, 2021; Bice & Toomre, 2023a).
Ortiz-Rodríguez et al. (2022) found that cycles appear in fully-convective M dwarfs if the magnetic Prandtl number (ratio of turbulent to magnetic diffusivities ) is . The timescale for the reversal is related to that of large-scale diffusion of magnetic fields through the dynamo (convective) region (e.g., Augustson et al., 2015), and will be of order years, consistent with the few available cases where cycling has been observed for fully convective stars (e.g., Ibañez Bustos et al., 2019, 2020; Klein et al., 2021). Generally, more rapidly rotating stars have shorter magnetic cycles (Saar & Brandenburg, 1999; Suárez Mascareño et al., 2016). Bice & Toomre (2023b) found that magnetic cycle time normalized by in cool dwarf models spanning a large range of parameters scaled as Pm0.35Re0.93Ro-1.78, and is predicted to be (days) for Ro 0.16 (see also Strugarek et al. 2018). Moreover, Lin et al. (2023) find variation in the photometric behavior among 16 T Tauri stars on a timescale of 1.5-4 years. Thus, cycle times of 3 yr are plausible, and would be consistent with the time-scale of long-term variation in optical and infrared brightness seen in PDS 70 (Fig. 6). However, if the time-scale for removal of angular momentum from the local disk is much longer than the magnetic cycling time the disk will only respond to the long-term average dipole field strength.
The disappearance of emission from the disk at 3.4 and 4.6 µm for up to one year at the end of 2014 (around MJD=57000, Fig. 6) requires a temporary halt in accretion towards the inner disk edge, a dramatic drop in dust load (e.g., by trapping further out), or a very different geometry of inner disk dust, i.e. one that intercepts much less stellar irradiation close to the star. The viscous time scale of yr, even at the inner edge, rules out the first scenario. The second is probably precluded by the very small Stokes number of dust and tight coupling of dust to gas in the inner disk (Eqn. 5). If the disk was truncated (by a stronger magnetic field) at a distance where the temperatures were significantly cooler than the 1000K this would null the 3.4/4.6µm excess, but this would require a significant source of ionizing radiation (Desch & Turner, 2015).
Alternatively, dramatic weakening of the dipole field during a particularly prolonged polarity reversal (DeRosa et al., 2012) would allow the disk inner edge to migrate interior to the dust sublimation radius. For example, reduction of the dipole strength by a factor of three (and magnetic energy by a factor of 10) as seen in the Sun (DeRosa et al., 2012), moves the truncation radius well inside the sublimation radius of Fe-bearing dust and the co-rotation radius of PDS 70 (Fig. 16). Magnetospheric accretion could still occur, but the gas would be dust free and will have low continuum emission.888Fe-free forsterite dust could survive closer to the star but only in the absence of heating of the gas by dust with other compositions. The relatively “flat" disk geometry exterior to the sublimation radius would intercept and reprocess much less stellar radiation. It is possible that shorter episodes occur but have been missed due to the 6-month cadence of NEOWISE monitoring .
5.3 Composition of the inner disk
As opposed to the outer disk, the inner disk cannot be “primordial": combining an inner disk gas mass of M (Portilla-Revelo et al., 2023) with an accretion rate of M yr-1 (Thanathibodee et al., 2019) returns a residence time of 3–12 kyr, far shorter than the star’s estimated age of Myr (Keppler et al., 2018) 999The PDS 70bc planets, and thus the gap they formed, are likely younger than the star, but it is usually assumed that giant planets have commenced runaway growth and gap opening at a system age of 1 Myr (Cridland et al., 2019). This would be the case even if the gas mass is underestimated due to depletion of CO (which is used to estimate total gas mass) by freeze-out in the outer disk.
The inner disk must be resupplied across the gap from the outer disk, and/or regeneration of gas/dust from collisions, disruption, or evaporation of planetesimals. Detection of H (red-shifted H absorption and H2 emission) and He (reversed triplet He I line) unambiguously indicate the presence of primordial gas (from the outer disk), possibly via a “bridge" structure in the gap identified in ALMA imaging of both gas and dust (Keppler et al., 2019). Partial trapping of condensible solids (including, possibly, CO ice) is expected in the pressure bump at the inner edge of the outer disk (Pinilla & Youdin, 2017), and can explain the observed concentration of dust there (Portilla-Revelo et al., 2023). Thus disk material passing within the gap should be dust-poor, as is observed (dust:gas ratio of 630, Portilla-Revelo et al., 2023).
The inner disk itself, however, appears to be gas-poor or dust-rich. Portilla-Revelo et al. (2023) derived an inner disk gas-to-dust ratio of 10 (dust-rich relative to ISM) based on relative line (12CO) vs. continuum emission at mm wavelengths. The gas-to-dust ratio along the line of sight to the star (i.e., in the wind) can also be estimated by comparing absorption of X-rays (Wilms et al., 2000) to scattering/absorption in visible light by dust.
| (13) |
where is the hydrogen column density inferred from X-ray absorption (assuming a solar-metallicity gas101010X-ray emission from PDS 70 peaks at 1 keV, at which gas and dust make nearly equal contributions to the absorption (Bethell & Bergin, 2011), thus the assumptions of solar metallicity could lead to underestimated by up to a factor of two.), is the proton mass, is the specific mean opacity of the dust in a optical passband, and is the corresponding dimming in that passband. Joyce et al. (2023) obtained 0.2–12 keV X-ray spectra of PSD 70 with the XMM-Newton telescope at 6 epochs spaced a day apart. They derived a mean of cm-2 but there is evidence for variability ( for 5 degrees of freedom). We set = 0.25 mags based on ASAS-SN photometry during the XMM-Newton observations, and cm2 g-1 based on Fig. 5, and derive a gas-to-dust ratio of 60. This value applies only along the line of sight to the star and should be considered an upper bound to the disk value because, if the inclination of the inner disk is 50 deg (Thanathibodee et al., 2020), the line of sight will probe far above the disk mid-plane where depletion of dust due to gravitational settling will be significant.
Freeze-out and trapping of CO by the predicted bump at the inner edge of the outer disk would deplete CO gas sourced to the inner disk, and thus lead to an erroneously low CO-based estimate of gas mass based on a canonical abundance. However, condensible solids (i.e., dust-forming elements in the inner disk) should be depleted by at least as much, and thus the gas-to-dust ratio should only increase. Moreover, we would expect the growth of planetesimals and planets in the inner disk to sequester solids, increasing the gas-to-dust ratio. As suggested by Benisty et al. (2021), evidence for a dust-rich disk thus suggests internal production of dust analogous to that in a debris disk, i.e. by planetesimal collisions, disruption, or evaporation.
Emission from PDS 70 in infrared H2O lines falls along an inverse trend with the slope of the continuum emission in the 13-30 µm range from T Tauri stars, explainable by the formation of a gap or central cavity (Perotti et al., 2023). This emission is dominated by a compact ( au2) source at 600K (Perotti et al., 2023). The absence of H2O emission at a temperature corresponding to the 1200K dust component suggests that H2O is efficiently sequestered somewhere in the inner disk and does not reach the point where the MHD wind is launched. The cooler H2O emission could be explained by a wind that shields the disk from the stellar XUV radiation that normally heats the disk atmosphere lying above the mid-IR continuum level (Woitke et al., 2018).111111Although gas-dust thermal disequilibrium is possible, and gas can be cooler than dust in the outer disk (Facchini et al., 2017), models generally predict higher gas temperatures in the inner disk (Kamp & Dullemond, 2004).
There is also CO2 emission is from cool gas. Photometry by ASAS-SN during JWST-MIRI observations indicates the system was in the “dipper" mode (Figs. 1 and 3) with relatively low emission at 25µm (Fig. 13) suggestive of shadowing, which could partially explain the cool emission temperature of CO2. Importantly, any variability at µm (Fig. 13) could affect the continuum slope and .
Although the term “hybrid disk" seems appropriate for the inner disk of PDS 70, this term has already been adopted for disks that are depleted in dust relative to the T Tauri phase for a given mass of gas (Péricaud et al., 2017; Miley et al., 2018). Thus we call a dust-rich disk that is comprised of primordial gas that is depleted of dust but enriched by secondary debris and gas from planetesimals a “chimera disk".
5.4 Future directions
Obviously, additional JWST observations of PDS 70 or more advanced analysis of existing observations (Perotti et al., 2023) could play an important role in understanding the inner disk of PDS 70. JWST NIRSpec observations of PDS 70 at 0.6-5 µm have already been performed and would provide additional insight into its composition.
Particularly important in more fully describing the behavior of the inner disk of PDS 70 and testing the scenarios presented here would be long-term, parallel monitoring of indicators of the wind and accretion ([O I],triplet He I), dust occultation (optical photometry), and emission in the infrared. For the latter, while NEOWISE monitoring at 3.4 and 4.6µm is sensitive to changes in the inner disk, its cadence is limited to a day-long visit every six months. The AKARI mission observed the sky at multiple epochs (Tachibana et al., 2023) but these data are not yet publicly available.
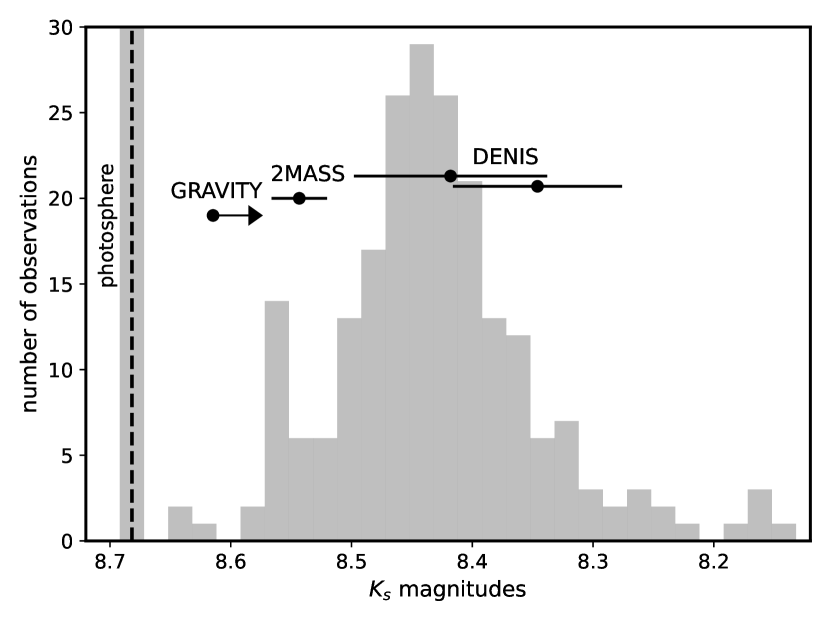
On the other hand, excess emission from the inner disk is readily detected in the 2.2 µm -band (Fig. 11) from the ground. Fig. 18 plots the distribution of -bands magnitudes predicted from the black-body fits performed on the NEOWISE photometry and compares these to 2MASS, two epochs of DENIS photometry, and a lower limit on the value from the resolved component from VLTI-GRAVITY (Wang et al., 2021). The discrepancy between the 2MASS and DENIS photometry is not due to a difference in the response function since these are very similar. We propose that the offset of the distribution from the photosphere value inferred from stellar model fitting (vertical dashed line in Fig. 18) is the minor contribution of the disk beyond its inner edge to the -band flux, i.e. a hot dusty upper atmosphere. The distribution shows that time-series monitoring of PDS 70 at 2.2 µm with 2MASS-like precision could successfully track inner disk emission.
The large uncertainty in the accretion rate of PDS 70 inferred from model fits to the H line profile is due to the degeneracy with gas temperature (Muzerolle et al., 2001). The accretion rate of PDS 70 can be better constrained by modeling the profiles of multiple H I lines (rather than only the Balmer line) that form at different temperatures/regions in the accretion flows. The unknown, variable chromospheric emission in H lines also contributes to the uncertainty at the low accretion rates of PDS 70. High-resolution, simultaneous spectroscopy of the Balmer and Paschen lines are required to better distinguish the chromospheric contribution of each line and break the accretion rate-gas temperature degeneracy.
High-resolution interferometry in the infrared could resolve the actual inner disk structure of PDS 70 and determine if the emission at shorter wavelengths is coming from a wind or fan. Wang & Chen (2019) resolved half of the photometrically-estimated excess emission from the disk in -band at 0.2-0.5 au scales with the GRAVITY beam combiner on the Very Large Telescope Interferometer (VLTI). While they attributed the difference to unresolved emission at 0.2 au, another explanation is variability. On brighter stars, GRAVITY interferometry can reconstruct simple parameterized images of inner disks, as was done for the case of DoAr 44, which is about one mag brighter than PDS 70 (Bouvier et al., 2020). GRAVITY+, which will be an upgrade with laser guide-star adaptive optics, could perform similar observations of PDS 70 (Gravity+ Collaboration et al., 2022). Future interferometry in -band (3.5 µm, e.g., Laugier et al., 2023) would exploit the higher disk emission at that wavelength.
Measurement of the magnetic field of PDS 70, especially its large-scale dipole component, would allow more robust comparison of disk truncation measurements to theory (Eqn. 2, Gregory et al., 2016). While measurement of Zeeman broadening in unpolarized light provide information on total field intensity, spectroscopic monitoring of Stokes (circular) polarization over a full rotation cycle (Zeeman Doppler Imaging or ZDI) can be used to infer the large-scale topology of the field, direct measurement of the large-scale dipole requires measurements of all four Stokes parameters (Gehrig et al., 2022). Such studies require high signal-to-noise, are preferably performed in the near-infrared where the Zeeman effect is stronger, and are observationally expensive. Line broadening by rapid rotation and line veiling also make these observations challenging. Recent detailed studies, e.g., of V410 Tau (Carroll et al., 2012; Yu et al., 2019; Finociety et al., 2021) and V1298 Tau (Finociety et al., 2023), demonstrate the potential of the suite of high-resolution infrared spectrographs which, when deployed on 8-m or larger telescopes, could perform similar observations of PDS 70.
Alternatively, conditions for trapping of occulting dust near the co-rotation radius, if confirmed, could constrain the strength of the magnetic dipole field, provided the dust particle size and gas density are known (Zhan et al., 2019, see also Sanderson et al. 2023). Dust size can be determined by reddening-extinction trends, e.g., Fig. 5 and gas density can be estimated by X-ray observations (e.g., Joyce et al., 2023) or inferred from the accretion rate.
6 Summary
Time-series photometry and spectroscopy reveal the dynamic nature of the inner disk of PDS 70, and multi-wavelength observations point to a chimeric composition brought about by the segregation of the inner and outer disk by the system’s two giant planets. We draw the following conclusions or inferences based on these data:
-
•
PDS 70 is optically variable on the timescale of day or days due to intervening sub-micron dust located near the inner edge of this disk.
-
•
The optical lightcurve of PDS 70 evolves between a periodic and approximately symmetric behavior, and stochastic, asymmetric and “dipper"-like behavior. This could be due to the changing position of the inner edge of the magnetically truncated relative with respect to the co-rotation radius which alternatively drives magnetospheric accretion vs. “propellor"-like accretion with a magnetized wind.
-
•
The infrared SED of the inner disk of PDS 70 can be modeled as a warm (K), radially extended disk and a quasi-isothermal component at 1000–1500K, with the latter entirely responsible for emission at 3.4 and 4.6 µm. The temperature range of the hot dust spans the ionization temperature of disk gas and typical dust sublimation temperatures.
-
•
Variability of PDS 70 at 3.4 and 4.6 µm is produced by changes in the magnetic truncation radius of the disk relative to the co-rotation radius and the location at which disk material is diverted vertically by the field and the extent which it intercepts and reprocesses stellar irradiation. This variability is pronounced in the case of PDS 70 due to the low disk accretion rate and the proximity of the disk truncation, co-rotation, and dust sublimation radii.
-
•
At high field strength disk gas is diverted outside the co-rotation radius into a magnetized, non-axisymmetric wind which elevates dust into a “fan" that partially occults the star along our line of sight and produces episodic dimming as well as excess emission at 3.4 and 4.6 µm.
-
•
At lower field strength, disk gas is diverted closer to the star, and at/within the co-rotation radius; the occultation ceases and infrared emission is diminished; gas reaching the co-rotation radius is accreted onto the star through funnels that periodically occult the line of sight producing a strongly periodic signal and weaker infrared emission.
-
•
During magnetic reversals, the weak or absent dipole field means that the disk accretes almost directly onto the star, dust is sublimated before that point, there is little or no occultation or excess emission at 3.4 and 4.6 µm.
-
•
Variability in disk accretion may be self-exciting as the disk wall shadows the disk further out, cooling it below 1000K and the minimum temperature for ionization and MRI instability. Accretion could also be governed by dust loading and dynamical interaction with protoplanets in the disk
-
•
The residence time of primordial, H/He-dominated gas in the disk is yr, much shorter than the age of PDS 70, and thus ongoing accretion in the inner disk is sustained by gas from the outer disk crossing the gap occupied by the two giant planets.
-
•
Gas crossing the gap from the outer disk is observed to be depleted in solids, including ices, perhaps due to a pressure bump where temperatures are 30K, however we find the inner disk to be enhanced in dust, consistent with sub-mm observations.
-
•
Gas sourced from the outer disk could be recharged with dust and volatile heavy elements (in the form of H2O and CO2) from a population of planetesimals that are now evaporating, disintegrating, and/or colliding.
Future time-series observations, especially infrared photometry and spectroscopy, promise to more fully elucidate the dynamic behavior of the inner disk of PDS 70, and the potential relationship with the star’s magnetic field.
Acknowledgments
EG and AH were supported by NASA Award 80NSSC19K0587 (Astrophysical Data Analysis Program) and NSF Award 2106927 (Astronomy & Astrophysics Research Program). JMJO acknowledges support from NASA through the NASA Hubble Fellowship grant HST-HF2-51517.001-A, awarded by STScI. This work made use of observations from the Las Cumbres Observatory global telescope network. Some of the data presented in this article were obtained from the Mikulski Archive for Space Telescopes (MAST) at the Space Telescope Science Institute. The specific observations analyzed can be accessed via https://doi.org/ 10.17909/s0zk-rq60 (catalog DOI). Funding for the TESS mission is provided by the NASA Science Mission Directorate. STScI is operated by the Association of Universities for Research in Astronomy, Inc., under NASA contract NAS 5–26555. This research has made use of the NASA/IPAC Infrared Science Archive, which is funded by the National Aeronautics and Space Administration and operated by the California Institute of Technology. This research has made use of the SIMBAD catalog VizieR catalogue access tool operated at the CDS, Strasbourg, France. This publication makes use of data products from the Near-Earth Object Wide-field Infrared Survey Explorer (NEOWISE), which is a joint project of the Jet Propulsion Laboratory/California Institute of Technology and the University of Arizona. NEOWISE is funded by the National Aeronautics and Space Administration.
Appendix A LCOGT relative photometry
In each separate bandpass, time-series photometry of an ensemble of stars was calculated by matrix solution of linear equations relating instrumental magnitudes of the th observation of the th star with instrument (a unique site/enclosure/telescope/camera index), apparent magnitudes , observation zero-points , a second-order atmosphere extinction coefficient , and an instrument-specific color-term ,
| (A1) |
where is the stellar color and the airmass of an observation. We adopted the Gaia color for . When solving for the coefficients of Eqn. A1, we only used those sources with peak pixel value to avoid saturation, and which are associated with Gaia stars with fractional variability 0.3%, where:
| (A2) |
Here and are the source brightness and its standard error (Gaia phot_g_mean_flux) and (phot_g_mean_flux_error), is the number of individual photometric observations (phot_g_n_obs), and 8.86 (Jordi et al., 2010) is the mean number of observations during the brief transit of the star across the detector field of view (during which the star will not vary significantly). The variance of each individual star was calculated after solution of Eqn. A1, and a small (3%) fraction of the most variable stars was removed from the sample before re-calculating the photometry. The median error in was used as a metric to track the quality of the solution. As more of the most discrepant stars were removed in each iteration, the median error decreased, but as sample size decreased error eventually increased again; we adopted the solution at the minimum median error for calculating light curves for each star. To achieve successful convergence it was necessary to restrict reference stars to those with similar Gaia -magnitude and colors.
References
- Alcalá et al. (2014) Alcalá, J. M., Natta, A., Manara, C. F., et al. 2014, A&A, 561, A2, doi: 10.1051/0004-6361/201322254
- Allard et al. (2012) Allard, F., Homeier, D., & Freytag, B. 2012, Philosophical Transactions of the Royal Society of London Series A, 370, 2765, doi: 10.1098/rsta.2011.0269
- Ansdell et al. (2016) Ansdell, M., Gaidos, E., Rappaport, S. A., et al. 2016, ApJ, 816, 69, doi: 10.3847/0004-637X/816/2/69
- Armitage (1995) Armitage, P. J. 1995, MNRAS, 274, 1242, doi: 10.1093/mnras/274.4.1242
- Armitage (2016) —. 2016, ApJ, 833, L15, doi: 10.3847/2041-8213/833/2/L15
- Arulanantham et al. (2021) Arulanantham, N., France, K., Hoadley, K., et al. 2021, AJ, 162, 185, doi: 10.3847/1538-3881/ac1593
- Astropy Collaboration et al. (2013) Astropy Collaboration, Robitaille, T. P., Tollerud, E. J., et al. 2013, A&A, 558, A33, doi: 10.1051/0004-6361/201322068
- Astropy Collaboration et al. (2018) Astropy Collaboration, Price-Whelan, A. M., Sipőcz, B. M., et al. 2018, AJ, 156, 123, doi: 10.3847/1538-3881/aabc4f
- Astropy Collaboration et al. (2022) Astropy Collaboration, Price-Whelan, A. M., Lim, P. L., et al. 2022, ApJ, 935, 167, doi: 10.3847/1538-4357/ac7c74
- Augustson et al. (2015) Augustson, K., Brun, A. S., Miesch, M., & Toomre, J. 2015, ApJ, 809, 149, doi: 10.1088/0004-637X/809/2/149
- Barrado y Navascués & Martín (2003) Barrado y Navascués, D., & Martín, E. L. 2003, AJ, 126, 2997, doi: 10.1086/379673
- Batalha et al. (1998) Batalha, C. C., Quast, G. R., Torres, C. A. O., et al. 1998, A&AS, 128, 561, doi: 10.1051/aas:1998163
- Benisty et al. (2021) Benisty, M., Bae, J., Facchini, S., et al. 2021, ApJ, 916, L2, doi: 10.3847/2041-8213/ac0f83
- Bertin & Arnouts (1996) Bertin, E., & Arnouts, S. 1996, A&AS, 117, 393, doi: 10.1051/aas:1996164
- Bessolaz et al. (2008) Bessolaz, N., Zanni, C., Ferreira, J., Keppens, R., & Bouvier, J. 2008, A&A, 478, 155, doi: 10.1051/0004-6361:20078328
- Bethell & Bergin (2011) Bethell, T. J., & Bergin, E. A. 2011, ApJ, 740, 7, doi: 10.1088/0004-637X/740/1/7
- Bice & Toomre (2023a) Bice, C. P., & Toomre, J. 2023a, ApJ, 951, 79, doi: 10.3847/1538-4357/acd2db
- Bice & Toomre (2023b) —. 2023b, ApJ, 947, 36, doi: 10.3847/1538-4357/acac78
- Blandford & Payne (1982) Blandford, R. D., & Payne, D. G. 1982, MNRAS, 199, 883, doi: 10.1093/mnras/199.4.883
- Bouvier et al. (2007) Bouvier, J., Alencar, S. H. P., Harries, T. J., Johns-Krull, C. M., & Romanova, M. M. 2007, in Protostars and Planets V, ed. B. Reipurth, D. Jewitt, & K. Keil, 479. https://arxiv.org/abs/astro-ph/0603498
- Bouvier et al. (2020) Bouvier, J., Alecian, E., Alencar, S. H. P., et al. 2020, A&A, 643, A99, doi: 10.1051/0004-6361/202038892
- Branch et al. (1999) Branch, M. A., Coleman, T. F., & Li, Y. 1999, SIAM Journal on Scientific Computing, 21, 1, doi: 10.1137/S1064827595289108
- Bryan et al. (2019) Bryan, G. R., Maddison, S. T., & Liffman, K. 2019, MNRAS, 489, 3879, doi: 10.1093/mnras/stz2401
- Budaj et al. (2015) Budaj, J., Kocifaj, M., Salmeron, R., & Hubeny, I. 2015, MNRAS, 454, 2, doi: 10.1093/mnras/stv1711
- Caffau et al. (2011) Caffau, E., Ludwig, H. G., Steffen, M., Freytag, B., & Bonifacio, P. 2011, Sol. Phys., 268, 255, doi: 10.1007/s11207-010-9541-4
- Campbell-White et al. (2023) Campbell-White, J., Manara, C. F., Benisty, M., et al. 2023, ApJ, 956, 25, doi: 10.3847/1538-4357/acf0c0
- Carroll et al. (2012) Carroll, T. A., Strassmeier, K. G., Rice, J. B., & Künstler, A. 2012, A&A, 548, A95, doi: 10.1051/0004-6361/201220215
- Christiaens et al. (2019) Christiaens, V., Cantalloube, F., Casassus, S., et al. 2019, ApJ, 877, L33, doi: 10.3847/2041-8213/ab212b
- Cody et al. (2014) Cody, A. M., Stauffer, J., Baglin, A., et al. 2014, AJ, 147, 82, doi: 10.1088/0004-6256/147/4/82
- Cridland et al. (2019) Cridland, A. J., Eistrup, C., & van Dishoeck, E. F. 2019, A&A, 627, A127, doi: 10.1051/0004-6361/201834378
- Cutri et al. (2013) Cutri, R. M., Wright, E. L., Conrow, T., et al. 2013, Explanatory Supplement to the AllWISE Data Release Products, Tech. rep., IPAC/Caltech
- Cutri et al. (2015) Cutri, R. M., Mainzer, A., Conrow, T., et al. 2015, Explanatory Supplement to the NEOWISE Data Release Products, Explanatory Supplement to the NEOWISE Data Release Products
- DeRosa et al. (2012) DeRosa, M. L., Brun, A. S., & Hoeksema, J. T. 2012, ApJ, 757, 96, doi: 10.1088/0004-637X/757/1/96
- Desch & Turner (2015) Desch, S. J., & Turner, N. J. 2015, ApJ, 811, 156, doi: 10.1088/0004-637X/811/2/156
- Donati et al. (2019) Donati, J. F., Bouvier, J., Alencar, S. H., et al. 2019, MNRAS, 483, L1, doi: 10.1093/mnrasl/sly207
- Dullemond (2000) Dullemond, C. P. 2000, A&A, 361, L17, doi: 10.48550/arXiv.astro-ph/0007399
- Dzyurkevich et al. (2010) Dzyurkevich, N., Flock, M., Turner, N. J., Klahr, H., & Henning, T. 2010, A&A, 515, A70, doi: 10.1051/0004-6361/200912834
- Edwards et al. (2006) Edwards, S., Fischer, W., Hillenbrand, L., & Kwan, J. 2006, ApJ, 646, 319, doi: 10.1086/504832
- Ercolano & Owen (2010) Ercolano, B., & Owen, J. E. 2010, MNRAS, 406, 1553, doi: 10.1111/j.1365-2966.2010.16798.x
- Espaillat et al. (2011) Espaillat, C., Furlan, E., D’Alessio, P., et al. 2011, ApJ, 728, 49, doi: 10.1088/0004-637X/728/1/49
- Espaillat et al. (2023) Espaillat, C. C., Thanathibodee, T., Pittman, C. V., et al. 2023, ApJ, 958, L4, doi: 10.3847/2041-8213/ad023d
- Facchini et al. (2017) Facchini, S., Birnstiel, T., Bruderer, S., & van Dishoeck, E. F. 2017, A&A, 605, A16, doi: 10.1051/0004-6361/201630329
- Facchini et al. (2021) Facchini, S., Teague, R., Bae, J., et al. 2021, AJ, 162, 99, doi: 10.3847/1538-3881/abf0a4
- Fernandes et al. (2018) Fernandes, R. B., Long, Z. C., Pikhartova, M., et al. 2018, ApJ, 856, 103, doi: 10.3847/1538-4357/aaaae7
- Finociety et al. (2021) Finociety, B., Donati, J. F., Klein, B., et al. 2021, MNRAS, 508, 3427, doi: 10.1093/mnras/stab2778
- Finociety et al. (2023) Finociety, B., Donati, J. F., Cristofari, P. I., et al. 2023, MNRAS, 526, 4627, doi: 10.1093/mnras/stad3012
- Fischer et al. (2022) Fischer, W. J., Hillenbrand, L. A., Herczeg, G. J., et al. 2022, arXiv e-prints, arXiv:2203.11257. https://arxiv.org/abs/2203.11257
- Flaherty et al. (2012) Flaherty, K. M., Muzerolle, J., Rieke, G., et al. 2012, ApJ, 748, 71, doi: 10.1088/0004-637X/748/1/71
- France et al. (2012) France, K., Schindhelm, E., Herczeg, G. J., et al. 2012, ApJ, 756, 171, doi: 10.1088/0004-637X/756/2/171
- France et al. (2023) France, K., Arulanantham, N., Maloney, E., et al. 2023, AJ, 166, 67, doi: 10.3847/1538-3881/ace34c
- Furlan et al. (2009) Furlan, E., Watson, D. M., McClure, M. K., et al. 2009, ApJ, 703, 1964, doi: 10.1088/0004-637X/703/2/1964
- Gaidos et al. (2022) Gaidos, E., Mann, A. W., Rojas-Ayala, B., et al. 2022, MNRAS, 514, 1386, doi: 10.1093/mnras/stac1433
- Gangi et al. (2023) Gangi, M., Nisini, B., Manara, C. F., et al. 2023, A&A, 675, A153, doi: 10.1051/0004-6361/202346543
- Gehrig et al. (2022) Gehrig, L., Steiner, D., Vorobyov, E. I., & Güdel, M. 2022, A&A, 667, A46, doi: 10.1051/0004-6361/202243549
- Ghosh & Lamb (1979) Ghosh, P., & Lamb, F. K. 1979, ApJ, 234, 296, doi: 10.1086/157498
- Grankin et al. (2007) Grankin, K. N., Melnikov, S. Y., Bouvier, J., Herbst, W., & Shevchenko, V. S. 2007, A&A, 461, 183, doi: 10.1051/0004-6361:20065489
- Gravity+ Collaboration et al. (2022) Gravity+ Collaboration, Abuter, R., Alarcon, P., et al. 2022, The Messenger, 189, 17, doi: 10.18727/0722-6691/5285
- Gregorio-Hetem et al. (1992) Gregorio-Hetem, J., Lepine, J. R. D., Quast, G. R., Torres, C. A. O., & de La Reza, R. 1992, AJ, 103, 549, doi: 10.1086/116082
- Gregory et al. (2016) Gregory, S. G., Donati, J.-F., & Hussain, G. A. J. 2016, arXiv e-prints, arXiv:1609.00273, doi: 10.48550/arXiv.1609.00273
- Günther et al. (2022) Günther, M. N., Berardo, D. A., Ducrot, E., et al. 2022, AJ, 163, 144, doi: 10.3847/1538-3881/ac503c
- Haffert et al. (2019) Haffert, S. Y., Bohn, A. J., de Boer, J., et al. 2019, Nature Astronomy, 3, 749, doi: 10.1038/s41550-019-0780-5
- Hart et al. (2023) Hart, K., Shappee, B. J., Hey, D., et al. 2023, arXiv e-prints, arXiv:2304.03791, doi: 10.48550/arXiv.2304.03791
- Hartmann et al. (1998) Hartmann, L., Calvet, N., Gullbring, E., & D’Alessio, P. 1998, ApJ, 495, 385, doi: 10.1086/305277
- Hashimoto et al. (2020) Hashimoto, J., Aoyama, Y., Konishi, M., et al. 2020, AJ, 159, 222, doi: 10.3847/1538-3881/ab811e
- Herbst et al. (1994) Herbst, W., Herbst, D. K., Grossman, E. J., & Weinstein, D. 1994, AJ, 108, 1906, doi: 10.1086/117204
- Holoien et al. (2017) Holoien, T. W. S., Stanek, K. Z., Kochanek, C. S., et al. 2017, MNRAS, 464, 2672, doi: 10.1093/mnras/stw2273
- Ibañez Bustos et al. (2019) Ibañez Bustos, R. V., Buccino, A. P., Flores, M., & Mauas, P. J. D. 2019, A&A, 628, L1, doi: 10.1051/0004-6361/201936030
- Ibañez Bustos et al. (2020) Ibañez Bustos, R. V., Buccino, A. P., Messina, S., Lanza, A. F., & Mauas, P. J. D. 2020, A&A, 644, A2, doi: 10.1051/0004-6361/202039164
- Isella et al. (2019) Isella, A., Benisty, M., Teague, R., et al. 2019, ApJ, 879, L25, doi: 10.3847/2041-8213/ab2a12
- Ishihara et al. (2010) Ishihara, D., Onaka, T., Kataza, H., et al. 2010, A&A, 514, A1, doi: 10.1051/0004-6361/200913811
- Jankovic et al. (2021) Jankovic, M. R., Owen, J. E., Mohanty, S., & Tan, J. C. 2021, MNRAS, 504, 280, doi: 10.1093/mnras/stab920
- Jeffries et al. (2011) Jeffries, R. D., Jackson, R. J., Briggs, K. R., Evans, P. A., & Pye, J. P. 2011, MNRAS, 411, 2099, doi: 10.1111/j.1365-2966.2010.17848.x
- Jordi et al. (2010) Jordi, C., Gebran, M., Carrasco, J. M., et al. 2010, A&A, 523, A48, doi: 10.1051/0004-6361/201015441
- Joyce et al. (2023) Joyce, S. R. G., Pye, J. P., Nichols, J. D., et al. 2023, MNRAS, 519, 4514, doi: 10.1093/mnras/stac3670
- Joyce et al. (2020) —. 2020, MNRAS, 491, L56, doi: 10.1093/mnrasl/slz169
- Kamp & Dullemond (2004) Kamp, I., & Dullemond, C. P. 2004, ApJ, 615, 991, doi: 10.1086/424703
- Käpylä (2021) Käpylä, P. J. 2021, A&A, 651, A66, doi: 10.1051/0004-6361/202040049
- Keppler et al. (2018) Keppler, M., Benisty, M., Müller, A., et al. 2018, A&A, 617, A44, doi: 10.1051/0004-6361/201832957
- Keppler et al. (2019) Keppler, M., Teague, R., Bae, J., et al. 2019, A&A, 625, A118, doi: 10.1051/0004-6361/201935034
- Kesseli et al. (2016) Kesseli, A. Y., Petkova, M. A., Wood, K., et al. 2016, ApJ, 828, 42, doi: 10.3847/0004-637X/828/1/42
- Klein et al. (2021) Klein, B., Donati, J.-F., Moutou, C., et al. 2021, MNRAS, 502, 188, doi: 10.1093/mnras/staa3702
- Kochanek et al. (2017) Kochanek, C. S., Shappee, B. J., Stanek, K. Z., et al. 2017, PASP, 129, 104502, doi: 10.1088/1538-3873/aa80d9
- Kron (1980) Kron, R. G. 1980, ApJS, 43, 305, doi: 10.1086/190669
- Laugier et al. (2023) Laugier, R., Defrère, D., Woillez, J., et al. 2023, A&A, 671, A110, doi: 10.1051/0004-6361/202244351
- Lavail et al. (2019) Lavail, A., Kochukhov, O., & Hussain, G. A. J. 2019, A&A, 630, A99, doi: 10.1051/0004-6361/201935695
- Li et al. (2022) Li, R., Chen, Y.-X., & Lin, D. N. C. 2022, MNRAS, 510, 5246, doi: 10.1093/mnras/stab3677
- Liffman et al. (2020) Liffman, K., Bryan, G., Hutchison, M., & Maddison, S. T. 2020, MNRAS, 493, 4022, doi: 10.1093/mnras/staa402
- Lin et al. (2023) Lin, C.-L., Ip, W.-H., Hsiao, Y., et al. 2023, AJ, 166, 82, doi: 10.3847/1538-3881/ace322
- Lodders (2003) Lodders, K. 2003, ApJ, 591, 1220, doi: 10.1086/375492
- Long et al. (2018) Long, Z. C., Akiyama, E., Sitko, M., et al. 2018, ApJ, 858, 112, doi: 10.3847/1538-4357/aaba7c
- Mainzer et al. (2011) Mainzer, A., Bauer, J., Grav, T., et al. 2011, ApJ, 731, 53, doi: 10.1088/0004-637X/731/1/53
- Mainzer et al. (2014) Mainzer, A., Bauer, J., Cutri, R. M., et al. 2014, ApJ, 792, 30, doi: 10.1088/0004-637X/792/1/30
- Manara et al. (2022) Manara, C. F., Ansdell, M., Rosotti, G. P., et al. 2022, arXiv e-prints, arXiv:2203.09930. https://arxiv.org/abs/2203.09930
- Mayor et al. (2003) Mayor, M., Pepe, F., Queloz, D., et al. 2003, The Messenger, 114, 20
- McCully et al. (2018) McCully, C., Turner, M., Volgenau, N., et al. 2018, LCOGT/Banzai: Initial Release, 0.9.4, Zenodo, doi: 10.5281/zenodo.1257560
- Mei et al. (2023) Mei, Y., Song, S.-M., Liu, J.-T., Hyland, L. J., & Chen, X. 2023, ApJS, 264, 38, doi: 10.3847/1538-4365/aca53d
- Melon Fuksman & Klahr (2022) Melon Fuksman, J. D., & Klahr, H. 2022, ApJ, 936, 16, doi: 10.3847/1538-4357/ac7fee
- Miley et al. (2018) Miley, J. M., Panić, O., Wyatt, M., & Kennedy, G. M. 2018, A&A, 615, L10, doi: 10.1051/0004-6361/201833381
- Moshir & et al. (1990) Moshir, M., & et al. 1990, IRAS Faint Source Catalogue, 0
- Muzerolle et al. (2001) Muzerolle, J., Calvet, N., & Hartmann, L. 2001, ApJ, 550, 944, doi: 10.1086/319779
- Muzerolle et al. (2009) Muzerolle, J., Flaherty, K., Balog, Z., et al. 2009, ApJ, 704, L15, doi: 10.1088/0004-637X/704/1/L15
- Neugebauer et al. (1984) Neugebauer, G., Habing, H. J., van Duinen, R., et al. 1984, ApJ, 278, L1, doi: 10.1086/184209
- Ortiz-Rodríguez et al. (2022) Ortiz-Rodríguez, C. A., Schleicher, D. R. G., Käpylä, P. J., & Navarrete, F. H. 2022, Boletin de la Asociacion Argentina de Astronomia La Plata Argentina, 63, 62, doi: 10.48550/arXiv.2206.14123
- Pascucci et al. (2020) Pascucci, I., Banzatti, A., Gorti, U., et al. 2020, ApJ, 903, 78, doi: 10.3847/1538-4357/abba3c
- Péricaud et al. (2017) Péricaud, J., Di Folco, E., Dutrey, A., Guilloteau, S., & Piétu, V. 2017, A&A, 600, A62, doi: 10.1051/0004-6361/201629371
- Perotti et al. (2023) Perotti, G., Christiaens, V., Henning, T., et al. 2023, Nature, 620, 516, doi: 10.1038/s41586-023-06317-9
- Pinilla & Youdin (2017) Pinilla, P., & Youdin, A. 2017, in Astrophysics and Space Science Library, Vol. 445, Formation, Evolution, and Dynamics of Young Solar Systems, ed. M. Pessah & O. Gressel, 91, doi: 10.1007/978-3-319-60609-5_4
- Portilla-Revelo et al. (2023) Portilla-Revelo, B., Kamp, I., Facchini, S., et al. 2023, A&A, 677, A76, doi: 10.1051/0004-6361/202346607
- Pouilly et al. (2021) Pouilly, K., Bouvier, J., Alecian, E., et al. 2021, A&A, 656, A50, doi: 10.1051/0004-6361/202140850
- Reiners et al. (2022) Reiners, A., Shulyak, D., Käpylä, P. J., et al. 2022, arXiv e-prints, arXiv:2204.00342. https://arxiv.org/abs/2204.00342
- Ricker et al. (2014) Ricker, G. R., Winn, J. N., Vanderspek, R., et al. 2014, in Society of Photo-Optical Instrumentation Engineers (SPIE) Conference Series, Vol. 9143, Proc. SPIE, 914320, doi: 10.1117/12.2063489
- Rigon et al. (2017) Rigon, L., Scholz, A., Anderson, D., & West, R. 2017, MNRAS, 465, 3889, doi: 10.1093/mnras/stw2977
- Romanova et al. (2021) Romanova, M. M., Koldoba, A. V., Ustyugova, G. V., et al. 2021, MNRAS, 506, 372, doi: 10.1093/mnras/stab1724
- Romanova et al. (2003) Romanova, M. M., Ustyugova, G. V., Koldoba, A. V., Wick, J. V., & Lovelace, R. V. E. 2003, ApJ, 595, 1009, doi: 10.1086/377514
- Saar & Brandenburg (1999) Saar, S. H., & Brandenburg, A. 1999, ApJ, 524, 295, doi: 10.1086/307794
- Sanderson et al. (2023) Sanderson, H., Jardine, M., Collier Cameron, A., Morin, J., & Donati, J. F. 2023, MNRAS, 518, 4734, doi: 10.1093/mnras/stac3302
- Scargle (1982) Scargle, J. D. 1982, ApJ, 263, 835, doi: 10.1086/160554
- Shappee et al. (2014) Shappee, B. J., Prieto, J. L., Grupe, D., et al. 2014, ApJ, 788, 48, doi: 10.1088/0004-637X/788/1/48
- Siverd et al. (2018) Siverd, R. J., Brown, T. M., Barnes, S., et al. 2018, in Society of Photo-Optical Instrumentation Engineers (SPIE) Conference Series, Vol. 10702, Ground-based and Airborne Instrumentation for Astronomy VII, ed. C. J. Evans, L. Simard, & H. Takami, 107026C, doi: 10.1117/12.2312800
- Skinner & Audard (2022) Skinner, S. L., & Audard, M. 2022, ApJ, 938, 134, doi: 10.3847/1538-4357/ac892f
- Stauffer et al. (2017) Stauffer, J., Collier Cameron, A., Jardine, M., et al. 2017, AJ, 153, 152, doi: 10.3847/1538-3881/aa5eb9
- Stauffer et al. (2018) Stauffer, J., Rebull, L., David, T. J., et al. 2018, AJ, 155, 63, doi: 10.3847/1538-3881/aaa19d
- Strugarek et al. (2018) Strugarek, A., Beaudoin, P., Charbonneau, P., & Brun, A. S. 2018, ApJ, 863, 35, doi: 10.3847/1538-4357/aacf9e
- Suárez Mascareño et al. (2016) Suárez Mascareño, A., Rebolo, R., & González Hernández, J. I. 2016, A&A, 595, A12, doi: 10.1051/0004-6361/201628586
- Tachibana et al. (2023) Tachibana, K., Miyata, T., Kamizuka, T., et al. 2023, PASJ, 75, 489, doi: 10.1093/pasj/psac088
- Takasao et al. (2022) Takasao, S., Tomida, K., Iwasaki, K., & Suzuki, T. K. 2022, ApJ, 941, 73, doi: 10.3847/1538-4357/ac9eb1
- Tanaka et al. (1996) Tanaka, H., Inaba, S., & Nakazawa, K. 1996, Icarus, 123, 450, doi: 10.1006/icar.1996.0170
- Thanathibodee et al. (2019) Thanathibodee, T., Calvet, N., Bae, J., Muzerolle, J., & Hernández, R. F. 2019, ApJ, 885, 94, doi: 10.3847/1538-4357/ab44c1
- Thanathibodee et al. (2022) Thanathibodee, T., Calvet, N., Hernández, J., Maucó, K., & Briceño, C. 2022, AJ, 163, 74, doi: 10.3847/1538-3881/ac3ee6
- Thanathibodee et al. (2023) Thanathibodee, T., Molina, B., Serna, J., et al. 2023, ApJ, 944, 90, doi: 10.3847/1538-4357/acac84
- Thanathibodee et al. (2020) Thanathibodee, T., Molina, B., Calvet, N., et al. 2020, ApJ, 892, 81, doi: 10.3847/1538-4357/ab77c1
- Tonry et al. (2018) Tonry, J. L., Denneau, L., Heinze, A. N., et al. 2018, PASP, 130, 064505, doi: 10.1088/1538-3873/aabadf
- Ueda et al. (2019) Ueda, T., Flock, M., & Okuzumi, S. 2019, ApJ, 871, 10, doi: 10.3847/1538-4357/aaf3a1
- Ustyugova et al. (2006) Ustyugova, G. V., Koldoba, A. V., Romanova, M. M., & Lovelace, R. V. E. 2006, ApJ, 646, 304, doi: 10.1086/503379
- Wang et al. (2021) Wang, J. J., Vigan, A., Lacour, S., et al. 2021, AJ, 161, 148, doi: 10.3847/1538-3881/abdb2d
- Wang & Chen (2019) Wang, S., & Chen, X. 2019, ApJ, 877, 116, doi: 10.3847/1538-4357/ab1c61
- Williams & Wetherill (1994) Williams, D. R., & Wetherill, G. W. 1994, Icarus, 107, 117, doi: 10.1006/icar.1994.1010
- Wilms et al. (2000) Wilms, J., Allen, A., & McCray, R. 2000, ApJ, 542, 914, doi: 10.1086/317016
- Woitke et al. (2018) Woitke, P., Min, M., Thi, W. F., et al. 2018, A&A, 618, A57, doi: 10.1051/0004-6361/201731460
- Wood et al. (2021) Wood, M. L., Mann, A. W., & Kraus, A. L. 2021, AJ, 162, 128, doi: 10.3847/1538-3881/ac0ae9
- Wright et al. (2010) Wright, E. L., Eisenhardt, P. R. M., Mainzer, A. K., et al. 2010, AJ, 140, 1868, doi: 10.1088/0004-6256/140/6/1868
- Yu et al. (2019) Yu, L., Donati, J. F., Grankin, K., et al. 2019, MNRAS, 489, 5556, doi: 10.1093/mnras/stz2481
- Yuan et al. (2013) Yuan, H. B., Liu, X. W., & Xiang, M. S. 2013, MNRAS, 430, 2188, doi: 10.1093/mnras/stt039
- Zhan et al. (2019) Zhan, Z., Günther, M. N., Rappaport, S., et al. 2019, ApJ, 876, 127, doi: 10.3847/1538-4357/ab158c
- Zhou et al. (2021) Zhou, Y., Bowler, B. P., Wagner, K. R., et al. 2021, AJ, 161, 244, doi: 10.3847/1538-3881/abeb7a
- Zhu et al. (2024) Zhu, Z., Stone, J. M., & Calvet, N. 2024, MNRAS, 528, 2883, doi: 10.1093/mnras/stad3712