High precision proton beam monitor system concept design on CSNS based on SiC
Abstract
A high precision beam monitor system based on silicon carbide PIN sensor is designed for China Spallation Neutron Source 1.6 GeV proton beam to monitor the proton beam fluence. The concept design of the beam monitor system is finished together with front-end electronics with silicon carbide PIN sensors, readout system and mechanical system. Several tests are performed to study the performance of each component of the system. The charge collection of the SiC PIN sensors after proton radiation is studied with 80 MeV proton beam for continuous running. Research on the performance of the front-end electronics and readout system is finished for better data acquisition. The uncertainty of proton beam fluence is below 1 in the beam monitor system.
keywords:
beam monitor system, SiC PIN, proton radiation1 Introduction
China Spallation Neutron Source (CSNS) [1, 2] consists of white neutron source [3], Associated Proton beam Experiment Platform (APEP), proton test beam facility and muon beam facility. The white neutron source and APEP have been built, while others are still in progress. A beam monitor system is necessary to detect the fluence of proton beam. Diamond is commonly used is ATLAS [4] and CMS [5] for beam monitor, while silicon carbide sensors are used in beam monitors for its good performance in radiation hardness and timing resolution [6, 7] compared to diamond sensors. Studies have shown the uncertainty of beam fluence measured by beam monitor based on semiconductor detector is about 10 [8]. Several methods are taken to improve the precision and reduce the uncertainty to 1 at 1 Hz counting rate in this work.
The preliminary design of the beam monitor system is finished which consists of detector board, pre-amplifier, and readout system. The detector board is based on 5 mm 5 mm SiC PIN sensors [9] fabricated by Nanjing University (NJU). Radiation impact on leakage current, capacitance and charge collection efficiency of the SiC PIN sensors are studied and the results prove that the performance of the SiC PIN meets the requirements of the beam monitor system. 8 movable SiC PINs are used around the beam cross section on a mechanical system. A pre-amplifier board is optimised according to UCSC single channel board [10] by changing the shape of the board to satisfy spatial constraints around the beam line. The readout system is designed for the signals from front-end electronics and calculate the beam fluence.
2 Design of the beam monitor system
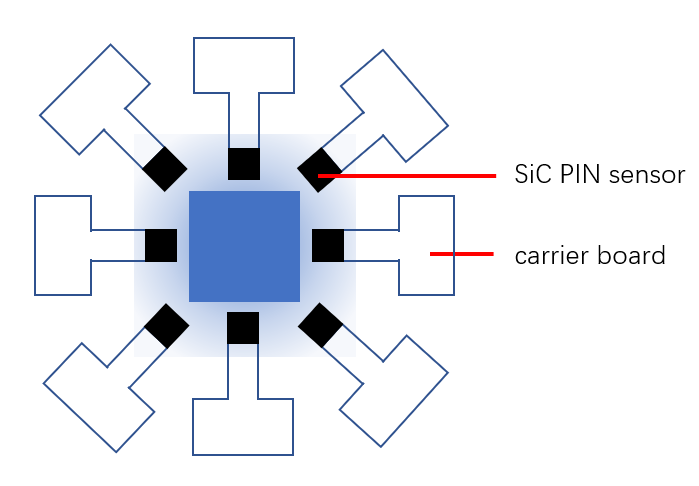
The beam monitor system consists of pre-amplifier, readout system and mechanical design [11]. The system is based on 5 mm 5 mm SiC PIN sensors fabricated by NJU to detect the proton beam. Fig. 1(a) shows the position of detectors around the beam line. Each SiC PIN sensor is equipped with motor to tune the position of the SiC PIN sensors to proper location.
2.1 Beam parameter
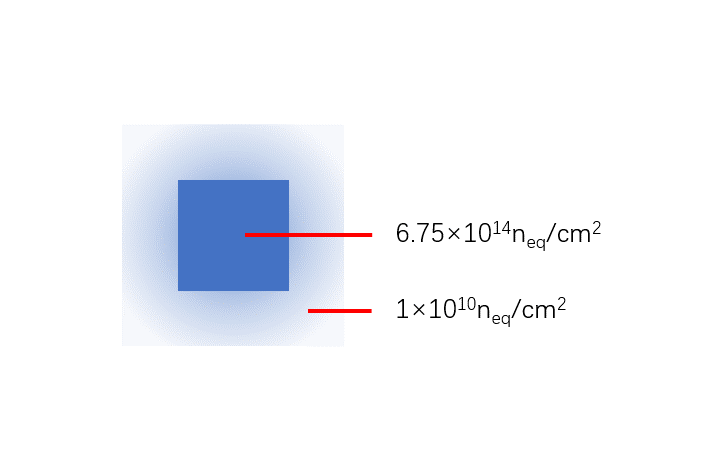
The energy of the proton beam is designed to be 1.6 GeV [2] in CSNS upgrade, and fluence is ×. Radiation dose is 6.75 × at center and 1 × at edge as shown in Fig. 1(b). The beam fluence is uniformly distributed in the beam center and decreases at edge. The beam fluence can be deduced by the signal from SiC PIN sensors and it is estimated from the beam fluence that about each 20 ns comes a proton hitting the SiC PIN sensor at edge of beam.
2.2 Carrier board
The pre-amplifier is a transimpedance amplifier [10], mounted on a T-shape carrier board. Charge collection efficiency of the board is tested by 355 nm laser and 90Sr source. The results are shown in section 4.
2.3 Readout system
The readout system is composed of CAEN DT 5742 [12], data line and control system. DT 5742 can collect waveform in 200 ns. It starts sampling and generate a waveform when a proton hits the SiC PIN sensor, and then the data will be sent to the control system. A software built inside the system is used to analyze the data and get the number of protons.
3 Performance of the SiC PIN
3.1 Electrical performance
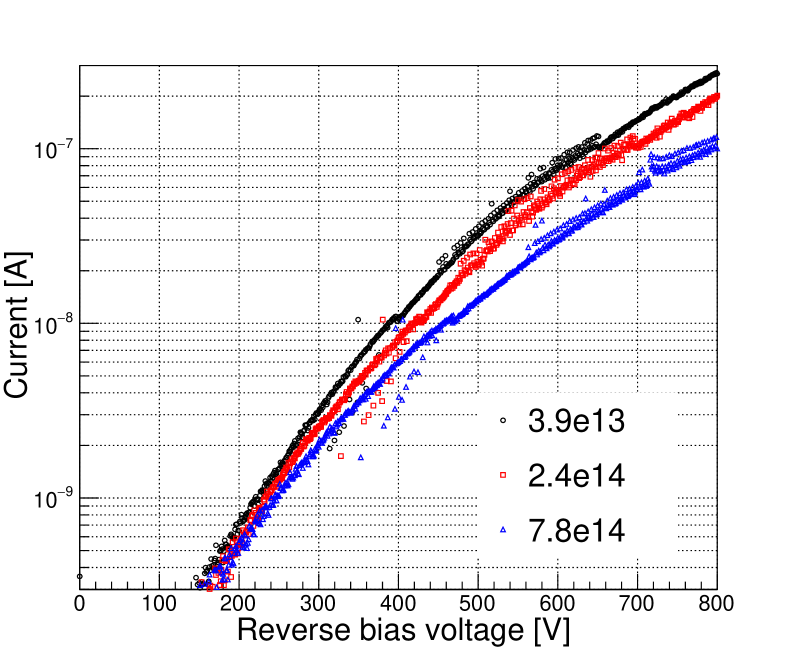
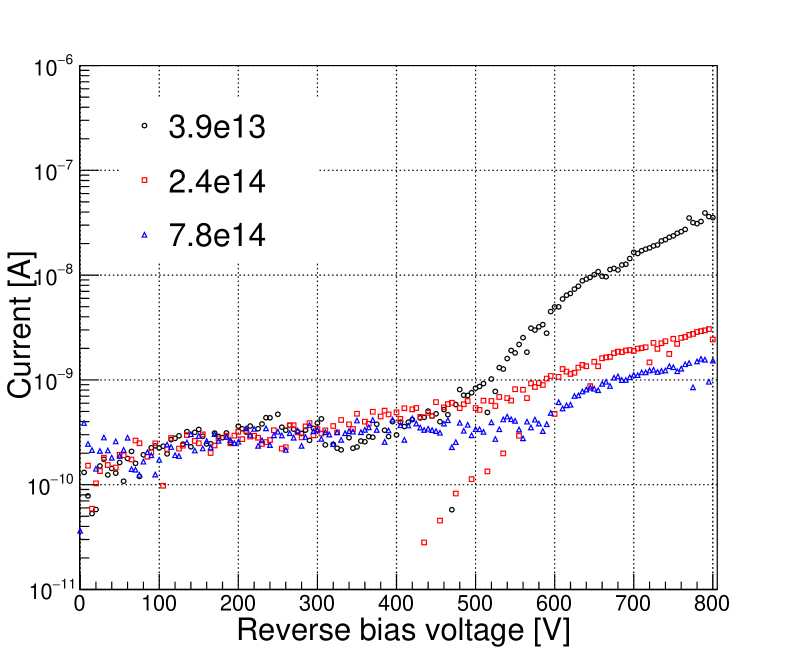
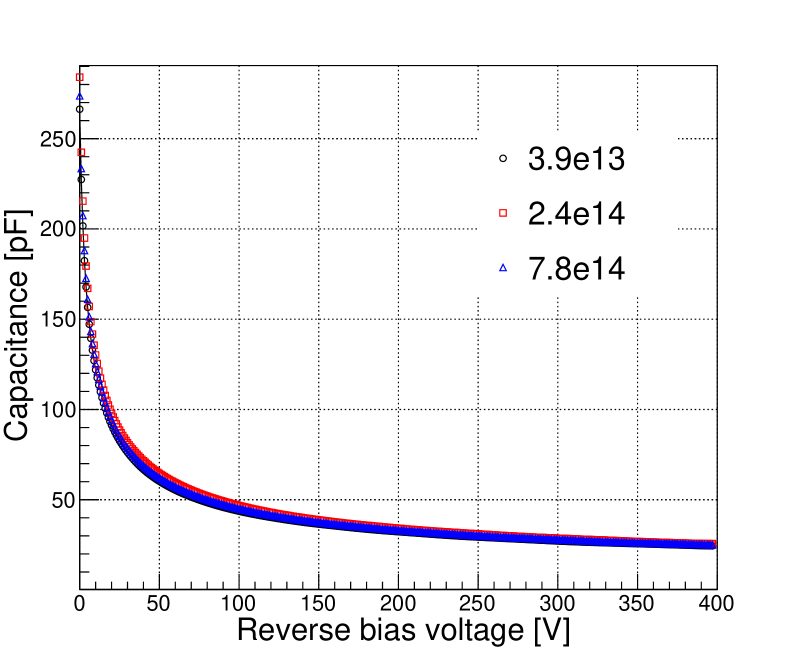
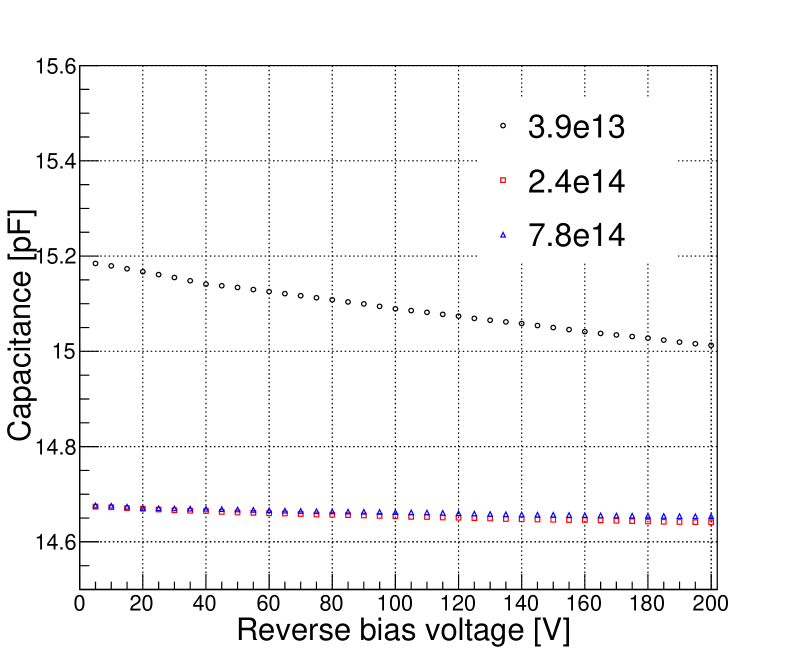
The performance of the SiC PIN sensor after proton radiation [13] is studied by carrying out radiation test on them. The radiation test is performed at APEP and three points are tested, PIN1, PIN2, PIN3, where is the 1 MeV neutron equivalent radiation dose per square centimeter. Fig. 2 shows the current-voltage characteristics of the SiC PIN sensor before and after radiation. IV characteristics of three SiC PIN sensors are similar before radiation and leakage current becomes smaller after radiation. It is indicated in Fig. 3 that the CV characteristics of the SiC PIN sensor before radiation are similar to each other. Capacitance decreases after radiation and it becomes smaller as radiation dose increases [13, 14]. It is revealed in Fig. 2 and Fig. 3 that performance of the SiC PIN sensors will degrade after radiation.
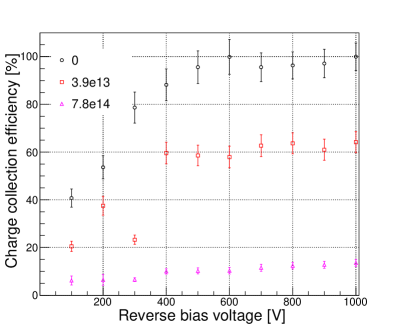
The charge collection efficiency (CCE) is measured by 355 nm laser [15] whose power is 1.44 and the result is shown in Fig. 4. The efficiency of unirradiated sensor at 600V is selected to be 100. It is indicated from Fig. 4 that charge collection efficiency remains the same when the SiC PIN sensor is full depleted as it can be seen in CV characteristic Fig. 3. Detecting efficiency drops to 60 at 500 V after proton radiation. The efficiency becomes smaller as radiation dose gets larger and at the efficiency is only about 10.
3.2 Calibration
The charge collection efficiency after radiation can be calibrated according to radiation dose. Fig. 3 indicates that the efficiency drops to about 60 at 500V at 7.8. Assuming that the change in charge collection varies linearly [16] at small radiation dose around , the relationship between time and efficiency can be calculated. is not concluded in calibration because extreme high dose like this locates out of the linear range. The relationship between the charge efficiency and Q is described by the following relationship
| (1) |
Radiation dose of each SiC PIN sensor is about 1 × and charge collection efficiency is 98% according to the relationship.
4 Performance of readout board
4.1 USCS single channel board
The performance of UCSC single channel board [10] is studied to apply the board to the beam monitor system. It is a transimpedence amplifier (TIA), and its gain is 20 dB. The feedback resistance is the main electric component affecting amplification factor. Simulations and source tests are performed to study its performance.
4.2 NGspice simulation
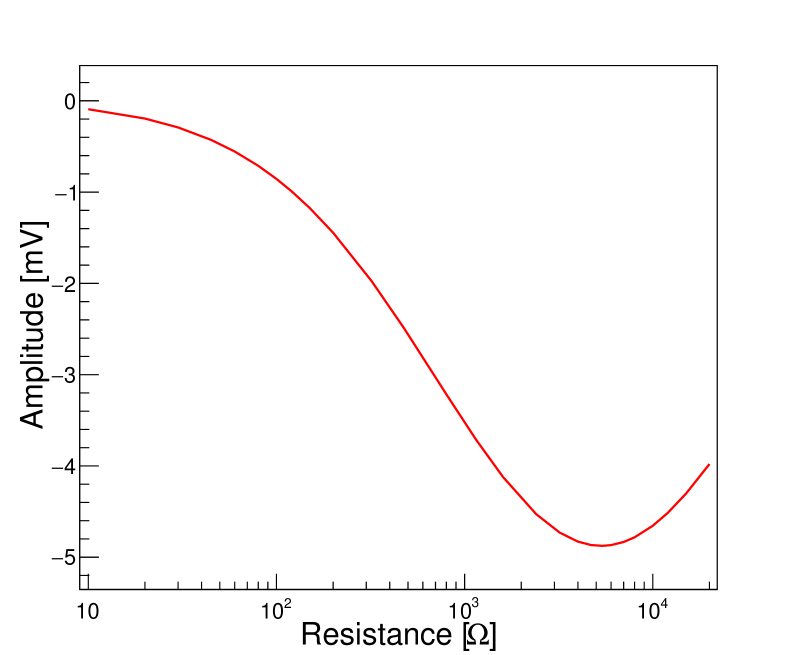
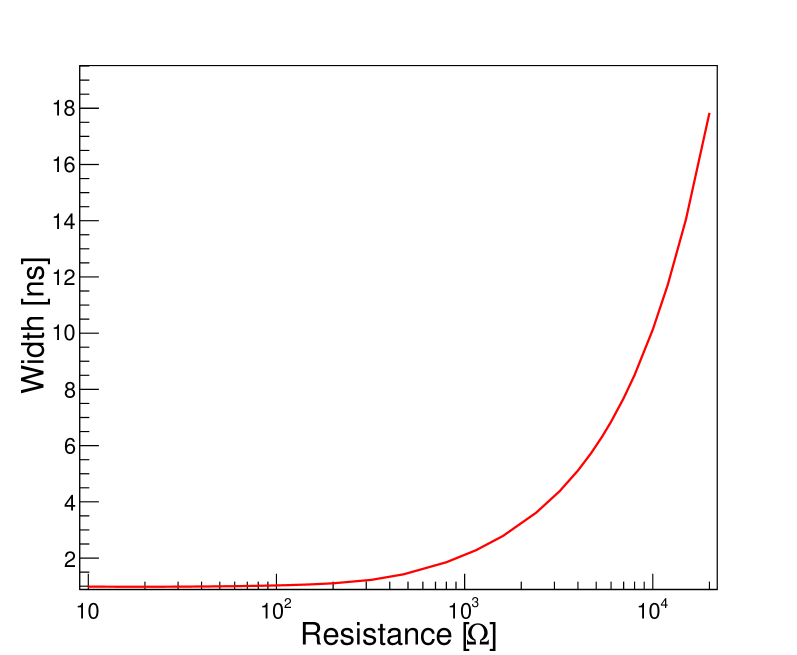
NGspice [17] is used to simulate the performance of the pre-amplifier circuit. The results of simulation are shown in Fig. 5 by adjusting the value of the feedback resistor. Gain of the board reaches an maximum with a 4000 feedback resistor as Fig. 5(a) shows, which is what we expect. The result indicates that board with 4000 feedback resistor has the best performance in amplifying.
4.3 source test on SiC PIN
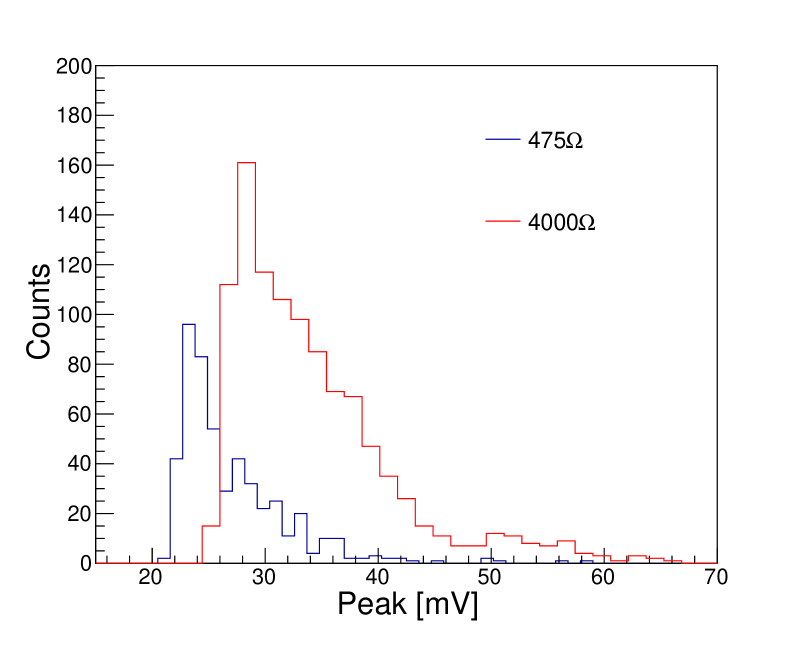
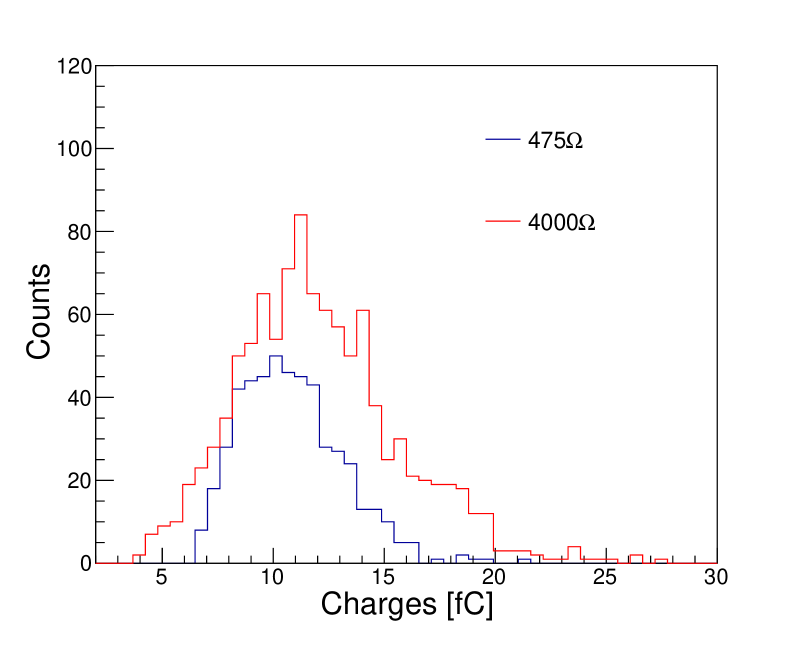
90Sr source tests are finished with UCSC board before and after changing the feedback resistor. The source meter is Keithley 2470 and SiC PIN sensor is supplied with 500 V reverse bias voltage. The output signal is connected to a 20 dB main amplifier PE1513. The trigger voltage is set to be 21 mV. Results are shown in Fig. 6. It is indicated in Fig. 6 that board with feedback resistor is able to detect electrons in a larger charge range than feedback resistor and the average peak voltage is larger, which means more electrons can be detected. Therefore 4000 is selected to be the feedback resistor.
5 Systematic uncertainties
The uncertainty of detecting beam fluence can be divided into Landau noise , electronic noise , noise from proton radiation effects and beam fluctuation . Uncertainty in this system is defined as signal loss . The total uncertainty is .
| (2) |
5.1 Landau noise
The comes from the Landau distribution in energy deposition of electrons [18]. Fig. 7 indicates results of Landau fitting.
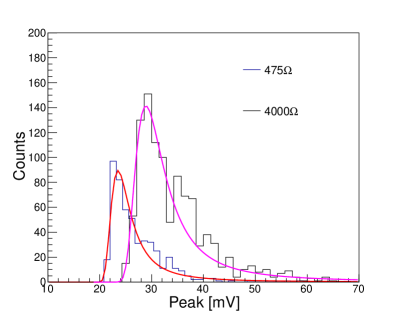
The results reveals that more electrons can be detected when the feedback resistor is 4000 and it results in smaller uncertainty. RASER [19] is used to simulate the proton beam and signals from the SiC detector are shown in Fig. 8. Gaussian fitting is used to estimate uncertainty.
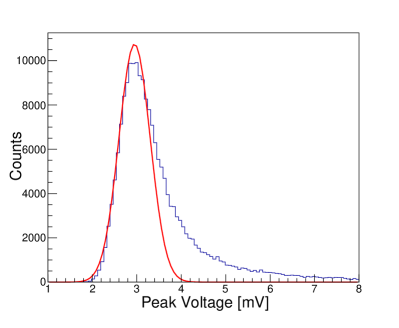
Fig. 8 shows Gaussian fitting on peak voltage and fitting curve is good at peak voltage smaller than 3 mV, so it is reasonable to use to calculate the distribution of peak voltage less than 2 mV. is 0.351 mV and mean peak voltage is 2.950 mV. is 0.263 mV if Landau fitting is used. Using Gaussian fitting instead of Landau fitting brings larger uncertainty, for is larger than . Therefore, the uncertainty calculated from Gaussian distribution is larger than Landau distribution, which means uncertainty is smaller than the distribution of peak voltage less than 2 mV. Let V be the peak voltage, the distribution of peak voltage less than 2 mV can be calculated by the following equation:
| (3) |
The result is 0.33%, and this means is 0.33% at most. The maximum value of uncertainty is taken, and is 0.33%.
5.2 Electronic noise
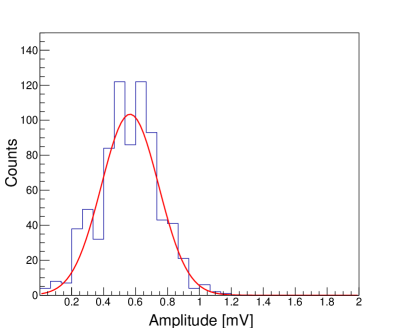
The uncertainty of electronic noise comes from the board and leakage current of SiC PIN sensors. It is indicated in Fig. 9 that noise is mainly distributed at below 1.2 mV. The distribution of noise amplitudes indicates that mean value is 0.57 mV mV, so it is important to set a suitable trigger to reduce noise and reserve more true signals. If the trigger is 2 mV, less than 0.3 noise signal will be detected, so .
5.3 Radiation
The uncertainty of radiation comes from the decrease in performance when the SiC PIN sensor is under proton radiation. Charge collection efficiency will drop to about 98 as calculated in section 3.2 if the system runs 5000 hours in a year. Less than signals will be lost at 2 mV trigger, and the signal is less than which means .
5.4 Fluctuation
The uncertainty of beam fluctuation comes from shifting of the beam profile. It is necessary to figure out the relationship between beam fluctuation and fluence to correct the fluctuation for the fluctuation will affect detecting precision. It is assumed that beam fluence is uniformly distributed at center() and is a Gaussian distribution from to , and then is evenly distributed at and , where the fluence has a sharp drop at , the distribution is shown in the following equation :
| (4) |
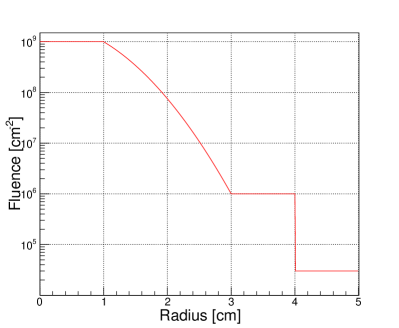
The distribution of the beam is shown in Fig. 10. Detector board is set at , where the fluence is smaller than center and the total fluence will be . Fig. 11 shows the relationship between relative fluence of single SiC PIN sensor against initial fluence. The fluence will not change if the radial beam fluctuation is in range , and radial fluctuation can be calculated out when the fluctuation is in range of to move the SiC PIN sensor to suitable location. Because the beam fluence varies linearly in and has a rapid drop at , the fluence also varies linearly when the radial fluctuation is greater than .
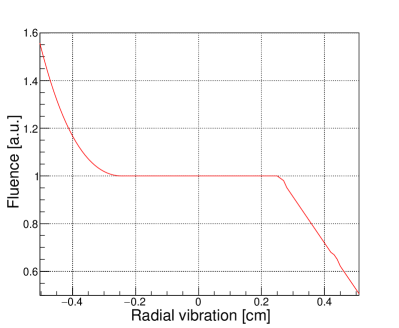
The SiC PIN sensor carrier board is designed to be movable and can be controlled by motor system, so comes from the uncertainty of the motor system . Assuming that m, the will be from Fig. 11. So the and it requires m.
5.5 Uncertainty
Considering all the factor in Table 1, the final uncertainty will be
| (5) |
| Source | / % |
|---|---|
| 0.33 | |
| 0.30 | |
| 0.10 | |
| 0.50 |
The uncertainty is , which can meet the goal of , so the design of the beam monitor system is able to satisfy requirements in CSNS proton beam monitor project.
6 Conclusion
A beam monitor system is designed for CSNS 1.6 GeV proton beam in its next upgrade. Preliminary design of beam monitor system is raised in this work. The system is composed of SiC PIN sensor, carrier board, mechanical system and readout system. Performance of the sensor after radiation is studied and the results prove its good performance in radiation hardness. The single channel board is redesigned based on UCSC readout board to carry the SiC PIN sensor and electrical tests on the board performed to prove the board is suitable for the beam monitor system. The uncertainty of the system is estimated to be below .
The beam monitor system can be used to perform more studies for radiation with the low uncertainty. Performance of sensors after radiation can be studied with precise radiation dose. Furthermore, it is possible to expand the system to other beamlines just by modifying the carrier board and readout system in the future.
Acknowledgement
This work is supported by the National Natural Science Foundation of China (No. 12305207, No. 11961141014, No. 12375184, No. 12205321), the State Key Laboratory of Particle Detection and Electronics (No. SKLPDE-ZZ-202312, No. SKLPDE-KF-202313), the Natural Science Foundation of Shandong Province Youth Fund (No. ZR202111120161).
References
- [1] CSNS webpage, http://english.ihep.cas.cn/csns/
- [2] Jie Wei et al. China spallation neutron source: design, RD, and outlook. Nucl. Instrum. Methods A, 600(1):10–13, 2009.
- [3] Ruirui, F. et al. Detector development at the Back-n white neutron source. Radiat. Detect. Technol. Methods 7, 171–191, 2023.
- [4] Dolenc I. Development of Beam Conditions Monitor for the ATLAS experiment[D]. Ph. D. thesis, University of Ljubljana, 2008.
- [5] Zagozdzinska A A, et al. New fast beam conditions monitoring (BCM1F) system for CMS[J]. J. Instrum, 2016, 11(01): C01088.
- [6] De Napoli M. SiC detectors: A review on the use of silicon carbide as radiation detection material[J]. Frontiers in Physics, 2022: 769.
- [7] Kishishita T, et al. SiC junction diodes toward beam monitor applications[J]. IEEE Transactions on Nuclear Science, 2021, 68(12): 2787-2793.
- [8] Nakamura K, et al. Irradiation and testbeam of KEK/HPK planar p-type pixel modules for HL-LHC[J]. J. Instrum, 2015, 10(06): C06008.
- [9] Yang T, et al. Time resolution of the 4H-SiC PIN detector[J]. Frontiers in Physics, 2022, 10: 718071.
- [10] Ge J J, et al. An ultra-fast low-noise preamplifier for Low Gain Avalanche Detectors[J]. Nucl. Instrum. Methods Phys. Res. A: Accelerators, Spectrometers, Detectors and Associated Equipment, 2022, 1040: 167222.
- [11] Walsh R. Performance of the CMS Fast Beam Conditions Monitor[C] // IEEE Nuclear Science Symposuim & Medical Imaging Conference. IEEE, 2010: 1569-1572.
- [12] Wang K, et al. Investigation of a digitizer for the plastic scintillation detectors of time-of-flight mass measurements[J]. Nucl. Instr. Meth. A, 2022, 1027: 166050.
- [13] Rafi J M, et al. Electron, neutron, and proton irradiation effects on SiC radiation detectors[J]. IEEE Transactions on Nuclear Science, 2020, 67(12): 2481-2489.
- [14] Yang X, et al. Radiation hardness characterization of low gain avalanche detector prototypes for the high granularity timing detector[J]. JUSTC, 2022, 52(1): 3-1-3-7.
- [15] Napoli M D, et al. Study of charge collection efficiency in 4H-SiC schottky diodes with C ions[J]. Nucl. Instr. Meth. A, 2009, 608(1): 80-85.
- [16] N. Iwamoto, et al. Charge Collection Efficiency of 6H-SiC P+N Diodes Degraded by Low-Energy Electron Irradiation[J]. Materials Science Forum, 2010, 645-648:921-924.
-
[17]
P. Nenzi, et al. Ngspice Users Manual, [Online].
At http://ngspice.sourceforge.net/docs/ngspice-manual.pdf - [18] Yuzhen Yang, et al. Characterization of the first prototype NDL Low Gain Avalanche Detectors (LGAD)[J]. Nucl. Instr. Meth. A, 2021, 1011:165591.
- [19] raser. PyPI. Available online: https://pypi.org/project/raser/ (accessed on January 27, 2022).