Optimal Design and Implementation of an Open-source Emulation Platform for User-Centric Shared E-mobility Services
Abstract
In response to the escalating global challenge of increasing emissions and pollution in transportation, shared electric mobility services, encompassing e-cars, e-bikes, and e-scooters, have emerged as a popular strategy. However, existing shared electric mobility services exhibit critical design deficiencies, including insufficient service integration, imprecise energy consumption forecasting, limited scalability and geographical coverage, and a notable absence of a user-centric perspective, particularly in the context of multi-modal transportation. More importantly, there is no consolidated open-source framework which could benefit the e-mobility research community. This paper aims to bridge this gap by providing a pioneering open-source framework for shared e-mobility. The proposed framework, with an agent-in-the-loop approach and modular architecture, is tailored to diverse user preferences and offers enhanced customization. We demonstrate the viability of this framework by solving an integrated multi-modal route-optimization problem using the modified Ant Colony Optimization (ACO) algorithm. The primary contribution of this work is to provide a collaborative and transparent framework to tackle the dynamic challenges in the field of e-mobility research using a consolidated approach.
Index Terms:
Shared e-mobility, Mobility-as-a-Service, Combinatorial optimization, Metaheuristic algorithmsI Introduction
Environmental degradation stands as a formidable challenge for humanity which has been propelled by the relentless pursuit of progress since the industrial revolution. However, this progressive trajectory, marked by unwavering advancement has not been without its ecological consequences and can undo the very development and progress that mankind has achieved over the last more than 50 years [1].
The transportation sector is one of the major contributors to this environmental degradation. According to the recent data by the International Energy Agency (IEA), around a quarter of global greenhouse gas (GHG) emissions come from the transport sector only [2]. This alarming statistic underscores the urgency of addressing this issue promptly, as it stands out as the most pressing concern in the current environmental landscape [3]. On the other hand, the surge in economic trends and development has sparked an ever-increasing demand for transportation. Consequently, the need for innovative transportation solutions based on Electric Mobility (e-mobility), i.e., electric vehicles (EVs), hybrid electric vehicles (HEVs) and other electric transportation tools constitute one of the major pathways for reducing GHG emissions [4]. However, range anxiety, convenient availability of the charging stations and the duration of the charging process (potentially reaching up to 21 hours depending on the type of outlet and e-mobility tool [5]) are some of the few concerns which deter the use of e-mobility as the choice of user preference.
A plausible solution to deal with these challenges is to promote the deployment of shared e-mobility services. By integrating various e-mobility tools, such as e-scooters, e-bikes, and e-cars, into the overall transportation ecosystem, we can maximize the benefits of these alternatives in an integrated and user-centric manner. [6, 7]. This shared e-transportation paradigm not only offers users a new way of traveling but also plays a crucial role in reducing car ownership and emissions during operation. As a result, it has become an essential part of the Mobility-as-a-Service (MaaS) paradigm in many cities across the globe.[8].
Recent studies in the context of e-mobility have focused on several disparate aspects therein. For instance, in [9] and [10], the authors have explored the integration of e-mobility with a particular focus on energy distribution systems and energy management, respectively. In [11], the authors use a data-driven simulation approach to assess the impact of growing numbers of EV users and private charging stations. Similarly, in [12, 13], authors have explored the impact of shared e-mobility on urban transportation and infrastructure distribution. In slightly more related works [14, 15], authors have introduced a multi-agent simulation platform based on deep reinforcement learning optimization. However, this platform is particularly focused on the issue of fleet rebalancing, which is contrary to the broad scope of our work in this paper. Some other works in this regard, including [8, 16, 17], have highlighted, poor integration of services, limited scalability, inadequate energy consumption forecasting and lack of user-centric solutions as few of the critical gaps in the existing e-mobility research. Table I provides a comparative summary for some relevant works.
Keeping aforementioned aspects in view, in order for us to have a user-centric solution that encourages widespread adoption of e-mobility services for better impact, an open-source emulation framework is highly essential. This would ensure the development of robust solutions and will serve as a practical resource for stakeholders to collectively advance and refine e-mobility research.
Before summarizing the major contributions of our work, it is also essential to point out some existing commercially available platforms for shared e-mobility. Moovit [18], Bird [19], ElectricFeel [20], Wunder Mobility [21] are just a few examples to name here. Most of these existing commercial platforms are either regional or multinational startup ventures, lacking transparency regarding their backend architectures and algorithms and fall short in meeting the research requirements necessary to provide a comprehensive understanding of the e-mobility eco-system.
The scope of work presented in this paper differs significantly from the existing commercial platforms, where our primary goal is to establish a research framework that addresses the highly dynamic circumstances surrounding e-mobility in a collaborative open-source manner. To the best of our knowledge, there is still a lack of consolidated, open-source user-centric framework in the context of shared e-mobility. This presents a considerable challenge for the broader research community involved in e-mobility. Our work aims to fill this gap by offering a collaborative and transparent framework that addresses crucial challenges in the e-mobility research domain.
In summary, the major contributions presented in this paper are two-fold:
-
1.
Design and Implementation of a novel Open-Source Shared E-Mobility Framework:111The accompanying code for this paper will be made available through https://github.com/ upon publication.
-
•
The framework incorporates an agent-in-the-loop approach to imitate real-world scenarios.
-
•
It features a modular architecture, allowing customization and flexibility to users.
-
•
The user-centric design caters to diverse user preferences in route efficiency, walking distance, e-mobility transfers, and tool preferences.
-
•
-
2.
Implementation of Multi-Modal Route Optimization Problem using Modified Ant Colony Optimization
-
•
We provide a problem formulation and its application for a complex multi-modal combinatorial route optimization setup.
-
•
It showcases the practical application of the overall framework through a modified ACO-based optimization approach.
-
•
It must be noted that we have limited the scope of this paper to focus on the overall architecture and demonstrate its viability through a use case for combinatorial optimization scenario. More comprehensive details pertaining to other modules of this work will be presented in detail as part of our future work.
The rest of the paper is organized as follows. In section II we provide a detailed overview of the proposed architecture which is followed by a brief explanation about the platform’s work flow in section III. The optimization problem formulation and ACO implementation is subsequently discussed in section IV. Finally, we sum up the entire discussing with a future pathway in section V.
| Simulation Platform | Open-Source | Architecture Generality | User-Centric Flexibility | E-Mobility Options |
|---|---|---|---|---|
| [15] | ✓ | Specific, Fleet Rebalancing | ✗ | Electric Cars, E-Bikes, E-Scooters |
| [22] | ✓ | Specific, Battery diffusion | ✗ | Electric cars only |
| [10] | ✗ | Specific, Energy Management | ✗ | EV in general |
| Flow [23] | ✓ | Specific, Traffic Flow | ✗ | General Transport |
| SGSim [9] | ✗ | Specific, Energy distribution | ✗ | EVs in general |
| Our work | ✓ | Generic Architecture | ✓ | Diverse E-Mobility Options, Customizable |
II Platform Architecture
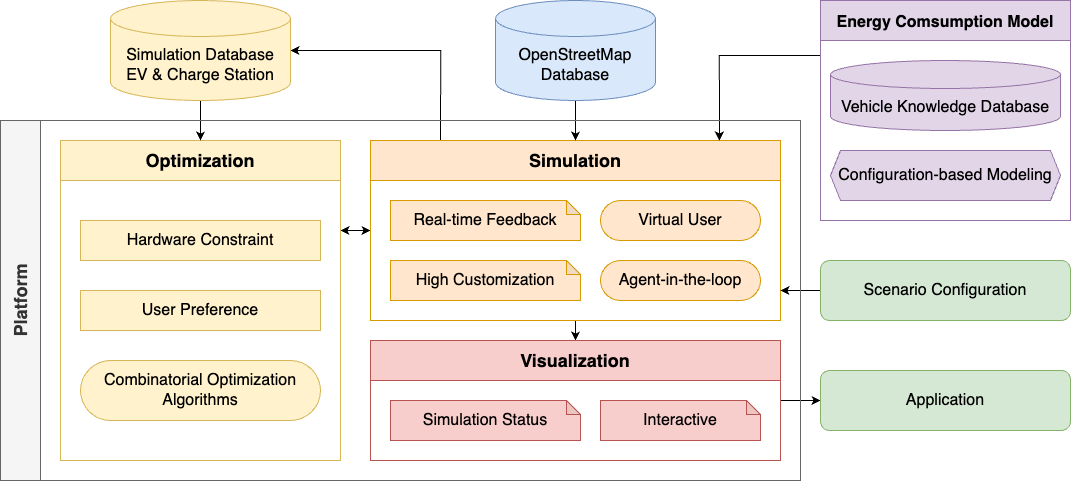
The proposed architecture for the platform consists of several functional blocks, including three major sub-modules, i.e., simulation, optimization and visualization. An overview of the proposed platform architecture and the interactions between different components of the platform is provided in Fig. 1 and explained in the following.
II-A Simulation
The simulation module within the proposed architecture encompasses multiple dimensions, with traffic simulation standing out as a crucial component in the overall design puzzle. We had several options to choose from the available repositories of available open-source traffic simulation tools [24, 25]. After careful consideration, we opted for Simulation for Urban Mobility (SUMO) [26] due to its exceptional flexibility, easy portability, and scalability. SUMO empowers us to create highly customized simulations tailored to the complexities of urban networks. More specifically, there are four main design aspects of the simulator which are highlighted as follows:
II-A1 Virtual User
Virtual users are defined as background digital entities within the simulation environment. These entities replicate human behaviors, executing specific transportation actions, and play a pivotal role in evaluating the system’s performance across diverse scenarios.
II-A2 Agent-in-the-loop
In contrast to virtual users, an agent, in our context, means a real user who can interact with the platform to define their simulation settings before starting the simulation. The simulator has the capability to generate virtual users and integrate real users in the simulation environment. This enables the real user to experience the environment in a way that closely resembles their actual experience with respect to the scenario of interest.
II-A3 Real-time Feedback
We intend to develop the architecture with a real-time feedback mechanism from two perspectives. First, we log simulation statuses in a database and display results within low-latency. Second, our backend optimization algorithms will provide real-time feedback to the simulation environment for additional analysis and processing.
II-A4 High Customisation
High customisation refers to the fact that a real user, i.e., an agent, is able to define the specific scenario as inputs to the traffic simulator. The simulator can be automatically configured to implement the environment as per the required scenario definition.
II-B Optimization
The optimization module of our platform is designed to facilitate personalized route planning, providing users with tailored options based on their individual needs. Specifically, we shall focus on four aspects that may influence optimal decisions, namely hardware constraints, user preferences, multi-agent, and diverse combinatorial optimization algorithms.
II-B1 Hardware Constraints
The hardware constraints of the shared e-mobility platform take into account the availability and physical characteristics of various e-mobility devices, such as battery capacity and speed, as well as infrastructure elements including charging stations and parking spots.
II-B2 User Preferences
This implies that users have the ability to specify their own needs and constraints, such as minimizing walking time, reducing the number of transfers, or choosing to exclude certain modes of transport. The optimization component suggests routes that accommodate individual needs.
II-B3 Combinatorial Optimization Algorithms
The core problem to be addressed in our context is an optimal multi-modal routing problem which can be formulated as a constrained combinatorial optimization problem and will be presented in further details in upcoming section IV. The platform provides the flexibility for researchers to benefit from the overall framework and create custom scenarios for integrating their custom algorithms.
II-C Visualization
The main purpose of the visualization module is to present data in a visual format that is easily understandable and interpretable to real users. It goes beyond static representations by offering an interactive experience that allows users to actively engage with and explore the simulated environment. Through intuitive controls and real-time feedback, users can manipulate variables, observe the effects, and simulate “what-if” scenarios. This interactivity fosters a more engaging and insightful user experience, empowering users to gain deeper insights, make informed decisions, and effectively communicate complex information. The visualization layer enhances understanding, facilitates experimentation, and enables more effective decision-making.
II-D Energy Consumption Model
As one of the constraints of optimization problem, we utilized several models to predict the energy consumption for each e-mobility device on each edge, including a mathematical model [27] and multiple data-driven models. More details pertaining to the energy consumption modeling are out of the scope of this paper and will be communicated separately for better clarity.
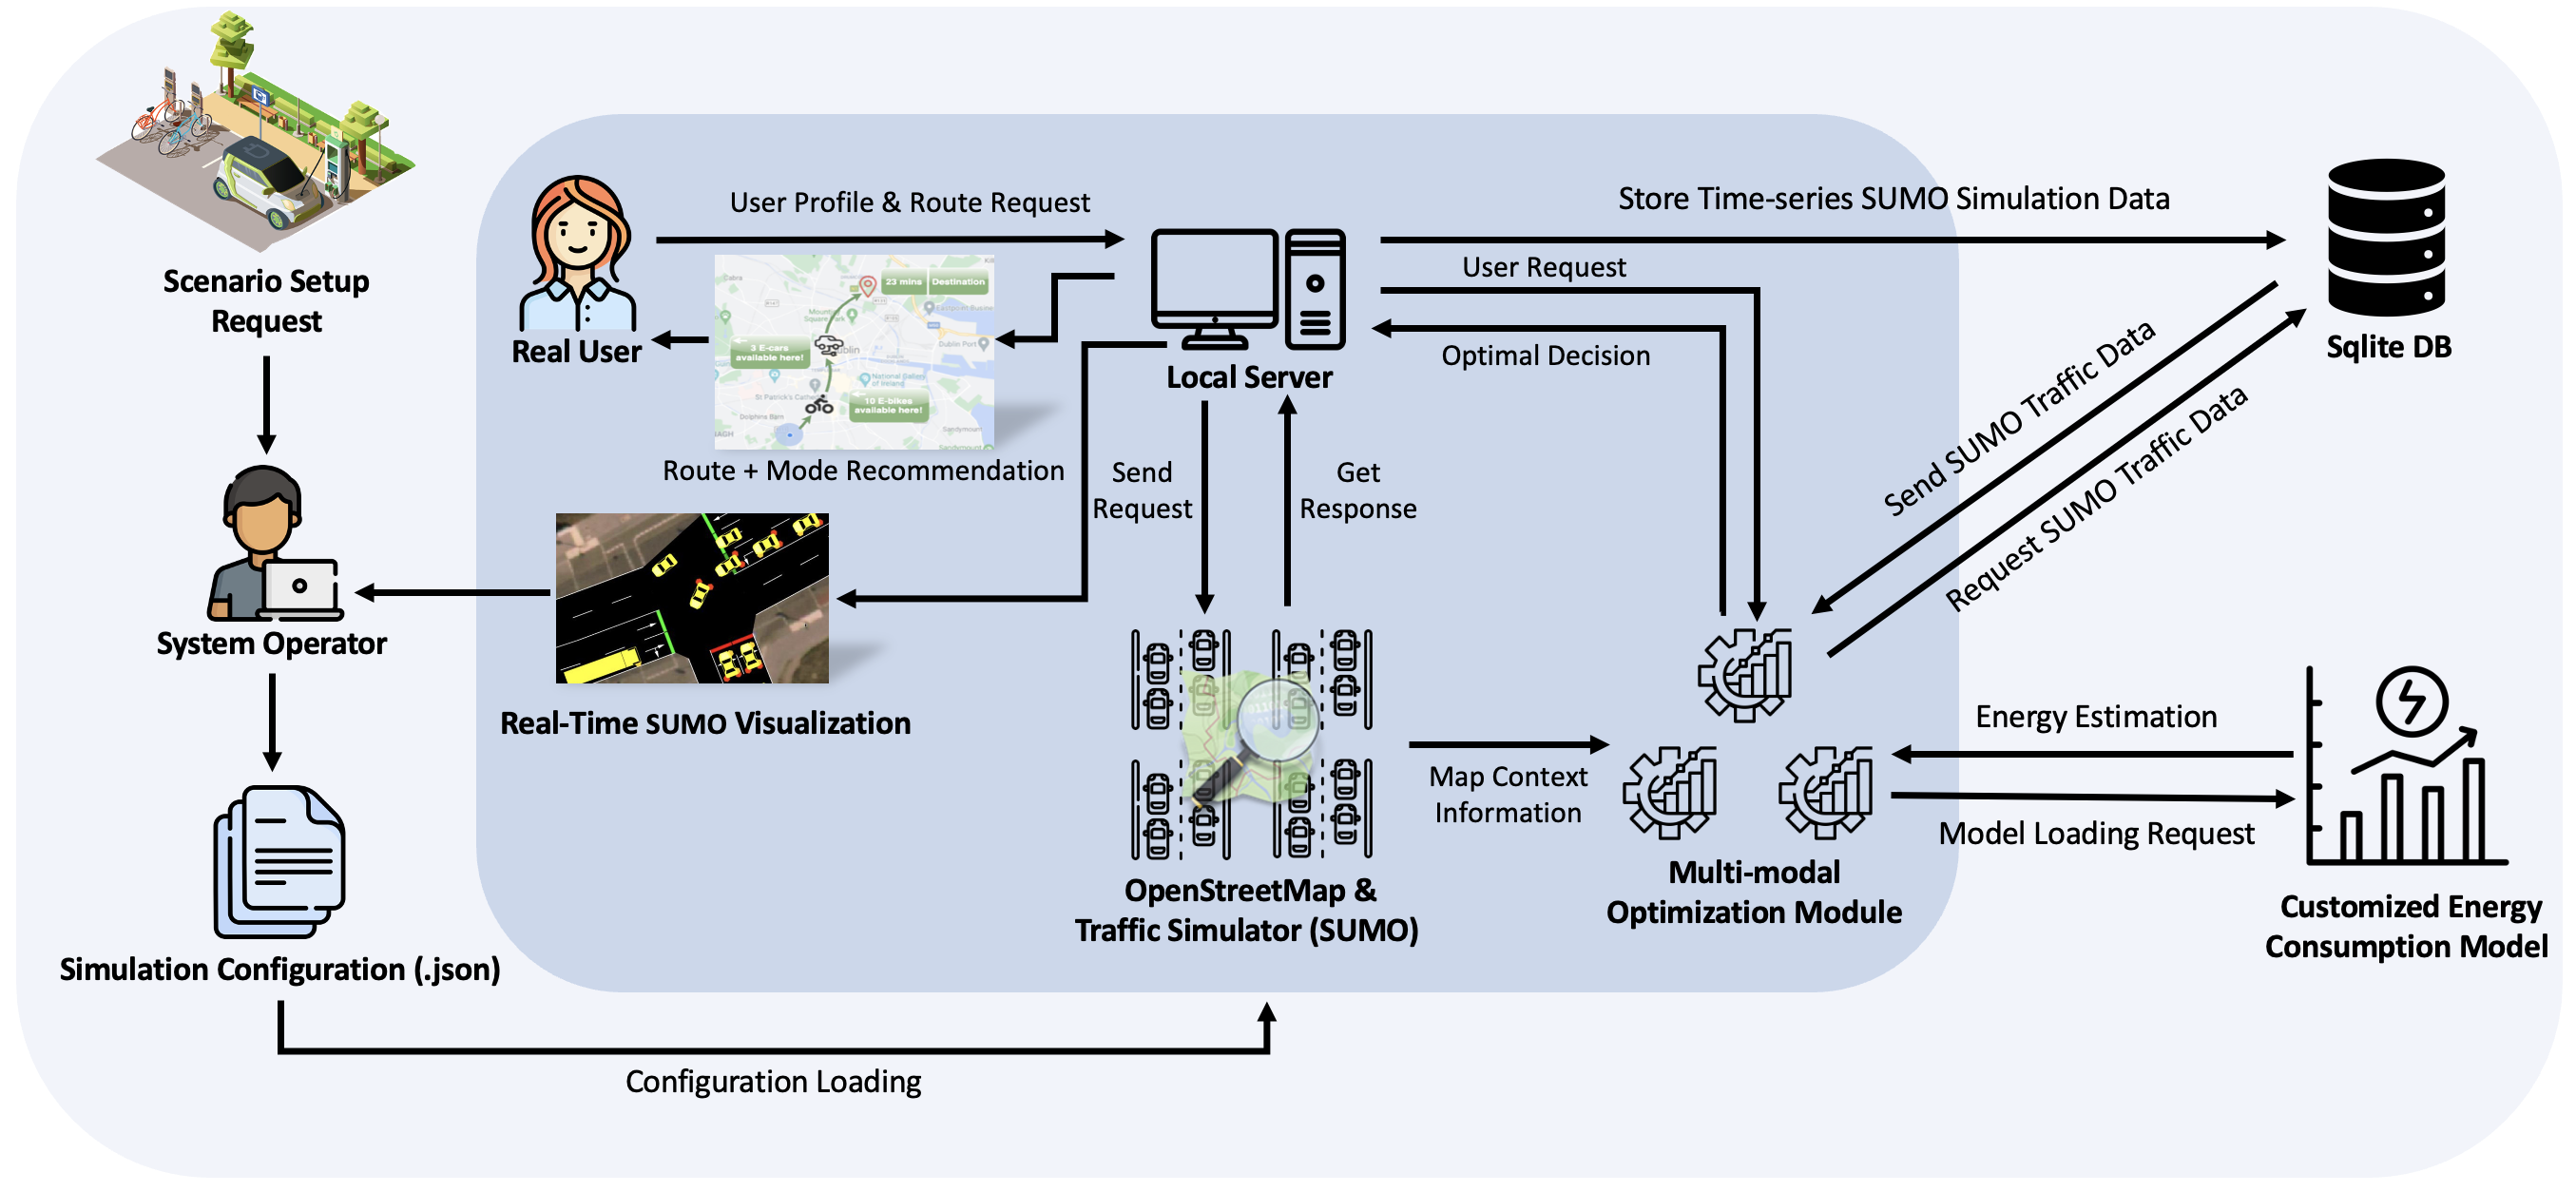
III Platform Workflow
In this section, we will provide a concise overview of the workflow for our platform, as outlined in the proposed architecture discussed in Section II. For a visual representation of the entire process, refer to Fig. 2, which provides a comprehensive illustration of the workflow.
The key element driving our platform’s functionality is the simulator. The simulator is created by seamlessly integrating Simulation of Urban MObility (SUMO) and the Traffic Control Interface (TraCI) client in a collaborative manner. To augment its capabilities, we have incorporated custom plugins that play a crucial role in orchestrating different simulation scenarios. These scenarios are designed to include various aspects of shared E-mobility, such as charging stations and shared electric vehicles. By utilizing the simulator, we can efficiently configure the entire set of functionalities for the platform.
To set up the simulation environment, we initially configure it based on the user input. It uses the geographical data from OpenStreetMap and converts it into a “.net.xml” file for SUMO. Simultaneously, it generates “.rou.xml” and “.sumocfg” configuration files according to the user’s specifications. Our experiments cover a range of real-world maps, from approximately 100 to 2000 edges, showcasing the platform’s real-time routing capability across various map sizes. The simulator subsequently establishes various scenarios pertaining to the shared E-mobility data, including charging station locations and the State of Charge (SoC) of Shared E-vehicles. These details are subsequently updated in the database.
Next, the simulator establishes a continuous connection with the optimization module, incorporating user configurations and simulation contexts. This connection remains active throughout the simulation, enabling seamless communication between the modules. Virtual users are then introduced into the experimental environment, simulating real-world traffic scenarios based on specified traffic density. As the simulation progresses, the core simulator consistently updates environmental contexts in the database at regular intervals and sends updating requests to the optimization module. Upon receiving trip recommendation requests from users, the simulator communicates with the optimization module to obtain the optimal multi-modal route information. The results are transformed into a format compatible with the TraCI client. The recommended multimodal routes are simulated in SUMO by setting up vehicles within the simulation environment. This step is essential for recreating and evaluating the suggested routes. As the simulation progresses, with real-time updates on the status of vehicles, the SUMO-GUI visually represents the evolving scenario, enabling users to interactively observe and understand the simulation.
IV System Model and Algorithm
While the core emphasis of this paper lies on the architecture, we find it crucial to offer a concise overview of the ongoing work related to multi-modal route optimization, which stands as a fundamental component within this framework. This optimization module seamlessly interacts with other modules to enhance the overall user experience. The problem formulation in this regard is explained in the following.
IV-A Problem Formulation
Through a real-time communication with simulation, we utilize the map data files (.net and .xml) specific to the region of interest (ROI), along with various dynamic and static parameters, e.g., average speed and location information for the charging stations. We meticulously translate the given problem into a graph which serves as the foundational structure for the implementation of optimization algorithm for obtaining the optimal route. Our focus is to provide a framework that not only recommends optimal routes based on certain certain limitations such as time, energy efficiency, and user preferences (such as multi-modal options), but also has the capability to adapt dynamically to changing urban mobility landscapes. The mathematical formulation of our optimization problem, encompassing the minimization of travel time and the integration of multi-modal options amidst several constraints is provided in the following.
IV-A1 Optimization Objectives and Constraints
The main optimization objective is to recommend an optimal multi-modal route to a user that minimizes the total travel time from a designated start point to a destination within a bounded geographical area or ROI. More specifically, we model the area of interest using a weighted directed graph , where, is the vertex set representing road segments or nodes, and is the set of edges with corresponding positive weights in . Here, superscript corresponds to the available e-mobility tools (e.g., e-bike, e-car, e-scooter, etc.). The weight linked to edge denotes the travel time cost when utilizing the ’th type of mobility tool on that edge, with that encompasses all available e-mobility tool types in the network. Specifically, the weight is defined as a random variable that follows a probability distribution , e.g., a normal distribution, modelling the uncertainty of travel time cost. Finally, let the adjacency matrix be of size . If there is no edge from to , then otherwise .
Given this context, our optimization problem is to find a path which consists of a sequence of vertices starting from the source vertex and terminating at the destination vertex that minimizes the sum of the weights of its constituent edges. Most importantly, we are interested in the transportation mode required for the user to traverse each road segment of the path. Mathematically, we aim to optimize the following problem:
| (1) | ||||
| subject to: | ||||
| (2) | ||||
| (3) | ||||
| (4) | ||||
| (5) | ||||
| (6) |
Equation (1), is the overall optimization objective (cost function), and represents our primary target for minimization. Within this equation, is the cost linked to transitioning from node to using the ’th type of e-mobility tool. Additionally, encapsulates the cost associated with changing the e-mobility tool type from to within node .
To elaborate further, is a binary decision variable equating to 1 if the path segment from node to utilizes station type , and 0 otherwise. Notably, nodes and are interlinked in the graph, with representing the shared (e-mobility) station type between and . Similarly, is another binary decision variable, taking the value 1 if there is a mode transition within node from to , where is distinct from .
This objective function adheres to constraints detailed in equations (2) - (6), where (2) ensures path segments have precisely one e-mobility tool in use. Meanwhile, (3) enforces non-negativity for binary variables representing e-mobility type transitions. The linking constraint in (4) binds path segment decision variable (X) and station type-change variable (Y), ensuring the selected e-mobility tool type for a segment continues or changes within the next segment, maintaining coherence. Equation (5) guarantees decision variables remain binary (0 or 1) throughout the optimization. Equation (6) is related to the energy constraints and it ensures that the energy consumption required for transition from to using mode is less than the maximum available energy for the chosen mode (s). In summary, these constraints collectively ensure the proper selection of e-mobility tools keeping in view their availability and energy requirements at the corresponding nodes. In order to minimize the objective function in (1), we employ ACO algorithm which is modified to adapt to our problem formulation. It is pertinent to mention here that the work on optimization problem is still on-going, where, we also use the more advanced AI-based approaches which we intend to disseminate as a separate entity for more details, clarity and better impact. The implementation of ACO is briefly described in the following section.
IV-B Implementation of the ACO Algorithm
Ant Colony Optimization (ACO) is a metaheuristic algorithm which mimics ants’ foraging to optimize routes using virtual pheromones, guiding toward efficient solutions. Pheromone evaporation and deposition adjust for changing conditions and path quality, balancing exploration and exploitation. The main inspiration for using ACO is based on our seminal work presented in [28], where ACO is applied to provide parking guidance recommendations, taking into account the uncertainty associated with locating street parking spaces. We have modified the problem for our scenario and improved upon the existing solution by adapting it for the multi-modal optimization within the specific constraints including the energy factor. In the following, we briefly explain the implementation details of the ACO algorithm. This includes the calculation of probabilities for route selection based on pheromone levels, and the mechanism for updating these levels to reflect the evolving conditions of the network.
IV-B1 Next Move Probability Calculation
In the ACO algorithm, the probability of selecting next move step is based on the pheromone level, heuristic information, and energy factor associated with that move. The probability is computed using the following.
| (7) |
-
•
: Conditional probability of transitioning from edge , mode to edge , mode given that the current mode at edge is . Where,
-
•
: Pheromone level associated with the transition from edge i with mode to edge j with mode .
-
•
: Heuristic information representing the desirability of the transition from to .
-
•
: Binary energy factor associated with the remaining energy for traversing the transition . It is 1 if energy conditions for transition are met and 0 otherwise. Details pertaining to energy prediction and modeling are out of the scope of this paper.
-
•
: Parameters controlling the relative importance of pheromone level, heuristic information, and energy factor, respectively.
-
•
The denominator represents the sum of pheromone- and heuristic-weighted energy factors for all possible transitions, excluding the current modes and .
IV-B2 Pheromone Updates Rule
-
•
After Evaporation:
(8) -
–
: Pheromone level associated with the transition from ( to . Where, is the evaporation rate determining the rate at which pheromone levels diminish over time.
-
–
-
•
After Deposition:
(9) -
–
: Pheromone level associated with the transition from to .
-
–
: Constant factor influencing the amount of pheromone deposition.
-
–
: Time Cost associated with the transition .
-
–
IV-C Validation & Discussion
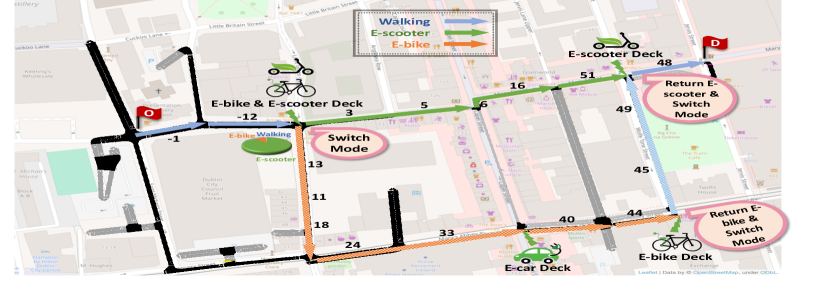
To validate the effectiveness of the ACO algorithm within the framework of our defined problem, we utilized a real map with a relatively small Region of Interest (ROI) for demonstration purposes. The map was transformed into a weighted graph and was used as input of the ACO algorithm. In Fig. 3, we present a clear illustration of the scenario, portraying a multi-modal transportation environment featuring e-bike, e-scooter, and e-car docking stations for vehicle pick-up or mode transition. The origin “O” and the destination “D” are marked using red flags on the map which serve as the query points for the algorithm. The directional lines in various colors represent the possible routes, indicating different modes of transport available on the corresponding segments.
The optimal route based on the specific constraints, as determined by ACO, follows a straight line from origin “O” to destination “D”, represented by colors along the edges (edge ids) . It must be noted that these edge ids are based on the “.net.xml” file obtained from SUMO. The blue color corresponds to walking, and green highlights the transition from walking to e-scooter which illustrates the algorithms’s ability to navigate the complex multi-modal optimization scenario. The final time cost for this optimal route is estimated to be around 70 seconds. One of the other possible routes along edges , which is highlighted as and arrows in the Fig. 3 is a sub-optimal route with an estimated time cost of around 103 seconds.
| Edges | P(Walking) | P(e-scooter) | P(e-bike) | P(e-car) |
|---|---|---|---|---|
| 1.0000 | 0.0000 | 0.0000 | 0.0000 | |
| 0.0003 | 0.9643 | 0.0354 | 0.0000 | |
| 0.0000 | 0.9818 | 0.0121 | 0.0000 | |
| 1.0000 | 0.0000 | 0.0000 | 0.0000 |
ACO is a population-based meta heuristic algorithm, and the transition probabilities from to , are given by (7). The algorithm’s transition probabilities for the optimal route are summarized in Table II which represent the likelihood of transitioning between different modes at specific edges along the route. For instance, if a user starts from the starting point “O” at edge () using walking i.e., () and proceeds to edge (), then the transition probability from walking to other available modes is given in table (II). It is evident that the transition probabilities for all other modes, except walking, are 0 for this specific move (this is also illustrated in the Fig. 3). Similarly, when moving from () to (), the transition probability to shift from walking to e-scooter is notably high at 0.9643. This suggests that e-scooter becomes the recommended mode along edge 3 unless the transition probability for another mode surpasses it. Furthermore, examining the transition from () (using e-scooter) to (), the transition probability to shift from e-scooter to walking is precisely 1. This implies that walking becomes the preferred mode for the last mile, emphasizing the adaptability of the algorithm’s recommendations based on transition probabilities along the traversal.
V Conclusion and Future Work
In this paper we have addressed a critical gap in the existing e-mobility research. Our integrated open-source shared e-mobility platform stands as a valuable resource, enabling researchers to drive advancements more effectively in this field. The agent-in-the-loop framework enhances realism in problem formulation, while the user-centric optimization approach, considering factors like time, cost, and energy consumption, aims to encourage broader user adaptation to e-mobility transportation. The modular architecture facilitates seamless customization promoting effortless integration of diverse solutions. To showcase the platform’s functionality, we provided a practical demonstration of multi-modal route optimizations in a small ROI on a real-world map. Using the customized ACO algorithm, we successfully determined the optimal route in a multi-modal problem formulation, emphasizing the real-world application of our solution. It is pertinent to mention that our ongoing work in optimization using more advanced AI algorithms will be detailed separately for better focus and clarity. Additionally, the platform’s capability to predict energy consumption, a crucial aspect integrated into the optimization framework, also falls outside the scope of this paper and will also be discussed in a separate communication. In summary, this work offers a comprehensive open-source framework to benefit the broader research community in E-mobility domain, and lays the groundwork for more focused discussions and advancements for different aspects of e-mobility research.
ACKNOWLEDGMENT
This work has emanated from research supported in part by Science Foundation Ireland under Grant Number 21/FFP-P/10266 and SFI/12/RC/2289_P2 (Insight SFI Research Centre for Data Analytics), co-funded by the European Regional Development Fund in collaboration with the SFI Insight Centre for Data Analytics at Dublin City University.
References
- [1] S. Alataş, “Do environmental technologies help to reduce transport sector co2 emissions? evidence from the eu15 countries,” Research in Transportation Economics, vol. 91, p. 101047, 2022, decarbonising transport. [Online]. Available: https://www.sciencedirect.com/science/article/pii/S0739885921000196
- [2] I. energy agency. [Online]. Available: https://www.iea.org/data-and-statistics
- [3] D. Godil, Z. Yu, A. Sharif, R. Usman, and S. Khan, “Investigate the role of technology innovation and renewable energy in reducing transport sector co 2 emission in china: A path toward sustainable development,” Sustainable Development, vol. 29, 02 2021.
- [4] M. Liu, “Fed-bev: A federated learning framework for modelling energy consumption of battery electric vehicles,” in 2021 IEEE 94th Vehicular Technology Conference (VTC2021-Fall), 2021, pp. 1–7.
- [5] bbva. [Online]. Available: https://www.bbva.ch/en/news/advantages-and-disadvantages-of-electric-mobility/
- [6] G. Dias, E. Arsenio, and P. Ribeiro, “The role of shared e-scooter systems in urban sustainability and resilience during the covid-19 mobility restrictions,” Sustainability, vol. 13, no. 13, 2021. [Online]. Available: https://www.mdpi.com/2071-1050/13/13/7084
- [7] A. Nikitas, S. Tsigdinos, C. Karolemeas, E. Kourmpa, and E. Bakogiannis, “Cycling in the era of covid-19: Lessons learnt and best practice policy recommendations for a more bike-centric future,” Sustainability, vol. 13, p. 4620, 04 2021.
- [8] F. Liao and G. Correia, “Electric carsharing and micromobility: A literature review on their usage pattern, demand, and potential impacts,” International Journal of Sustainable Transportation, vol. 16, no. 3, pp. 269–286, 2022.
- [9] K.-S. Cho, S.-W. Park, and S.-Y. Son, “Digital twin-based simulation platform with integrated e-mobility and distribution system,” in CIRED Porto Workshop 2022: E-mobility and power distribution systems, vol. 2022. IET, 2022, pp. 1158–1162.
- [10] M. Ferrara, B. Monechi, G. Valenti, C. Liberto, M. Nigro, and I. Biazzo, “A simulation tool for energy management of e-mobility in urban areas,” in 2019 6th International Conference on Models and Technologies for Intelligent Transportation Systems (MT-ITS). IEEE, 2019, pp. 1–7.
- [11] D. Echternacht, I. El Haouati, R. Schermuly, and F. Meyer, “Simulating the impact of e-mobility charging infrastructure on urban low-voltage networks,” in NEIS 2018; Conference on Sustainable Energy Supply and Energy Storage Systems. VDE, 2018, pp. 1–6.
- [12] T. Campisi, N. Ali, K. D. Alemdar, Ö. Kaya, M. Y. Çodur, and G. Tesoriere, “Promotion of e-mobility and its main share market: Some considerations about e-shared mobility,” in AIP Conference Proceedings, vol. 2611, no. 1. AIP Publishing LLC, 2022, p. 060002.
- [13] K. Laurischkat, A. Viertelhausen, and D. Jandt, “Business models for electric mobility,” Procedia Cirp, vol. 47, pp. 483–488, 2016.
- [14] M. Luo, B. Du, K. Klemmer, H. Zhu, and H. Wen, “Deployment optimization for shared e-mobility systems with multi-agent deep neural search,” IEEE Transactions on Intelligent Transportation Systems, vol. 23, no. 3, pp. 2549–2560, 2021.
- [15] M. Luo, B. Du, W. Zhang, T. Song, K. Li, H. Zhu, M. Birkin, and H. Wen, “Fleet rebalancing for expanding shared e-mobility systems: A multi-agent deep reinforcement learning approach,” IEEE Transactions on Intelligent Transportation Systems, 2023.
- [16] T. Duraisamy and D. Kaliyaperumal, “Adaptive passive balancing in battery management system for e‐mobility,” International Journal of Energy Research, vol. 45, 02 2021.
- [17] Y. Chen, G. Wu, R. Sun, A. Dubey, A. Laszka, and P. Pugliese, “A review and outlook on energy consumption estimation models for electric vehicles,” SAE International Journal of Sustainable Transportation, Energy, Environment, & Policy, vol. 2, 03 2021.
- [18] Moovit. [Online]. Available: https://moovitapp.com/sf_bay_area_ca-22/poi/en-gb
- [19] Bird. [Online]. Available: https://www.bird.co/
- [20] ElectricFeel. [Online]. Available: https://www.electricfeel.com/
- [21] W. Mobility. [Online]. Available: https://www.wundermobility.com/
- [22] T. Buchmann, P. Wolf, and S. Fidaschek, “Stimulating e-mobility diffusion in germany (emosim): An agent-based simulation approach,” Energies, vol. 14, no. 3, p. 656, 2021.
- [23] C. Wu, A. Kreidieh, K. Parvate, E. Vinitsky, and A. M. Bayen, “Flow: Architecture and benchmarking for reinforcement learning in traffic control,” arXiv preprint arXiv:1710.05465, vol. 10, 2017.
- [24] J. Barceló and J. Casas, “Dynamic network simulation with aimsun,” Simulation approaches in transportation analysis: Recent advances and challenges, pp. 57–98, 2005.
- [25] M. Fellendorf and P. Vortisch, “Microscopic traffic flow simulator vissim,” Fundamentals of traffic simulation, pp. 63–93, 2010.
- [26] D. Krajzewicz, G. Hertkorn, C. Rössel, and P. Wagner, “Sumo (simulation of urban mobility)-an open-source traffic simulation,” in Proceedings of the 4th middle East Symposium on Simulation and Modelling (MESM20002), 2002, pp. 183–187.
- [27] E. Burani, G. Cabri, and M. Leoncini, “An algorithm to predict e-bike power consumption based on planned routes,” Electronics, vol. 11, no. 7, p. 1105, Mar. 2022. [Online]. Available: http://dx.doi.org/10.3390/electronics11071105
- [28] M. Liu, J. Naoum-Sawaya, Y. Gu, F. Lecue, and R. Shorten, “A distributed markovian parking assist system,” IEEE Transactions on Intelligent Transportation Systems, vol. 20, no. 6, pp. 2230–2240, 2019.