RobotCycle: Assessing Cycling Safety in Urban Environments
Abstract
This paper introduces RobotCycle, a novel ongoing project that leverages Autonomous Vehicle (AV) research to investigate how cycling infrastructure influences cyclist behaviour and safety during real-world journeys. The project’s requirements were defined in collaboration with key stakeholders (i.e. city planners, cyclists, and policymakers), informing the design of risk and safety metrics and the data collection criteria. We propose a data-driven approach relying on a novel, rich dataset of diverse traffic scenes captured through a custom-designed wearable sensing unit. We extract road-user trajectories and analyse deviations suggesting risk or potentially hazardous interactions in correlation with infrastructural elements in the environment. Driving profiles and trajectory patterns are associated with local road segments, driving conditions, and road-user interactions to predict traffic behaviour and identify critical scenarios. Moreover, leveraging advancements in AV research, the project extracts detailed 3D maps, traffic flow patterns, and trajectory models to provide an in-depth assessment and analysis of the behaviour of all traffic agents. This data can then inform the design of cyclist-friendly road infrastructure, improving road safety and cyclability, as it provides valuable insights for enhancing cyclist protection and promoting sustainable urban mobility.
Index Terms:
Safety, Bicycle, Dataset, Benchmark, Urban InfrastructureI Introduction
With 15,693 cyclist casualties in UK road accidents in 2022111Reported road casualties Great Britain, annual report 2022, available at http://tinyurl.com/5n8zva74 (including fatalities and injuries) and 243 casualties in Oxfordshire alone in 2021222Oxfordshire County Council (OCC) report 2021 on Road Traffic Collisions, available at http://tinyurl.com/43ff89nc, cyclists remain among the most Vulnerable Road User (VRU), exposed to risks from the inherent design of roads, unpredictable behaviour of other users, and inadequate safety measures.
Our ongoing RobotCycle project aims to tackle this challenge by identifying how specific road features, i.e. road layout and traffic filters, as well as the behaviour of other road users can impact the safety of cyclists in urban cities. Incident reports and accident statistics lack crucial contextual information surrounding critical events since they mainly rely on post-event reporting and stationary sensing. These methods provide limited contextual information from a restricted set of sensors configured in fixed locations and viewpoints.
RobotCycle complements these approaches by gathering detailed information about traffic, road infrastructure, and behavioural patterns from the perspective of the VRUs, analysing all the factors contributing to cyclist vulnerability. We equip cyclists with a mobile sensing unit incorporating state-of-the-art technologies commonly found in Autonomous Vehicles (AVs) and further combine these rich ego-centric data with High-Definition Maps (HD Maps), trajectory tracking, and cyclist feedback to microscopically investigate the causes of safety-critical incidents and determine how road infrastructure and users’ behaviour impact cyclists’ safety during complex social interactions on urban roads. We aim to inform the development of more effective interventions to protect cyclists and enhance their safety on our roads by identifying complex and previously unidentified safety issues and risky behavioural patterns, increasing and complementing our understanding of social interactions in situated road contexts.
II Structure and Objectives
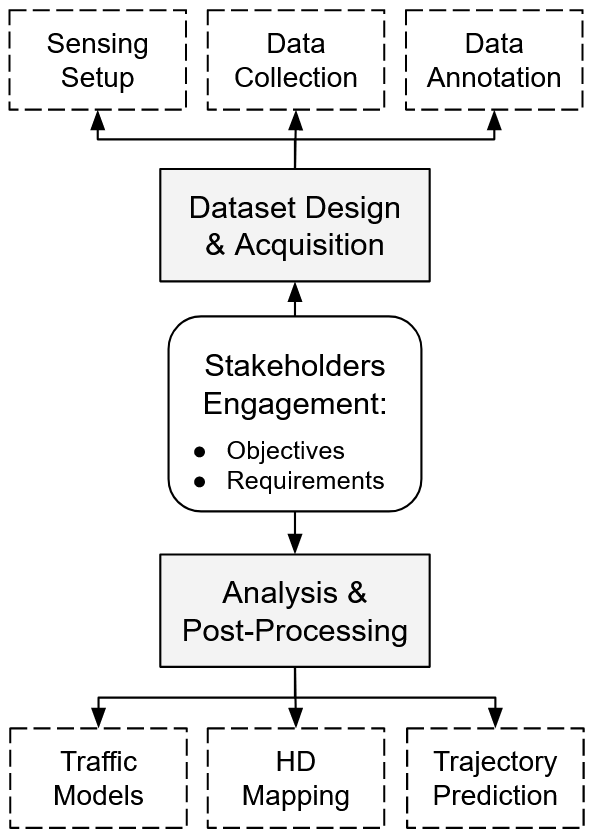
The prime scope of the RobotCycle project is to investigate how cycling infrastructure influences cyclist behaviour and safety during real-world journeys to inform the design of cyclist-friendly road infrastructure and improve road safety and cyclability. To achieve this, we have organised the project into three primary work packages: (WP1) Stakeholder Engagement, (WP2) Dataset Acquisition, and (WP3) Data Analysis. WP1’s deliverables include defining project requirements and objectives, which subsequently guide the design and development of WP2 and WP3. Within WP2, we focus on the sensing setup, data collection requirements, and annotation. Lastly, in WP3, we focus on analysing the collected dataset, developing HD Maps as well as traffic and predictive models. The WPs are visually represented, with their deliverables, in fig. 1.
Through our engagement with the key stakeholders, especially policymakers and cyclist associations, we formed the following three objectives:
- \crtcrossreflabelO1[objective.backpack].
-
Design a novel, wearable sensing unit to collect rich 360-degree sensor data from a cyclist’s ego perspective, capturing complex interactions with the environment and other road users;
- \crtcrossreflabelO2[objective.dataset].
-
Develop a novel, annotated dataset for analysing the factors contributing to road safety, focusing on road infrastructure and interactions with other road users.
- \crtcrossreflabelO3[objective.benchmark].
-
Propose a benchmark for assessing road safety for cyclists in urban environments through safety and cyclability indexes, identifying areas of high risk;
In the following, we will discuss each objective further and describe our approach to tackling and achieving each.
III Background and Related Work
Cyclist Journey Analysis. Recent studies investigate cycling safety and road users’ interactions through modelling driving and riding behaviours from various data sources. Most projects rely on visual and inertial sensors mounted directly on the bike and/or cyclists to capture the environment and model their riding behaviour [1, 2, 3, 4]. On the bike-mounted studies, [1] conducts a social and kinematic analysis to evaluate the safety and comfort of cyclists in challenging environmental conditions while [2] assesses the highway design and how it affects the cyclists capturing their social characteristics. [5] relies on IoT cycling gear for personalised cyclist training and safety assessment while [3] captures stress and health data from the cyclists and correlates them with image data, focusing on specific events. [4] proposes a method for detecting near misses from video captured from various positions, either on the bicycle or on the cyclist’s helmet.
Backpack design. RobotCycle extends upon these works. Similar to [6, 7, 8, 9, 10, 11, 12], we employ wearable multi-modal sensing to capture all traffic interactions and model road infrastructure. We opted for a custom multi-sensing backpack equipped with LiDAR, camera, and inertial sensors achieving a complete 360-degree FOV and near-field multi-modal detection around the cyclist, capturing geometry and appearance, which is critical for a complete dataset. This setup allows us to map the environment, capture close-range interactions, and analyse the trajectories of each participating actor in the scene.
Behaviour, Risk, and Safety Modelling. Various studies focus on modelling traffic interactions and risk, while others propose alternative infrastructure to design safer road networks. For instance, [13] employs behaviour modelling to predict collisions and suggest avoidance maneuvers. Meanwhile, [14] develops a bike safety model relying on accident reports and maps to unveil behavioural patterns. In a different approach, [15] leverages risk and discomfort estimation models to generate personalised route recommendations correlating accident and traffic data with street network topology. Additionally, [16] uses simulation to propose improved road infrastructure while [17] leverages adversarial networks to redesign urban cities. In contrast, RobotCycle adopts a completely data-driven approach. We collect a rich dataset capturing diverse roads, weather, and infrastructure details. Leveraging methods from AV research, we generate traffic, behavioural, and risk models, which, in correlation with detailed HD Maps, contribute to a holistic understanding of road users’ interactions enabling the identification of incident hotspots.




IV Wearable Sensor Unit Design
Our objective LABEL:objective.backpack is to develop a comprehensive data-collection sensing unit incorporating state-of-the-art range and image sensors with inertial navigation systems to collect a robust dataset capturing short- and long-range infrastructure details and dynamic driving interactions in each traffic scene. This holistic approach ensures that the resulting dataset can be used to analyse and understand the intricacies of various driving scenarios.
We can summarise the requirements for the proposed sensorised platform with the following:
- \crtcrossreflabelR1.1[req.backpack.weight].
-
Develop a portable, robust, and weather-invariant lightweight sensing unit to be used by different VRUs;
- \crtcrossreflabelR1.2[req.backpack.sensors].
-
Achieve a combined multi-modal 360-degree FOV sensing coverage, capturing also inertial and positional measurements;
- \crtcrossreflabelR1.3[req.backpack.battery].
-
Record 4-hours of continuous cycling data;
- \crtcrossreflabelR1.4[req.backpack.stealth].
-
Aim for inconspicuous design.
Importantly, these requirements are derived from and interlinked among the objectives. Indeed, LABEL:req.backpack.sensors is related to LABEL:objective.dataset’s LABEL:req.data.diversity and LABEL:objective.benchmark’s analysis, and LABEL:req.backpack.weight and LABEL:req.backpack.battery to LABEL:objective.dataset’s LABEL:req.data.battery.
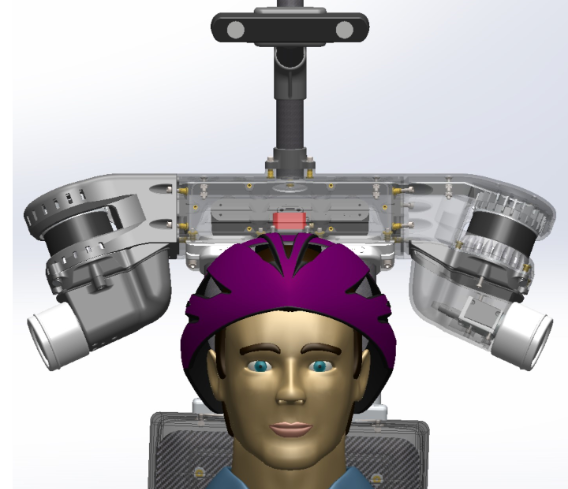
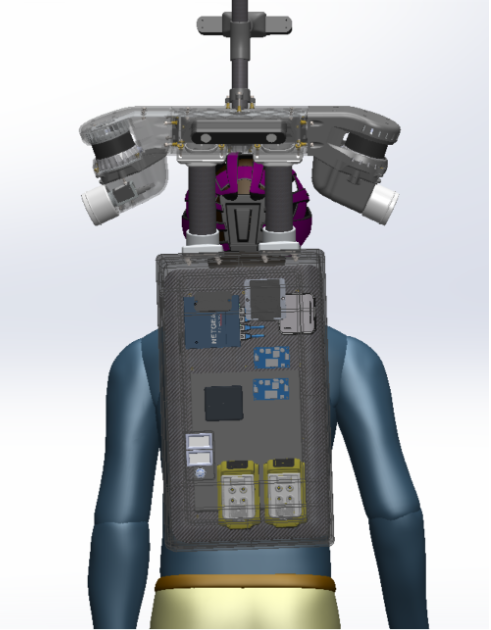
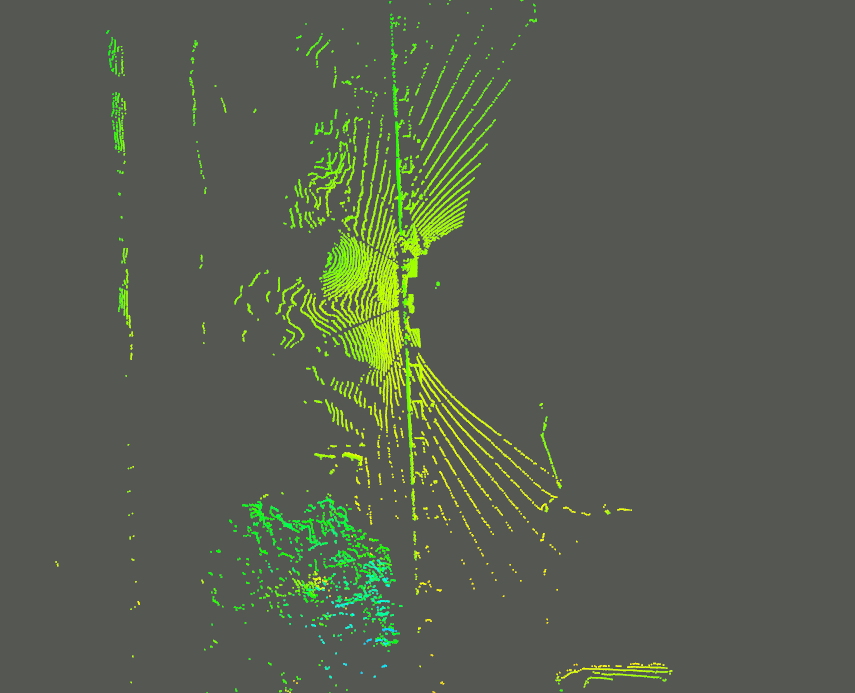
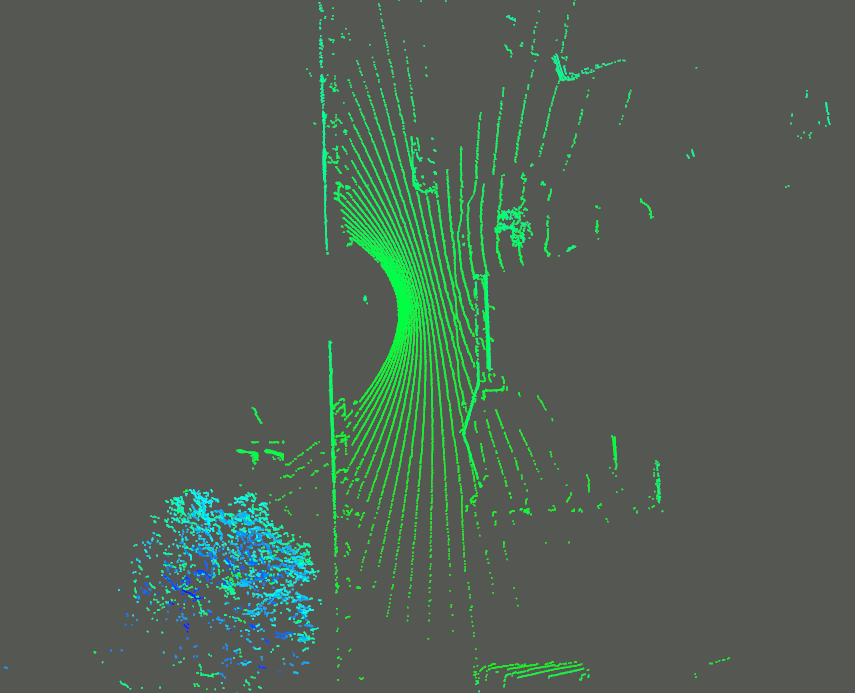
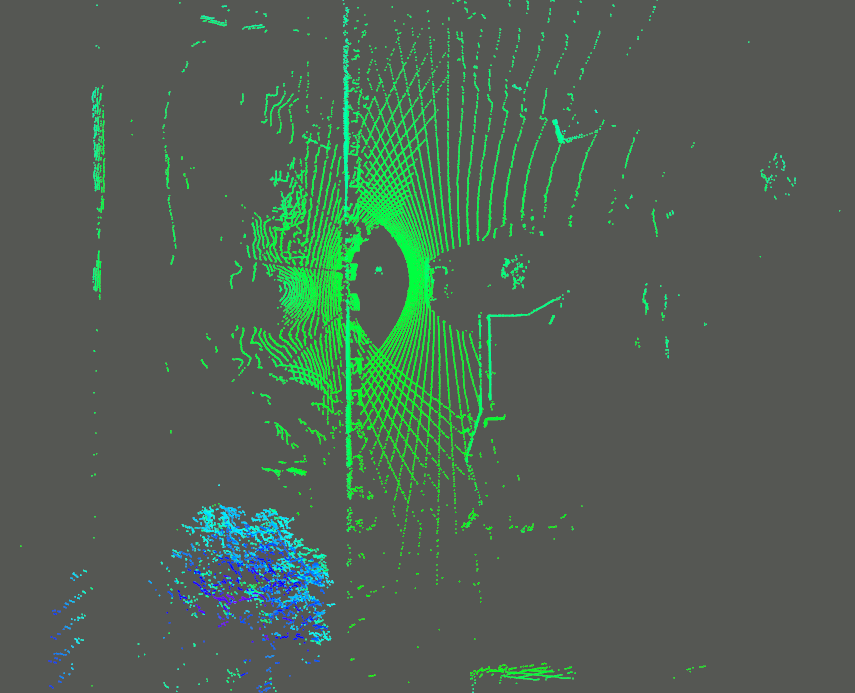
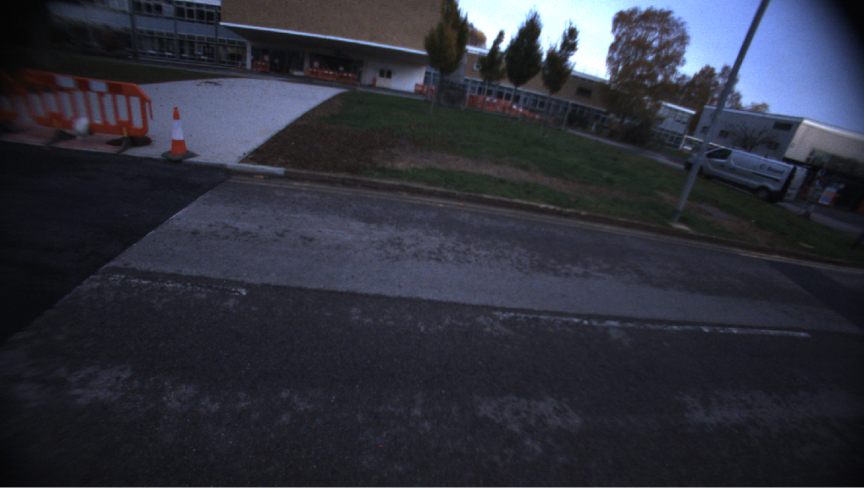
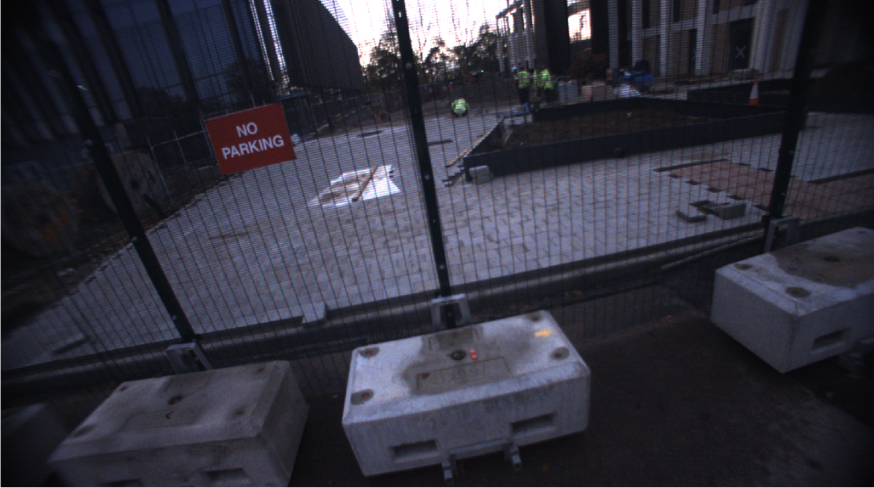
To satisfy these design requirements, we opted for a sensorised backpack. This wearable solution enhances deployment flexibility as it does not depend on external or fixed infrastructure, i.e. the bicycle frame, and can be easily worn by different VRUs at the cost of increased load on the user, trading off LABEL:req.backpack.weight and LABEL:req.data.battery. In addition, this solution does not limit our sensor selection and mounting options while simplifying the overall wiring setup. The sensors equipped can be seen in table I, sample data are visualised in fig. 3, and the final design is depicted in fig. 2; it should be noted that we prioritised LABEL:req.backpack.sensors over LABEL:req.backpack.stealth to satisfy the data analysis procedures. The backpack also fits an on-board computer, a hardware synchronisation system, and various storage devices, designed to meet the 4-hour runtime requirement (LABEL:req.backpack.battery) while allowing the use of COTS battery packs for ease of replacement in the field.
| Sensor | Qty | Model | Description |
|---|---|---|---|
| Lidar | 2 | OS1-32 | 360x45° (HxV) FOV, integrated IMU |
| Stereo | 2 | ZED2i | Long-range camera, intergrated IMU |
| Camera | 2 | Blackfly | Colour monocular, lenses 4.8mm |
| INS | 1 | Ellipse-N | RTK GNSS |
We optimised the mounting configurations and sensor specifications to achieve an unobstructed 360-degree FOV coverage around the ego-cyclist after various design iterations relying on custom articulated joints, allowing us to experiment with different positions and orientations for each sensor.
V Data Collection
Our goal LABEL:objective.dataset is to record a comprehensive and detailed dataset encompassing all traffic interactions and infrastructural details across diverse environmental and traffic conditions. To achieve this, we have identified and prioritised areas of interest while remaining compliant with existing data and traffic regulations. In particular, our data-collection strategy was formulated based on the following requirements:
- \crtcrossreflabelR2.1[req.data.dppr].
-
Ensure compliance with Data Protection and Privacy Regulations;
- \crtcrossreflabelR2.2[req.data.road_safety].
-
Ensure compliance with Road Safety Regulations;
- \crtcrossreflabelR2.3[req.data.diversity].
-
Capture diverse types of road layouts and different traffic volumes, road signs, cycling styles as well as various illumination, weather, and road-surface conditions;
- \crtcrossreflabelR2.4[req.data.battery].
-
The trial length is depended on the risk assessment and must be agreed upon with the cyclists;
- \crtcrossreflabelR2.5[req.data.bidirection].
-
Collect data bidirectionally in high- and low-peak traffic hours in specific semantically rich and diverse loops.
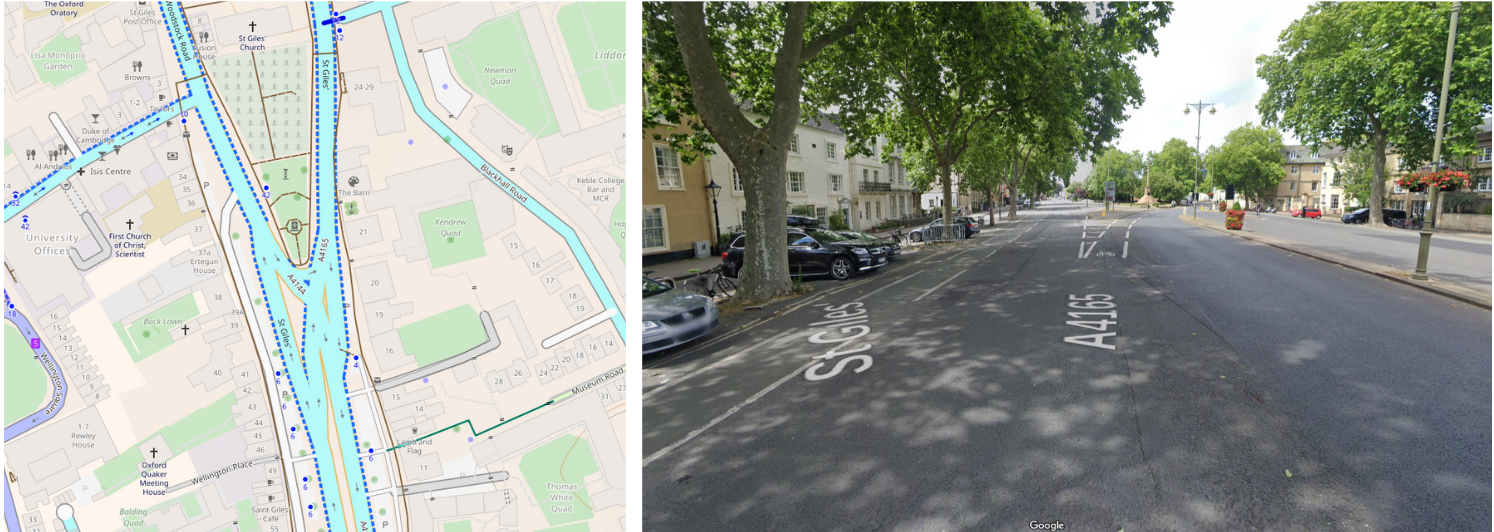
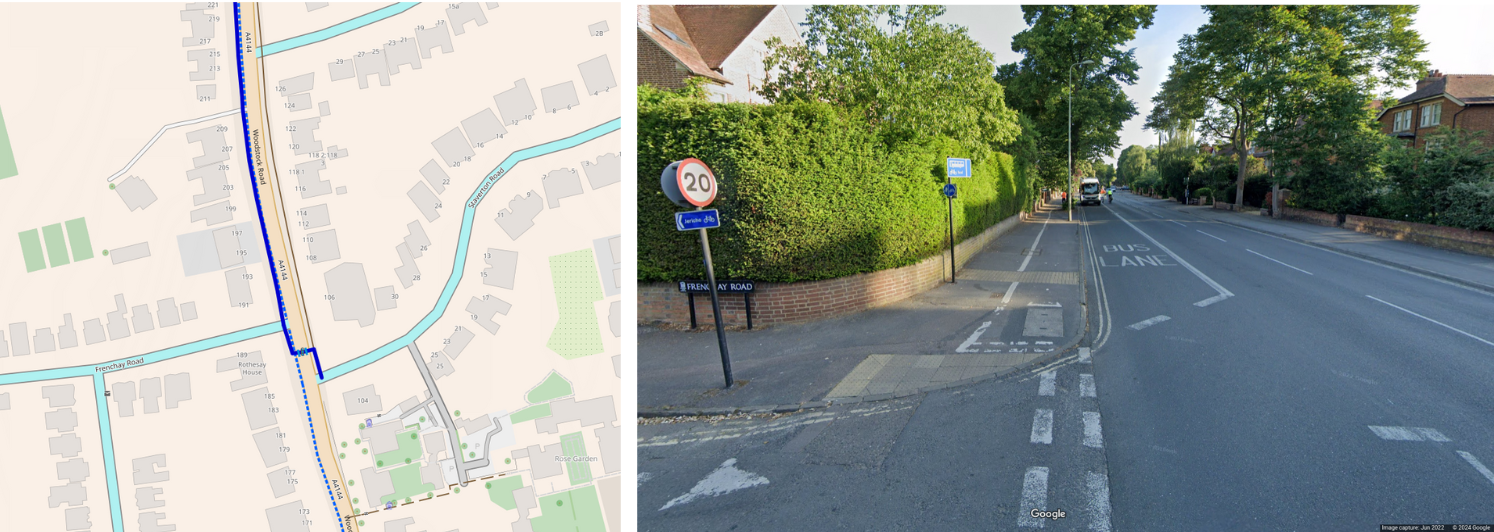
Oxford is known for its extensive infrastructure and road network diversity, which led to the collection of two extensively used AV datasets [18, 19]. Yet, to ensure coverage of varying traffic volumes and various types of cycling infrastructure – including roads without cycle paths, roads with shared cycle paths, and roads with exclusive cycle paths – we conducted an extensive analysis of the city’s road network. Indeed, we first qualitatively classified Oxford’s road network according to traffic, location, and functionality, also leveraging data from detailed Cycling Network Maps333http://www.transportparadise.co.uk/cyclemap/, and then further prioritised different road segments according to the diversity of road layout, infrastructure features, and prevailing traffic conditions. Results of this analysis can be found in footnote 5, leading to an estimated 15 bidirectional runs on each route, encompassing different times of the day and weather conditions (LABEL:req.backpack.weight). The specifics of executing a single trial are contingent upon agreement with each cyclist, considering the weight of the total sensor package (LABEL:req.data.bidirection) and the cyclists’ durability (LABEL:req.data.battery).
VI Data Analysis
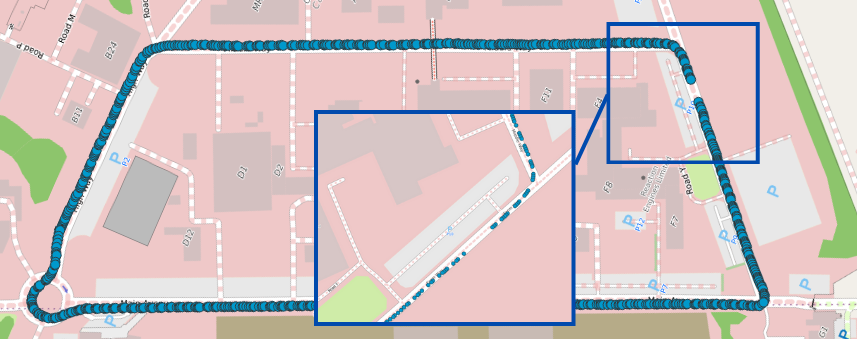
To the best of our knowledge, this is the first project capturing data from the cyclists’ perspective using a multi-sensing backpack. Our sensing platform described in section IV provides a 360-degree FOV, offering a comprehensive perspective of the cyclist’s surroundings, capturing dynamic and static elements in the routes of diverse traffic volumes and infrastructure designed in section V. This section describes the analysis we will perform on these data to assess, predict, and monitor the cyclists’ safety on the road, as indicated in our objective LABEL:objective.benchmark. To this end, we are focusing on building HD Maps, data annotation, and traffic models, which will be used in conjunction to calculate a safety score that will holistically comprehend risks associated with traffic events, allowing us to address safety concerns effectively and develop strategies to mitigate them. In this analysis, HD Maps are central as they are a fine-grained representation of the environment, which we can augment with semantic and road quality information (smoothness, potholes, etc.) – retrieved from IMU data – and dynamic agents locations. By correlating those with traffic and trajectory models we can assess the safety of the road network. Preliminary results are shown here on a test dataset we recorded with the proposed sensing platform at the Culham Science Center in Abingdon (UK) – here culham – and the uniD dataset [21].
VI-A HD Maps
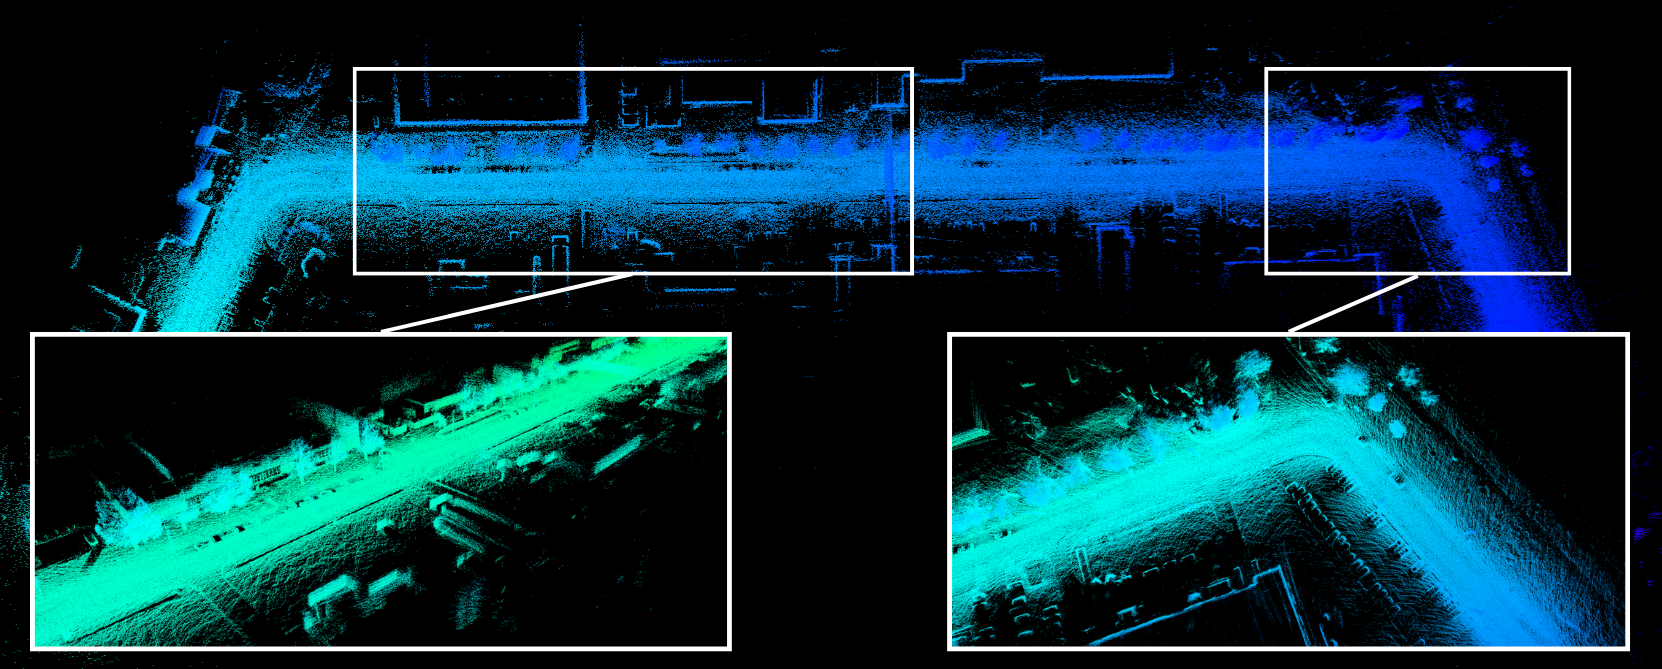
HD Maps are invaluable for providing detailed contextual information about the environment, including precise lane locations, road boundaries, curbs, and landmarks. In addition, they capture local and global morphology, such as surface and geometry, detailing static infrastructure. This level of accuracy offers insights into complex intersections and infrastructure, aiding in localising all road agents and allowing us to correlate their behaviours to traffic flows and interactions. A preliminary example of an HD Map applied to culham is depicted in fig. 5.
VI-B Data Annotation
To analyse the data and extract trajectory and behavioural patterns, we need to detect and track semantics of interest in the dataset. We will annotate all dynamic agents and road-layout-specific classes in the dataset, extending existing class definitions – e.g. the extensively-used CityScapes’ [22] – including infrastructural elements critical to a thorough description of the scene. Table II summarises our semantic class definition of interest, and fig. 6 shows labelled images in our culham dataset.
| Category | Subcategories |
|---|---|
| ground | road, pavement, cycle-lane, bus-lane, parking-spot, bus-stop, lane-marking, roundabout, crossing, traffic-island, other |
| structure | building, fence, wall, barrier, stop-shelter, road-works, overhead-bridge, other |
| nature | vegetation, trunk |
| object | pushchair, sign, fence, pole, traffic-cone, traffic-light, wheelchair, other |
| vehicle | car, truck, bicycle, motorcycle, e-scooter, mobility-scooter, van, bus, on-rails, other |
| animate-agent | animal, pedestrian, rider, other |


VI-C Traffic and Trajectory Models
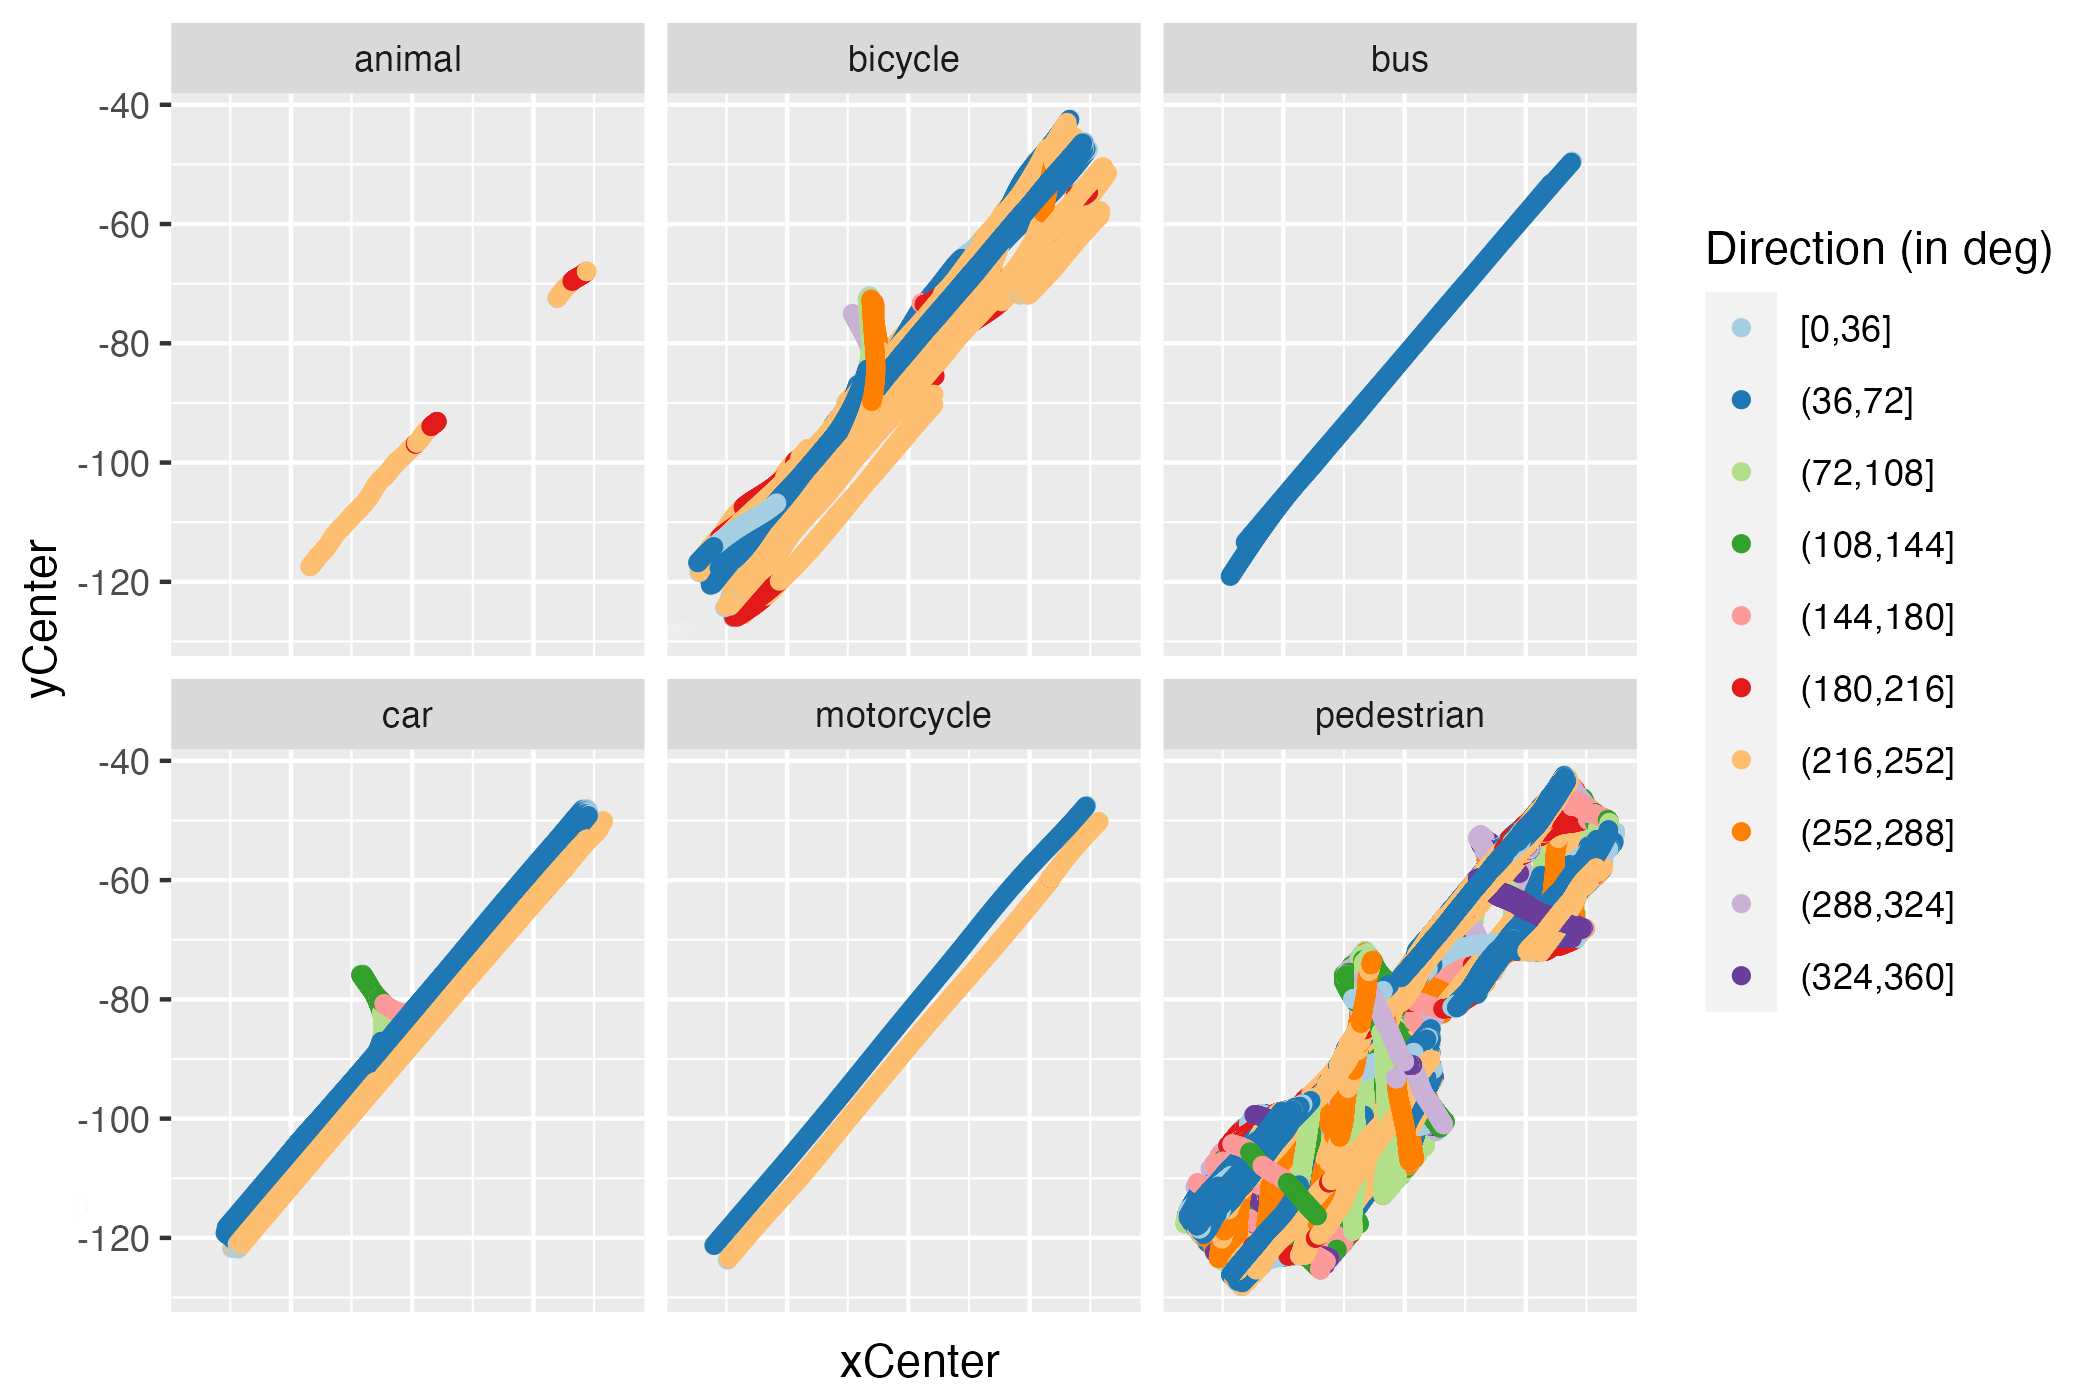
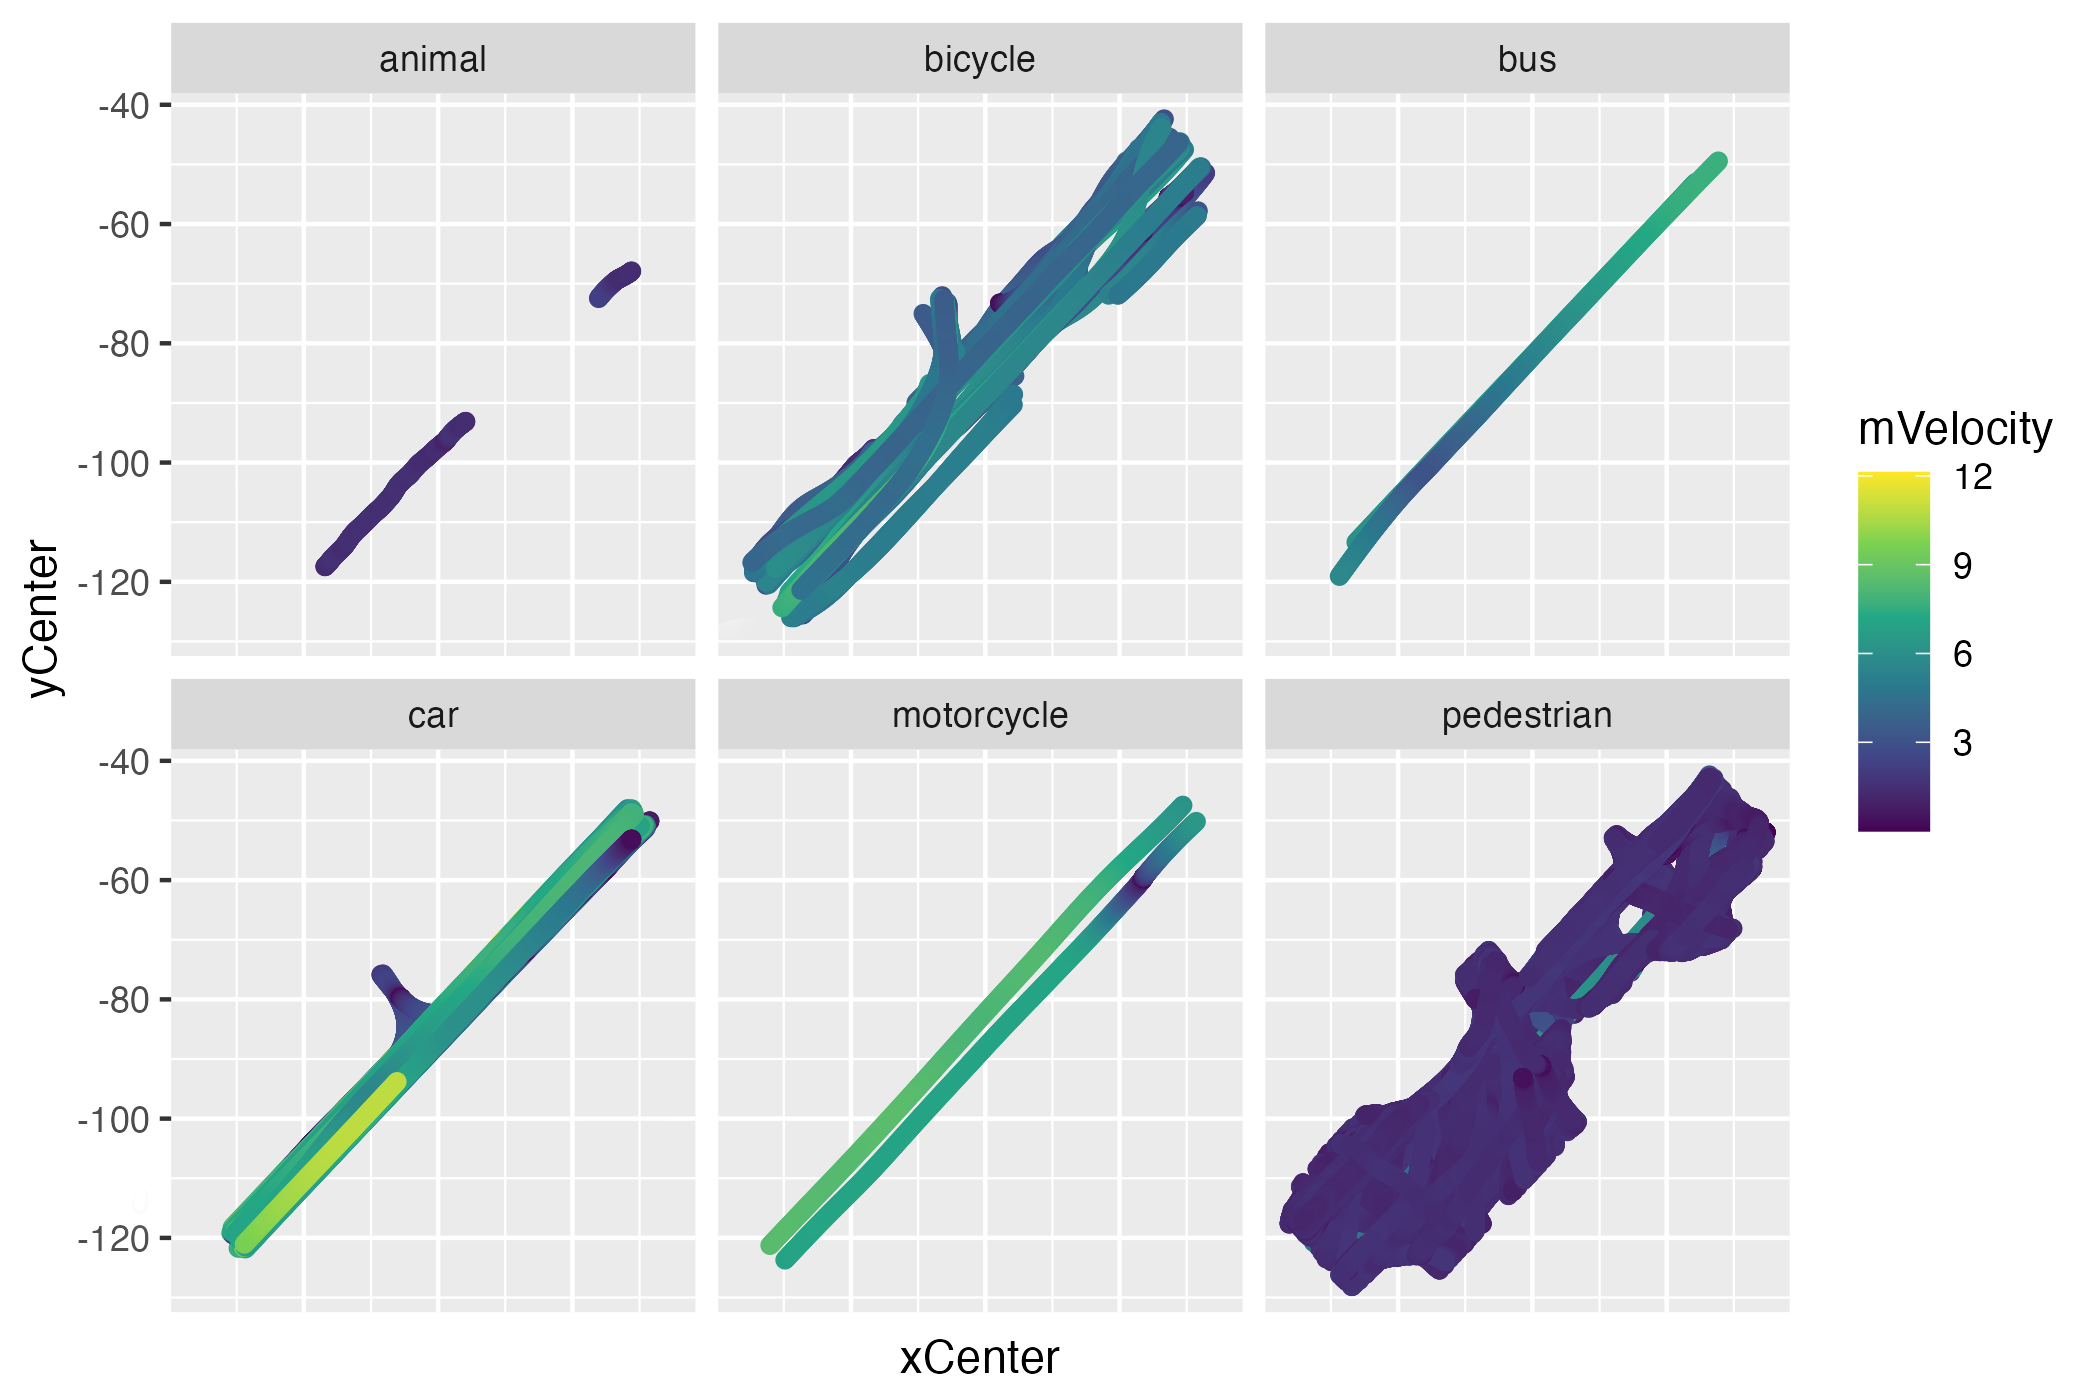
Since this dataset will be taken from the perspective of a VRU instead of a vehicle, it will contain many VRU-to-VRU and VRU-to-vehicle interactions. These interactions have a higher degree of variability than interactions between vehicles, as VRUs do not necessarily follow allocated lanes, traffic lights, and road rules. Cyclists especially operate at high speeds, posing a danger to other types of road users, making predicting cyclist trajectories crucial for safety assessment.
We have begun developing these processes by leveraging the uniD dataset [21]. Figure 7 shows results for road agents’ tracked directions and velocity, divided by kind. As aforementioned, it is visible how VRUs tend to occupy more of the road surface and with more varied behaviours.
VII Future Work and Open Issues
As the outlined work packages have provided encouraging preliminary results, further refinement and analysis is imperative for the project’s success. We aim to conduct a data-driven safety analysis leveraging AV research’s behavioural modelling and trajectory prediction methods. In addition, an in-depth causality analysis is required to identify each captured event’s intricate causes and effects. Our data collection is limited to private and constrained environments, capturing very few driving interactions; in the final iteration of our project, we will collect the Oxford dataset described in this paper, which we commit to making publicly available. Using this novel dataset, we aim to develop a generalisable approach to assessing safety, which, based on infrastructure, traffic volumes, and historical data, can generate insights into potentially unsafe situations, even on roads not traversed within the dataset.
VIII Conclusion
This paper presents our RobotCycle project, aiming to leverage AV research and technologies to assess cycling infrastructure safety through data-driven approaches. Here, we have described the development process to build a wearable data collection device, the design of the data collection process, and the data analysis rationale. Our primary focus has been on building and testing the sensing backpack to ensure that it satisfies all design requirements so that we can achieve the project’s objectives. Initial results demonstrate the device’s ability to capture diverse and rich datasets, which are then used to extract semantic elements, HD Map, and traffic patterns. The RobotCycle project is an innovative undertaking with a mission to enhance the safety and sustainability of urban cities. We aim to generate valuable insights into the ongoing discourse on urban development, setting a benchmark for further advancements in the field.
References
- [1] M. M. Shoman, H. Imine, E. M. Acerra, and C. Lantieri, “Evaluation of Cycling Safety and Comfort in Bad Weather and Surface Conditions Using an Instrumented Bicycle,” IEEE Access, vol. 11, no. January, pp. 15 096–15 108, 2023.
- [2] I. Kaparias, S. Miah, S. Clegg, Y. Gao, B. Waterson, and E. Milonidis, “Measuring the effect of highway design features on cyclist behavior using an instrumented bicycle,” 2021 7th International Conference on Models and Technologies for Intelligent Transportation Systems, MT-ITS 2021, pp. 1–6, 2021.
- [3] P. Vieira, J. P. Costeira, S. Brandao, and M. Marques, “SMARTcycling: Assessing cyclists’ driving experience,” IEEE Intelligent Vehicles Symposium, Proceedings, vol. 2016-August, no. Iv, pp. 1321–1326, 2016.
- [4] M. R. Ibrahim, J. Haworth, N. Christie, and T. Cheng, “CyclingNet: Detecting cycling near misses from video streams in complex urban scenes with deep learning,” IET Intelligent Transport Systems, vol. 15, no. 10, pp. 1331–1344, 2021.
- [5] S. M. Kumar, “Smart Biking : IoT-Connected Cycling Gear for Training and Safety,” 2023 Second International Conference On Smart Technologies For Smart Nation (SmartTechCon), pp. 652–656, 2023.
- [6] C. Wen, S. Pan, C. Wang, and J. Li, “An Indoor Backpack System for 2-D and 3-D Mapping of Building Interiors,” IEEE Geoscience and Remote Sensing Letters, vol. 13, no. 7, pp. 992–996, 2016.
- [7] Z. Gong, J. Li, Z. Luo, C. Wen, C. Wang, and J. Zelek, “Mapping and Semantic Modeling of Underground Parking Lots Using a Backpack LiDAR System,” IEEE Transactions on Intelligent Transportation Systems, vol. 22, no. 2, pp. 734–746, 2021.
- [8] P. Chen, W. Shi, S. Bao, M. Wang, W. Fan, and H. Xiang, “Low-Drift Odometry, Mapping and Ground Segmentation Using a Backpack LiDAR System,” IEEE Robotics and Automation Letters, vol. 6, no. 4, pp. 7285–7292, 2021.
- [9] A. Nüchter, D. Borrmann, P. Koch, M. Kühn, and S. May, “A Man-Portable, Imu-Free Mobile Mapping System,” ISPRS Annals of the Photogrammetry, Remote Sensing and Spatial Information Sciences, vol. 2, no. 3W5, pp. 17–23, 2015.
- [10] S. Lagüela, I. Dorado, M. Gesto, P. Arias, D. González-Aguilera, and H. Lorenzo, “Behavior analysis of novel wearable indoor mapping system based on 3d-slam,” Sensors (Switzerland), vol. 18, no. 3, pp. 1–16, 2018.
- [11] N. Corso and A. Zakhor, “Indoor localization algorithms for an ambulatory human operated 3D mobile mapping system,” Remote Sensing, vol. 5, no. 12, pp. 6611–6646, 2013.
- [12] J. Holmgren, H. M. Tulldahl, J. Nordlöf, M. Nyström, K. Olofsson, J. Rydell, and E. Willen, “Estimation of tree position and stem diameter using simultaneous localization and mapping with data from a backpack-mounted laser scanner,” International Archives of the Photogrammetry, Remote Sensing and Spatial Information Sciences - ISPRS Archives, vol. 42, no. 3W3, pp. 59–63, 2017.
- [13] A. Rasch and M. Dozza, “Modeling Drivers’ Strategy When Overtaking Cyclists in the Presence of Oncoming Traffic,” IEEE Transactions on Intelligent Transportation Systems, vol. 23, no. 3, pp. 2180–2189, 2022.
- [14] S. Daraei, K. Pelechrinis, and D. Quercia, “A data-driven approach for assessing biking safety in cities,” EPJ Data Science, vol. 10, no. 1, 2021.
- [15] D. Castells-Graells, C. Salahub, and E. Pournaras, “On cycling risk and discomfort: urban safety mapping and bike route recommendations,” Computing, vol. 102, no. 5, pp. 1259–1274, 2020.
- [16] L. Meuleners, M. Fraser, and P. Roberts, “Improving cycling safety through infrastructure design: A bicycle simulator study,” Transportation Research Interdisciplinary Perspectives, vol. 18, no. June 2022, p. 100768, 2023.
- [17] M. R. Ibrahim, J. Haworth, and N. Christie, “Re-designing cities with conditional adversarial networks,” 2021. [Online]. Available: http://arxiv.org/abs/2104.04013
- [18] W. Maddern, G. Pascoe, C. Linegar, and P. Newman, “1 year, 1000 km: The oxford robotcar dataset,” The International Journal of Robotics Research, vol. 36, no. 1, pp. 3–15, 2017.
- [19] D. Barnes, M. Gadd, P. Murcutt, P. Newman, and I. Posner, “The oxford radar robotcar dataset: A radar extension to the oxford robotcar dataset,” in 2020 IEEE International Conference on Robotics and Automation (ICRA). IEEE, 2020, pp. 6433–6438.
- [20] OpenStreetMap contributors, “Planet dump retrieved from https://planet.osm.org ,” https://www.openstreetmap.org, 2017.
- [21] LevelXData, “The unid dataset: Naturalistic trajectories of vehicles and vulnerable road users recorded at the rwth aachen university campus,” Tech. Rep., 2023. [Online]. Available: https://levelxdata.com/unid-dataset/
- [22] M. Cordts, M. Omran, S. Ramos, T. Rehfeld, M. Enzweiler, R. Benenson, U. Franke, S. Roth, and B. Schiele, “The cityscapes dataset for semantic urban scene understanding,” in Proceedings of the IEEE conference on computer vision and pattern recognition, 2016, pp. 3213–3223.