Resolving Dual Active Galactic Nuclei with 100 pc separation in MCG-03-34-64
Abstract
Galaxy mergers are expected to play a key role in the evolution of galaxies and their central supermassive black holes (SMBHs)[1, 2]. An observational signature of this phenomenon is the detection of dual active galactic nuclei (AGNs) amongst merging systems, as predicted by cosmological models of structure formation[3, 4]. Dual AGNs at sub-kiloparsec-scale separation are the precursors of merging black hole binaries, an important source of gravitational waves[5], but a paucity of such systems have been confirmed to date by direct imaging, while other similar claims have been strongly disputed[6, 7]. Here we report the serendipitous multiwavelength discovery of a dual black hole system with a separation of 100 pc, in the gas-rich luminous infrared galaxy MCG-03-34-64 (). Chandra/ACIS imaging shows two spatially-resolved peaks of equal intensity in the neutral Fe K emission line, consistent with a dual SMBH, which is supported by Hubble Space Telescope (HST), and Very Large Array (VLA) observations. The separation of 100 pc is the closest dual AGN separation reported to date with spatially-resolved, multiwavelength observations.
Introduction
MCG-03-34-64, also known as IRAS 13197-1627, is a nearby luminous infrared galaxy (z=0.01654), and identified as one of the hardest X-ray sources in the local Universe[8]. Earlier X-ray observations with ASCA, XMM-Newton, and BeppoSAX [9, 10] unveiled an extremely hard and complex source spectrum, believed to arise from heavy absorption from a multi-layered and clumpy medium. This galaxy exhibits extended radio (300 pc) and mid-infrared (700 pc) emissions, roughly aligned with the major axis of the host galaxy [11, 12]. Optical emission lines in the spectra classify MCG-03-34-64 as a Seyfert type 1.8-2 AGN[13]. However, this source displays unusual emission line properties, with H6563, [O I]6300, [N II]6583, and [S II]6717,6731 lines that are exceptionally broad for Seyfert 2 AGNs [13, 14], with full widths at half-maximums (FWHM) 480-860 km s-1. These lines also appear asymmetric in the optical spectrum, showing excess flux on the blueward side of their profiles. UV emission lines are similarly broad, with C IV displaying line widths comparable to those measured in Seyfert 1 galaxies[15]. A broad component to H was detected in polarized light [16], suggesting a picture where emission coincident with the optical broad-line region (BLR) is seen both through gaps in the patchy absorber and through scattered light.
In this work, we present a multi-wavelength analysis of the circumnuclear region of MCG-03-34-64. Chandra/ACIS-S X-ray imaging-spectroscopy reveals two spatially-resolved emission peaks of equal intensity in the neutral Fe K line (6.3-6.5 keV), consistent with the existence of a dual SMBH system separated by 9929 pc, and hosted by a Seyfert galaxy in the local Universe (78 Mpc, 340 pc/′′). These findings are supported by HST/ACS optical imaging, and VLA in A configuration radio imaging. Throughout this paper, we adopt a flat CDM cosmology with , = 0.28 and = 0.72.
Results
HST/ACS imaging
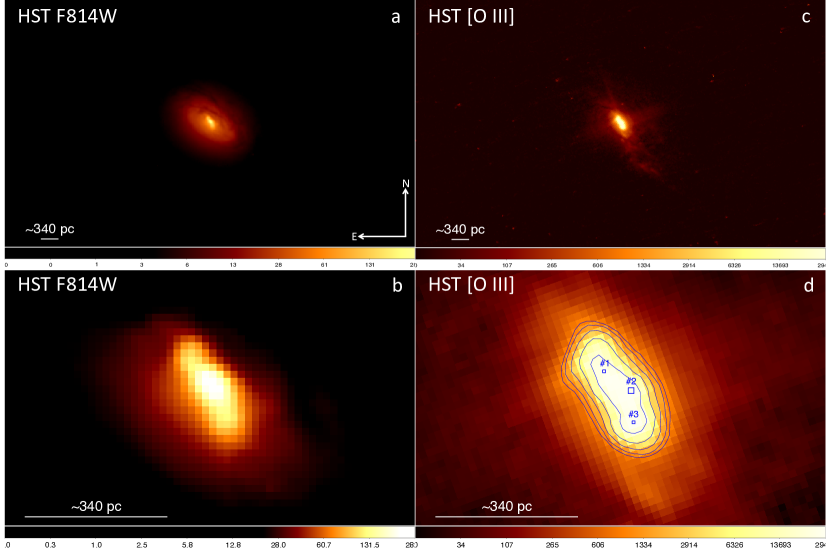
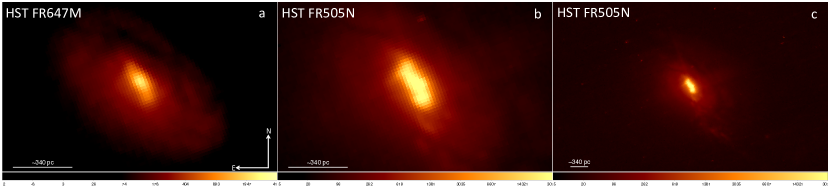
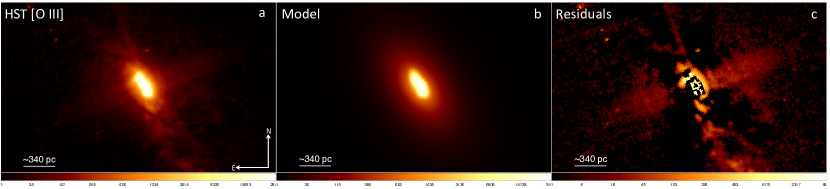
Analysis of HST/ACS optical imaging for this galaxy reveals the presence of three distinct optical emission peaks, observed in both the continuum (F814W) and [O III] narrow-band images (Fig. 1). Furthermore, [O III] narrow-band and continuum-subtracted images depict the presence of diffraction spikes (Fig. 1 and Supplementary Information), a phenomenon rarely observed in AGNs in the local Universe [17]. These features indicate the existence of very compact, but extremely bright [O III]-emitting regions, estimated to be 60 pc in size (see Supplementary Information).
Further subtraction of the best host-galaxy model reveals low-surface-brightness [O III] filaments (Supplementary Information), potentially indicative of tidal disruption features, hinting at ongoing mergers. The separation between individual optical emission centroids is measured at 798 pc (northern HST to central HST) and 768 pc (central HST to southern HST) (Table 1). Further details on the analysis and optical GALFIT[18, 19] decomposition are available in the Supplementary Information.
VLA-A imaging
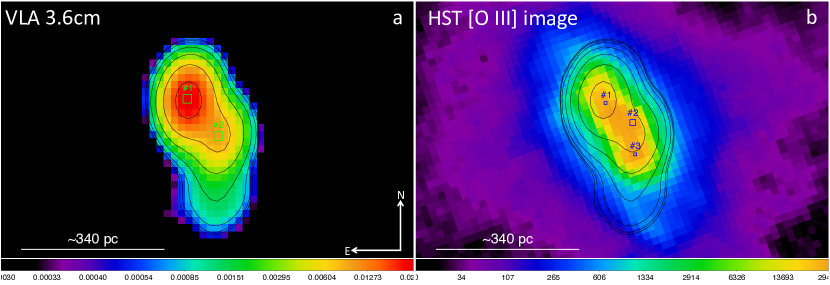
Two compact radio cores were identified as radio sources in the VLA-A configuration 8.46 GHz continuum imaging of this galaxy[11] (Fig. 2a). The position of the northern radio centroid (VLA) appears to be associated with the northern optical centroid (HST) (Fig. 2b, and Supplementary Information). The separation between the two radio emission peaks measures 11614 pc (see Table 1).
The morphology of the 8.46 GHz radio continuum emission extends by 280 pc, initially forming a linear structure to the southwest (P.A.=219) and then bending southward after 100 pc, along P.A.180 [11]. This "Z-shaped" radio morphology on kiloparsec scales suggests a merging system in MCG-03-34-64. In galactic mergers, radio sources are believed to undergo a Z X morphological sequence, where the radio jets associated with the merging galaxies are affected by intergalactic gas introduced by the smaller (or secondary) galaxy, or perturbed ambient gas [20, 21]. When this gas, with its angular momentum misaligned to the original jet direction, interacts with the larger (or primary) galaxy, pressure forces from the rotating gas can push the jets apart, resulting in a "Z-shaped" radio morphology, as observed in MCG-03-34-64.
Chandra/ACIS-S imaging
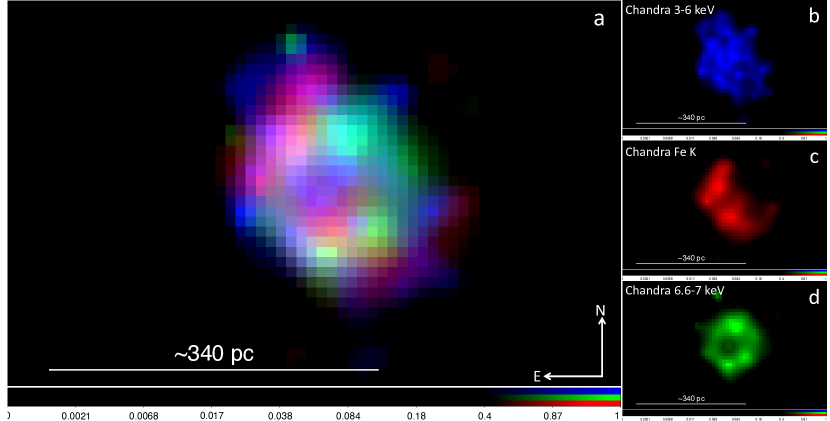
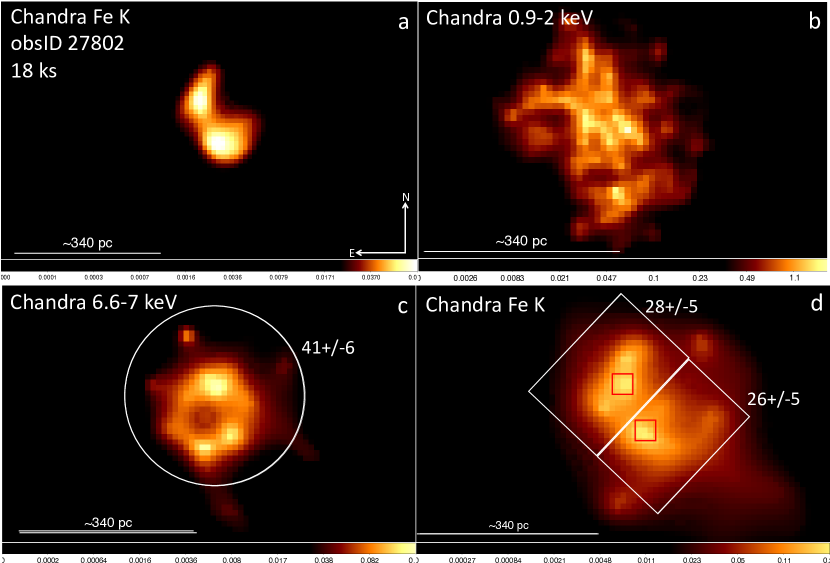
The Chandra/ACIS-S merged imaging, with a total of 50ks exposure, unveils a variety of energy-dependent structures, as illustrated in Figs. 3 and 4a. In the neutral Fe K (6.3-6.5 keV) image, two spatially-resolved emission centroids are detected, separated by 9929 pc (see Table 1). The positions and offsets between the two Chandra/ACIS Fe K centroids are consistent with those observed in the VLA 3.6cm radio continuum image, within uncertainties (Fig. 4a, Table 1, and Supplementary Information). Both the northern (FeK) and southern (FeK) Fe K peaks exhibit nearly equal X-ray luminosities, with 2.20.41040 ergs-1, and 2.00.41040 ergs-1 (Supplementary Information).
Production of neutral Fe K emission requires fluorescence in cold material illuminated by a hard continuum spectrum[22, 23]. The hypothesis of a bright ultraluminous X-ray (ULX) source as one of the Fe K centroids is unlikely, as these off-nuclear X-ray sources typically have luminosities in the range of 1039-1041 erg s-1 across the full 2-10 keV X-ray band111https://heasarc.gsfc.nasa.gov/w3browse/all/ulxrbcat.html. Similarly, the suggestion of a second Fe K peak arising from thermal emission from shocks or extended NLR emission, as observed in NGC 3393[24], is improbable due to the high X-ray luminosity of the individual Fe K peaks. The most luminous and extended Fe K (6.1-6.6 keV) region observed in the Seyfert galaxy NGC 5728 (z=0.00932, D41 Mpc), which is associated with shocks, is approximately 21039erg s-1 (see [25, 26]), one order of magnitude lower than the Fe K luminosity in MCG-03-34-64 within a narrower energy band (6.3-6.5 keV). Therefore, it is unlikely that shocks can generate the high Fe K luminosity observed in each centroid. Instead, these results suggest that both Fe K emission peaks are powered by an active SMBH. In light of the preceding discussion, the separation of 9929 pc is interpreted as the closest separation of a dual AGN system to date, obtained through spatially-resolved multiwavelength observations.
The ionized Fe band (6.6-7 keV) exhibits an integrated ionizing luminosity of =4.40.61040 ergs-1 (Supplementary Information) and displays a ring-like morphology enveloping the two Fe K centroids (Fig. 3). The spatial distribution of the X-ray emission, as shown in the Chandra composite image (Fig. 3a), may arise from the impact of an AGN wind on the interstellar medium (ISM), potentially giving rise to shocked X-ray emission, as discussed in detail below.
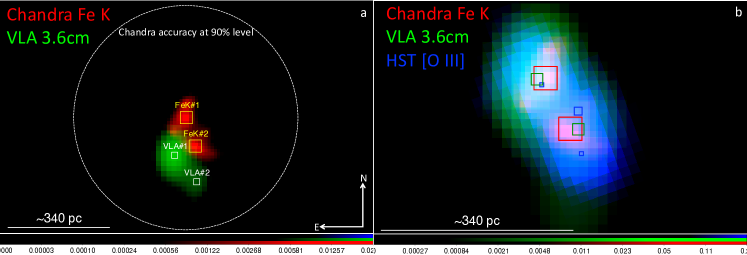
In Table 1, we present the separations between the multi-wavelength emission centroids revealed by this study, observed in the optical by HST/ACS, radio by VLA-A, and X-rays by Chandra/ACIS. The position and separation of the two VLA-A 3.6cm radio centroids are consistent with those of the Chandra/ACIS neutral Fe K within uncertainties (Fig. 4a, Table 1).
| Components | Distance (′′) | Distance (pc) | Distance Range (pc) |
| HST1HST2 | 0.2330.02 | 798 | 71 - 87 |
| HST2HST3 | 0.2230.02 | 768 | 68 - 84 |
| HST1HST3 | 0.4130.01 | 1405 | 135 - 145 |
| VLA1VLA2 | 0.3380.04 | 11614 | 102-130 |
| FeK1FeK2 | 0.2920.08 | 9929 | 70 - 128 |
| HST2FeK2 | 0.1000.06 | 3421 | 13 - 55 |
| HST3FeK2 | 0.1440.06 | 4921 | 28 - 70 |
X-ray spectroscopy
Fig. 4 shows the X-ray spectra of MCG-03-34-64, as observed by Suzaku (Fig. 4b), Chandra (Fig. 4c), and XMM-Newton (Fig. 4d) in different epochs from 2009 to 2023 (Supplementary Information). These spectra exhibit a 3–6 keV hard X-ray power-law continuum and a prominent and broad neutral Fe K emission line at 6.4 keV. The data are juxtaposed against a baseline model comprising a power-law with a photon index of , absorbed by a neutral gas with a column density cm-2. In the 2023 Chandra/ACIS-S data (Fig. 4c), the neutral Fe K line exhibits a centroid energy of keV and an equivalent width of eV. The spectral profile remains consistent across the earlier Suzaku and XMM-Newton epochs.
The absorption feature observed at 6.8 keV is likely attributable to an Fe XXV absorption line from an ionized outflow [10], and an Fe edge feature is observed at 7.2 keV. Below 3 keV, the soft X-ray spectra are dominated by the photoionized and thermal line emission components from N, O, Ne, and Fe L, as previously described by [10]. The total neutral Fe K luminosity derived from the Chandra/ACIS-S spectrum (encompassing the entire emitting region) is 1040 erg s-1, consistent within uncertainties with the sum of the two neutral Fe K centroid luminosities revealed by the Chandra/ACIS imaging (Supplementary Information). The total, absorption corrected 2-10 keV luminosity from both Fe K emission peaks is L=6.21.11042 erg s-1.

Dual AGN Systems in the Local Universe
Despite numerous claims asserting the existence of dual AGN systems with sub-kpc separation, often based on the analysis of single-waveband datasets, subsequent observations and studies have strongly contested their dual nature. Notable examples include the case of SDSS J1010+1413 (0.2, analyzed using HST/WFC3 data)[27], NGC 3393 (0.01, studied with Chandra/ACIS data)[28], and a triple system in SDSS J150243+1115 (0.39, analyzed with VLBI data)[29], which have been challenged in later works[30, 6, 7]. Recently, a dual AGN system was claimed using multi-wavelength resolved spectroscopy in the nearby galaxy UGC 4211 (=0.03)[31], with a separation of 230 pc. However, unlike MCG-03-34-64, a dual spatially-resolved Fe K emission peak was not observed in UGC 4211. Furthermore, the optical-emitting regions identified in this source are more extended than those observed in MCG-03-34-64. Another example is the nearby radio galaxy 0402+379 (z=0.055), which shows evidence of a dual radio nucleus resolved by Very Long Baseline Interferometry (VLBI) imaging[32, 33]. The separation for the dual system in this source is 10 pc, an order of magnitude smaller than the separation reported in this work for MCG-03-34-64, however, this separation is too small to obtain a confirmation via optical and X-ray imaging.
A well-known case is that of the dual SMBH system in NGC 6240, which shows a separation of 980 parsecs, confirmed through Chandra/ACIS-S observations (total exposure time of 40 ks)[34]. The separation between the active nuclei identified in Fe K (6.0-6.7 keV, in their case) is slightly smaller than the separation between the observed optical nuclei (1.26 kpc [35]), which was interpreted as a consequence of extinction causing a wavelength-dependent shift in the flux centroids of the two AGN[36]. The southern nucleus in NGC 6240 is more prominent and luminous than the northern nucleus[34]. In the case of MCG-03-34-64 presented in this work, the separation between the northern and central optical centroids is 798 pc, while the two radio cores are separated by 11614 pc, and the two Fe K peaks (6.3-6.5 keV, in this work) by 9929 pc (Table 1, and Fig. 4a). The two Fe K centroids exhibit nearly equal fluxes and luminosities in the very narrow Fe K (6.3-6.5 keV) band, as shown in Table 5.
The Southern Optical Centroid: Shocked ISM or Triple AGN System?
The southern optical centroid (HST) is located at a distance of 4921 pc from the southern Fe K centroid (Table 1). This emission may be attributed to shocks resulting from the impact of an AGN wind on the ISM[37], consistent with the ring-like distribution of the ionized Fe emission (Fig. 3a, d) and the soft X-ray morphology (Supplementary Information). This interpretation aligns with the conclusions of [10] for this galaxy, who suggested that the soft X-ray emission is best described as a combination of photoionized and shocked gas.
An alternative possibility is that the southern optical centroid pinpoints the position of a third active SMBH[38, 39, 40, 41], not imaged by Chandra/ACIS and VLA-A. In this scenario, the neutral Fe K emission from the third active nucleus could be suppressed if the AGN is nearly entirely enshrouded by obscuring Compton-thick gas with a total column density N cm-2. However, confirmation or rejection of this scenario is currently not possible given the available data.
Coalescence and Gravitational Waves
The "dual AGN" phase at separations 10 kpc is predicted to last approximately 100 Myr[42], a duration that can vary depending on the activity levels of the active nuclei. Despite being a relatively short stage, observational studies and simulations [43, 44, 45] emphasize its crucial role in the evolutionary history of galaxy mergers, where processes such as SMBH growth and star formation are significantly enhanced. The evolution of binary SMBH systems is believed to be governed by distinct physical processes, contingent upon the radial separation between the pair. Dynamical friction dominates the range from 10 kpc to 100 pc, while stellar hardening takes precedence at shorter separations, around 100 pc to 0.1 pc. As the separation decreases further (approximately 0.1 pc to coalescence), the primary process influencing the orbital evolution of the SMBH pair becomes the emission of Gravitational Waves (GW)[42].
In the case of MCG-03-34-64, the candidate dual active nucleus is currently separated by 9929 pc. This system should be approaching the beginning of its stellar hardening phase, during which the pair’s angular momentum will be transferred to slower-moving stars orbiting in close proximity, consequently reducing its radial separation.
Supplementary Information
The analysis presented in this work relies on multi-wavelength observations acquired through multiple facilities. Table 2 provides a summary of the observations used in our analysis, including instruments, filters, date of observations, obsIDs, and exposure times.
| Observatory | Instrument | Filter/Mode | Date | ObsID | Exp. Time (s) |
| HST | ACS/WFC | FR505N | 2022-06-30 | jequ01020 | 1,500 |
| FR647M | 2022-06-30 | jequ01010 | 200 | ||
| HST | ACS/WFC | F814W | 2019-01-18 | jdrw9z010 | 700 |
| VLA-A | 1995-07-15 | AK394 | 900 | ||
| Chandra | ACIS-S | 2023-04-19 | 25253 | 15,000 | |
| 2023-04-20 | 27802 | 18,000 | |||
| 2023-04-21 | 27803 | 17,000 | |||
| Suzaku | 2009-07-01 | 704022010 | 41,349 | ||
| XMM-Newton | 2016-01-17 | 0763220201 | 104,000 |
HST/ACS: observations, data reduction and analysis
MCG-03-34-64 underwent optical imaging with HST/ACS in January 2019, utilizing the F814W wide-continuum filter (P.I.: Barth, proposal ID: 15444). Subsequent imaging took place in June 2022, employing the FR647M continuum and FR505N narrow-band [O III] filters (P.I.: Turner, proposal ID: 16847). All data were retrieved from the Mikulski Archive for Space Telescopes at the Space Telescope Science Institute, and data reduction adhered to standard HST pipeline procedures.
The HST/ACS [O III] continuum-subtracted image, as shown in Fig. 1 (panels c and d), was obtained using Astropy packages. FR647M and FR505N images were acquired subsequently (Table 2, Fig. 5), thus not requiring realignment. The images were filtered by flux calibration based on the information available in the headers, and the [O III] continuum-subtracted image was interactively produced using the FR647M continuum image to ensure accurate subtraction without introducing over or under-subtraction.
Host Galaxy Morphology Decomposition
We use GALFIT [18, 19] to decompose the optical emission detected in the HST/ACS [O III] continuum-subtracted image. The baseline model adopts three Gaussians (one for each optical emission component) and one Sérsic model (for the extended optical [O III] emission). The Sérsic model is given by:
| (1) |
where is the pixel surface brightness at radial distance , is the pixel surface brightness at the effective radius , and is a parameter related to the Sérsic index . We left all Sérsic parameters free to vary during the fitting process. The best GALFIT fit returns (Table 3).
Gaussian profiles were modeled as follows:
| (2) |
where the size parameter is the FWHM=2.355, instead of . All Gaussian fit parameters were left free to vary during the fitting process.
The complete set of GALFIT best-fit parameters is shown in Table 3. Our results yield one "close-to-round" Gaussian (HST) and two elongated Gaussian components, where the narrower dimension is approximately 2-3 pixels. In Fig. 6, we show the best-fit GALFIT[18, 19] model and results from our analysis.
| Component | R.A. | Dec. | Flux (erg/s/cm2) | FWHMmaj(′′) | b/a | P.A. (deg) |
|---|---|---|---|---|---|---|
| HST1 | 13:22:24.4693 | -16:43:42.379 | 4.810-13 | 0.325 | 0.53 | 24.7 |
| HST2 | 13:22:24.4561 | -16:43:42.515 | 2.210-13 | 0.209 | 0.64 | 30.4 |
| HST3 | 13:22:24.4549 | -16:43:42.737 | 3.210-13 | 0.192 | 0.92 | 57.9 |
| Sérsic | 13:22:24.4625 | -16:43:42.576 | 4.610-13 | 0.539 | 0.60 | 34.5 |
Results obtained from the best-fit GALFIT [18, 19] also yield insights into the properties of the [O III] diffraction spikes observed in the HST/ACS optical narrow-band images (Figs. 1c and 5). The presence of diffraction spikes associated with these regions suggests that their angular sizes are on the order of the HST/ACS resolution element, i.e., 2 pixels, or 0.1′′. To estimate the angular size of each optical emitting region, we assume that the measured FWHM of each optical component (Table 3) is equal to its intrinsic size, and the size of a HST/ACS resolution element added in quadrature. This estimation leads to an angular size of approximately 0.2′′, corresponding to 60 pc, for each optical-emitting region.
VLA-A: observations, data reduction and analysis
MCG-03-34-64 was observed with the VLA in A-configuration at 8.46 GHz in July 1995 (obsID: AK394) for a total exposure time of 900 s. Further information on data reduction and analysis are described in detail in [11]. The extended radio emission in this galaxy has a measured position angle of P.A.RAD= 39, and a linear size of 280 pc [11]. The 3.6cm radio image was decomposed by fitting Gaussians to individual components [11] (Table 4).
| Component | R.A. | Dec | F (mJy) |
|---|---|---|---|
| VLA1 | 13:22:24.471 | -16:43:42.35 | 31.6 |
| VLA2 | 13:22:24.456 | -16:43:42.61 | 15.5 |
Chandra/ACIS-S: observations, data reduction and analysis
MCG-03-34-64 was observed with Chandra/ACIS-S in April 2023 (ObsIDs 25253, 27802, 27803) for a total exposure time of 50.0 ks (P.I.: Turner, Table 2). To process, merge, and analyze the Chandra data, we employed CIAO 4.15222https://cxc.cfa.harvard.edu/ciao/. Individual observations, taken within a 2-day interval in April 2023 (Table 2), were merged to create a deeper dataset suitable for imaging analysis. The longest observation (obsID 27802, 18 ks) served as the astrometric reference. All observations were processed to enable sub-pixel analysis, providing a spatial resolution sampling 1/16 of the native/instrumental 0.5′′ pixel size.
In Fig. 7a, the longest Chandra/ACIS-S individual exposure image is displayed in the Fe K (6.3-6.5 keV) band, confirming that the "dual" Fe K morphology is present regardless of the imaging merging process.
We utilized chandra_repro333https://cxc.cfa.harvard.edu/ciao/ahelp/chandra_repro.html to process individual exposures, ensuring the absence of background flares in each observation. Prior to merging, the individual relative astrometries were enhanced by aligning their 2–7 keV images, and the headers were updated accordingly using wcs_update444https://cxc.cfa.harvard.edu/ciao/ahelp/wcs_update.html. The merged event file was generated using merge_obs555https://cxc.cfa.harvard.edu/ciao/ahelp/merge_obs.html (Figs. 3, 4a, and 7b,c,d), while spectral and instrumental responses were obtained using the CIAO tool specextract666https://cxc.cfa.harvard.edu/ciao/ahelp/specextract.html.
Fig. 7 depicts the soft emission (0.9-2 keV, panel b), ionized Fe (6.6-7 keV, panel c), and Fe K (6.3-6.5 keV, panel d) Chandra merged images. For the ionized Fe and Fe K images (panels c and d), we show the extraction regions used to obtain the number of counts, fluxes, and luminosities listed in Table 5.
| Component | R.A. | Dec | Counts | Flux (erg/cm2/s) | Luminosity (erg/s) |
|---|---|---|---|---|---|
| FeK | 13:22:24.468 | -16:43:42.344 | 285 | 3.40.610-14 | 2.20.41040 |
| FeK | 13:22:24.459 | -16:43:42.606 | 265 | 3.10.610-14 | 2.00.41040 |
| Ionized Fe | 416 | 6.91.010-14 | 4.40.61040 |
Astrometry Registration
To ensure accurate astrometry alignment between HST/ACS, VLA-A, and Chandra/ACIS observations, we employed the CIAO tool wavedetect777https://cxc.cfa.harvard.edu/ciao/ahelp/wavdetect.html on the merged 0.3-8 keV Chandra image. This search aimed to identify sources with a detection significance of . Two serendipitous sources near the edge of the chip array were detected by comparison with the Vizier source catalog. However, due to the faintness of these sources, it was not feasible to use them as counterparts to update Chandra’s astrometry.
The initial mismatch in absolute astrometry between VLA-A radio and Chandra/ACIS X-ray data is illustrated in detail in Fig. 8a. The VLA-A 3.6cm radio image is displayed in green with white centroids, and the Chandra/ACIS-S Fe K image is presented in red with yellow centroids. Initially, the northern Fe K centroid is positioned at R.A.(J2000)=13:22:24.4634, dec.(J2000)=-16:43:41.981, while the southern Fe K centroid is initially located at R.A.(J2000)=13:22:24.4569, dec.(J2000)=-16:43:42.260. The residual offsets between the positions of the two VLA radio centroids and those of the Chandra Fe K counterparts are 0.40′′ and 0.34′′, for the northern and southern centroids, respectively. According to the Chandra absolute astrometry accuracy page888https://cxc.cfa.harvard.edu/cal/ASPECT/celmon/, the overall 90% uncertainty circle of Chandra has a radius of 1.1′′, as shown in Fig. 8a.
Since both neutral Fe K and radio emissions are expected to arise near the nuclear SMBH, we shifted the merged Chandra/ACIS-S image to align the two Fe K emission peaks with those of the radio 3.6cm image, within uncertainties (Fig. 8b). This method, used in similar analyses such as that of the nearby Seyfert galaxy Mrk 78 [46], involved applying a total astrometry correction shift to the Chandra/ACIS data of (x=0.05′′, y=0.36′′). This shift is well within the absolute astrometry accuracy of the telescope. The accuracy of the VLA radio data was confirmed by comparing it with the optical HST continuum and narrow-band images (Fig. 8b).
References
- [1] Springel, V. et al. Simulations of the formation, evolution and clustering of galaxies and quasars. \JournalTitleNature 435, 629–636, DOI: 10.1038/nature03597 (2005).
- [2] Colpi, M. & Dotti, M. Massive binary black holes in the cosmic landscape. \JournalTitleAdvanced Science Letters 4, 181–203 (2011).
- [3] Colpi, M. Massive binary black holes in galactic nuclei and their path to coalescence. \JournalTitleSpace Science Reviews 183, 189–221, DOI: 10.1007/s11214-014-0067-1 (2014).
- [4] Blumenthal, K. A. & Barnes, J. E. Go with the Flow: Understanding inflow mechanisms in galaxy collisions. \JournalTitleMonthly Notices of the Royal Astronomical Society 479, 3952–3965, DOI: 10.1093/mnras/sty1605 (2018). https://academic.oup.com/mnras/article-pdf/479/3/3952/25169966/sty1605.pdf.
- [5] Izquierdo-Villalba, D., Sesana, A., Bonoli, S. & Colpi, M. Massive black hole evolution models confronting the n-Hz amplitude of the stochastic gravitational wave background. \JournalTitleMonthly Notices of the Royal Astronomical Society 509, 3488–3503, DOI: 10.1093/mnras/stab3239 (2021). https://academic.oup.com/mnras/article-pdf/509/3/3488/41360112/stab3239.pdf.
- [6] Koss, M. et al. Broadband observations of the compton-thick nucleus of ngc 3393. \JournalTitleApJ 807, 149 (2015).
- [7] Veres, P. M. et al. European vlbi network observations of the proposed dual agn sdss j101022.95+141300.9. \JournalTitleThe Astrophysical Journal 922, 99, DOI: 10.3847/1538-4357/ac307d (2021).
- [8] Tatum, M. M. et al. The global implications of the hard excess. ii. analysis of the local population of radio-quiet agns. \JournalTitleThe Astrophysical Journal 818, 12, DOI: 10.3847/0004-637X/818/1/12 (2016).
- [9] Dadina, M. & Cappi, M. Complex absorption hides a type ii qso in iras 13197-1627. \JournalTitleA&A 413, 921–927, DOI: 10.1051/0004-6361:20031561 (2004).
- [10] Miniutti, G., Ponti, G., Dadina, M., Cappi, M. & Malaguti, G. IRAS 13197-1627 has them all: Compton-thin absorption, photoionized gas, thermal plasmas and a broad Fe line. \JournalTitleMonthly Notices of the Royal Astronomical Society 375, 227–239, DOI: 10.1111/j.1365-2966.2006.11291.x (2007). https://academic.oup.com/mnras/article-pdf/375/1/227/3093914/mnras0375-0227.pdf.
- [11] Schmitt, H. R., Ulvestad, J. S., Antonucci, R. R. J. & Kinney, A. L. Jet directions in seyfert galaxies: Radio continuum imaging data. \JournalTitleThe Astrophysical Journal Supplement Series 132, 199, DOI: 10.1086/318957 (2001).
- [12] Hönig, S. F. et al. The dusty heart of nearby active galaxies* - i. high-spatial resolution mid-ir spectro-photometry of seyfert galaxies. \JournalTitleA&A 515, A23, DOI: 10.1051/0004-6361/200913742 (2010).
- [13] Osterbrock, D. E. & Robertis, M. M. D. Optical spectra of iras "warm" galaxies. \JournalTitlePublications of the Astronomical Society of the Pacific 97, 1129, DOI: 10.1086/131676 (1985).
- [14] De Robertis, M. M., Hutchings, J. B. & Pitts, R. E. An optical and uv investigation of the iras seyfert galaxy 1319-164. \JournalTitleAJ 95, 1371 (1988).
- [15] Aguero, E. L., Calderon, J. H., Paolantonio, S. & Boedo, E. S. Spectral emission of a sample of iras galaxies. \JournalTitlePublications of the Astronomical Society of the Pacific 106, 978, DOI: 10.1086/133470 (1994).
- [16] Young, S. et al. Polarimetry and modelling of narrow-line active galaxies. \JournalTitleMonthly Notices of the Royal Astronomical Society 281, 1206–1242, DOI: 10.1093/mnras/281.4.1206 (1996). https://academic.oup.com/mnras/article-pdf/281/4/1206/3697001/281-4-1206.pdf.
- [17] Fischer, T. C. et al. Hubble space telescope observations of extended [o iii] 5007 emission in nearby qso2s: New constraints on agn host galaxy interaction. \JournalTitleThe Astrophysical Journal 856, 102 (2018).
- [18] Peng, C. Y., Ho, L. C., Impey, C. D. & Hans-Walter, R. Detailed structural decomposition of galaxy images. \JournalTitleThe Astronomical Journal 124, 266 (2002).
- [19] Peng, C. Y., Ho, L. C., Impey, C. D. & Hans-Walter, R. Detailed decomposition of galaxy images. ii. beyond axisymmetric models. \JournalTitleThe Astronomical Journal 139, 2097 (2010).
- [20] Gopal-Krishna, Biermann, P. L. & Wiita, P. J. The origin of x-shaped radio galaxies: Clues from the z-symmetric secondary lobes. \JournalTitleThe Astrophysical Journal 594, L103, DOI: 10.1086/378766 (2003).
- [21] Zier, C. Orientation and size of the ‘Z’ in X-shaped radio galaxies. \JournalTitleMonthly Notices of the Royal Astronomical Society 364, 583–592, DOI: 10.1111/j.1365-2966.2005.09586.x (2005). https://academic.oup.com/mnras/article-pdf/364/2/583/18661998/364-2-583.pdf.
- [22] George, I. M. & Fabian, A. C. X-ray reflection from cold matter in Active Galactic Nuclei and X-ray binaries. \JournalTitleMonthly Notices of the Royal Astronomical Society 249, 352–367, DOI: 10.1093/mnras/249.2.352 (1991). https://academic.oup.com/mnras/article-pdf/249/2/352/3427579/mnras249-0352.pdf.
- [23] Murphy, K. D. & Yaqoob, T. An X-ray spectral model for Compton-thick toroidal reprocessors. \JournalTitleMonthly Notices of the Royal Astronomical Society 397, 1549–1562, DOI: 10.1111/j.1365-2966.2009.15025.x (2009). https://academic.oup.com/mnras/article-pdf/397/3/1549/3748819/mnras0397-1549.pdf.
- [24] Maksym, P. et al. Mapping seyfert and liner excitation modes in the inner kpc of ngc 3393. \JournalTitleApJ 829, 46 (2016).
- [25] Trindade Falcão, A., Fabbiano, G., Elvis, M., Paggi, A. & Maksym, W. P. Deep chandra observations of ngc 5728: Morphology and spectral properties of the extended x-ray emission. \JournalTitleApJ 950, 143 (2023).
- [26] Trindade Falcão, A., Fabbiano, G., Elvis, M., Paggi, A. & Maksym, W. P. Discovery of extended fe ka complex x-ray emission in ngc 5728. \JournalTitleApjL (2023).
- [27] Goulding, A. D. et al. Discovery of a close-separation binary quasar at the heart of a z = 0.2 merging galaxy and its implications for low-frequency gravitational waves. \JournalTitleThe Astrophysical Journal Letters 879, L21, DOI: 10.3847/2041-8213/ab2a14 (2019).
- [28] Fabbiano, G., Wang, J., Elvis, M. & Risaliti, G. A close nuclear black-hole pair in the spiral galaxy ngc 3393. \JournalTitleNature 477, 431–434, DOI: 10.1038/nature10364 (2011).
- [29] Deane, R. P. et al. A close-pair binary in a distant triple supermassive black hole system. \JournalTitleNature 511, 57–60, DOI: 10.1038/nature13454 (2014).
- [30] Wrobel, J. M., Walker, R. C. & Fu, H. Evidence from the very long baseline array that j1502se/sw are double hotspots, not a supermassive binary black hole. \JournalTitleThe Astrophysical Journal Letters 792, L8, DOI: 10.1088/2041-8205/792/1/L8 (2014).
- [31] Koss, M. J. et al. Ugc 4211: A confirmed dual active galactic nucleus in the local universe at 230 pc nuclear separation. \JournalTitleThe Astrophysical Journal Letters 942, L24, DOI: 10.3847/2041-8213/aca8f0 (2023).
- [32] Maness, H. L., Taylor, G. B., Zavala, R. T., Peck, A. B. & Pollack, L. K. Breaking all the rules: The compact symmetric object 0402+379. \JournalTitleThe Astrophysical Journal 602, 123, DOI: 10.1086/380919 (2004).
- [33] Bansal, K., Taylor, G. B., Peck, A. B., Zavala, R. T. & Romani, R. W. Constraining the orbit of the supermassive black hole binary 0402+379. \JournalTitleThe Astrophysical Journal 843, 14, DOI: 10.3847/1538-4357/aa74e1 (2017).
- [34] Komossa, S. et al. Discovery of a binary active galactic nucleus in the ultraluminous infrared galaxy ngc 6240 using chandra. \JournalTitleThe Astrophysical Journal 582, L15, DOI: 10.1086/346145 (2002).
- [35] Fried, J. W. & Schulz, H. Ngc 6240 : a unique interacting galaxy. \JournalTitleAstronomy & Astrophysics 118, 166 (1983).
- [36] Schulz, H., Fried, J. W., Röser, S. & Keel, W. C. Extinction and the wavelength dependent positions of the nuclei of ngc 6240. \JournalTitleAstronomy & Astrophysics 277, 416 (1993).
- [37] Faucher-Giguère, C.-A. & Quataert, E. The physics of galactic winds driven by active galactic nuclei. \JournalTitleMonthly Notices of the Royal Astronomical Society 425, 605 (2012).
- [38] Tonry, J. L. Constraints on the orbits of multiple nuclei in brightest cluster galaxies. \JournalTitleApJ 279, 13 (1984).
- [39] Barth, A. J., Bentz, M. C., Greene, J. E. & Ho, L. C. An offset seyfert 2 nucleus in the minor merger system ngc 3341. \JournalTitleThe Astrophysical Journal 683, L119, DOI: 10.1086/591905 (2008).
- [40] Liu, X., Shen, Y. & Strauss, M. A. Cosmic train wreck by massive black holes: Discovery of a kiloparsec-scale triple active galactic nucleus*. \JournalTitleThe Astrophysical Journal Letters 736, L7, DOI: 10.1088/2041-8205/736/1/L7 (2011).
- [41] Schawinski, K. et al. Evidence for three accreting black holes in a galaxy at z -1.35: A snapshot of recently formed black hole seeds? \JournalTitleThe Astrophysical Journal Letters 743, L37, DOI: 10.1088/2041-8205/743/2/L37 (2011).
- [42] Begelman, M. C., Blandford, R. D. & Rees, M. J. Massive black hole binaries in active galactic nuclei. \JournalTitleNature 287, 307–309, DOI: 10.1038/287307a0 (1980).
- [43] Blecha, L., Cox, T. J., Loeb, A. & Hernquist, L. Recoiling black holes in merging galaxies: relationship to active galactic nucleus lifetimes, starbursts and the MBH–sigma relation. \JournalTitleMonthly Notices of the Royal Astronomical Society 412, 2154–2182 (2011).
- [44] Koss, M. et al. Understanding dual active galactic nucleus activation in the nearby universe. \JournalTitleThe Astrophysical Journal Letters 746, L22, DOI: 10.1088/2041-8205/746/2/L22 (2012).
- [45] Wassenhove, S. V. et al. The american astronomical society, find out more the institute of physics, find out more letters observability of dual active galactic nuclei in merging galaxies. \JournalTitleApJL 748, L7 (2012).
- [46] Fornasini, F. M. et al. Termination shocks and the extended x-ray emission in mrk 78. \JournalTitleThe Astrophysical Journal 931, 65, DOI: 10.3847/1538-4357/ac694d (2022).
Author contributions statement
A.T.F. performed the data analysis and reduction, astrometry correction, imaging analysis, and manuscript writing. T.J.T. is the P.I. of the HST and Chandra data, conducted the initial reduction of the X-ray data and the initial assessment of the correction of X-ray astrometry, also providing the reduced XMM RGS data used in the spectral fitting. S.B.K. assisted in the interpretation of the HST imaging analysis and estimated the physical sizes of the [O III] emission-line regions. He also worked with co-author J.N.R. on the Chandra X-ray spectral analysis. V.B. contributed to the Chandra X-ray data reduction, extraction of images in the relevant energy bands, and astrometry correction. J.N.R. contributed to the Chandra X-ray spectroscopic analysis and the extraction of fluxes and luminosities from the dual Fe K nuclei. H.R.S. contributed to the astrometric registration of the HST optical and VLA radio images, and the fitting and interpretation of the HST optical images.
All authors contributed to the drafting and review of the manuscript.
Data availability
HST/ACS, VLA-A, Suzaku, and XMM-Newton data are publicly available through their separate public data archives. Chandra/ACIS data will become publicly available in April/2024. The proprietary data are available on request from the corresponding author.
Code availability
The code GALFIT[18, 19] used to model the HST/ACS data is publicly available at https://users.obs.carnegiescience.edu/peng/work/galfit/galfit.html. The code XSPEC used to model the Chandra, Suzaku, and XMM-Newton spectra is publicly available at https://heasarc.gsfc.nasa.gov/xanadu/xspec/. The code CIAO used to reduce and analyze the Chandra data is publicly available at https://cxc.cfa.harvard.edu/ciao/. The ds9 image display and visualization tool used to generate all the images in the manuscript is publicly available at https://sites.google.com/cfa.harvard.edu/saoimageds9.