From Pixel to Cancer:
Cellular Automata in Computed Tomography
Abstract
AI for cancer detection encounters the bottleneck of data scarcity, annotation difficulty, and low prevalence of early tumors. Tumor synthesis seeks to create artificial tumors in medical images, which can greatly diversify the data and annotations for AI training. However, current tumor synthesis approaches are not applicable across different organs due to their need for specific expertise and design. This paper establishes a set of generic rules to simulate tumor development. Each cell (pixel) is initially assigned a state between zero and ten to represent the tumor population, and a tumor can be developed based on three rules to describe the process of growth, invasion, and death. We apply these three generic rules to simulate tumor development—from pixel to cancer—using cellular automata. We then integrate the tumor state into the original computed tomography (CT) images to generate synthetic tumors across different organs. This tumor synthesis approach allows for sampling tumors at multiple stages and analyzing tumor-organ interaction. Clinically, a reader study involving three expert radiologists reveals that the synthetic tumors and their developing trajectories are convincingly realistic. Technically, we generate tumors at varied stages in 9,262 raw, unlabeled CT images sourced from 68 hospitals worldwide. The performance in segmenting tumors in the liver, pancreas, and kidneys exceeds prevailing literature benchmarks, underlining the immense potential of tumor synthesis, especially for earlier cancer detection. The code and models are available at https://github.com/MrGiovanni/Pixel2Cancer
Keywords:
Data Synthesis Cellular Automata Tumor Segmentation.1 Introduction
Training AI models for image segmentation needs extensive datasets with detailed per-pixel annotations [hatamizadeh2022unetr, isensee2021nnu, zhou2019unet++, zhou2021models, zhou2022interpreting, haghighi2021transferable, feng2020parts2whole]. To reduce manual annotation efforts, data synthesis is a compelling approach for generating enormous synthetic data and annotations for both training [chen2021synthetic, xing2023less, yao2021label, lyu2022pseudo, gao2023synthetic, wang2022anomaly, yu2023good] and evaluating [johnson2017clevr, jordon2022synthetic, liu2023poseexaminer, hu2023synthetic] AI models. This is particularly attractive for segmenting small tumors, which are clinically important to detect at the early stage but rarely occur in public datasets because they are difficult for radiologists to identify.
Preliminary studies have been successful in synthesizing specific disease conditions in medical images, such as synthesizing pulmonary inflammatory lesions in COVID-19 [lyu2022pseudo], retinal diabetic lesions [wang2022anomaly], lung nodules [han2019synthesizing], abdominal tumors [jin2021free, li2023early], and brain tumors [wyatt2022anoddpm]. However, key challenges remain: (i) generating highly realistic tumors, (ii) synthesizing tumors that generalize across multiple organs, and (iii) leveraging synthetic tumors for AI model training. Moreover, no prior work has modeled how tumors develop over time.
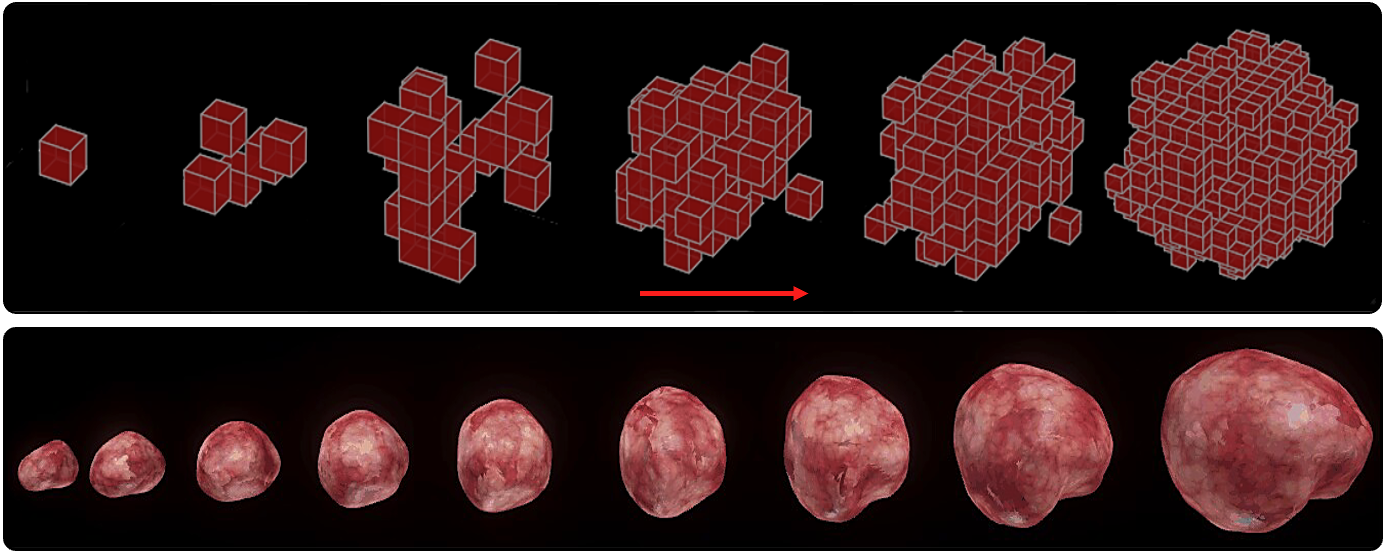
In this paper, we revisit a classic technique, cellular automata [neumann1966theory], incorporating novel designs to generate realistic tumors of various shapes. In cellular automata, the basic element is the cell, which our work refers to as a single pixel in the computed tomography (CT) image. We propose Pixel2Cancer, a framework that can generate synthetic tumors guided by three generic rules we have developed111We develop these generic rules by imitating tumor behavior based on medical knowledge (detailed in §2), including the tumor growth and death [wong2015pancreatic, forster2017development, wise2008three, lee2015mathematical], tissue invasion [frieboes2010three, simpson2007simulating, hatzikirou2012go], and interactions with the tumor microenvironments [jessup1993prospects, subramanian2019simulation, tang2014computational].. As a result, Pixel2Cancer can generate multiple stages of tumor development (illustrated in Figure 1), simulate the interaction between tumors and their surrounding environments, exhibit applicability across various organs, and potentially contribute to the estimation of tumor prognosis in longitudinal data.
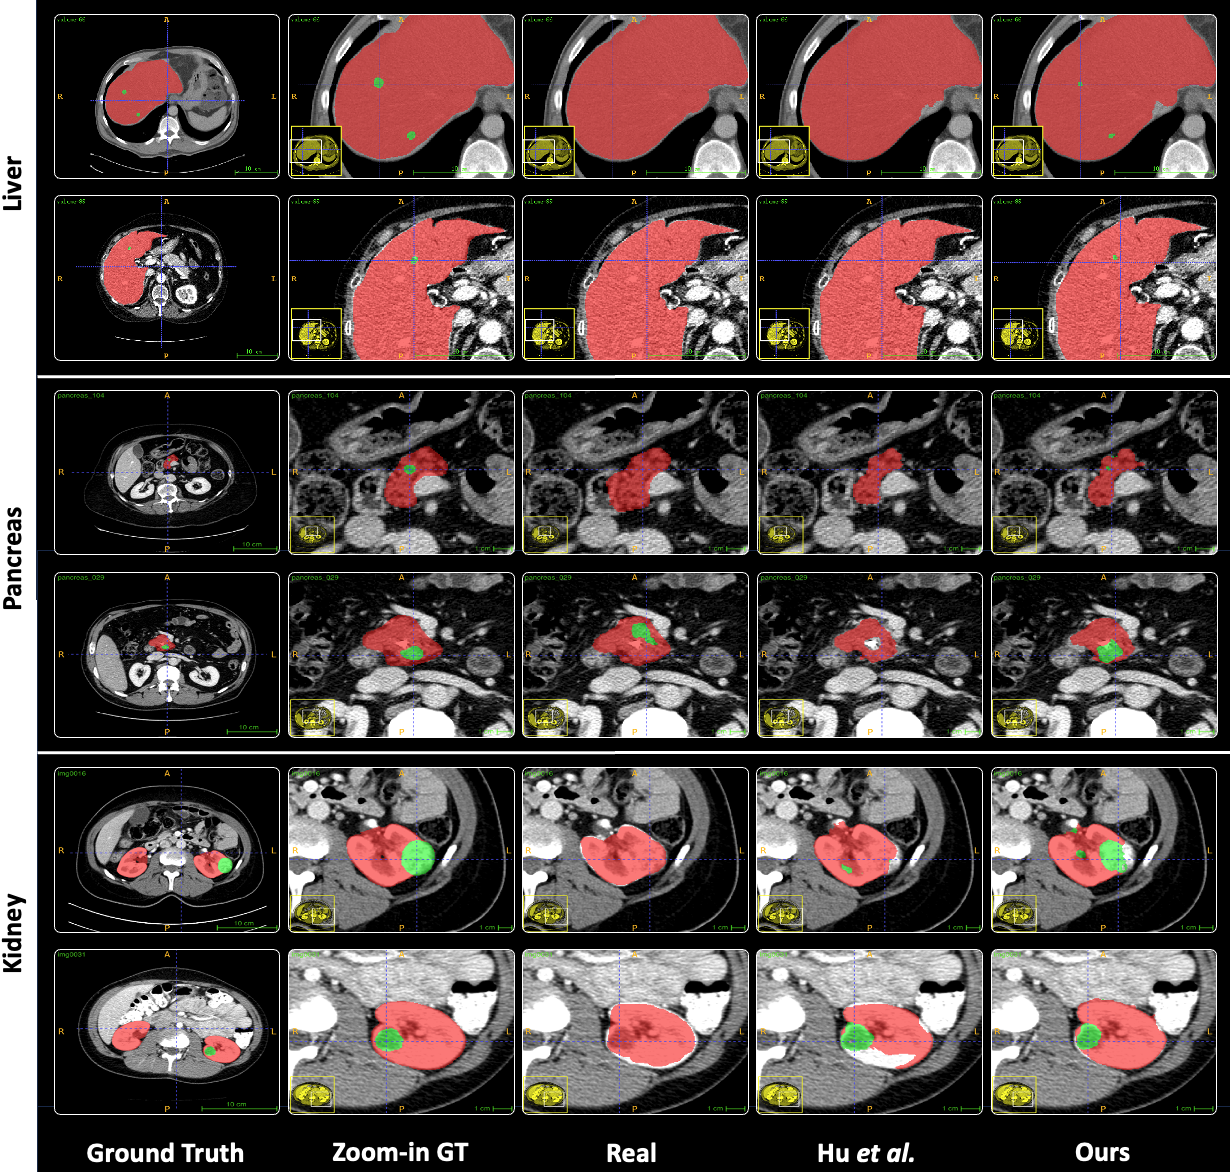
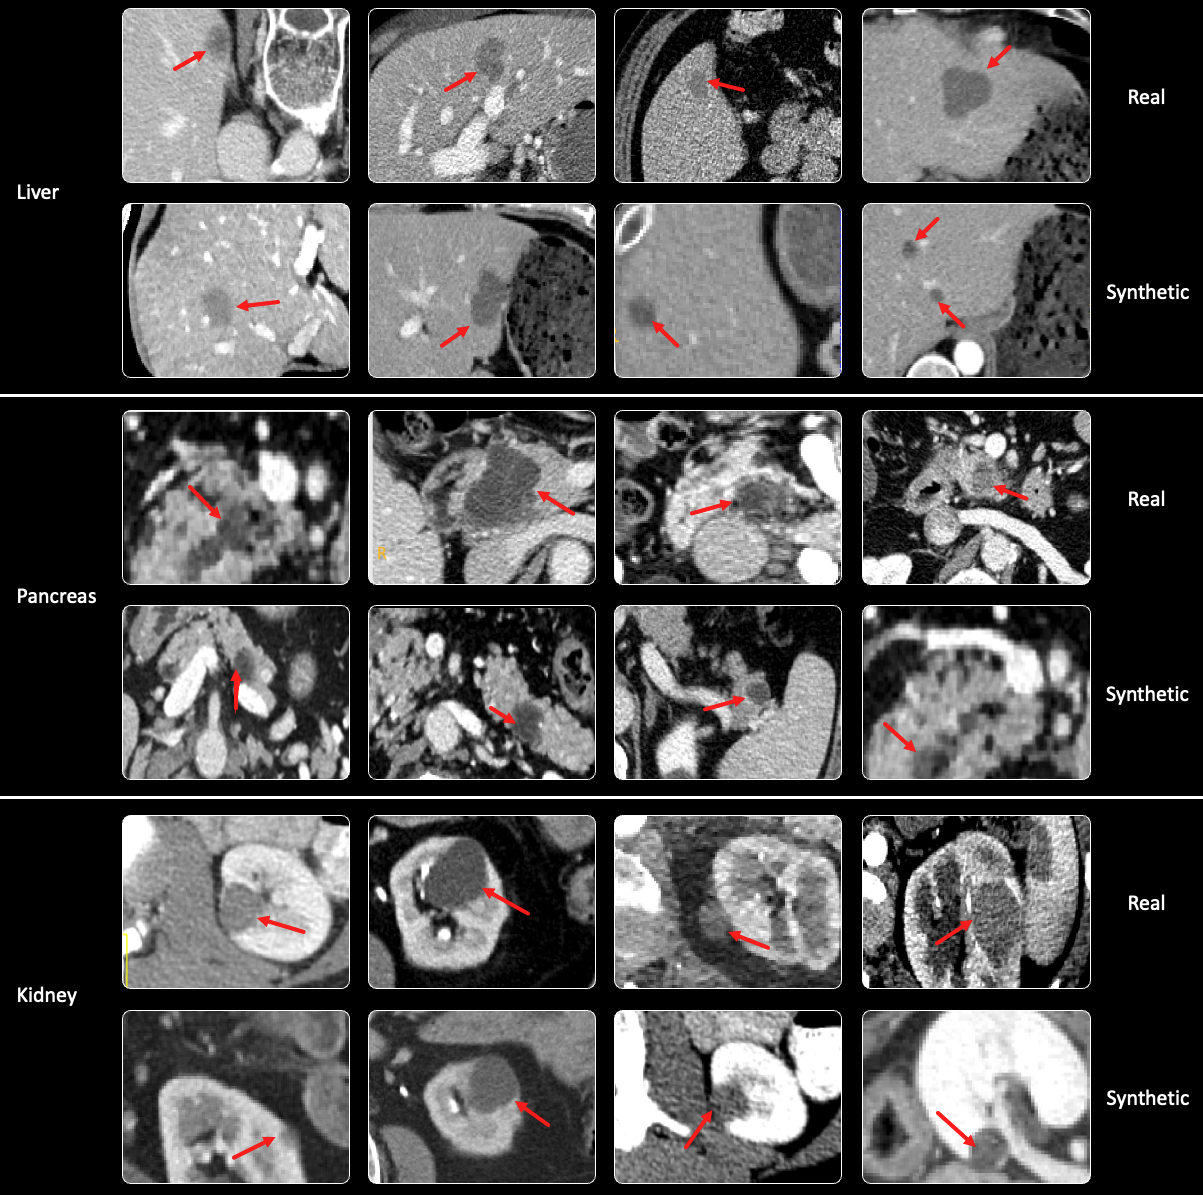
We have evaluated the Pixel2Cancer from two perspectives. Clinically, reader studies involving three expert radiologists have been conducted, and results have been so convincing that even medical professionals with over ten years of experience can mistake them for real tumors (Table 1). Technically, we have generated synthetic tumors on healthy data to train the segmentation model. The performance in segmenting tumors in the liver, pancreas, and kidneys exceeds previous benchmarks and even model training on real data (Table 3), underlining the immense potential of tumor synthesis, especially for earlier cancer detection/diagnosis (Appendix Figure 4).
This performance is attributable to our key observation: Many tumors, regardless of origin, share underlying growth, invasion, and interaction dynamics. Our generic rules effectively capture these shared processes, enabling tumor synthesis across diverse organs. Benign tumors and early-stage cancers usually grow in a contained manner, pushing against surrounding tissues rather than invading them. In contrast, advanced cancers often exhibit invasive growth, infiltrating surrounding tissues and potentially spreading to distant parts of the body (metastasis)222Using liver cancer as an example, early-stage liver cancer commonly presents as small nodules with a relatively regular shape. In contrast, advanced liver cancer frequently demonstrates infiltration of intrahepatic blood vessels and bile ducts, or distant metastasis. Similar patterns are observed in other solid tumors as well [m2021use].. This suggests the existence of fundamental tumor development principles that transcend organ-specific variations. We hereby contrast Pixel2Cancer with related work to show our innovations and novelties.
-
1.
Requiring no manual annotation. Learning-based approaches, such as GAN [goodfellow2014generative] and Diffusion [ho2020denoising, fernandez2023privacy, chen2024towards, du2023boosting], excel in learning tumor representations but require abundant paired tumor data for effective CT image generation. Moreover, the generation process requires extra manual efforts, including the creation of masks to indicate tumor locations and shapes [jin2021free].
-
2.
Simulating tumors development. None of the existing synthetic approaches can simulate tumor development, especially in the intricate processes of proliferation and invasion [harpold2007evolution]. The complexity of these processes, influenced by the surrounding environment [tanase2015complexity, wong2015pancreatic], makes it difficult to generate synthetic tumors when interacting with organ tissues and structures, particularly when generalizing to different organs.
-
3.
Synthesizing tumors across organs. Modeling-based approaches leverage specialized design and domain expertise to simulate tumor appearances. Although the utilization of modeling-based synthetic tumors eliminates the need for manual annotation [li2023early, hu2022synthetic], they require significant effort for designing proper tumor characteristics customized to a specific organ, therefore limiting generalization, especially across different organs.
2 Pixel2Cancer
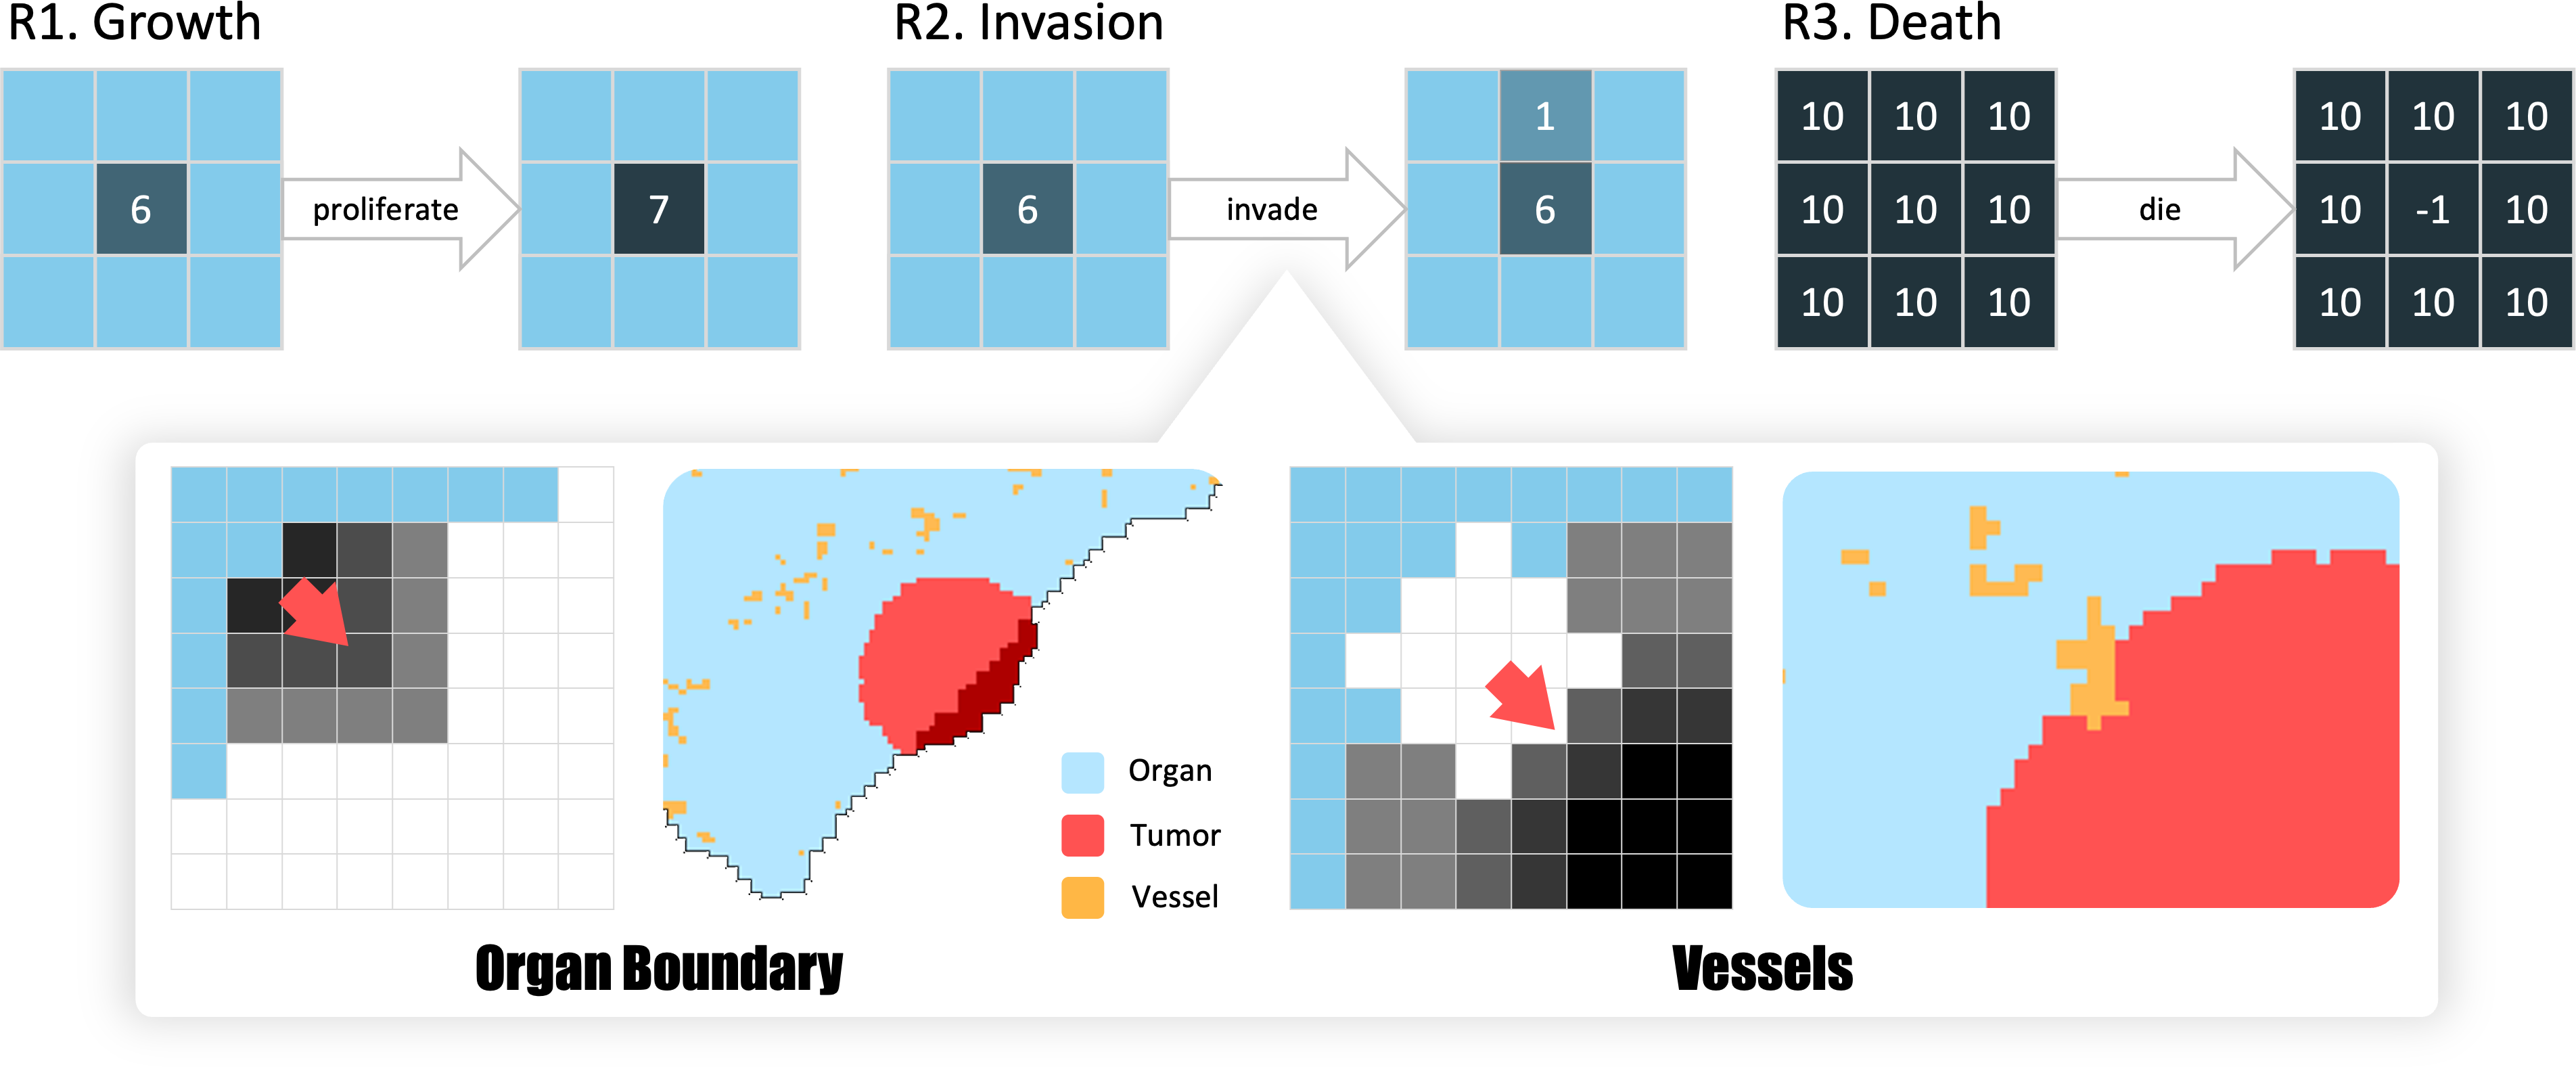
Overview. We begin by quantifying an organ (e.g., liver) based on CT values, assigning each pixel to four levels: level 1 (softest) to level 4 (hardest), with vessels/boundaries as level 0. Next, a tumor is generated from an arbitrary pixel of the organ tissue (levels 0). Inspired by cellular automata, we design three generic rules in §2.1: (1) growth, (2) invasion, and (3) death. These rules oversee the tumor development and interaction with the quantified organ (see §2.2), maintaining a dynamically updated tumor population map. Finally, we translate this map back to the original CT image (see §2.3), modifying the CT values based on the original values and the tumor population—a greater tumor population denotes a smaller CT value (visually darker). As shown in Figure 1, our Pixel2Cancer enables the generation of tumors at various stages in CT images.
2.1 Designing Three Rules for Tumor Development
Since CT pixel scales are larger than cell scales, we introduce a tumor population map to quantify the tumor population state within each cell (pixel). The state ranges from 0 (no tumor) to 10 (maximal tumor population), updating over time based on the states of neighboring cells. A key challenge in cellular automata is designing the rules overseeing state evolution. To initiate tumor development, we randomly select a cell in the organ region and assign its . We then defined three generic rules to simulate tumor shape, texture, and behaviors:
-
•
R1: Growth. Cells with a state greater than 0 but less than 10 can accumulate with a probability (). This rule simulates the proliferative behavior of the tumor.
-
•
R2: Invasion. Cells with a state greater than 0 can incentivize one of its neighbors to grow (). This rule simulates the invasive behavior of the tumor.
-
•
R3: Death. Cells with a state of 10 surrounded by neighbors with 10 can die with a probability (). This rule simulates the effect of crowding in the tumor, which leads to the death of tumor cells.
R1 and R3 are straightforward, but R2’s complexity arises from its potential to influence neighboring cells. Tumor invasion depends not only on its population but also on the nature of neighboring cells (e.g., tissue, vessels, boundaries, etc.). To address this, the next section will describe how we model the interaction between organs and tumors during the invasion process (R2).
2.2 Simulating Interaction Between Organs and Tumors
Quantified Organ. CT images typically exhibit a wide range of intensities, typically ranging from to Hounsfield Units (HU), which poses challenges for simulating interactions between synthetic tumors and surrounding tissues. To simplify the simulation process, we convert the organ in CT images into four levels, resulting in the quantified organ. As shown in Figure 1, the quantified map categorizes the CT intensity into four levels, spanning from low to high intensity (level 1 to 4), with vessels/boundaries assigned to level 0. Subsequently, Pixel2Cancer utilizes this quantified organ as the simulation environment to simulate growth and interaction (Figure 2).
Growth and Interaction: As mentioned in §2.1, the tumor will proliferate itself on the tumor population map (self-state ). Increasing populations lead to more space occupation, interacting with and invading surrounding tissues. In the quantified organ, normal tissues (level 1,2,3) can be invaded at different rates. Vessels, boundaries (level 0), and high-density organ tissues (level 4) will impede tumor growth due to the presence of physical barriers. In this scenario, crowded tumor cells (state = 10) exert pressure to invade surrounding tissues, with pressure levels ranging from 0 to n indicating the number of invasion attempts (Figure 2). When the pressure reaches a certain threshold, the tumor can invade these dense tissues. In Figure 2, we also simulate tumor cell death, influenced by factors such as the vascular feeding environment and cell size [rieger2015integrative]. Our model corresponds to cells surrounded by maximal population neighbors (neighbor-states = 10), and certain evolutionary steps (of sufficient size) can lead to cell death.
2.3 Mapping Tumors to CT Images
After simulating tumor development, the resulting tumor population map needs to be mapped back into CT images (Figure 1). The mapping process is based on a mapping function, eliminating the need for annotations and training processes. It integrates information from the tumor population map and original CT intensity. Tumor population maps guide the mapping process to modify CT intensity values, reflecting different tumor states, including dead cells (), tumor cells (), normal cells, and blurry boundaries where two cell types mix (). To identify the intensity of each tumor pixel, we incorporate typical intensity differences between organ tissues and tumors. Then, we can calculate the intensity by considering the proportion of tumor populations within pixels. To create realistic tumor textures, we introduce 3D Gaussian noise with predefined mean intensity and same standard deviation as organ parenchyma.
3 Experiment & Result
3.1 Experiment
Datasets: For training, we synthesize tumors on healthy CT data. The healthy liver dataset comprises images with healthy livers assembled from CHAOS [kavur2021chaos], BTCV [landman2015], Pancreas-CT [TCIA_data], and healthy subjects in LiTS. The healthy pancreas dataset comprises images from Pancreas-CT and BTCV. The healthy kidney dataset consists of images from BTCV, WORD [luo2021word], and Abdomenct-1k [ma2021abdomenct]. For evaluation, Liver tumor annotations are from LiTS [bilic2019liver]. Pancreas tumors are annotated in MSD (Task07 Pancreas) [simpson2019large]. Kidney annotations are from KiTS [heller2019kits19]. We use 5-fold cross-validation to evaluate the performance.
Implementation: Cellular Automata: We conduct simulation by implementing 3D Cellular Automata package using CUDA. In the 3D space, the CA kernel size is , with cell growth frequency set to in each iteration. We employed blocks with threads for multiprocessing. Compared to standard CPU implementations, our CUDA-based approach achieves a speedup of . Tumor segmentation: Our segmentation code is based on the MONAI framework using U-Net [ronneberger2015u], Swin-UNETR [hatamizadeh2022swin], and nnU-Net [isensee2021nnu] as backbones. During training, random patches of size are cropped from 3D CT images. Models are trained for epochs with a base learning rate of , using a batch size of per GPU and employing linear warm-up and cosine annealing learning rate schedule. For inference, we use the sliding window strategy with overlapping.
3.2 Results
Clinical Validation: We performed a Visual Turing Test [geman2015visual] on 150 CT images, including 25 images with real tumors and 25 images with synthetic tumors in each organ test set. The results in Table 1 show performance metrics for different radiologists. Radiologist R1 (3 years experience) only achieves specificity below . R2 (7 years) exhibits specificity around , confusing half of the synthetic tumors. Even R3 (10 years) misidentifies of synthetic tumors as real. This demonstrates the realistic tumor simulation achieved by Pixel2Cancer.
| metric | liver | pancreas | kidneys | |
| R1 3-year experience | sensitivity (%) | 100 | 95.0 | 95.5 |
| specificity (%) | 27.3 | 22.7 | 26.7 | |
| accuracy (%) | 60.9 | 57.1 | 67.6 | |
| R2 7-year experience | sensitivity (%) | 94.7 | 87.5 | 90.0 |
| specificity (%) | 47.8 | 47.4 | 56.3 | |
| accuracy (%) | 69.1 | 65.7 | 75.0 | |
| R3 10-year experience | sensitivity (%) | 100 | 100 | 100 |
| specificity (%) | 45.4 | 55.6 | 57.9 | |
| accuracy (%) | 68.4 | 72.4 | 75.8 |
-
•
positives: real tumors ( = 25); negatives: synthetic tumors ( = 25).
Tumor Segmentation Performance: We benchmark Pixel2Cancer against the state-of-the-art modeling-based method [hu2023label] and real-tumor method [liu2023clip]. Table 2 demonstrates Pixel2Cancer’s superiority in liver segmentation with DSC of , and NSD of . We also achieve superior performance with real tumors in the pancreas and kidney, with DSCs of and , respectively. Compared to models trained on real liver tumors, Pixel2Cancer outperforms by in NSD. We also surpass Hu et al. by in DSC and in NSD.
| organ | tumor | U-Net | Swin UNETR | nnU-Net | |||
| DSC/NSD | SD/HD | DSC/NSD | SD/HD | DSC/NSD | SD/HD | ||
| (%) | (mm) | (%) | (mm) | (%) | (mm) | ||
| liver | real tumors | 56.7/58.0 | 23.2/61.4 | 53.5/55.9 | 21.3/57.8 | 56.2/55.3 | 24.6/58.3 |
| Hu et al. | 54.5/57.6 | 23.8/58.8 | 52.3/56.5 | 22.9/56.9 | 53.7/56.1 | 22.5/57.2 | |
| Pixel2Cancer | 58.9/63.7 | 17.9/52.4 | 56.7/62.5 | 18.7/51.3 | 57.9/63.2 | 18.9/52.7 | |
| pancreas | real tumors | 57.8/56.5 | 13.1/47.7 | 56.7/52.8 | 24.6/53.9 | 56.8/52.1 | 14.5/44.6 |
| Hu et al. | 54.1/52.2 | 15.7/49.3 | 53.6/54.9 | 22.5/47.4 | 54.6/52.4 | 17.1/48.0 | |
| Pixel2Cancer | 60.9/57.1 | 12.4/43.5 | 59.3/59.5 | 20.4/40.7 | 59.8/56.9 | 13.3/41.4 | |
| kidney | real tumors | 71.3/62.8 | 27.2/64.3 | 70.7/61.2 | 19.8/57.1 | 65.2/58.1 | 25.6/59.3 |
| Hu et al. | 63.2/55.4 | 35.1/69.0 | 61.7/52.3 | 26.2/61.6 | 55.5/49.9 | 27.9/62.7 | |
| Pixel2Cancer | 73.2/65.0 | 13.6/40.9 | 73.9/63.5 | 15.9/45.7 | 67.6/60.1 | 14.8/42.2 | |
-
•
DSC - dice similarity coefficient; NSD - normalized surface dice.
-
•
SD - surface distance; HD - Hausdorff distance.
Superiority in Boundary Segmentation: Pixel2Cancer generates synthetic tumors with absolutely precise tumor masks, while real data annotations often have inaccuracies at boundaries, leading to label noise and boundary segmentation inaccuracy. In Table 2, we apply distance metrics (NSD, SD, and HD). Our Pixel2Cancer synthesis approach surpasses real liver tumors, achieving improvement in NSD and reductions of in SD and in HD. These results highlight the precision of Pixel2Cancer in boundary segmentation, indicating its potential for surgical guidance, particularly in tumor excision procedures.
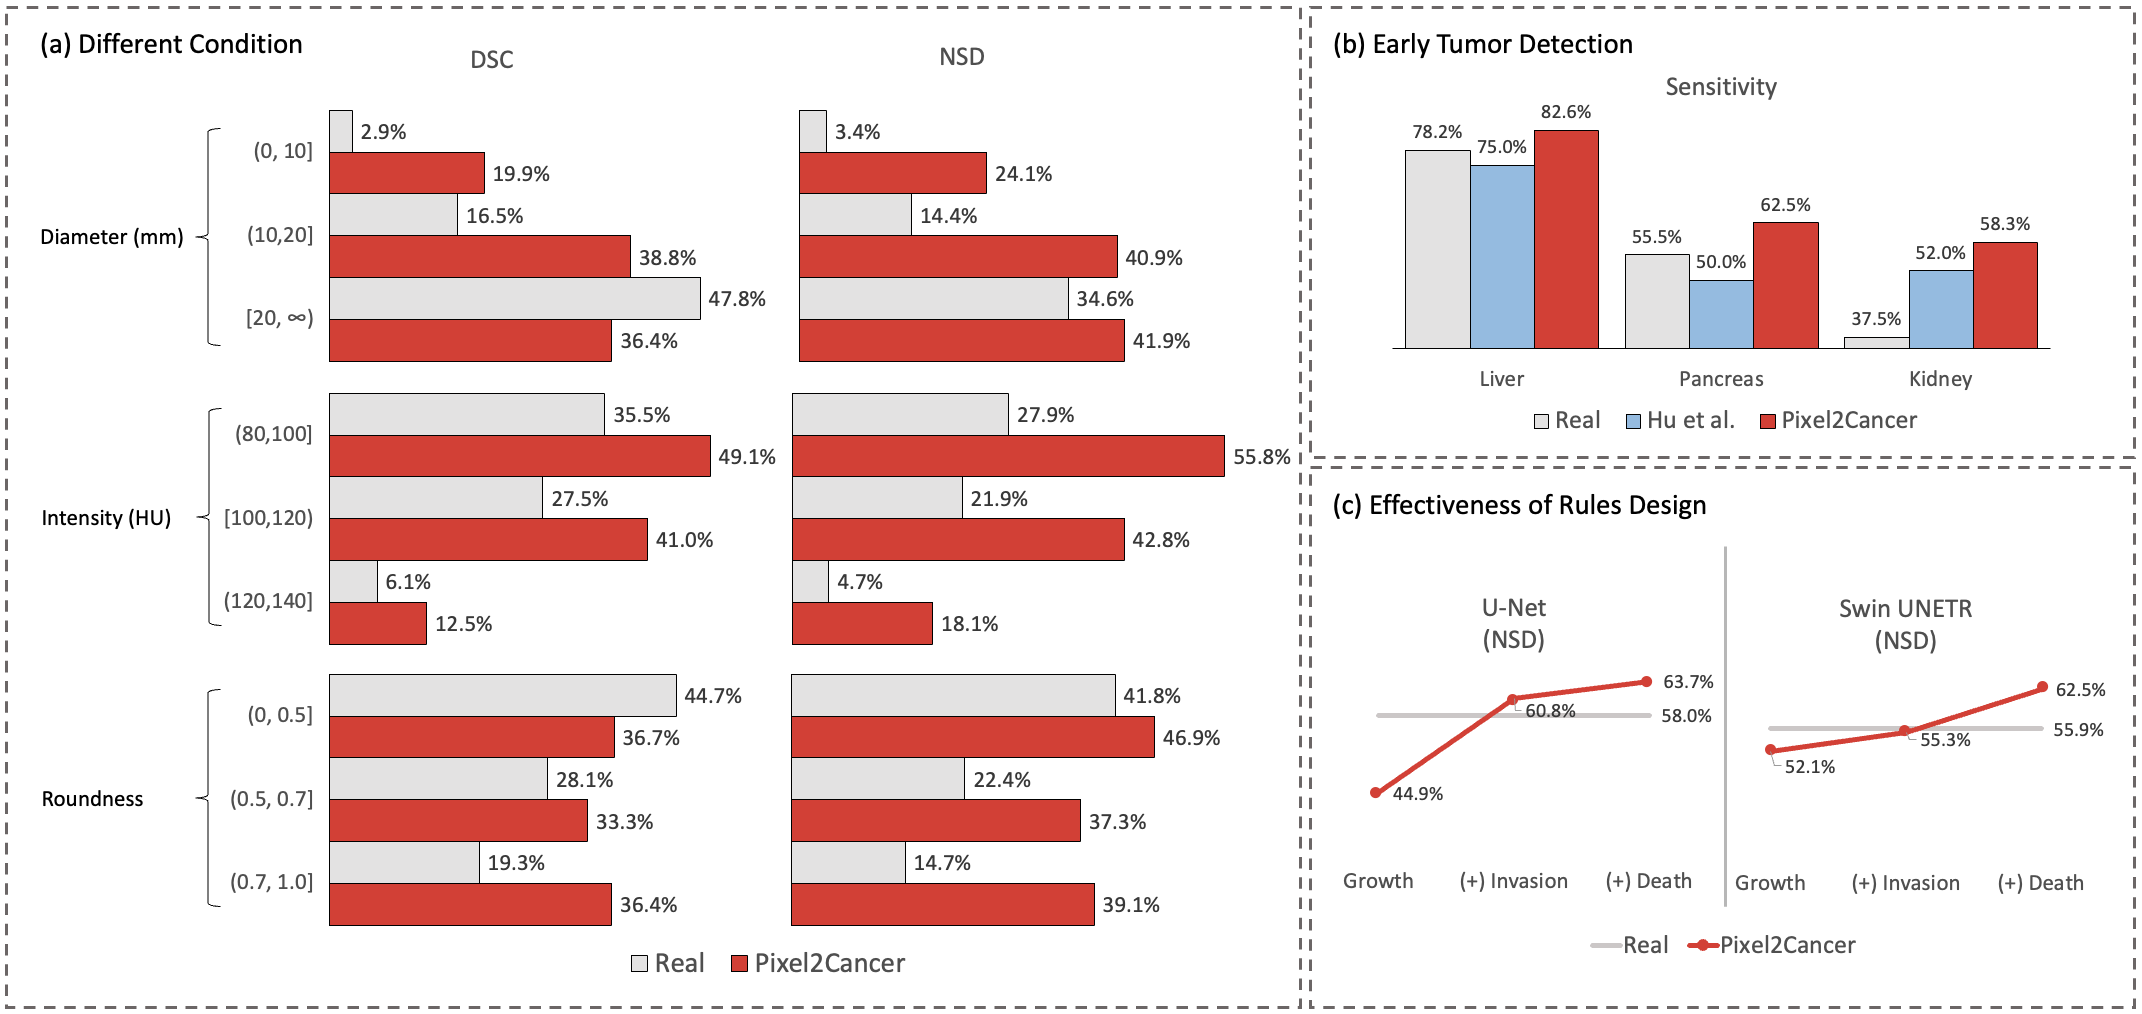
Ability in Small Tumor Detection: Early detection of small tumors is essential for timely cancer diagnosis, but real datasets often lack sufficient instances due to the lack of CT scans in the early stages. Figure 3(b) and Appendix Figure 4 illustrates the performance of small tumor detection. Training solely on our synthetic tumor outperforms models trained on real tumors [liu2023clip] and Hu et al. [hu2023label], highlighting the potential of synthetic tumors for improving early cancer detection.
Ablation Studies: (1) We evaluated how different tumor conditions affect the segmentation results. Pixel2Cancer exhibits greater variability and robustness across different conditions compared to real tumors (Figure 3(a)). (2) We also evaluated the effectiveness of generic rules on liver tumors (Figure 3(c)), basic growth rules yielded NSD. Incorporating interaction and invasion achieved performance comparable to that of real data. Adding the tumor cell death rule outperforms real tumors by in NSD, demonstrating the effectiveness of each generic rule.
4 Conclusion & Discussion
In this paper, we highlight the potential of Pixel2Cancer for tumor synthesis, data augmentation, small tumor detection, and accurate boundary segmentation. Despite simulating tumor behaviors and interactions with organ tissues, including the bending of vessels and the deformation of organ boundaries, there are still various mechanisms of accompanying changes in organs caused by tumors that we have not yet considered, including focal pancreas parenchymal atrophy [miura2021focal], pancreatic duct [xia2022felix], hepatic capsular retraction [tan2016causes], and splenomegaly. In future work, we plan to devise organ rules within our approach to accurately simulate changes induced by tumors when generating synthetic tumors.
4.0.1 Acknowledgements
This work was supported by the Lustgarten Foundation for Pancreatic Cancer Research and the Patrick J. McGovern Foundation Award.
References
- [1] Bilic, P., Christ, P.F., Vorontsov, E., Chlebus, G., Chen, H., Dou, Q., Fu, C.W., Han, X., Heng, P.A., Hesser, J., et al.: The liver tumor segmentation benchmark (lits). arXiv preprint arXiv:1901.04056 (2019)
- [2] Chen, Q., Chen, X., Song, H., Xiong, Z., Yuille, A., Wei, C., Zhou, Z.: Towards generalizable tumor synthesis. In: Proceedings of the IEEE/CVF Conference on Computer Vision and Pattern Recognition (2024)
- [3] Chen, R.J., Lu, M.Y., Chen, T.Y., Williamson, D.F., Mahmood, F.: Synthetic data in machine learning for medicine and healthcare. Nature Biomedical Engineering 5(6), 493–497 (2021)
- [4] Du, S., Wang, X., Lu, Y., Zhou, Y., Zhang, S., Yuille, A., Li, K., Zhou, Z.: Boosting dermatoscopic lesion segmentation via diffusion models with visual and textual prompts. arXiv preprint arXiv:2310.02906 (2023)
- [5] Feng, R., Zhou, Z., Gotway, M.B., Liang, J.: Parts2whole: Self-supervised contrastive learning via reconstruction. In: Domain Adaptation and Representation Transfer, and Distributed and Collaborative Learning, pp. 85–95. Springer (2020)
- [6] Fernandez, V., Sanchez, P., Pinaya, W.H.L., Jacenków, G., Tsaftaris, S.A., Cardoso, J.: Privacy distillation: Reducing re-identification risk of multimodal diffusion models. arXiv preprint arXiv:2306.01322 (2023)
- [7] Forster, J.C., Douglass, M.J., Harriss-Phillips, W.M., Bezak, E.: Development of an in silico stochastic 4d model of tumor growth with angiogenesis. Medical Physics 44(4), 1563–1576 (2017)
- [8] Frieboes, H.B., Jin, F., Chuang, Y.L., Wise, S.M., Lowengrub, J.S., Cristini, V.: Three-dimensional multispecies nonlinear tumor growth—ii: tumor invasion and angiogenesis. Journal of theoretical biology 264(4), 1254–1278 (2010)
- [9] Gao, C., Killeen, B.D., Hu, Y., Grupp, R.B., Taylor, R.H., Armand, M., Unberath, M.: Synthetic data accelerates the development of generalizable learning-based algorithms for x-ray image analysis. Nature Machine Intelligence 5(3), 294–308 (2023)
- [10] Geman, D., Geman, S., Hallonquist, N., Younes, L.: Visual turing test for computer vision systems. Proceedings of the National Academy of Sciences 112(12), 3618–3623 (2015)
- [11] Goodfellow, I., Pouget-Abadie, J., Mirza, M., Xu, B., Warde-Farley, D., Ozair, S., Courville, A., Bengio, Y.: Generative adversarial nets. Advances in neural information processing systems 27 (2014)
- [12] Haghighi, F., Taher, M.R.H., Zhou, Z., Gotway, M.B., Liang, J.: Transferable visual words: Exploiting the semantics of anatomical patterns for self-supervised learning. IEEE Transactions on Medical Imaging (2021)
- [13] Han, C., Kitamura, Y., Kudo, A., Ichinose, A., Rundo, L., Furukawa, Y., Umemoto, K., Li, Y., Nakayama, H.: Synthesizing diverse lung nodules wherever massively: 3d multi-conditional gan-based ct image augmentation for object detection. In: 2019 International Conference on 3D Vision (3DV). pp. 729–737. IEEE (2019)
- [14] Harpold, H.L., Alvord Jr, E.C., Swanson, K.R.: The evolution of mathematical modeling of glioma proliferation and invasion. Journal of Neuropathology & Experimental Neurology 66(1), 1–9 (2007)
- [15] Hatamizadeh, A., Nath, V., Tang, Y., Yang, D., Roth, H.R., Xu, D.: Swin unetr: Swin transformers for semantic segmentation of brain tumors in mri images. In: International MICCAI Brainlesion Workshop. pp. 272–284. Springer (2022)
- [16] Hatamizadeh, A., Tang, Y., Nath, V., Yang, D., Myronenko, A., Landman, B., Roth, H.R., Xu, D.: Unetr: Transformers for 3d medical image segmentation. In: Proceedings of the IEEE/CVF winter conference on applications of computer vision. pp. 574–584 (2022)
- [17] Hatzikirou, H., Basanta, D., Simon, M., Schaller, K., Deutsch, A.: ‘go or grow’: the key to the emergence of invasion in tumour progression? Mathematical medicine and biology: a journal of the IMA 29(1), 49–65 (2012)
- [18] Heller, N., Sathianathen, N., Kalapara, A., Walczak, E., Moore, K., Kaluzniak, H., Rosenberg, J., Blake, P., Rengel, Z., Oestreich, M., et al.: The kits19 challenge data: 300 kidney tumor cases with clinical context, ct semantic segmentations, and surgical outcomes. arXiv preprint arXiv:1904.00445 (2019)
- [19] Ho, J., Jain, A., Abbeel, P.: Denoising diffusion probabilistic models. Advances in Neural Information Processing Systems 33, 6840–6851 (2020)
- [20] Hu, Q., Chen, Y., Xiao, J., Sun, S., Chen, J., Yuille, A.L., Zhou, Z.: Label-free liver tumor segmentation. In: Proceedings of the IEEE/CVF Conference on Computer Vision and Pattern Recognition. pp. 7422–7432 (2023)
- [21] Hu, Q., Xiao, J., Chen, Y., Sun, S., Chen, J.N., Yuille, A., Zhou, Z.: Synthetic tumors make ai segment tumors better. NeurIPS Workshop on Medical Imaging meets NeurIPS (2022)
- [22] Hu, Q., Yuille, A., Zhou, Z.: Synthetic data as validation. arXiv preprint arXiv:2310.16052 (2023)
- [23] Isensee, F., Jaeger, P.F., Kohl, S.A., Petersen, J., Maier-Hein, K.H.: nnu-net: a self-configuring method for deep learning-based biomedical image segmentation. Nature Methods 18(2), 203–211 (2021)
- [24] Jessup, J., Goodwin, T., Spaulding, G.: Prospects for use of microgravity-based bioreactors to study three-dimensional host—tumor interactions in human neoplasia. Journal of cellular biochemistry 51(3), 290–300 (1993)
- [25] Jin, Q., Cui, H., Sun, C., Meng, Z., Su, R.: Free-form tumor synthesis in computed tomography images via richer generative adversarial network. Knowledge-Based Systems 218, 106753 (2021)
- [26] Johnson, J., Hariharan, B., Van Der Maaten, L., Fei-Fei, L., Lawrence Zitnick, C., Girshick, R.: Clevr: A diagnostic dataset for compositional language and elementary visual reasoning. In: Proceedings of the IEEE conference on computer vision and pattern recognition. pp. 2901–2910 (2017)
- [27] Jordon, J., Szpruch, L., Houssiau, F., Bottarelli, M., Cherubin, G., Maple, C., Cohen, S.N., Weller, A.: Synthetic data–what, why and how? arXiv preprint arXiv:2205.03257 (2022)
- [28] Kavur, A.E., Gezer, N.S., Barış, M., Aslan, S., Conze, P.H., Groza, V., Pham, D.D., Chatterjee, S., Ernst, P., Özkan, S., et al.: Chaos challenge-combined (ct-mr) healthy abdominal organ segmentation. Medical Image Analysis 69, 101950 (2021)
- [29] Landman, B., Xu, Z., Igelsias, J., Styner, M., Langerak, T., Klein, A.: 2015 miccai multi-atlas labeling beyond the cranial vault workshop and challenge (2015), doi:10.7303/syn3193805
- [30] Lee, H.G., Kim, Y., Kim, J.: Mathematical model and its fast numerical method for the tumor growth. Math. Biosci. Eng 12(6), 1173–1187 (2015)
- [31] Li, B., Chou, Y.C., Sun, S., Qiao, H., Yuille, A., Zhou, Z.: Early detection and localization of pancreatic cancer by label-free tumor synthesis. MICCAI Workshop on Big Task Small Data, 1001-AI (2023)
- [32] Li, W., Yuille, A., Zhou, Z.: How well do supervised models transfer to 3d image segmentation? In: The Twelfth International Conference on Learning Representations (2024)
- [33] Liu, J., Zhang, Y., Chen, J.N., Xiao, J., Lu, Y., A Landman, B., Yuan, Y., Yuille, A., Tang, Y., Zhou, Z.: Clip-driven universal model for organ segmentation and tumor detection. In: Proceedings of the IEEE/CVF International Conference on Computer Vision. pp. 21152–21164 (2023)
- [34] Liu, Q., Kortylewski, A., Yuille, A.L.: Poseexaminer: Automated testing of out-of-distribution robustness in human pose and shape estimation. In: Proceedings of the IEEE/CVF Conference on Computer Vision and Pattern Recognition. pp. 672–681 (2023)
- [35] Luo, X., Liao, W., Xiao, J., Song, T., Zhang, X., Li, K., Wang, G., Zhang, S.: Word: Revisiting organs segmentation in the whole abdominal region. arXiv preprint arXiv:2111.02403 (2021)
- [36] Lyu, F., Ye, M., Carlsen, J.F., Erleben, K., Darkner, S., Yuen, P.C.: Pseudo-label guided image synthesis for semi-supervised covid-19 pneumonia infection segmentation. IEEE Transactions on Medical Imaging (2022)
- [37] M. Cunha, G., Fowler, K.J., Roudenko, A., Taouli, B., Fung, A.W., Elsayes, K.M., Marks, R.M., Cruite, I., Horvat, N., Chernyak, V., et al.: How to use li-rads to report liver ct and mri observations. RadioGraphics 41(5), 1352–1367 (2021)
- [38] Ma, J., Zhang, Y., Gu, S., Zhu, C., Ge, C., Zhang, Y., An, X., Wang, C., Wang, Q., Liu, X., et al.: Abdomenct-1k: Is abdominal organ segmentation a solved problem. IEEE Transactions on Pattern Analysis and Machine Intelligence (2021)
- [39] Miura, S., Takikawa, T., Kikuta, K., Hamada, S., Kume, K., Yoshida, N., Tanaka, Y., Matsumoto, R., Ikeda, M., Kataoka, F., et al.: Focal parenchymal atrophy of the pancreas is frequently observed on pre-diagnostic computed tomography in patients with pancreatic cancer: a case-control study. Diagnostics 11(9), 1693 (2021)
- [40] Neumann, J.: The theory of self-reproducing automata. Univ. of Illinois Press google schola 2, 429–432 (1966)
- [41] Qu, C., Zhang, T., Qiao, H., Liu, J., Tang, Y., Yuille, A., Zhou, Z.: Abdomenatlas-8k: Annotating 8,000 abdominal ct volumes for multi-organ segmentation in three weeks. Conference on Neural Information Processing Systems (2023)
- [42] Rieger, H., Welter, M.: Integrative models of vascular remodeling during tumor growth. Wiley Interdisciplinary Reviews: Systems Biology and Medicine 7(3), 113–129 (2015)
- [43] Ronneberger, O., Fischer, P., Brox, T.: U-net: Convolutional networks for biomedical image segmentation. In: International Conference on Medical Image Computing and Computer-Assisted Intervention. pp. 234–241. Springer (2015)
- [44] Roth, H., Farag, A., Turkbey, E.B., Lu, L., Liu, J., Summers, R.M.: Data from pancreas-ct (2016). https://doi.org/10.7937/K9/TCIA.2016.TNB1KQBU, the Cancer Imaging Archive. https://doi.org/10.7937/K9/TCIA.2016.tNB1kqBU
- [45] Simpson, A.L., Antonelli, M., Bakas, S., Bilello, M., Farahani, K., Van Ginneken, B., Kopp-Schneider, A., Landman, B.A., Litjens, G., Menze, B., et al.: A large annotated medical image dataset for the development and evaluation of segmentation algorithms. arXiv preprint arXiv:1902.09063 (2019)
- [46] Simpson, M.J., Merrifield, A., Landman, K.A., Hughes, B.D.: Simulating invasion with cellular automata: connecting cell-scale and population-scale properties. Physical Review E 76(2), 021918 (2007)
- [47] Subramanian, S., Gholami, A., Biros, G.: Simulation of glioblastoma growth using a 3d multispecies tumor model with mass effect. Journal of mathematical biology 79, 941–967 (2019)
- [48] Tan, G.X.V., Miranda, R., Sutherland, T.: Causes of hepatic capsular retraction: a pictorial essay. Insights into Imaging 7(6), 831–840 (2016)
- [49] Tanase, M., Waliszewski, P.: On complexity and homogeneity measures in predicting biological aggressiveness of prostate cancer; implication of the cellular automata model of tumor growth. Journal of surgical oncology 112(8), 791–801 (2015)
- [50] Tang, L., Van De Ven, A.L., Guo, D., Andasari, V., Cristini, V., Li, K.C., Zhou, X.: Computational modeling of 3d tumor growth and angiogenesis for chemotherapy evaluation. PloS one 9(1), e83962 (2014)
- [51] Wang, H., Zhou, Y., Zhang, J., Lei, J., Sun, D., Xu, F., Xu, X.: Anomaly segmentation in retinal images with poisson-blending data augmentation. Medical Image Analysis p. 102534 (2022)
- [52] Wise, S.M., Lowengrub, J.S., Frieboes, H.B., Cristini, V.: Three-dimensional multispecies nonlinear tumor growth—i: model and numerical method. Journal of theoretical biology 253(3), 524–543 (2008)
- [53] Wong, K.C., Summers, R.M., Kebebew, E., Yao, J.: Pancreatic tumor growth prediction with multiplicative growth and image-derived motion. In: International Conference on Information Processing in Medical Imaging. pp. 501–513. Springer (2015)
- [54] Wyatt, J., Leach, A., Schmon, S.M., Willcocks, C.G.: Anoddpm: Anomaly detection with denoising diffusion probabilistic models using simplex noise. In: Proceedings of the IEEE/CVF Conference on Computer Vision and Pattern Recognition. pp. 650–656 (2022)
- [55] Xia, Y., Yu, Q., Chu, L., Kawamoto, S., Park, S., Liu, F., Chen, J., Zhu, Z., Li, B., Zhou, Z., et al.: The felix project: Deep networks to detect pancreatic neoplasms. medRxiv (2022)
- [56] Xing, X., Papanastasiou, G., Walsh, S., Yang, G.: Less is more: Unsupervised mask-guided annotated ct image synthesis with minimum manual segmentations. IEEE Transactions on Medical Imaging (2023)
- [57] Yao, Q., Xiao, L., Liu, P., Zhou, S.K.: Label-free segmentation of covid-19 lesions in lung ct. IEEE Transactions on Medical Imaging (2021)
- [58] Yu, M., Kulhare, S., Mehanian, C., Delahunt, C.B., Shea, D.E., Laverriere, Z., Shah, I., Horning, M.P.: How good are synthetic medical images? an empirical study with lung ultrasound. In: International Workshop on Simulation and Synthesis in Medical Imaging. pp. 75–85. Springer (2023)
- [59] Zhou, Z., Gotway, M.B., Liang, J.: Interpreting medical images. In: Intelligent Systems in Medicine and Health, pp. 343–371. Springer (2022)
- [60] Zhou, Z., Siddiquee, M.M.R., Tajbakhsh, N., Liang, J.: Unet++: Redesigning skip connections to exploit multiscale features in image segmentation. IEEE transactions on medical imaging 39(6), 1856–1867 (2019)
- [61] Zhou, Z., Sodha, V., Pang, J., Gotway, M.B., Liang, J.: Models genesis. Medical image analysis 67, 101840 (2021)
| organ | tumor | label/non-label | U-Net | Swin UNETR | ||
| DSC / NSD | SD / HD | DSC / NSD | SD / HD | |||
| (%) | (mm) | (%) | (mm) | |||
| liver | real tumors | 101/0 | 46.7/48.0 | 23.2/61.4 | 43.5/45.9 | 21.3/57.8 |
| Hu et al. [hu2023label] | 0/116 | 44.5/47.6 | 23.8/58.8 | 42.3/46.5 | 22.9/55.4 | |
| Pixel2Cancer | 0/116 | 47.2/52.9 | 17.9/52.4 | 45.4/51.6 | 18.7/51.3 | |
| pancreas | real tumors | 96/0 | 34.3/33.9 | 22.2/47.7 | 28.3/33.6 | 22.3/45.9 |
| Hu et al. [hu2023label] | 0/104 | 27.3/28.0 | 28.4/52.0 | 25.8/27.3 | 29.5/50.9 | |
| Pixel2Cancer | 0/104 | 36.5/35.9 | 21.9/52.2 | 31.5/34.6 | 21.7/41.8 | |
| kidney | real tumors | 96/0 | 17.9/16.1 | 102.8/150.6 | 29.4/27.6 | 93.8/136.8 |
| Hu et al. [hu2023label] | 0/120 | 14.8/17.4 | 70.1/112.9 | 23.5/25.9 | 83.2/122.3 | |
| Pixel2Cancer | 0/120 | 18.1/19.3 | 85.2/131.7 | 28.6/28.2 | 80.9/127.2 | |