Cross-Cluster Shifting for Efficient and Effective 3D Object Detection in Autonomous Driving
Abstract
We present a new 3D point-based detector model, named Shift-SSD, for precise 3D object detection in autonomous driving. Traditional point-based 3D object detectors often employ architectures that rely on a progressive downsampling of points. While this method effectively reduces computational demands and increases receptive fields, it will compromise the preservation of crucial non-local information for accurate 3D object detection, especially in the complex driving scenarios. To address this, we introduce an intriguing Cross-Cluster Shifting operation to unleash the representation capacity of the point-based detector by efficiently modeling longer-range inter-dependency while including only a negligible overhead. Concretely, the Cross-Cluster Shifting operation enhances the conventional design by shifting partial channels from neighboring clusters, which enables richer interaction with non-local regions and thus enlarges the receptive field of clusters. We conduct extensive experiments on the KITTI, Waymo, and nuScenes datasets, and the results demonstrate the state-of-the-art performance of Shift-SSD in both detection accuracy and runtime efficiency.
I Introduction
Object detection in the 3D point clouds plays a critical role in the fields of robotics and autonomous driving systems, allowing for accurate recognition and localization of objects. Given the sparseness and lacking topological information on point clouds, the existing approaches can be mainly categorized by their representations: point-based [1, 2, 3, 4, 5] and voxel-based approaches [6, 7, 8, 9, 10, 11, 12]. Voxel-based approaches typically employ either hard or dynamic voxelization [13] and then leverage the strengths of convolutional layers to enlarge the receptive fields rapidly. Though efficient and effective, the voxelization process inherently leads to a loss of geometry due to irreversible quantization. Additionally, the performance is considerably influenced by the voxel scale. In contrast, point-based approaches have demonstrated their ability to preserve the intrinsic geometry of point clouds and provide enhanced runtime efficiency [14, 15, 16, 2, 4].
However, one challenge for point-based methods is balancing the degree of aggressive downsampling to save computational costs [17] while not severely losing information for accurate predictions. The commonly employed set abstraction (SA) layers [16], as well as their variations [18, 19, 20, 21], primarily focus on modeling local features for clustered points within a pre-defined spherical region.
Unlike the traditional convolution operations that extract features through a sliding window, these methods struggle to effectively share information among point clusters grouped by balls, reminiscent of the constraints observed in sparse convolution [22]. Neglecting interaction between neighborhood cluster points leads to inferior feature propagation, further limiting the model representation capacity. The downsampling procedures further exacerbate the loss of information. Hybrid approaches [23, 24, 25, 26, 13] attempt to deal with this problem by introducing voxel representation to quickly enlarge the receptive fields with sparse convolution layers [27]. While these strategies have demonstrated some advancements, the additional memory and computational overhead remain significant concerns.
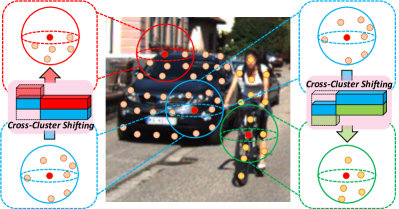
Motivated by the above analysis, we aim to attach more capability for feature interactions and information integration for point-based approaches. Inspired by the TSM [28] and ShuffleNet [29], we propose a novel point-based 3D detector, named Shift-SSD. Compared to TSM, which allows features to propagate along the temporal dimensions, and ShuffleNet, which helps information flow across channels, our proposed Cross-Cluster Shifting enables efficient feature propagation among cluster points. As illustrated in Fig. 1, features captured in different clusters extracted independently within grouped ball regions are exchanged and integrated to build long-range dependency, achieving the expansion of receptive fields. Compared with previous point-based approaches, our Shift-SSD armed with the proposed Cross-Cluster Shifting achieves remarkable improvement in 3D object detection, especially on the large-scale dataset regime. We conduct extensive experiments on the three datasets of KITTI Object Detection Benchmark [30], Waymo [31], and nuScenes [32] datasets, and the reported superior performance justifies the effectiveness of our method.
In summary, our contributions reside as follows:
-
•
We present an interesting information exchange scheme for 3D point-based object detectors, empowered with our simple yet effective Cross-Cluster Shifting. By efficiently modeling the correlation among the locally extracted features of clusters, the proposed Cross-Cluster Shifting expands the receptive fields with better information capture ability.
-
•
We exhibit how the information exchange strategy boosts our proposed detector, and provide thorough analyses on our proposed Cross-Cluster Shifting.
- •
II Related Work
Point-based Detectors Point-based representation is the most straightforward way to represent a point cloud without the process of voxelization. PointRCNN [1, 33] exploits voxel representation for initial bounding boxes generation and raw point clouds for second-stage refinement. Meanwhile, STD [5] conversely generates proposals from sparse point cloud input. These works follow a similar pipeline that first selects some farthest samples as cluster points to reduce the computational costs and apply PointNet++ [16] or its variants [18, 34, 19, 35, 36, 37, 38, 39, 40] as the backbone for predictions. Besides, 3DSSD [2] combines D-FPS with their proposed F-FPS to improve the quality of cluster point selections. IA-SSD [4] and SASA [14] further incorporate their proposed learning-based class-aware sampling strategies with D-FPS for better efficiency. Our method also belongs to a point-based approach and focuses on enhancing point representation learning via the feature propagation procedure.
Voxel-based Detectors Voxel representation is commonly used in 3D object detection since it converts the irregular data representation into a structural data format. With this, traditional convolution architecture can be directly applied for efficiency. VoxelNet [6] is one of the pioneering works that combine learning-based voxel-wise feature extraction followed by dense 3D convolution. PointPillar [7] simplifies the dense 3D convolution with 2D convolution on the BEV space, which greatly improves the efficiency and saves the memory cost. Further, some extensions [9, 27, 10, 42, 8, 43, 44, 45, 46, 47, 48, 49, 50, 51, 52, 53] are proposed based on the hierarchical feature learning to enhance the voxel-wise features with geometry guidance. Most of these works utilize sparse convolution [27] to improve the efficiency of the sparsity. Voxel-RCNN [10] and its variants [54] take the merits of two-stage frameworks to further refine the predictions.
Hybrid Detectors Currently, more and more works pay attention to the fusion between different representations, including range views, point representation, and voxel representation. Works [25, 24, 55, 56, 57, 58, 59, 60, 61, 62, 63] aim to integrate the merits of multiple representations. The general pipeline for this kind of work is to utilize sparse convolution [27, 64, 65] or convolution for voxel-wise feature extractions and refine the predictions with point-wise geometry learning. Point-wise and voxel-wise representations are simultaneously exploited for efficiency and performance. Moreover, transformer-based approaches [66, 67, 68, 69, 70, 71] are further proposed for better cross-representation fusion. Compared with traditional attention layers, VoTr [67] utilizes local attention and dilated attention mechanisms to capture the multi-scale context information at the sparse voxel level while alleviating the computation cost in the query process. Exploring the direction of building a hybrid detector with our Shift-SSD is left for future work.
III Method
III-A Overview
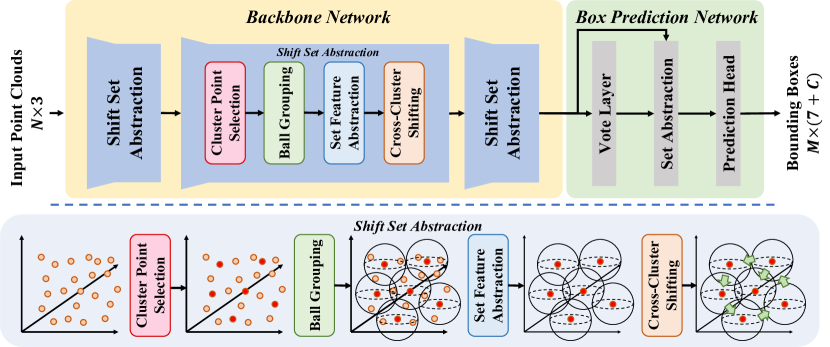
The overall architecture of the proposed Shift-SSD is shown in Fig. 2. It consists of the backbone network for cluster point feature extraction and the box prediction network to produce detected boxes. The backbone network takes the raw point clouds as input and processes them with a stack of our proposed Shift Set Abstraction (SSA) modules to summarize features into a small subset of points. Then, the prediction network will first generate the candidate points by adding the predicted offsets to the cluster points and further aggregate features into the candidate points. Finally, the candidate points with the aggregated features will be sent to the regression and classification heads to predict the 3D bounding boxes with corresponding class labels.
Backbone Network Several SSA modules are sequentially applied onto the input points to progressively downsample, achieving efficiency and producing point subsets (cluster points) with representative features. Each SSA comprises Cluster Point Selection, Ball Grouping, Set Feature Extraction, and Cross-Cluster Shifting layers.
Box Prediction Network The Box Prediction Network will first follow the VoteNet [41] to generate the candidate points by predicting offsets that move the downsampled cluster points toward the instance centers. The candidate points are then considered as the selected cluster points to pass into a SA layer [16] to aggregate instance-level features for box prediction. The eventual aggregated instance features are sent to the regression head and classification head to predict with the 3D bounding boxes. The 3D bounding box proposals are post-processed by 3D NMS with a defined IoU threshold.
III-B Shift Set Abstraction
Existing point-based 3D detection frameworks mostly inherit the PointNet series [72, 16] for processing the raw point cloud data. The intrinsic factor that prompts effective geometric feature learning for these frameworks is the flexible receptive field achieved by their proposed Set Abstraction (SA) layer. However, the original design of the SA layer only extracts features for cluster points within the ball regions under the predefined radii, and the learning processes of clusters are independent of each other within a layer, as illustrated in Fig. 1. We assimilate the sake of the SA layer and propose to leap forward with our proposed module, denoted as Shift Set Abstraction (SSA), to model longer-range dependencies by diffusing local geometric information among clusters with the operation of Cross-Cluster Shifting, as presented in the lower part of Fig. 2.
Set Abstraction Given a set of input points for each SA layer, the Cluster Points Selection utilizes the sampling operation of D-FPS [72] or Ctr-S [4] to obtain the representative cluster points. To capture local geometric patterns and further summarize them to cluster points, Ball Grouping is first applied to sample the neighbors for each cluster point. Then the Set Feature Abstraction, consisting of an MLP layer and a reduction operation, is conducted within each independently grouped region to summarize local geometric features. These summarized features of each cluster point are considered the information carrier of their representative ball regions. We obtain multi-scale features for cluster points by applying the similar aforementioned process through setting different radii for the Ball Grouping. We denote the summarized cluster features extracted under the radius of as . The features that summarize under different radii will be concatenated and then fusion with an MLP. The Set Abstraction can be formulated as
| (1) | ||||
| (2) |
where represents the cluster point. is the neighbor point of and is sampled within the ball region, which is defined by radius . are the features of neighbor point . represents the for extracting features under the scale , which takes the concatenation of and the relative coordinate of as input and output with neighbor features. Later the neighbor features are summarized with the reduction layer (max-pooling) as the cluster’s local geometric features, denoted as . As shown in Eqn. 2, the summarized cluster features of different scales are concatenated and further fused by an aggregation layer (an denoted as ).
Motivation As illustrated in Eqn. 1, we observed the cluster point features are independently extracted within a limit ball region constrained by . The prior work of ShuffleNet [29] helps the information flow among channel groups with the channel shuffle operation and TSM [28] enables temporal modeling by shifting channels across frames. Motivated by the observed limitation in the traditional design and the existing works, we introduce the novel Cross-Cluster Shifting to the Set Abstraction, which actualizes the inter-dependency modeling among those independently learned cluster points, as shown in the lower part of Fig. 2.
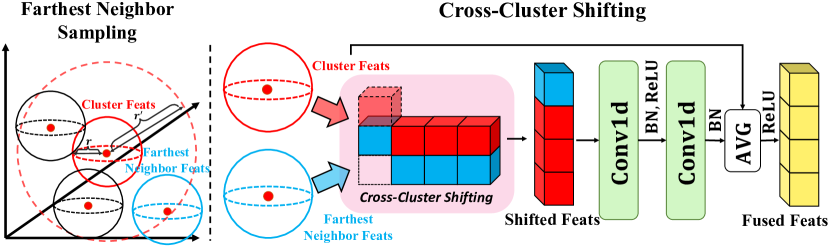
Farthest Neighbor Sampling We design the Cross-Cluster Shifting to conduct interaction for the cluster points with each of their farthest neighbors denoted as to incorporate more information from their surrounding environment. Given the cluster points are downsampled through D-FPS [72] or Ctr-S [4], they are sparser (spatially farther from each other). Therefore, the range defined by radius for searching the farthest neighbors should be larger in order to form a diverse neighbor cluster points set and later pick the farthest one from it. As shown on the left of Fig. 3, we utilize the ball-query operation, the same as the one conducted in Ball Grouping [16], by first randomly sampling neighbors within a larger range of for each cluster point and then picking the farthest one among these sampled neighbors. The pairing between each cluster and its farthest neighbor is shared across the multi-scale branches. Note that the farthest neighbor sampling is defined with the same radius of as the one used in the later SSA module, such that the formed neighbor cluster points set can be reused for saving computation. We analyze the effectiveness of the selection strategy that picks the farthest neighbor of each cluster point to interact with in Section IV.
Cross-Cluster Shifting To propagate the cluster-level information between the cluster and its farthest neighbor, we reserve an information-shared features space with channels for each cluster point feature to shift in the information stored in its farthest neighbor . As shown at the right of Fig. 3, we first apply the gather operation to obtain the features with channels from the farthest neighbors corresponding to each cluster point. Then, we shift these features from the farthest neighbors toward the information-shared region of each cluster point. We further pass these features into a two-layer MLP to interact the shift-in features with the remaining features that store the local geometric information, as illustrated in Fig. 3. To maintain the local geometric feature learning capacity of the cluster point, we insert the Cross-Cluster Shifting into the residual branch followed by taking the average on the resulting features with the input features of . The Cross-Cluster Shifting is formed as follows:
| (3) |
where are the enhanced cluster features output from the Cross-Cluster Shifting. will then be activated by after Eqn. 3.
We rewrite the aggregation layer defined in Eqn. 2 as
| (4) |
where is the input for the next Shift Set Abstraction layer.
III-C End-to-end Learning
We train Shift-SSD in an end-to-end training manner. The overall loss function consists of centroid offset loss , classification loss , and box regression loss :
| (5) |
, is calculated by smooth- to supervise the Vote layer [41] to regress the clusters’ offsets towards the instance centroids. We utilize cross-entropy loss in for training the classification of bounding boxes. We apply the box regression loss as [2, 4], which constitutes losses for regressing location, box size, angle, and distance to corner:
| (6) |
For the hyper-parameters of different losses, we follow [2, 4] to set and as .
| Method | Vehicle (LEVEL 1) | Vehicle (LEVEL 2) | Ped. (LEVEL 1) | Ped. (LEVEL 2) | Cyc. (LEVEL 1) | Cyc. (LEVEL 2) | ||||||
| mAP | mAPH | mAP | mAPH | mAP | mAPH | mAP | mAPH | mAP | mAPH | mAP | mAPH | |
| PointPillars [7] | 60.67 | 59.79 | 52.78 | 52.01 | 43.49 | 23.51 | 37.32 | 20.17 | 35.94 | 28.34 | 34.60 | 27.29 |
| SECOND [27] | 68.03 | 67.44 | 59.57 | 59.04 | 61.14 | 50.33 | 53.00 | 43.56 | 54.66 | 53.31 | 52.67 | 51.37 |
| Part- [73] | 71.82 | 71.29 | 64.33 | 63.82 | 63.15 | 54.96 | 54.24 | 47.11 | 65.23 | 63.92 | 62.61 | 61.35 |
| PV-RCNN [25] | 74.06 | 73.38 | 64.99 | 64.38 | 62.66 | 52.68 | 53.80 | 45.14 | 63.32 | 61.71 | 60.72 | 59.18 |
| IA-SSD [4] | 70.53 | 69.67 | 61.55 | 60.80 | 69.38 | 58.47 | 60.30 | 50.73 | 67.67 | 65.30 | 64.98 | 62.71 |
| DBQ-SSD [40] | 71.58 | 71.03 | 64.13 | 63.61 | 69.18 | 58.47 | 60.22 | 50.81 | 68.29 | 66.01 | 66.09 | 63.86 |
| Shift-SSD (Ours) | 74.15 | 73.6 | 65.1 | 64.6 | 72.36 | 62.31 | 63.41 | 54.53 | 68.24 | 66.42 | 66.06 | 64.29 |
| Method | mAP | Car | Ped. | Bus | Barrier | TC | Truck | Trailer | Motor | Cons. Veh. | Bicycle |
| SECOND† [27] | 27.12 | 75.53 | 59.86 | 29.04 | 32.21 | 22.49 | 21.88 | 12.96 | 16.89 | 0.36 | 0.0 |
| PointPillars† [7] | 29.5 | 70.5 | 59.9 | 34.4 | 33.2 | 29.6 | 25.0 | 20.0 | 16.7 | 4.5 | 1.6 |
| 3DSSD [2] | 42.66 | 81.20 | 70.17 | 61.41 | 47.94 | 31.06 | 47.15 | 30.45 | 35.96 | 12.64 | 8.63 |
| IA-SSD∗ [4] | 42.23 | 71.91 | 64.36 | 66.90 | 48.40 | 29.23 | 45.49 | 31.50 | 34.74 | 15.36 | 14.32 |
| Shift-SSD (ours) | 44.39 | 72.64 | 68.80 | 67.79 | 51.13 | 30.32 | 46.86 | 34.01 | 37.73 | 17.69 | 16.92 |
IV Experiments
We conduct experiments to evaluate our model using three well-known benchmarks: the KITTI [30], Waymo [31], and nuScenes [32] datasets.
| Method | Car Mod. | Ped. Mod. | Cyc. Mod. | |
| (IoU=0.7) | (IoU=0.5) | (IoU=0.5) | ||
| Voxel-based | SECOND [27] | 75.96 | 35.52 | 60.82 |
| PointPillars [7] | 74.31 | 41.92 | 58.65 | |
| SA-SSD [74] | 79.79 | - | - | |
| TANet [75] | 75.94 | 44.34 | 59.44 | |
| Part- [73] | 78.49 | 43.35 | 63.52 | |
| Point-Voxel | STD [5] | 79.71 | 42.47 | 61.59 |
| PV-RCNN [25] | 81.43 | 43.29 | 63.71 | |
| HVPR [76] | 77.92 | 43.96 | - | |
| VIC-Net [77] | 80.61 | 37.18 | 63.65 | |
| Point-based | PointRCNN [1] | 75.64 | 39.37 | 58.82 |
| 3DSSD [2] | 79.57 | 44.27 | 64.10 | |
| IA-SSD [4] | 80.13 | 39.03 | 61.94 | |
| DBQ-SSD [40] | 79.39 | 38.08 | 62.80 | |
| Shift-SSD (Ours) | 81.65 | 36.74 | 63.13 | |
IV-A Implementation Details and Results
KITTI dataset provides 80 labeled 3D objects over 15 LiDAR samples. Following the predecessors, we employ the same protocol to preprocess the point cloud data before training. Subsequently, we adopt settings on network depth and width for our Shift-SSD similar to [16, 4, 2, 40] by stacking our SSA modules to sequentially downsample input point clouds to points, and simultaneously extract point-wise features under two different scales. The shifting ratio is empirically set as , the best one we select from {, , , } by evaluations, to leverage information propagation across clusters for feature enhancement. Totally, we train the network in an end-to-end manner for 80 epochs using the ADAM optimizer [78] and One-cycle [79] scheduler with a maximum of 0.01 on a single NVIDIA GeForce RTX3090 GPU.
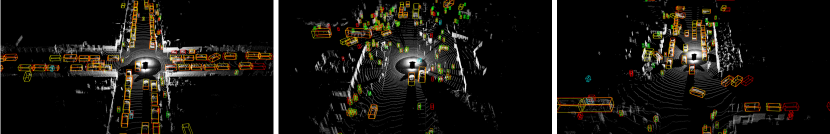
As shown in Tab. III, we follow the official metric to compute score recalling 40 positions with IoU thresholds set to , , and , respectively for Car, Pedestrian, and Cyclist, under Moderate difficulty level. Our proposed Shift-SSD achieves outstanding detection performance among methods of the same point-based genre, with the best results in Car that even surpass several point-voxel and voxel-based counterparts. Specifically, we outperform the SOTA efficient method IA-SSD [4] and DBQ-SSD [40] in Car by and , and in Cyclist by and , respectively.
Waymo dataset is larger in scale compared to KITTI and contains 12 3D annotations distributed in 200 360-degree LiDAR samples with higher point density, capturing more complex scenes. Therefore, we follow [4, 40] to quadruple the number of sampled points after each SSA module, i.e. , while keeping the remaining network configuration unchanged. We then train our Shift-SSD for epochs using similar optimization settings as for KITTI on NVIDIA GeForce RTX3090 GPU.
To evaluate, we compute two official metrics mAP and mAPH both with IoU threshold of for Vehicle and for Pedestrian and Cyclist, under two difficulty levels. Results shown in Tab. I highlight the superiority of our Shift-SSD regardless of categories, levels, and metrics. Pointedly, we outperform IA-SSD [4] by , , and in mAP, and , , and in mAPH, averaging by difficulty levels for Vehicle, Pedestrian, and Cyclist respectively. Similar performance gains can also be observed compared to DBQ-SSD [40]. These advancements indicate that the more complex the input pointclouds, the better our Shift-SSD performs.
nuScenes is another large-scale dataset providing 1.4 annotated 3D boxes for 40 keyframes and 390 LiDAR sweeps but has a more diverse set of 10 object categories compared to Waymo and KITTI. We adopt the same pointcloud preprocessing from [2] and adjust the prediction head to detect 10 classes while keeping the rest of network configuration unchanged as in Waymo experiments. Our Shift-SSD is then trained for 20 epochs using similar optimization and environment settings as in Waymo.
As shown in Tab. II, we follow the official metric to compute score for each object category and the overall . Our Shift-SSD obtains the best overall score of . We respectively surpass other point-based correlates including IA-SSD [4] and 3DSSD [2] by substantial margins of and . Particularly, we largely exceed the performance of 3DSSD in the majority of classes such as Bicycle (), Bus (), Construction Vehicle (), and Trailer (). For the baseline IA-SSD, we outperform its results in all categories; for instance, Ped. (), Motor (), and Barrier (). These further highlight the performance of our Shift-SSD when dealing with challenging cases.
IV-B Ablation Studies
This section reports the ablation study conducted on the KITTI dataset [30]. To reflect the performance under different difficulty levels, we evaluate the model by , , and , defined by taking the average mAP across classes under Easy, Moderate, and Hard difficulties, respectively.
Hyper-parameters Study. As shown in Tab. IV, we evaluate the varied shifting proportions of channels and find that shifting ratio works best for fusing the local spatial features with the shifting features from the neighbor.
| Ratio | 0 | 1/16 | 1/8 | 1/4 | 1/2 |
| AP | 69.08 | 69.07 | 70.27 | 68.72 | 69.08 |
| Selection | |||
| Feats Scale | 77.75 (-1.71) | 67.95 (-2.32) | 64.76 (-2.28) |
| Nearest | 78.54 (-0.92) | 69.49 (-0.78) | 65.84 (-1.20) |
| Points Num | 78.96 (-0.50) | 69.88 (-0.39) | 66.78 (-0.26) |
| Farthest | 79.46 | 70.27 | 67.03 |
Selection Strategies on Clusters for Shifting. As described in Section III-B, we measure the importance of neighbor clusters for applying cross-cluster shifting based on distance. Specifically, we select the farthest neighbor from the point set sampled within a ball region of the centering cluster point. We also consider different strategies other than Farthest Neighbor Sampling (denoted as Farthest in Tab. V) in selecting the cluster to apply Cross-Cluster Shifting. As a counterpart of Farthest Neighbor Sampling, we experiment with Nearest Neighbor Sampling, denoted as Nearest in Tab. V. Besides, we consider making a selection on neighbors to apply Cross-Cluster Shifting based on the scale of the features (calculated by taking mean along channel dimension), denoted as the “Feats Scale in Tab. V.” Another way to measure the cluster importance is based on the number of points that the neighbor clusters are summarized from. As shown in Tab. V, we empirically found that selecting the farthest cluster to apply for cross-cluster shifting leads to the best performance.
Effectiveness Study. As shown in Tab. VI, we evaluate the effectiveness of our proposed Cross-Cluster Shifting (CS) against different exchanging schemes including concatenation (Concat), averaging (Avg), single-head attention (Attn), and no exchanging (None). It is noted that we use the same network architecture as our Shift-SSD excluding the exchanging design and employ the same neighbor cluster selection strategy across experiments to ensure a fair comparison. Our CS achieves the best results, especially in challenging cases of Moderate and Hard.
Efficiency Study. It is shown in Tab. VII that our Shift-SSD is still lightweight and maintains a competitive efficiency among point-based detectors.
| Ex. Op. | |||
| None | 79.13 (-0.33) | 69.08 (-1.19) | 65.51 (-1.52) |
| Concat | 78.16 (-1.30) | 68.91 (-1.36) | 65.11 (-1.92) |
| Avg | 79.25 (-0.21) | 69.08 (-1.19) | 65.32 (-1.71) |
| Attn | 78.83 (-0.63) | 68.67 (-1.60) | 65.26 (-1.77) |
| CS | 79.46 | 70.27 | 67.03 |
V Conclusion
We have presented a novel point-based 3D detector that incorporates our proposed efficient Cross-Cluster Shifting module. This approach not only boosts efficiency but also enhances accuracy through its cross-cluster modeling capability. Diverging from traditional point-based object detectors, which extract features within confined regions, our Cross-Cluster Shifting facilitates seamless information exchange between clusters. Leveraging these advancements, our Shift-SSD outperforms its peers in terms of performance while retaining optimal inference efficiency among all existing point-based 3D methods.
Acknowledgement The authors are thankful for the financial support from the Hetao Shenzhen-HongKong Science and Technology Innovation Cooperation Zone (HZQB-KCZYZ-2021055), this work was also supported by Shenzhen Deeproute.ai Co., Ltd (HZQB-KCZYZ-2021055).
References
- [1] S. Shi, X. Wang, and H. Li, “Pointrcnn: 3d object proposal generation and detection from point cloud,” in Proceedings of the IEEE/CVF conference on computer vision and pattern recognition, 2019, pp. 770–779.
- [2] Z. Yang, Y. Sun, S. Liu, and J. Jia, “3dssd: Point-based 3d single stage object detector,” in Proceedings of the IEEE/CVF conference on computer vision and pattern recognition, 2020, pp. 11 040–11 048.
- [3] W. Shi and R. Rajkumar, “Point-gnn: Graph neural network for 3d object detection in a point cloud,” in Proceedings of the IEEE/CVF conference on computer vision and pattern recognition, 2020, pp. 1711–1719.
- [4] Y. Zhang, Q. Hu, G. Xu, Y. Ma, J. Wan, and Y. Guo, “Not all points are equal: Learning highly efficient point-based detectors for 3d lidar point clouds,” in Proceedings of the IEEE Conference on Computer Vision and Pattern Recognition, 2022.
- [5] Z. Yang, Y. Sun, S. Liu, X. Shen, and J. Jia, “Std: Sparse-to-dense 3d object detector for point cloud,” in Proceedings of the IEEE/CVF international conference on computer vision, 2019, pp. 1951–1960.
- [6] Y. Zhou and O. Tuzel, “Voxelnet: End-to-end learning for point cloud based 3d object detection,” in CVPR, 2018, pp. 4490–4499.
- [7] A. H. Lang, S. Vora, H. Caesar, L. Zhou, J. Yang, and O. Beijbom, “Pointpillars: Fast encoders for object detection from point clouds,” in Proceedings of the IEEE/CVF Conference on Computer Vision and Pattern Recognition, 2019, pp. 12 697–12 705.
- [8] T. Yin, X. Zhou, and P. Krahenbuhl, “Center-based 3d object detection and tracking,” in Proceedings of the IEEE/CVF conference on computer vision and pattern recognition, 2021, pp. 11 784–11 793.
- [9] M. Ye, S. Xu, and T. Cao, “Hvnet: Hybrid voxel network for lidar based 3d object detection,” in CVPR, 2020, pp. 1631–1640.
- [10] J. Deng, S. Shi, P. Li, W. Zhou, Y. Zhang, and H. Li, “Voxel r-cnn: Towards high performance voxel-based 3d object detection,” in Proceedings of the AAAI Conference on Artificial Intelligence, vol. 35, no. 2, 2021, pp. 1201–1209.
- [11] H. Kuang, B. Wang, J. An, M. Zhang, and Z. Zhang, “Voxel-fpn: Multi-scale voxel feature aggregation for 3d object detection from lidar point clouds,” Sensors, vol. 20, no. 3, p. 704, 2020.
- [12] D. Maturana and S. Scherer, “Voxnet: A 3d convolutional neural network for real-time object recognition,” in IROS. IEEE, 2015, pp. 922–928.
- [13] Y. Zhou, P. Sun, Y. Zhang, D. Anguelov, J. Gao, T. Ouyang, J. Guo, J. Ngiam, and V. Vasudevan, “End-to-end multi-view fusion for 3d object detection in lidar point clouds,” in Conference on Robot Learning. PMLR, 2020, pp. 923–932.
- [14] C. Chen, Z. Chen, J. Zhang, and D. Tao, “Sasa: Semantics-augmented set abstraction for point-based 3d object detection,” in Proceedings of the AAAI Conference on Artificial Intelligence, vol. 36, no. 1, 2022, pp. 221–229.
- [15] Q. Hu, B. Yang, L. Xie, S. Rosa, Y. Guo, Z. Wang, N. Trigoni, and A. Markham, “Randla-net: Efficient semantic segmentation of large-scale point clouds,” in CVPR, 2020, pp. 11 108–11 117.
- [16] C. R. Qi, L. Yi, H. Su, and L. J. Guibas, “Pointnet++: Deep hierarchical feature learning on point sets in a metric space,” Advances in neural information processing systems, vol. 30, 2017.
- [17] L. Fan, F. Wang, N. Wang, and Z. Zhang, “Fully Sparse 3D Object Detection,” arXiv preprint arXiv:2207.10035, 2022.
- [18] Y. Li, R. Bu, M. Sun, W. Wu, X. Di, and B. Chen, “Pointcnn: Convolution on x-transformed points,” Advances in neural information processing systems, vol. 31, pp. 820–830, 2018.
- [19] W. Wu, Z. Qi, and L. Fuxin, “Pointconv: Deep convolutional networks on 3d point clouds,” in CVPR, 2019, pp. 9621–9630.
- [20] X. Ma, C. Qin, H. You, H. Ran, and Y. Fu, “Rethinking network design and local geometry in point cloud: A simple residual mlp framework,” arXiv preprint arXiv:2202.07123, 2022.
- [21] G. Qian, Y. Li, H. Peng, J. Mai, H. A. A. K. Hammoud, M. Elhoseiny, and B. Ghanem, “Pointnext: Revisiting pointnet++ with improved training and scaling strategies,” arXiv preprint arXiv:2206.04670, 2022.
- [22] P. Sun, M. Tan, W. Wang, C. Liu, F. Xia, Z. Leng, and D. Anguelov, “Swformer: Sparse window transformer for 3d object detection in point clouds,” arXiv preprint arXiv:2210.07372, 2022.
- [23] S. Vora, A. H. Lang, B. Helou, and O. Beijbom, “Pointpainting: Sequential fusion for 3d object detection,” in Proceedings of the IEEE/CVF conference on computer vision and pattern recognition, 2020, pp. 4604–4612.
- [24] S. Shi, L. Jiang, J. Deng, Z. Wang, C. Guo, J. Shi, X. Wang, and H. Li, “Pv-rcnn++: Point-voxel feature set abstraction with local vector representation for 3d object detection,” arXiv preprint arXiv:2102.00463, 2021.
- [25] S. Shi, C. Guo, L. Jiang, Z. Wang, J. Shi, X. Wang, and H. Li, “Pv-rcnn: Point-voxel feature set abstraction for 3d object detection,” in Proceedings of the IEEE/CVF Conference on Computer Vision and Pattern Recognition, 2020, pp. 10 529–10 538.
- [26] X. Chen, H. Ma, J. Wan, B. Li, and T. Xia, “Multi-view 3d object detection network for autonomous driving,” in Proceedings of the IEEE conference on Computer Vision and Pattern Recognition, 2017, pp. 1907–1915.
- [27] Y. Yan, Y. Mao, and B. Li, “Second: Sparsely embedded convolutional detection,” Sensors, vol. 18, no. 10, p. 3337, 2018.
- [28] J. Lin, C. Gan, and S. Han, “Tsm: Temporal shift module for efficient video understanding,” in Proceedings of the IEEE/CVF International Conference on Computer Vision, 2019, pp. 7083–7093.
- [29] X. Zhang, X. Zhou, M. Lin, and J. Sun, “Shufflenet: An extremely efficient convolutional neural network for mobile devices,” in Proceedings of the IEEE conference on computer vision and pattern recognition, 2018, pp. 6848–6856.
- [30] A. Geiger, P. Lenz, C. Stiller, and R. Urtasun, “Vision meets robotics: The kitti dataset,” The International Journal of Robotics Research, vol. 32, no. 11, pp. 1231–1237, 2013.
- [31] P. Sun, H. Kretzschmar, X. Dotiwalla, A. Chouard, V. Patnaik, P. Tsui, J. Guo, Y. Zhou, Y. Chai, B. Caine, et al., “Scalability in perception for autonomous driving: Waymo open dataset,” in Proceedings of the IEEE/CVF conference on computer vision and pattern recognition, 2020, pp. 2446–2454.
- [32] H. Caesar, V. Bankiti, A. H. Lang, S. Vora, V. E. Liong, Q. Xu, A. Krishnan, Y. Pan, G. Baldan, and O. Beijbom, “nuscenes: A multimodal dataset for autonomous driving,” in CVPR, 2020, pp. 11 621–11 631.
- [33] Y. Chen, S. Liu, X. Shen, and J. Jia, “Fast point r-cnn,” in Proceedings of the IEEE/CVF international conference on computer vision, 2019, pp. 9775–9784.
- [34] T. Le and Y. Duan, “Pointgrid: A deep network for 3d shape understanding,” in CVPR, 2018, pp. 9204–9214.
- [35] C. R. Qi, W. Liu, C. Wu, H. Su, and L. J. Guibas, “Frustum pointnets for 3d object detection from rgb-d data,” in Proceedings of the IEEE conference on computer vision and pattern recognition, 2018, pp. 918–927.
- [36] Z. Wang and K. Jia, “Frustum convnet: Sliding frustums to aggregate local point-wise features for amodal 3d object detection,” in 2019 IEEE/RSJ International Conference on Intelligent Robots and Systems (IROS). IEEE, 2019, pp. 1742–1749.
- [37] B. Cheng, L. Sheng, S. Shi, M. Yang, and D. Xu, “Back-tracing representative points for voting-based 3d object detection in point clouds,” in Proceedings of the IEEE/CVF conference on computer vision and pattern recognition, 2021, pp. 8963–8972.
- [38] Y. Liu, B. Fan, S. Xiang, and C. Pan, “Relation-shape convolutional neural network for point cloud analysis,” in Proceedings of the IEEE/CVF conference on computer vision and pattern recognition, 2019, pp. 8895–8904.
- [39] H. Wang, S. Shi, Z. Yang, R. Fang, Q. Qian, H. Li, B. Schiele, and L. Wang, “Rbgnet: Ray-based grouping for 3d object detection,” in Proceedings of the IEEE/CVF Conference on Computer Vision and Pattern Recognition, 2022, pp. 1110–1119.
- [40] J. Yang, L. Song, S. Liu, Z. Li, X. Li, H. Sun, J. Sun, and N. Zheng, “Dbq-ssd: Dynamic ball query for efficient 3d object detection,” 2022.
- [41] C. R. Qi, O. Litany, K. He, and L. J. Guibas, “Deep hough voting for 3d object detection in point clouds,” in proceedings of the IEEE/CVF International Conference on Computer Vision, 2019, pp. 9277–9286.
- [42] W. Zheng, W. Tang, L. Jiang, and C.-W. Fu, “Se-ssd: Self-ensembling single-stage object detector from point cloud,” in Proceedings of the IEEE/CVF Conference on Computer Vision and Pattern Recognition, 2021, pp. 14 494–14 503.
- [43] Q. Chen, L. Sun, Z. Wang, K. Jia, and A. Yuille, “Object as hotspots: An anchor-free 3d object detection approach via firing of hotspots,” in Computer Vision–ECCV 2020: 16th European Conference, Glasgow, UK, August 23–28, 2020, Proceedings, Part XXI 16. Springer, 2020, pp. 68–84.
- [44] C. R. Qi, Y. Zhou, M. Najibi, P. Sun, K. Vo, B. Deng, and D. Anguelov, “Offboard 3d object detection from point cloud sequences,” in Proceedings of the IEEE/CVF Conference on Computer Vision and Pattern Recognition, 2021, pp. 6134–6144.
- [45] R. Ge, Z. Ding, Y. Hu, W. Shao, L. Huang, K. Li, and Q. Liu, “1st place solutions to the real-time 3d detection and the most efficient model of the waymo open dataset challenge 2021,” in IEEE/CVF Conference on Computer Vision and Pattern Recognition Workshops (CVPRW), vol. 1, 2021.
- [46] Y. Hu, Z. Ding, R. Ge, W. Shao, L. Huang, K. Li, and Q. Liu, “Afdetv2: Rethinking the necessity of the second stage for object detection from point clouds,” in Proceedings of the AAAI Conference on Artificial Intelligence, vol. 36, no. 1, 2022, pp. 969–979.
- [47] T. Yin, X. Zhou, and P. Krahenbuhl, “Centerpoint++ submission to the waymo real-time 3d detection challenge,” 2021.
- [48] Z. Yang, L. Jiang, Y. Sun, B. Schiele, and J. Jia, “A unified query-based paradigm for point cloud understanding,” in Proceedings of the IEEE/CVF Conference on Computer Vision and Pattern Recognition, 2022, pp. 8541–8551.
- [49] Z. Zhou, X. Zhao, Y. Wang, P. Wang, and H. Foroosh, “Centerformer: Center-based transformer for 3d object detection,” in European Conference on Computer Vision. Springer, 2022, pp. 496–513.
- [50] C. He, R. Li, S. Li, and L. Zhang, “Voxel set transformer: A set-to-set approach to 3d object detection from point clouds,” in Proceedings of the IEEE/CVF Conference on Computer Vision and Pattern Recognition, 2022, pp. 8417–8427.
- [51] H. Wang, S. Dong, S. Shi, A. Li, J. Li, Z. Li, L. Wang, et al., “Cagroup3d: Class-aware grouping for 3d object detection on point clouds,” Advances in Neural Information Processing Systems, vol. 35, pp. 29 975–29 988, 2022.
- [52] S. Dong, L. Ding, H. Wang, T. Xu, X. Xu, J. Wang, Z. Bian, Y. Wang, and J. Li, “Mssvt: Mixed-scale sparse voxel transformer for 3d object detection on point clouds,” Advances in Neural Information Processing Systems, vol. 35, pp. 11 615–11 628, 2022.
- [53] Z. Liu, X. Yang, H. Tang, S. Yang, and S. Han, “Flatformer: Flattened window attention for efficient point cloud transformer,” in Proceedings of the IEEE/CVF Conference on Computer Vision and Pattern Recognition, 2023, pp. 1200–1211.
- [54] Z. Liang, M. Zhang, Z. Zhang, X. Zhao, and S. Pu, “Rangercnn: Towards fast and accurate 3d object detection with range image representation,” arXiv preprint arXiv:2009.00206, 2020.
- [55] M. Ye, S. Xu, T. Cao, and Q. Chen, “Drinet: A dual-representation iterative learning network for point cloud segmentation,” in ICCV, 2021.
- [56] H. Tang, Z. Liu, S. Zhao, Y. Lin, J. Lin, H. Wang, and S. Han, “Searching efficient 3d architectures with sparse point-voxel convolution,” in ECCV. Springer, 2020, pp. 685–702.
- [57] J. Li, H. Dai, L. Shao, and Y. Ding, “From voxel to point: Iou-guided 3d object detection for point cloud with voxel-to-point decoder,” in Proceedings of the 29th ACM International Conference on Multimedia, 2021, pp. 4622–4631.
- [58] Z. Li, F. Wang, and N. Wang, “Lidar r-cnn: An efficient and universal 3d object detector,” in Proceedings of the IEEE/CVF Conference on Computer Vision and Pattern Recognition, 2021, pp. 7546–7555.
- [59] J. S. Hu, T. Kuai, and S. L. Waslander, “Point density-aware voxels for lidar 3d object detection,” in Proceedings of the IEEE/CVF Conference on Computer Vision and Pattern Recognition, 2022, pp. 8469–8478.
- [60] J. Mao, M. Niu, H. Bai, X. Liang, H. Xu, and C. Xu, “Pyramid r-cnn: Towards better performance and adaptability for 3d object detection,” in Proceedings of the IEEE/CVF International Conference on Computer Vision, 2021, pp. 2723–2732.
- [61] X. Chen, S. Shi, B. Zhu, K. C. Cheung, H. Xu, and H. Li, “Mppnet: Multi-frame feature intertwining with proxy points for 3d temporal object detection,” in European Conference on Computer Vision. Springer, 2022, pp. 680–697.
- [62] L. Fan, Y. C. Yang, F. Wang, N. long Wang, and Z. Zhang, “Super sparse 3d object detection,” IEEE Transactions on Pattern Analysis and Machine Intelligence, vol. 45, pp. 12 490–12 505, 2023. [Online]. Available: https://api.semanticscholar.org/CorpusID:255522740
- [63] L. Fan, F. Wang, N. long Wang, and Z. Zhang, “Fsd v2: Improving fully sparse 3d object detection with virtual voxels,” ArXiv, vol. abs/2308.03755, 2023. [Online]. Available: https://api.semanticscholar.org/CorpusID:260680286
- [64] Y. Chen, Y. Li, X. Zhang, J. Sun, and J. Jia, “Focal sparse convolutional networks for 3d object detection,” in Proceedings of the IEEE/CVF Conference on Computer Vision and Pattern Recognition, 2022, pp. 5428–5437.
- [65] B. Graham, M. Engelcke, and L. V. D. Maaten, “3d semantic segmentation with submanifold sparse convolutional networks,” in CVPR, 2018.
- [66] L. Fan, Z. Pang, T. Zhang, Y.-X. Wang, H. Zhao, F. Wang, N. Wang, and Z. Zhang, “Embracing single stride 3d object detector with sparse transformer,” in Proceedings of the IEEE/CVF Conference on Computer Vision and Pattern Recognition, 2022, pp. 8458–8468.
- [67] T. Guan, J. Wang, S. Lan, R. Chandra, Z. Wu, L. Davis, and D. Manocha, “M3detr: Multi-representation, multi-scale, mutual-relation 3d object detection with transformers,” in Proceedings of the IEEE/CVF Winter Conference on Applications of Computer Vision, 2022, pp. 772–782.
- [68] J. Mao, Y. Xue, M. Niu, H. Bai, J. Feng, X. Liang, H. Xu, and C. Xu, “Voxel transformer for 3d object detection,” in Proceedings of the IEEE/CVF International Conference on Computer Vision, 2021, pp. 3164–3173.
- [69] H. Wu, C. Wen, S. Shi, X. Li, and C. Wang, “Virtual sparse convolution for multimodal 3d object detection,” in Proceedings of the IEEE/CVF Conference on Computer Vision and Pattern Recognition, 2023, pp. 21 653–21 662.
- [70] X. Chen, T. Zhang, Y. Wang, Y. Wang, and H. Zhao, “Futr3d: A unified sensor fusion framework for 3d detection,” in Proceedings of the IEEE/CVF Conference on Computer Vision and Pattern Recognition, 2023, pp. 172–181.
- [71] H. Wang, H. Tang, S. Shi, A. Li, Z. Li, B. Schiele, and L. Wang, “Unitr: A unified and efficient multi-modal transformer for bird’s-eye-view representation,” arXiv preprint arXiv:2308.07732, 2023.
- [72] C. R. Qi, H. Su, K. Mo, and L. J. Guibas, “Pointnet: Deep learning on point sets for 3d classification and segmentation,” in Proceedings of the IEEE conference on computer vision and pattern recognition, 2017, pp. 652–660.
- [73] S. Shi, Z. Wang, J. Shi, X. Wang, and H. Li, “From points to parts: 3D object detection from point cloud with part-aware and part-aggregation network,” IEEE TPAMI, 2020.
- [74] C. He, H. Zeng, J. Huang, X.-S. Hua, and L. Zhang, “Structure aware single-stage 3D object detection from point cloud,” in CVPR, 2020, pp. 11 873–11 882.
- [75] Z. Liu, X. Zhao, T. Huang, R. Hu, Y. Zhou, and X. Bai, “Tanet: Robust 3D object detection from point clouds with triple attention,” in AAAI, 2020, pp. 11 677–11 684.
- [76] J. Noh, S. Lee, and B. Ham, “Hvpr: Hybrid voxel-point representation for single-stage 3D object detection,” in CVPR, 2021.
- [77] T. Jiang, N. Song, H. Liu, R. Yin, Y. Gong, and J. Yao, “Vic-net: Voxelization information compensation network for pointcloud 3D object detection,” in ICRA, 2021.
- [78] D. P. Kingma and J. Ba, “Adam: A method for stochastic optimization,” in ICLR, 2015.
- [79] L. N. Smith and N. Topin, “Super-convergence: very fast training of neural networks using large learning rates,” in Defense + Commercial Sensing, 2019.