22email: {zhuyaoyao19,caixiuding20,wangxueyao221}@mails.ucas.ac.cn,casitmed2022@163.com
Bayesian Random Semantic Data Augmentation for Medical Image Classification
Abstract
Data augmentation is a critical regularization technique for deep neural networks, particularly in medical image classification. Popular data augmentation approaches include image transformation-based methods, generative data augmentation, and automatic data augmentation. However, these approaches encounter notable limitations: image transformation-based and automated data augmentation techniques cannot implement semantic transformations, leading to a constrained variety of augmented samples, and generative data augmentation methods are computationally expensive. In response to these challenges, we proposed Bayesian Random Semantic Data Augmentation (BRSDA), a novel, efficient, and plug-and-play semantic data augmentation method. BRSDA is motivated by a simple translation in the feature space along specific directions that can effectuate semantic transformations. When given a feature, we define its augmentable semantic magnitude as a random variable and estimate its distribution using variational Bayesian, then sample semantic magnitude and add to the randomly selected semantic direction to achieve semantic data augmentation. We demonstrate the effectiveness of BRSDA on five 2D and six 3D medical image datasets covering nine modalities. We also test BRSDA with mainstream neural network architectures, showcasing its robustness. Furthermore, combining BRSDA with other leading data augmentation methods achieves superior performance. Code is available online at https://github.com/YaoyaoZhu19/BRSDA.
Keywords:
Data Augmentation Medical Image Variational Bayesian.1 Introduction
Data augmentation is a common regularization technique used to address the overfitting problem during the training process of deep neural networks, widely applied in medical image classification [15, 23]. Although methods based on image transformations (such as cropping, mirroring, rotation, and color jittering) and automatic data augmentation methods (such as AA [4], RA [5], etc.) can increase the diversity of the dataset to some extent, they mainly achieve this through simple geometric or pixel-level transformations, limiting their ability to perform complex semantic transformations [25]. Generative data augmentation methods [8, 22], especially those based on Generative Adversarial Networks [3, 12] or diffusion models [17, 19], offer a powerful solution capable of performing complex semantic transformations and significantly increasing data diversity, such as changing images’ background or foreground textures. However, generative methods are computationally expensive and inconvenient to use.
Recent works have underscored the enhanced efficacy of data augmentation when applied within the feature space [2, 10, 13, 24]. In detail, the deep feature space harbors various semantic directions, and shift features along these directions yields new sample features with identical class identities but alter semantic content [25]. The ISDA [25] stands out in this domain, facilitating implicit data augmentation by aiming to minimize an upper bound of the expected cross-entropy loss on the augmented dataset. Unlike traditional methods that modify images directly, this approach generated new data at the feature level, such as operating random disturbances, interpolations, or extrapolations within the feature space for augmentation [6]. In medical images, there are numerous modalities with non-uniform dimensions. The computational cost of generative data augmentation methods is high. However, the effectiveness of techniques based on image transformation could be more satisfactory. Semantic data augmentation holds promise in addressing the shortcomings of both approaches. To our knowledge, there is currently no published literature on semantic data augmentation methods within medical image classification.
To develop a universal semantic augmentation paradigm for medical image classification, we drew inspiration from the automatic augmentation method: RA [5], defining a semantic data augmentation strategy incorporating two hyperparameters: semantic magnitude and semantic direction. Inspired by the concept that modeling data augmentation as additive perturbation can enhance network learning and generalization capabilities [14], we define a semantic data augmentation method as the addition of semantic magnitude to the original feature in randomly selected semantic direction. For example, in the tumor staging task, a feature represents the semantics of tumor size, and we change the tumor size by changing the feature value. However, alterations beyond the permissible range within the category may result in label changes. Therefore, we treat the augmentable (label-preserving) semantic magnitude as a random variable and estimate its distribution using variational Bayesian. For semantic directions, similar to the image space augmentation approache [7], it is a naive idea to select semantic directions randomly, but it does not make sense to perform augmentation in certain directions [25], a view based on image space. Some data augmentation approaches [8, 28] are adequate for downstream tasks, although they do not make sense vision, and the quantitative evaluation approaches proposed in [27] explain why vision meaningless data augmentation approaches are still practical. Not coincidentally, [13] point out that adding a random Gaussian perturbation to the features significantly improves the Empirical Risk Minimization (ERM), although it does not follow any meaningful direction. Even the perturbation of randomness due to the reparameterization introduced by variational inference benefits the network’s learning of features [13]. Therefore, we do not augment all directions but randomly select semantic directions like the random selection transform in image space.
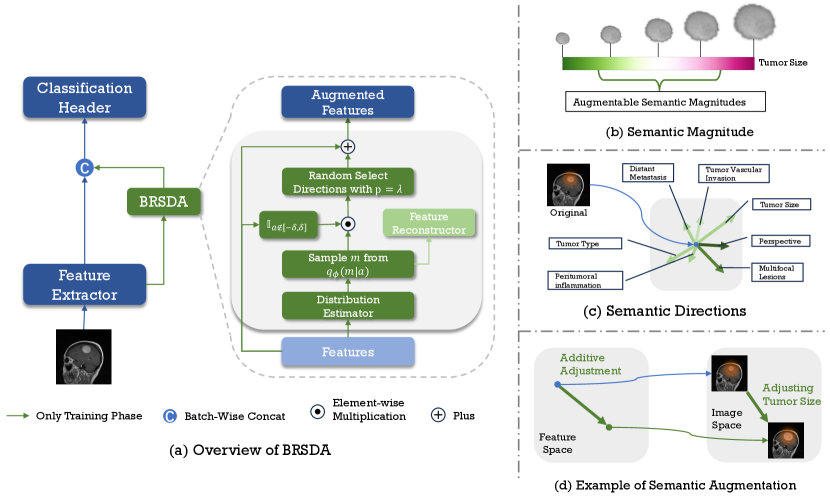
We proposed Bayesian Random Semantic Data Augmentation (BRSDA), a method for deep neural network training in medical image classification. BRSDA generates new data by sampling semantic magnitude from augmentable semantic magnitude distribution, randomly choosing semantic directions, and adding magnitude to the original feature. Figure 1 illustrates the BRSDA approaches. Our main contributions are listed below:
-
1.
We propose a high-performance, plug-and-play Bayesian random semantic data augmentation module, BRSDA, for medical image classification.
-
2.
BRSDA improves network performance in medical image classification tasks with different dimensions, modalities, and neural network architectures.
-
3.
We provide experiments that show BRSDA can significantly elevate network performance in conjunction with other data augmentation methods.
2 Method
Consideraing training a deep neural network included two parts: a feature extraction network and a classification network with parameters on a dataset , where each represents a label belonging to one of classes. The output of is a dimensions feature vector , which is then input into to predict the target , where is the predicted class label. We refer to as the original feature vector for clarity.
2.0.1 BRSDA
The BRSDA method generates augmented feature by adding the semantic magnitude to the original feature after element-wise multiplication of them with randomly selected semantic directions . The formula is as follows:
| (1) |
where is a binary vector, initially set to all ones and then set to zero with probability . represents the semantic magnitude sampled from the augmentable magnitude distribution when given the original feature vector . Furthermore, to preserve specific properties of the features, such as low rank, we mask semantic directions corresponding to zero feature values. We have:
| (2) |
where is an indicator function when , the value of this function is 1.
2.0.2 Estimate the magnitude distribution
To obtain , we introduce a model to approximate the true distribution . The Kullback-Leibler (KL) divergence measures the similarity between these two distributions, aiming to make closely match by maximizing the KL divergence. Thus, our optimization goal is as follows:
| (3) |
Removing the terms that are not related to the parameter in , we have:
| (4) |
2.0.3 The loss of BRSDA
The first term of Eq. 4 can be calculated easily. The second term estimates the features given , which is more challenging to compute. Drawing inspiration from the design of Variational Autoencoders (VAE) [11], we introduce a reconstruction network for learning this term, rewriting the second term as . Then, we obtain the loss function of BRSDA as follows:
| (5) |
The second part of Eq. 5 depends on the model, and we use MSE loss in BRSDA. Assuming the marginal distribution follows a normal distribution and also follows a normal distribution , setting the mean to zero because we aim to learn the offset relative to the original rather than the augmented feature. Thus, the loss function of BRSDA is given by:
| (6) |
where is estimated variance of BRSDA, and is reconstructed feature using .
2.0.4 Relationship with VAE
Our approach resembles VAE [11], where a latent variable is estimated and used for reconstruction. However, the relationship between our latent variable and the inputs differs from VAE [11], the latent variable representation of the inputs in VAE [11]. Our latent variable represents the augmentable range in a given feature without altering the label.
2.0.5 The reparameterization trick
We employ the reparameterization trick to facilitate the computation of the loss function while ensuring the gradient flow for effective backpropagation. The random variable can be represented as a deterministic variable , with being an auxiliary variable with an independent marginal distribution , and being a vector-valued function parameterized by .
2.0.6 Loss function
Our augmentation method is training with . For convenience, we denote the loss of as , which typically uses cross-entropy loss in classification tasks. Therefore, the total loss function is:
| (7) |
Different superscripts on distinguish between augmented and original features. The hyperparameter is a dynamic value introduced to mitigate the impact of BRSDA on the network during the initial stages of training when the network has yet to learn valuable features.
In summary, the BRSDA method can be plugged into deep networks. We present the pseudo-code of BRSDA in Algorithm 1.
3 Experiments
Our evaluation strategy encompassed several vital aspects: effectiveness across modalities and dimensions, adaptability to convolutional neural networks, and comparison and combination with non-semantic data augmentation methods. Area under ROC curve (AUC) and Accuracy (ACC) are used as the evaluation metrics. Moreover, we report the results of the parameters ablation study, parameter sensitivity tests, and feature visualization in Appendix A.
3.1 Datasets and Training Details
3.1.1 Dataset
3.1.2 Training Details
We implemented BRSDA using PyTorch and experimented on an NVIDIA RTX 4090 GPU. During training, we utilized the AdamW [16] optimizer with a learning rate of 0.001, resized all 2D images to and 3D images to , and we employed a learning rate warm-up for the first five epochs followed by a cosine annealing learning rate decay strategy. To ensure fairness, we maintain consistent training configurations across all experiments. The distribution estimator and reconstruction modules of BRSDA comprise two fully connected layers followed by BatchNorm and GeLU activation. Additional details about hyperparameters of networks and BRSDA can be found in Appendix B.
3.2 Results
3.2.1 Results of dataset
| Dataset | AUC% | ACC% | Modality | ||
| Baseline | BRSDA | Baseline | BRSDA | ||
| BreastMNIST [26] | Breast Ultrasound | ||||
| RetinaMNIST [26] | Fundus Camera | ||||
| LUNG [20] | X-Ray | ||||
| BTMRI [18] | MRI | ||||
| CATAR [1] | Camera | ||||
| OrganMNIST3D [26] | CT | ||||
| NoduleMNIST3D [26] | CT | ||||
| AdernalMNIST3D [26] | Shape from CT | ||||
| FractureMNIST3D [26] | CT | ||||
| VesselMNIST3D [26] | Shape from MRI | ||||
| SynapseMNIST3D [26] | Electron Microscope | ||||
Table 1 demonstrates that BRSDA improves the AUC of the model in all cases. For instance, when the network is equipped with the BRSDA module, AUC and accuracy increase on the BreastMNIST [26] dataset. BRSDA also performs excellently on 3D datasets, such as SynapseMNIST3D [26], increasing AUC and accuracy. On the other hand, for datasets like BTMRI [18], CATAR [1], and OrganMNIST3D [26], the improvement appears marginal. The baseline results were already high, and further gains were limited. In the case of BTMRI and NoduleMNIST3D, we observed an adverse change in accuracy. It happens because the dataset is not perfectly balanced. Meanwhile, AUC is unaffected by the decision threshold, while ACC is affected by the threshold.
| Network | AUC % | ACC % | Additional Time % | ||
|---|---|---|---|---|---|
| Baseline | BRSDA | Baseline | BRSDA | ||
| ResNet-18 [7] | |||||
| ResNet-50 [7] | |||||
| EfficientNet-B0 [21] | |||||
| DenseNet-121 [9] | |||||
| Method | AUC % | ACC % | ||||||
|---|---|---|---|---|---|---|---|---|
| MA | RA | AA | AM | MA | RA | AA | AM | |
| Baseline | ||||||||
| ISDA [25] | ||||||||
| BRSDA | ||||||||
| ISDA+BRSDA | ||||||||
3.2.2 Results of network architectures
In Table 2, we report the results of testing on the BreastMNIST [26] dataset using mainstream deep convolutional neural network architectures. BRSDA enhances the performance across various network architectures. Notably, Adding the BRSDA module to baseline EfficientNet-B0 improves performance. This improvement might be attributed to overfitting during the training of the baseline EfficientNet-B0. After all, its performance was lower than the baseline of the other networks. Therefore, BRSDA helps mitigate overfitting and provides evidence that BRSDA is a regularization technique. The cost of all improvement is an increase in training time of less than 4%. The results for ResNet-18 [7] are better than those for ResNet-50 [7], which aligns with the results reported in the original MedMNISTv2 [26] paper.
3.2.3 Result of methods
Table 3 displays the experimental results of BRSDA and ISDA combining other data augmentation methods. The results of BRSDA (third row) and ISDA (second row) experiments suggest that semantic data augmentation methods can enhance non-semantic data augmentation techniques in most situations, collectively aiding networks in learning better features. Interestingly, in the experiments based on Random Augmentation (RA), the addition of semantic data augmentation leads to a decline in results, but combining ISDA and BRSDA can increase the AUC of the model. Table 3 demonstrates that combining BRSDA and ISDA can complement both deficiencies to achieve better results. The last row shows that the AUC metric performs best when training with three methods (ISDA, BRSDA, and non-semantic data augmentation methods). As with Table 1, AUC increases, but ACC decreases for the same reason.
4 Conclusion
This paper introduces an efficient, plug-and-play Bayesian Random Semantic Data Augmentation (BRSDA) method for medical image classification. BRSDA generates new samples in feature space, which will be more efficient and easy to implement. We experimentally demonstrate the effectiveness and efficiency of BRSDA on different modalities, different dimensional datasets, and different networks. Furthermore, we show that integrating BRSDA with other data augmentation techniques, including ISDA, can significantly elevate model performance.
References
- [1] Cataract dataset. https://www.kaggle.com/datasets/nandanp6/cataract-image-dataset (2024), accessed: 2024-01-28
- [2] Ahn, E., Kumar, A., Fulham, M., Feng, D., Kim, J.: Unsupervised domain adaptation to classify medical images using zero-bias convolutional auto-encoders and context-based feature augmentation. IEEE Transactions on Medical Imaging 39(7), 2385–2394 (2020). https://doi.org/10.1109/TMI.2020.2971258
- [3] Chai, L., Wang, Z., Chen, J., Zhang, G., Alsaadi, F.E., Alsaadi, F.E., Liu, Q.: Synthetic augmentation for semantic segmentation of class imbalanced biomedical images: A data pair generative adversarial network approach. Computers in Biology and Medicine 150, 105985 (2022)
- [4] Cubuk, E.D., Zoph, B., Mané, D., Vasudevan, V., Le, Q.V.: Autoaugment: Learning augmentation strategies from data. In: 2019 IEEE/CVF Conference on Computer Vision and Pattern Recognition (CVPR). pp. 113–123 (2019). https://doi.org/10.1109/CVPR.2019.00020
- [5] Cubuk, E.D., Zoph, B., Shlens, J., Le, Q.V.: Randaugment: Practical automated data augmentation with a reduced search space. In: 2020 IEEE/CVF Conference on Computer Vision and Pattern Recognition Workshops (CVPRW). pp. 3008–3017 (2020). https://doi.org/10.1109/CVPRW50498.2020.00359
- [6] DeVries, T., Taylor, G.W.: Dataset augmentation in feature space. arXiv preprint arXiv:1702.05538 (2017)
- [7] He, K., Zhang, X., Ren, S., Sun, J.: Deep residual learning for image recognition. In: Proceedings of the IEEE conference on computer vision and pattern recognition. pp. 770–778 (2016)
- [8] Hendrycks, D., Mu, N., Cubuk, E.D., Zoph, B., Gilmer, J., Lakshminarayanan, B.: AugMix: A simple data processing method to improve robustness and uncertainty. Proceedings of the International Conference on Learning Representations (ICLR) (2020)
- [9] Huang, G., Liu, Z., Van Der Maaten, L., Weinberger, K.Q.: Densely connected convolutional networks. In: Proceedings of the IEEE conference on computer vision and pattern recognition. pp. 4700–4708 (2017)
- [10] Kang, Y., Zhao, X., Zhang, Y., Li, H., Wang, G., Cui, L., Xing, Y., Feng, J., Yang, L.: Improving domain generalization performance for medical image segmentation via random feature augmentation. Methods 218, 149–157 (Oct 2023). https://doi.org/10.1016/j.ymeth.2023.08.003, https://www.sciencedirect.com/science/article/pii/S1046202323001329
- [11] Kingma, D.P., Welling, M.: Auto-encoding variational bayes. arXiv preprint arXiv:1312.6114 (2013)
- [12] Li, D., Yang, J., Kreis, K., Torralba, A., Fidler, S.: Semantic segmentation with generative models: Semi-supervised learning and strong out-of-domain generalization. In: Proceedings of the IEEE/CVF Conference on Computer Vision and Pattern Recognition. pp. 8300–8311 (2021)
- [13] Li, P., Li, D., Li, W., Gong, S., Fu, Y., Hospedales, T.M.: A simple feature augmentation for domain generalization. In: 2021 IEEE/CVF International Conference on Computer Vision (ICCV). pp. 8866–8875 (2021). https://doi.org/10.1109/ICCV48922.2021.00876
- [14] Liu, T.Y., Mirzasoleiman, B.: Data-efficient augmentation for training neural networks. In: Koyejo, S., Mohamed, S., Agarwal, A., Belgrave, D., Cho, K., Oh, A. (eds.) Advances in Neural Information Processing Systems. vol. 35, pp. 5124–5136. Curran Associates, Inc. (2022), https://proceedings.neurips.cc/paper_files/paper/2022/file/2130b8a44e2e28e25dc7d0ee4eb6d9cf-Paper-Conference.pdf
- [15] Liu, Z., Lv, Q., Li, Y., Yang, Z., Shen, L.: Medaugment: Universal automatic data augmentation plug-in for medical image analysis. ArXiv abs/2306.17466 (2023), https://api.semanticscholar.org/CorpusID:259309293
- [16] Loshchilov, I., Hutter, F.: Decoupled weight decay regularization. arXiv preprint arXiv:1711.05101 (2017)
- [17] Moghadam, P.A., Van Dalen, S., Martin, K.C., Lennerz, J., Yip, S., Farahani, H., Bashashati, A.: A morphology focused diffusion probabilistic model for synthesis of histopathology images. In: Proceedings of the IEEE/CVF Winter Conference on Applications of Computer Vision. pp. 2000–2009 (2023)
- [18] Nickparvar, M.: Brain tumor mri dataset (2021). https://doi.org/10.34740/KAGGLE/DSV/2645886, https://www.kaggle.com/dsv/2645886
- [19] Pinaya, W.H., Tudosiu, P.D., Dafflon, J., Da Costa, P.F., Fernandez, V., Nachev, P., Ourselin, S., Cardoso, M.J.: Brain imaging generation with latent diffusion models. In: MICCAI Workshop on Deep Generative Models. pp. 117–126. Springer (2022)
- [20] Tahir, A.M., Qiblawey, Y., Khandakar, A., Rahman, T., Khurshid, U., Musharavati, F., Islam, M., Kiranyaz, S., Al-Maadeed, S., Chowdhury, M.E.: Deep learning for reliable classification of covid-19, mers, and sars from chest x-ray images. Cognitive Computation pp. 1–21 (2022)
- [21] Tan, M., Le, Q.: Efficientnet: Rethinking model scaling for convolutional neural networks. In: International conference on machine learning. pp. 6105–6114. PMLR (2019)
- [22] Tran, T., Pham, T., Carneiro, G., Palmer, L., Reid, I.: A bayesian data augmentation approach for learning deep models. Advances in neural information processing systems 30 (2017)
- [23] Vu, Y.N.T., Wang, R., Balachandar, N., Liu, C., Ng, A.Y., Rajpurkar, P.: Medaug: Contrastive learning leveraging patient metadata improves representations for chest x-ray interpretation. In: Machine Learning for Healthcare Conference. pp. 755–769. PMLR (2021)
- [24] Wang, M., Yuan, J., Qian, Q., Wang, Z., Li, H.: Semantic data augmentation based distance metric learning for domain generalization. In: Proceedings of the 30th ACM International Conference on Multimedia. p. 3214–3223. MM ’22, Association for Computing Machinery, New York, NY, USA (2022). https://doi.org/10.1145/3503161.3547866, https://doi.org/10.1145/3503161.3547866
- [25] Wang, Y., Huang, G., Song, S., Pan, X., Xia, Y., Wu, C.: Regularizing deep networks with semantic data augmentation. IEEE Transactions on Pattern Analysis and Machine Intelligence 44(7), 3733–3748 (2022). https://doi.org/10.1109/TPAMI.2021.3052951
- [26] Yang, J., Shi, R., Wei, D., Liu, Z., Zhao, L., Ke, B., Pfister, H., Ni, B.: MedMNIST v2 - A large-scale lightweight benchmark for 2D and 3D biomedical image classification. Scientific Data 10(1), 41 (Jan 2023). https://doi.org/10.1038/s41597-022-01721-8, https://doi.org/10.1038/s41597-022-01721-8
- [27] Yang, S., Guo, S., Zhao, J., Shen, F.: Investigating the effectiveness of data augmentation from similarity and diversity: An empirical study. Pattern Recognition 148, 110204 (2024)
- [28] Yun, S., Han, D., Chun, S., Oh, S.J., Yoo, Y., Choe, J.: Cutmix: Regularization strategy to train strong classifiers with localizable features. In: 2019 IEEE/CVF International Conference on Computer Vision (ICCV). pp. 6022–6031 (2019). https://doi.org/10.1109/ICCV.2019.00612
5 Appendix A
6 Appendix B
| Dataset | Modality | Tasks (Labels) | Samples | Train/Val/Test |
|---|---|---|---|---|
| BreastMNIST | Breast Ultrasound | Binary-Class (2) | 780 | 546/78/156 |
| RetinaMNIST | Fundus Camera | Ordinal Regression (5) | 1,600 | 1,080/120/400 |
| LUNG | X-Ray | Multi-Class (3) | 701 | 419/141/141 |
| BTMRI | MRI | Multi-Class (4) | 7,023 | 4,568/1,144/1,311 |
| CATAR | Camera | Multi-Class (2) | 612 | 392/99/121 |
| OrganMNIST3D | Abdominal CT | Multi-Class (11) | 1,742 | 971/161/610 |
| NoduleMNIST3D | Chest CT | Binary-Class (2) | 1,633 | 1,158/165/310 |
| AdrenalMNIST3D | Abdominal CT | Binary-Class (2) | 1,584 | 1,188/98/298 |
| FractureMNIST3D | Chest CT | Multi-Class (3) | 1,370 | 1,027/103/240 |
| VesselMNIST3D | Brain MRA | Binary-Class (2) | 1,908 | 1,335/191/382 |
| SynapseMNIST3D | Electron Microscope | Binary-Class (2) | 1,759 | 1,230/177/352 |
| Dataset | Networks | Time % | Explanation | |||
| BreastMNIST | ResNet-18 | 1.75 | 0.6 | 7 | 0.5 | |
| BreastMNIST | ResNet-50 | 3.02 | 0.6 | 7 | 0.5 | |
| BreastMNIST | EfficientNet-B0 | 3.22 | 0.6 | 7 | 0.5 | |
| BreastMNIST | DenseNet-121 | 1.73 | 0.6 | 10 | 0.5 | |
| RetinaMNIST | ResNet-18 | 2.06 | 0.6 | 10 | 0.5 | |
| LUNG | ResNet-18 | 2.79 | 0.8 | 10 | 0.5 | |
| BTMRI | ResNet-18 | 1.32 | 0.8 | 10 | 0.5 | |
| CATAR | ResNet-18 | 0.59 | 0.9 | 10 | 0.5 | |
| OrganMNIST3D | ResNet-18 | -0.07 | 0.8 | 10 | 0.5 | |
| NoduleMNIST3D | ResNet-18 | 0.14 | 0.9 | 10 | 0.5 | |
| AdernalMNIST3D | ResNet-18 | 0.24 | 0.9 | 10 | 0.5 | |
| FractureMNIST3D | ResNet-18 | 0.27 | 0.5 | 10 | 0.5 | |
| VesselMNIST3D | ResNet-18 | 0.18 | 0.8 | 10 | 0.5 | |
| SynapseMNIST3D | ResNet-18 | 0.51 | 0.4 | 10 | 0.5 | |
| LUNG | ResNet-18 | 2.79 | 0.1 | 10 | 0.5 | ISDA+BRSDA+MedAug |
| LUNG | ResNet-18 | 2.79 | 0.9 | 10 | 0.5 | ISDA+BRSDA+RA |
| LUNG | ResNet-18 | 2.79 | 0.9 | 10 | 0.5 | ISDA+BRSDA+AA |
| LUNG | ResNet-18 | 2.79 | 0.9 | 10 | 0.5 | ISDA+BRSDA+AugMix |