Expected Performance of Cosmic Muon Veto Detector
Abstract
The India-Based Neutrino Observatory (INO) collaboration houses the miniICAL detector, at the transit campus of IICHEP, Madurai, India, which serves as a prototype-detector of the larger Iron-Calorimeter detector (ICAL). The purpose of miniICAL lies in unraveling the intricate engineering challenges inherent in constructing a substantial ICAL-type detector. To explore the feasibility of building a large-scale neutrino experiment at shallow depths the collaboration has embarked upon the construction of a Cosmic Muon Veto Detector (CMVD) around the miniICAL detector. The primary objective of this endeavor revolves around attaining a veto efficiency surpassing , while simultaneously maintaining a false-positive rate lower than .
The CMVD system is based on extruded plastic scintillators (EPS) and utilizes wavelength-shifting fibers to collect scintillation photons and uses silicon photomultipliers (SiPMs) as photo-transducers. The expected performance of the CMVD is estimated using simulated muon tracks in the miniICAL stack taking into account efficiency, multiplicity of RPC detectors from the miniICAL data as well as the noise of SiPM, observed SiPM spectra and time resolution due to cosmic muon along the whole length of EPS etc.
The CMVD experiment is a crucial step in the larger context of neutrino research, by increasing the veto efficiency of cosmic muons, the CMVD experiment helps to pave the way for future large-scale shallow-depth neutrino experiments, providing valuable insights into the study of neutrinos and their properties.
1 Introduction
The proposed 51 kton magnetized Iron Calorimeter (ICAL) at the India-based Neutrino Observatory (INO) has the objective of accurately measuring the parameters of atmospheric neutrinos and studying the impact of matter on their oscillations. The underground laboratory, along with ICAL, is planned to be located in Bodi West hills, Theni, India and is equipped with a rock cover of over 1 km to reduce the background from cosmic-ray muons.
To mitigate the interference from cosmic-ray muons, the detector must be placed under a rock cover of 1.3 km in all directions to reduce the cosmic muon flux by a factor of about .
Placing the detector at a depth of approximately 100 m reduces the muon flux by a factor of . To achieve a reduction factor of about , an active Cosmic Muon Veto Detector (CMVD) system with an efficiency of must be built around the shallow depth detector.
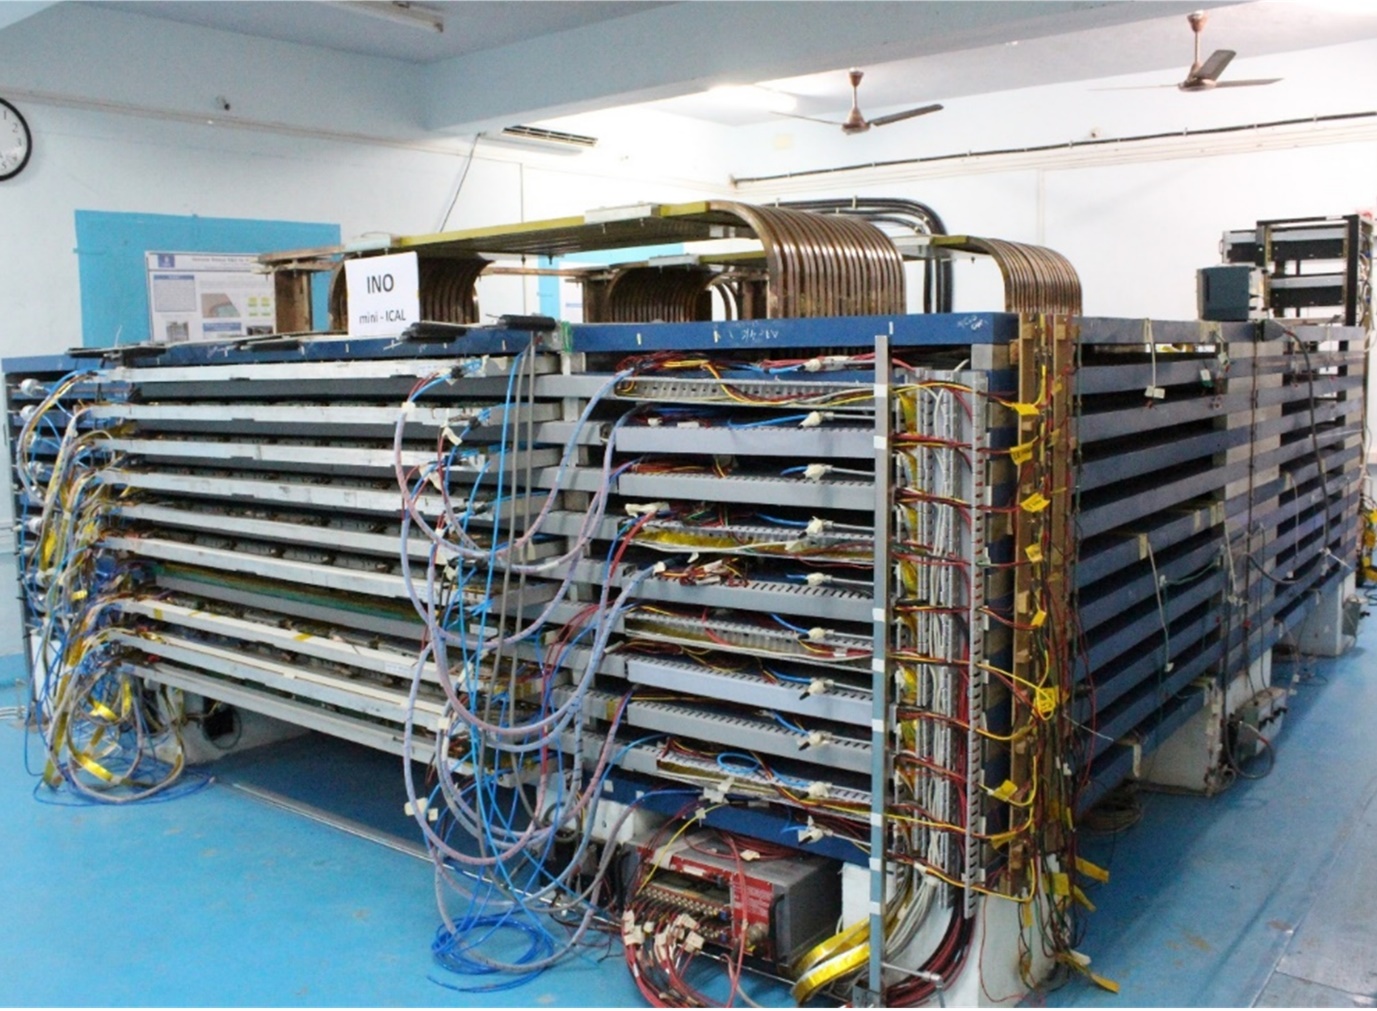
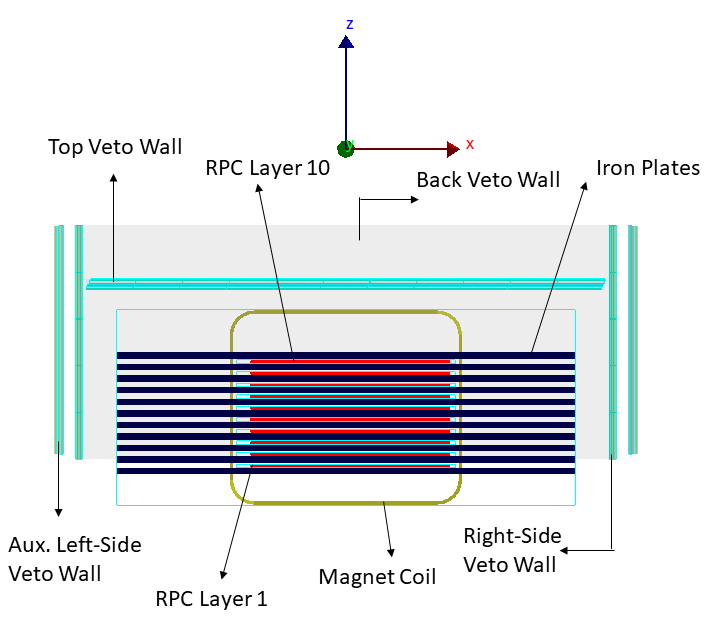
The miniICAL is a prototype of the larger ICAL, operating at IICHEP Madurai. The miniICAL is a magnetized 85-ton detector consisting of 10 RPC layers between eleven, iron plate [1] and a view of that system is shown
in figure 2.
To study the performance of shallow depth neutrino detectors, the plan is to build a cosmic muon veto detector (CMVD) on top of the existing miniICAL detector as shown in figure 2. The upgrade is motivated by a previous successful demonstration of 99.98% muon veto efficiency using a a veto system made from scintillator detectors with PMT as photo-sensors. [2].
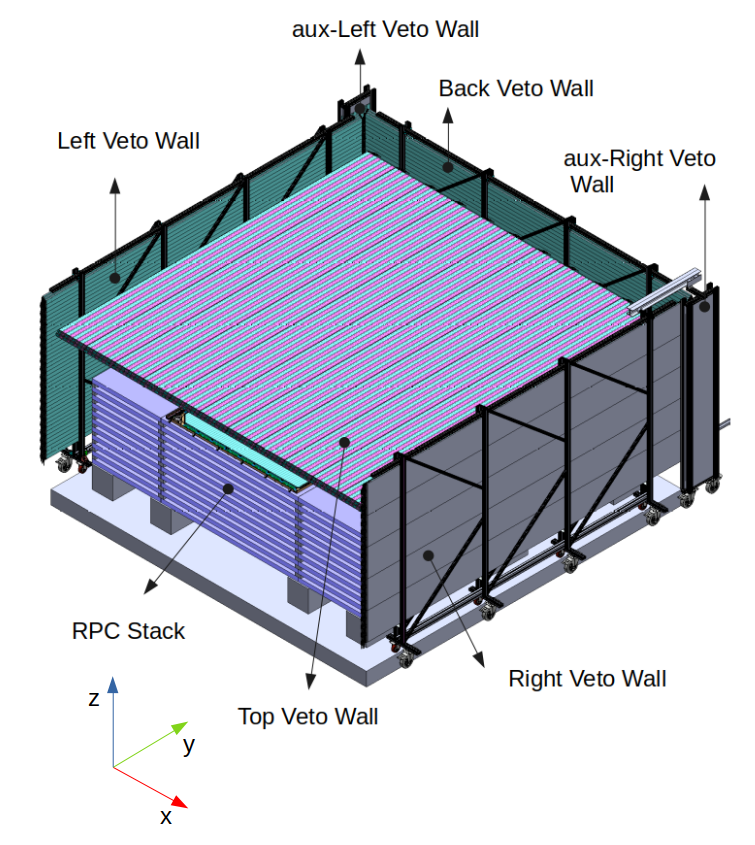
The cosmic muon veto detector around miniICAL consists of four large-sized veto walls, placed on top and three sides of the existing miniICAL detector. It utilises extruded plastic scintillator strips (EPS) [3], viz. scintillators, with dimensions optimized for maximum coverage. The veto layers are arranged in a staggered configuration to remove the dead space between scintillators, allowing for maximum efficiency.
The scintillation light produced by incoming particles will be collected through Kuraray Y-11 wavelength shifting fibers (WLS) [4] embedded in the scintillator strips and read out on both sides using Hamamatsu Silicon Photomultiplier (SiPM) S13360-2050VE [5].
The paper is organized into sections, each dedicated to a different aspect of the CMVD design and performance. In Section 2, the geometry of the CMVD is outlined, including dimensions, composition, and arrangement. Section 3 details the generation of cosmic muon events and the trigger criteria used to identify them. Section 4 focuses on the digitization of SiPM signals, used to detect scintillation light propagated through the WLS fiber. This section also explains how the SiPM signal is modeled using the position and energy deposited inside the plastic scintillator. The track reconstruction and extrapolation techniques used to determine the path of cosmic muons through the CMVD are described in Section 6. The algorithms and methods used to identify and reconstruct muon tracks and the steps taken to extrapolate these tracks towards the CMVD are discussed. Section 8 defines the effect size of the veto walls. The expected performance of the veto detector is presented in Section 9 and then conclusion is given in section 10.
2 Detector Geometry
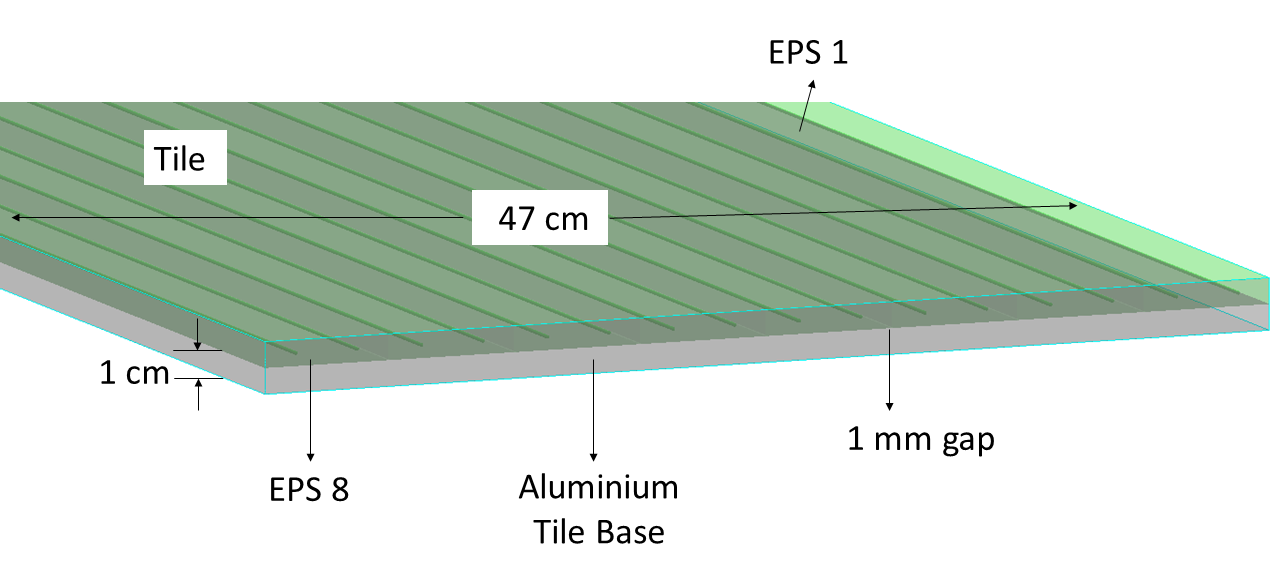
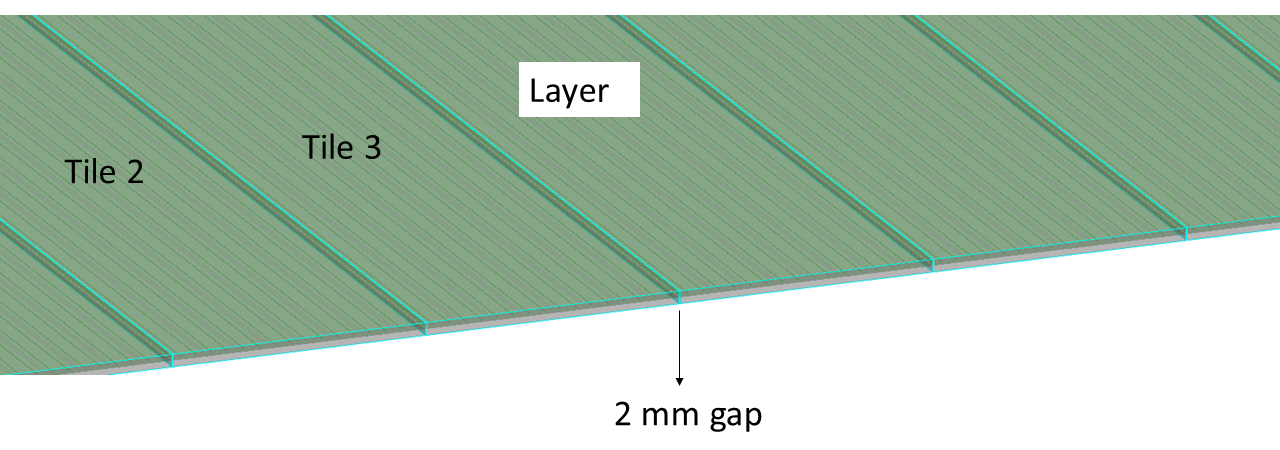
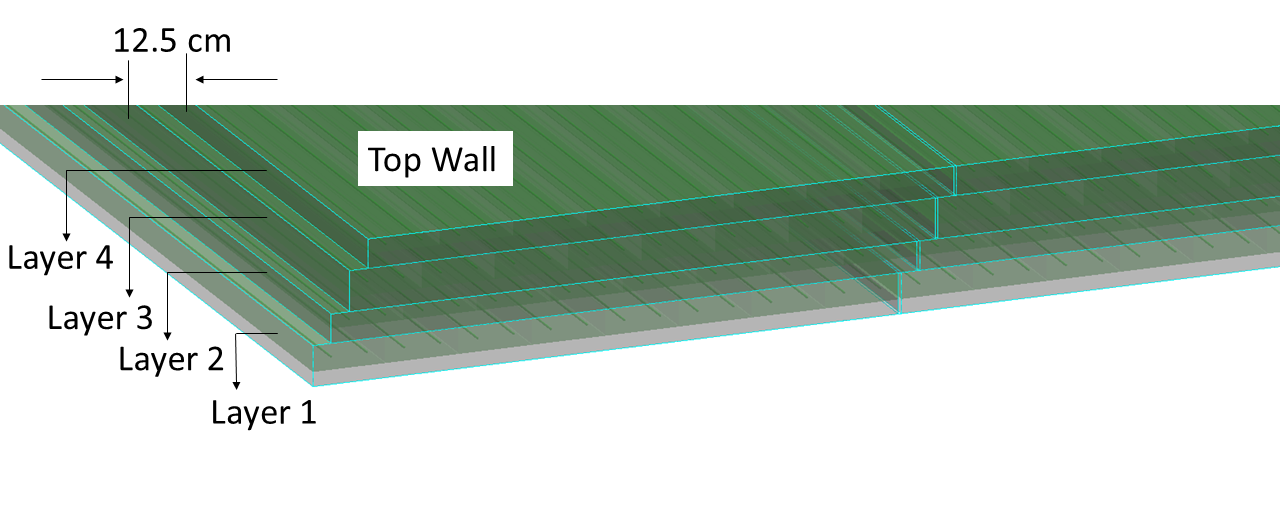
The existing miniICAL geometry in GEANT4 toolkit [6] has been modified to incorporate the cosmic muon veto detector, which consists of four large-sized veto walls (Top, Left, Right, and Back) and two auxiliary walls (aux-Left and aux-Right). Each wall is constructed using up to 4 layers of scintillators, which are designed in the form of tiles. Each individual tile is created by placing 8 scintillator strips side by side. In order to streamline electronic channels and improve efficiency, two of these strips are combined into a single unit referred to as a "dicounter" [7]. The gap between each layer is 10 mm for the mechanical support structure (aluminium tile base), while the gap between EPS strips is 1 mm and that between two tiles is 2 mm, due to glueing, coating, mechanical tolerances, and packing materials as shown in Figure 3.
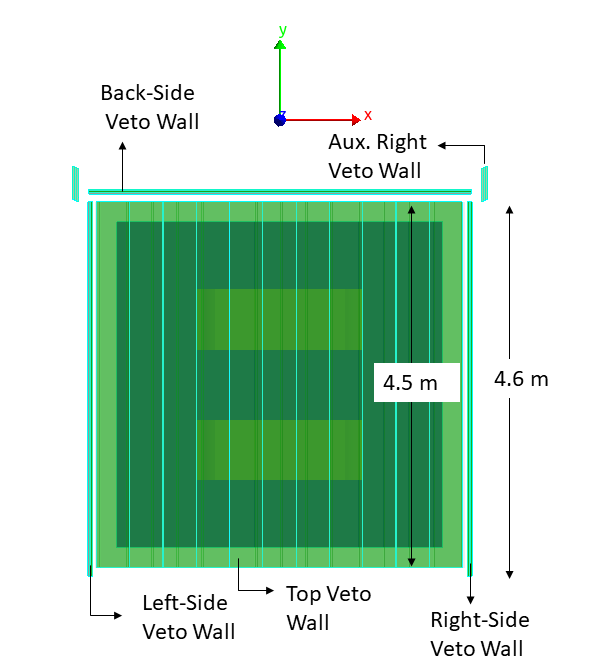
The top-veto wall is positioned at 52 cm from the topmost iron layer of miniICAL and is equipped with scintillator strips, which run along the y-axis for length and x-axis for width. The left and right-side walls are positioned at roughly 26 cm from the miniICAL detector, with scintillator strips running along the y-axis for length and z-axis for width. The back wall is located at 33 cm from the miniICAL detector, features scintillator strips running along the x-axis for length and z-axis for width. Additionally, two small-sized veto walls are placed near the edges between the back and left/right walls to veto muons passing through the gap between edges of back and side-walls. The positions of all veto walls have been optimised so that when mICAL is triggered by a muon trajectory, it passes through at least one veto wall, except in the front side. The side veto walls are elevated 25 cm from the floor to cover the entire detector. Figure 4 shows top and front view of simulated CMVD geometry around miniICAL in GEANT4. Table 1 summarizes the general parameters of EPS used in the veto detector. In total there are 748 such extruded plastic scintillator strips making up the veto detector. In simulation, these scintillator strips are made up of polystyrene with a density of 1.05 .
| Veto | of | Layer | of | Strip | distance |
| Wall | Layers | staggering | Tiles | dimensions | from miniICAL |
| Top | 4 | width | 11/Layer | - | |
| Side | 3 | width | 5/Layer | ||
| Back | 3 | width | 5/Layer | ||
| Auxiliary | 3 | width | 1/Layer |
3 Event Generation
The Monte-Carlo event generation was performed using extensive air shower simulation framework CORSIKA [8] while the simulation of the passage of a particle through the detector geometry is performed by the GEANT4 simulation toolkit. Event generation process starts with a random position (, ) and momentum component (, and ) of the secondaries extracted from the output of CORSIKA on the topmost RPC layer (layer no. 10). The accepted particle position is extrapolated to the below RPC layer (layer no. 7) to test the acceptance condition. The location of the event’s starting point, known as the vertex, is determined by extrapolating the position on the rooftop. This approach helps to reject muon trajectories that do not intersect the top and bottom trigger layers, reducing computation time. This trigger criteria is being used to collect cosmic muon data in miniICAL.
4 Digitisation
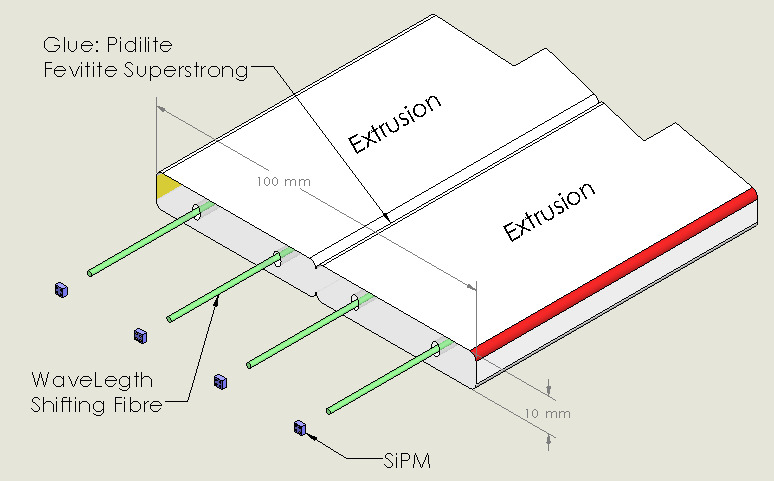
When a charged particle passes through the scintillator strip, it produces scintillation light which is then absorbed, re-emitted inside the wave-length shifting fibers and propagated to the SiPMs. To maximize light collection, each scintillator strip has two fibers, resulting in four SiPMs per scintillator. Figure 5 shows one side-view of a dicounter with four SiPMs belonging to two different EPS. The other four SiPMs are mounted on the other side of the dicounter. Fibres are extended beyond the EPS end to accommodate the size of readout electronics boards of the SiPM’s. At the strip level one has the information about the time, position and the energy deposited when a muon passed through the scintillator strip while at the SiPM level one has digitised information about the timing and the charge collected in all the 4 SiPMs associated with the particular scintillator strip. Signal in each SiPM depends on the energy deposited and the distance between the muon trajectory and the edge of WLS fibre, where the SiPM is mounted. The digitized charge and timing information, using the energy deposited information from Geant4 simulation, is fine-tuned to replicate the SiPM signal obtained from standalone cosmic muon setup with extruded scintillators.
4.1 Charge measurement
A Monte Carlo-based model was developed to simulate the charge response of a SiPM based on the energy deposition by muons in a scintillator and their corresponding position. To accurately account for the saturation in the plastic scintillation light, the energy deposited per unit length was scaled using Birk’s formula [9] ( for polystyrene). To accurately capture the attenuation of photons inside the core and cladding material of approximately 5 m long wavelength-shifting fiber, data was collected when muons passed through specific positions, determined by the use of narrow scintillator paddles. This data was then fitted with a double exponential function , as depicted in Figure 6, where the data points at 150 and 250 cm are excluded from the fit.
The resulting number of photoelectrons (p.e.) generated at the far end of the scintillator was assumed to follow a Poisson distribution with the mean value which was determined as 0.013 p.e./MeV. This estimation was based on an independent experimental setup where the resulting photoelectrons were measured in close proximity to one of the SiPMs. The gain of the SiPM, pedestal width and the width of single photoelectron peak was obtained by characterizing the SiPM using LED source [10]. Thus the resulting charge collected by the SiPM was modelled using a gaussian distribution with mean equal to times the photoelectrons and standard deviation as quadratic sum of the pedestal width and the single photoelectron width, multiplied by the number of photoelectrons. Figure 7 shows the overall algorithm of calculating the charge of the SiPM using the energy deposited and the position information of muon hit inside the scintillator.
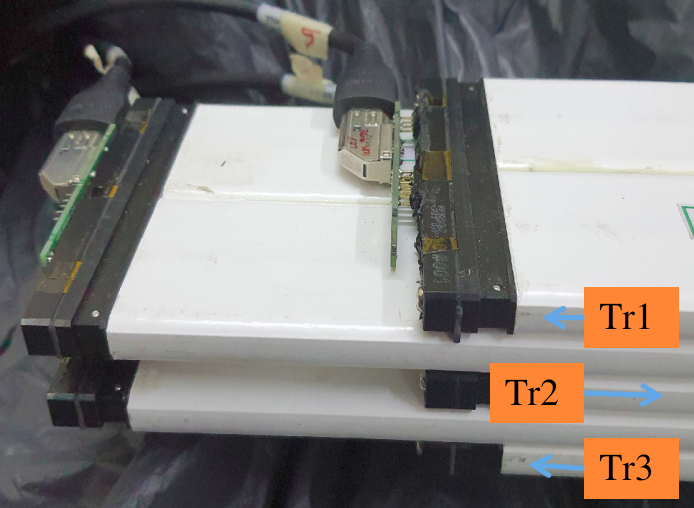
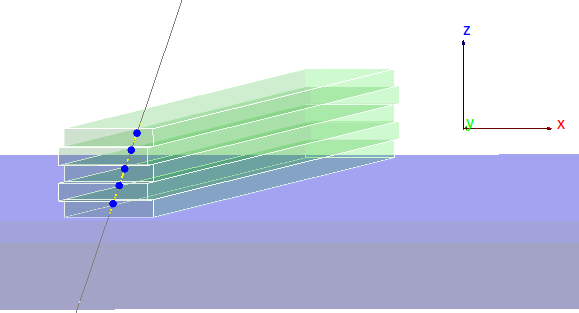
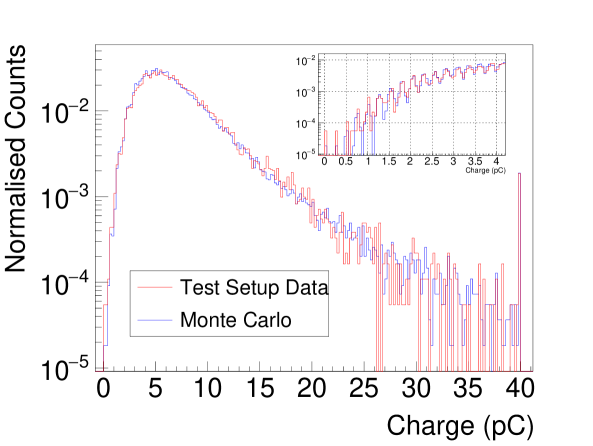
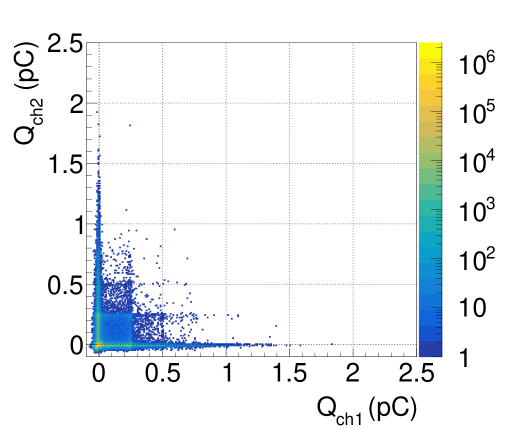
This model was tested by simulating the di-counter testing setup [7] in GEANT4. Figure 8 (a) shows the di-counter test setup where two test di-counters (4.7 m) are inserted between three trigger di-counters of slightly smaller length (4.5 m). Only the front-side scintillator in each trigger dicounter’s is used for generating cosmic muon trigger. Figure 9 compares the observed and simulated charge responses of one of the SiPM in the di-counter setup.
4.2 Timing measurement
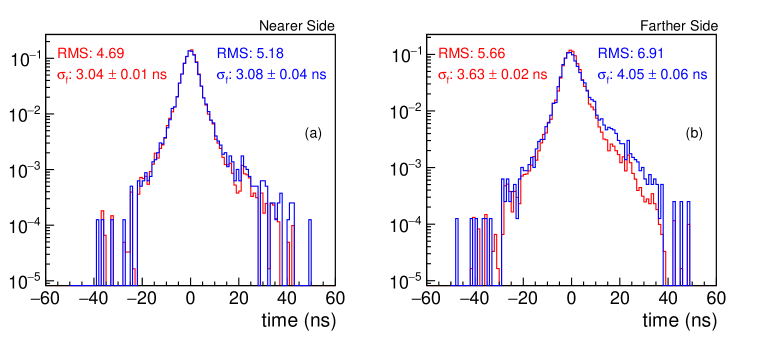
From the actual timestamp of energy deposit and the position of muon trajectory along the length of the scintillator strip, the SiPM timing is calculated using 162 mm/ns as the speed of the signal in the wavelength shifting fibre [10]. The uncertainty on the measurement of time in the SiPM device is also incorporated during the digitisation of SiPM signal from the test setup data. The timestamp is obtained from the data by taking data in an oscilloscope when muon passes through a specific position determined by trigger paddles as discussed earlier. When the pulse crosses the 4 photo-electron threshold the time-stamp is recorded. The uncertainty on the timing mainly depends on the pulse height/charge which is related to scintillator rise time, light propagation characteristics in the WLS fiber, SiPM rise time and on the amplifier characteristics. Figure 10 shows the comparison of timing information in data and monte carlo after mean correction for both the nearer and farther SiPM, while the closer SiPM is approximately away and the farther one is about away. The time resolution obtained is for farther channels and for the closer channels. The corresponding position uncertainty from the core of the timing resolution is after correcting for the width of trigger paddle () and jitter in trigger signal (). The tail of the timing distribution will give much larger uncertainties in the position measurements. We are yet to understand the discrepancies in timing resolution for larger distances, but as we are not going to use time information in our study, this does not affect the conclusion.
4.3 Intrinsic Noise in SiPM
In the upcoming veto system, approximately 3000 SiPMs will be utilized. In addition to detecting muon signals, these SiPMs will also produce signals due to dark noise. Previous study has already examined the impact of noise rates on the veto efficiency [10]. These SiPMs will operate at room temperature with a 2.5 overvoltage, and it is required that at least two SiPMs register a signal above 2.5 pe. In the experiment, four SiPMs will be aggregated onto an adapter board for all electrical and readout connections. Subsequently, the signals will be amplified using transimpedance amplifiers. For this study, the noise data was acquired in a dark environment using a DRS4 oscilloscope [11], at 2.5 and room temperature, mirroring the conditions of the upcoming experiment. The DRS oscilloscope was triggered randomly, and the charge was integrated within randomly selected time windows. This noise charge will be identical to what is expected in the data triggered by the miniICAL. The choice of time window is because the entire muon pulse observed in the SiPM is contained within this duration.
In the current simulation, intrinsic noise was introduced to all 3000 SiPMs from the test data. The correlated noise between two SiPMs in an adapter board is shown in figure 11.
Due to fluctuation of all these processes and a given threshold for storing the signal of SiPM signal, there is a possibility that SiPM(s) associated with a scintillator does not have any valid digitised signal even though a muon passed through the scintillator. Similarly, due to the fluctuation in the noise, there might be a signal in the SiPM without any muon in the associated scintillator. At least two SiPMs associated with a scintillator have digitised signal above a certain threshold in terms of photo-electrons required to reconstruct muon position in the scintillator. The two coordinates are obtained from the layer number and the strip number of the scintillator having a valid hit while the coordinate along the length of the scintillator is not considered due to larger uncertainties from the timing information.
5 Hits, Cluster and Super-Cluster Formation
The geometry of the veto system has been designed to detect a minimum of two layers of valid hits for every reconstructed muon in the miniICAL, excluding the front side. While a typical muon passage generates a single hit in a layer, closely spaced strips can result in two or more hits. Additionally, two or more hits can also occur due to the combination of a muon’s ionization with the detector material and delta rays produced by the ionization or from muon-nuclear interactions of primary muons with detector material.
To meet the efficiency criteria, two or more SiPMs in a scintillator must have a signal above 2.5 p.e. [10]. This primarily eliminates the dark noise of SiPM. However, some delta-ray or secondary hits are still present and these hits are then combined with muon hits to form a cluster, as it is not possible to differentiate between them. Thus a cluster is formed by combining multiple adjacent strips in the same layer. The cluster position is determined by averaging the individual hit positions. Because of multiple hits resulting from secondary particles, a layer can have multiple clusters.
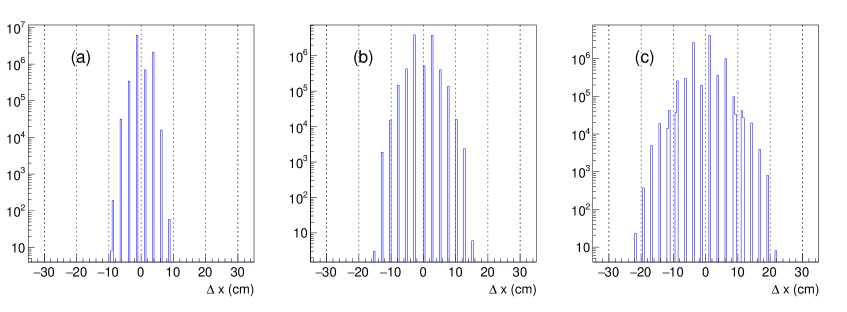
Clusters in different layers within the same wall are combined into doublet if their separation falls within a specific distance criterion. This criterion is established by exclusively considering hits only from muons in the simulation i.e., excluding SiPM noise, and disregarding hits formed from secondary particles induced by muon interaction with detector material. Figure 12 illustrates the distances between clusters belonging to the 1st layer and subsequent layers in the top wall. The primary sources of this width are the muon inclination angle and staggering of different layers. Figure 12 (c) exhibits a large distance between two clusters due to the increased distance of the layer. Moreover, because of the presence of gaps between scintillators in each layer, a layer might not have any hit. In order to take care of this, the doublet formation is not just restricted to adjacent layers but occurs systematically across all layers within the same wall. The doublet position is considered as the average position of the two clusters.
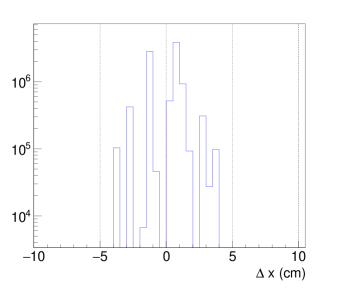
Furthermore, multiple doublets are combined to form triplets if they originate from the same layer (i.e. the initiation of one doublet and the termination of another lie on the same layer) and their difference is less than 5cm as shown in figure 13. For the top wall, triplets and doublets are combined to form quartets since there are 4-layers in the top wall. Finally, all clusters that have been utilized in the grouping processes are discarded, and the resulting triplet/quartet is denoted as a "super-cluster". These super-clusters are then fitted with straight-line and compared with the extrapolated muon position at the center of each wall (e.g., for top wall muons are extrapolated at the middle of the z-coordinate of four layers) containing the super-cluster.
6 Noise hit identification
The fake rate in the efficiency measurements has to be less than in order to achieve the desired veto efficiency. The SiPMs are categorized as noisy under two conditions, during simulation, a signal of SiPM is found to be originated from noise and a muon signal falls below the threshold and, after incorporating noise, the total signal surpasses this threshold. While combining the four SiPM belonging to the same scintillator, the hit is marked as noisy if three or more SiPMs are noisy. A cluster is not noisy if it has at least one valid muon hit with a signal above the threshold. Thus, if all the hits compromising a cluster are noisy then the cluster is marked noisy. Moreover if two or more clusters in a supercluster originate from noise then the supercluster is marked noisy. This identification helps to estimate the fake rate originating from intrinsic SiPM noise.
7 Reconstruction and extrapolation of muon tracks
The miniICAL simulation algorithm employs a two-step process for track reconstruction, consisting of a track finding algorithm followed by a track fitting algorithm. The track fitting algorithm uses information about the local magnetic field to reconstruct both the momentum and charge of the muon. The Kalman filter-based track fitting algorithm is used to estimate the track parameters and its error matrix [12]. However, in the absence of the magnetic field the track fitting algorithm is based on the linear least-square method [13]. The track fitting algorithm provides an estimate of fitted-track parameters , , , (also in presence of magnetic field) at the topmost RPC plane having a valid signal.
The next step is the extrapolation of the reconstructed track towards the veto walls, which also is done in two-steps: inside the magnetic field region (inside the upper iron layers), the tracks are extrapolated using the prediction step of Kalman-filter based algorithm in order to propagate track parameters outside the topmost iron layer, where the magnetic field is negligible. Subsequently, beyond the iron layer, we employ a simple line-plane intersection technique.
Each of the six veto planes are parameterized by their four corners and direction cosines taken as normal vectors to the planes. Initially the extrapolation algorithm checks for track intersections with all these six walls, but for large zenith angles the intersections points can be far away for vertical walls, particularly the back wall, whereas the uncertainty in the direction of muons in miniICAL is very small. Thus, to address this, the algorithm is modified to calculate the distance of closest approach between the extrapolated track and the line along the CMVD strips. The modified algorithm checks the distance of closest approaches between the extrapolated track and the line, which is formed parallel to the scintillator length passed through the reconstructed supercluster position in the wall. In scenarios involving multiple superclusters within the same wall, the algorithm selects the one with the least distance of closest approach from the reconstructed muon track. Additionally, when multiple walls house valid superclusters, priority is given to one with the least distance of closest approach.
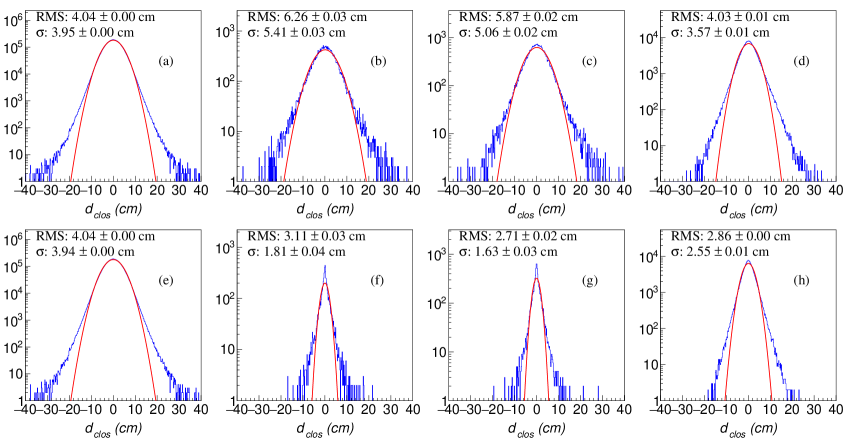
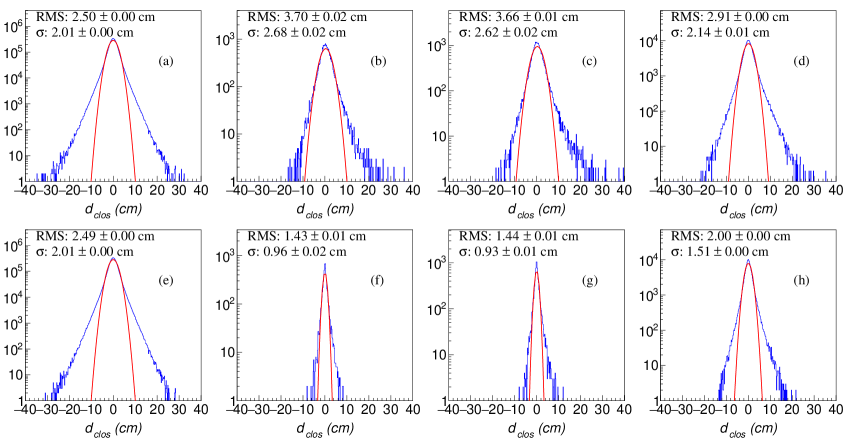
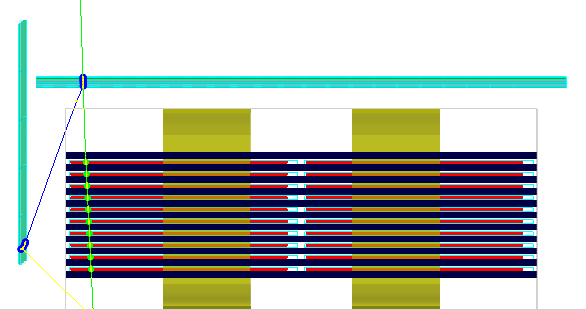
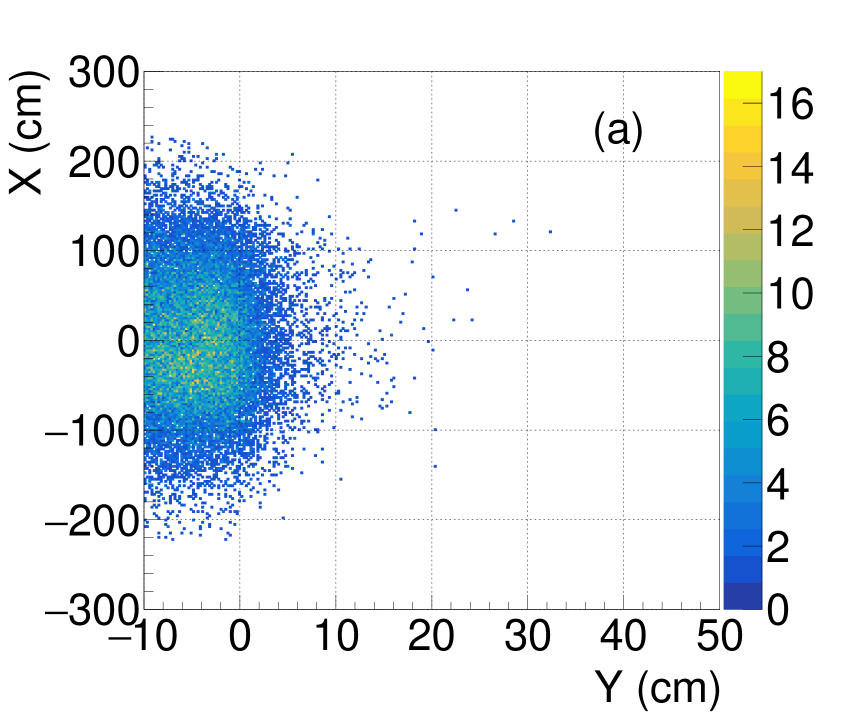
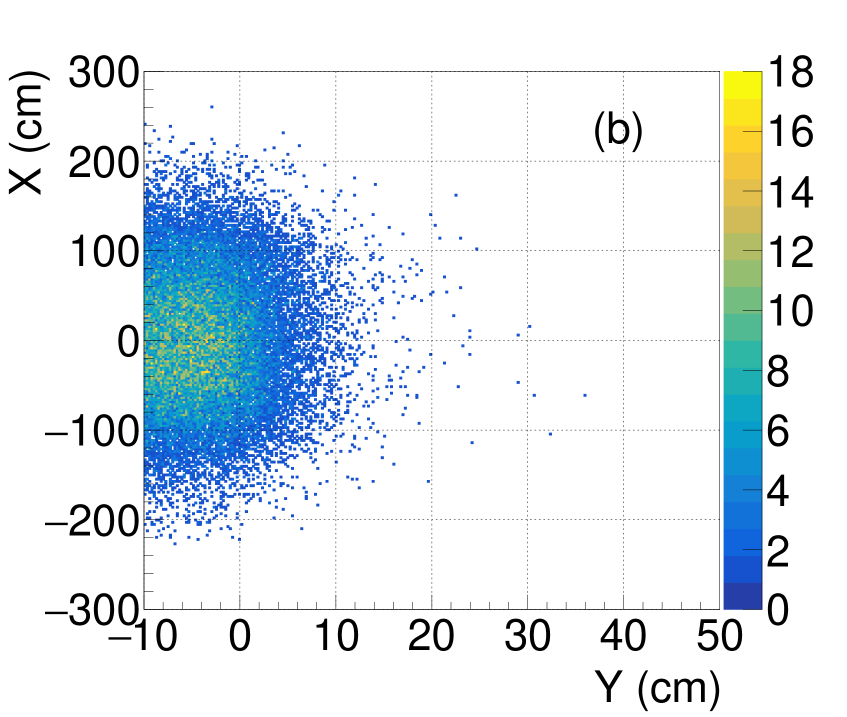
Figure 14 15 shows the closest distance in each wall with and without magnetic field respectively. The closest distance is considered positive if the extrapolated point in the plane is greater than the supercluster position in the miniICAL coordinate system as shown in 2. In the figures 14 15, top row (figures: a-d), the closest distance is stored for all the four walls having a valid super-cluster while in the bottom row (figures: e-h), it is stored only when that particular wall is nearest. The poor resolution of the two side walls (Left and Right) is attributed to their greater distance from the miniICAL detector and larger zenith angle of muon trajectory, where uncertainties are larger due to larger multiple scattering in irons as well as larger extrapolated lengths. Events in the tail part ( figure 14 15, top row (a-d)) are a result of hits generated from secondaries in the electromagnetic shower as the muon interacts with detector/surrounding materials as shown in Figure 16, particularly noticeable in back-side wall since the it is closest to the miniICAL detector. The skewed appearance of all the side walls is due to edge effects, where the supercluster is consistently contained within the boundary near the edges of the detector.
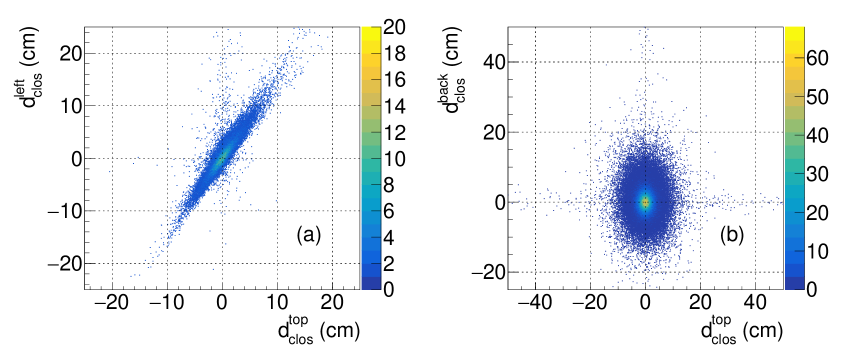
However when we look for the least closest distance among all walls, the left and right-side walls have better resolution. The cases where these two side walls are neaserst, the majority of events tend to have hits in the top wall due to the influence of trigger criteria and spatial arrangement of the walls. Given that the scintillator strips in both the top and left/right walls are parallel, the closest distance measurements are correlated as shown in figure 17 (a). This correlation contributes to the apparently observed improved resolution in the side walls when these walls were nearest. Conversely, for the back and top walls, where the scintillator strips are perpendicular to each other, the uncertainties in the top wall do not significantly affect the uncertainties in the back wall. Due to lack of correlation between the closest distances in the top and back walls as shown in figure 17 (b), there is no significant change in distributions when the back wall is the nearest-one.
8 Effective Size of Top Veto wall
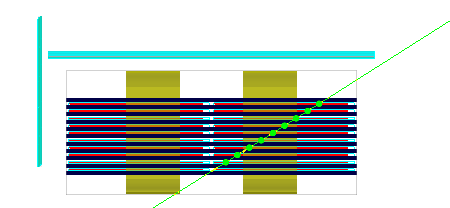
The miniICAL RPC detectors sometimes require troubleshooting and repair. To assist with this process, the CMVD design excludes the front side veto wall. As a result, in the absence of the front wall, it is expected that there will be events where a muon did not pass through scintillator strips, though there was a trigger generated in the miniICAL system, as shown in Figure 18.
During the data taking periods, the muon hits in the veto system will be identified by extrapolating the reconstructed muon trajectory towards the veto walls. However, it was found through simulation that there will be instances where the extrapolated position of the muon is inside the CMVD, even though the muon did not actually pass through that layer.This issue was investigated and it was determined that in order to exclude such false detections, events with extrapolated positions within 30 cm of the front top veto wall must be disregarded. This reduces the statistical power of the experiments, but removes any ambiguity of misreconstructions. This larger area is primarily due to factors such as the uncertainty in the reconstruction, the effect of multiple scattering within the iron layers, and the longer extrapolation distance for tracks with large angles. Figure 19 shows the extrapolated position on the veto walls for events originating from the front side of the detector.
9 Expected veto efficiency
Most of the events triggered in the miniICAL detector result in hits in the top wall. The two side walls (left and right) have fewer hits because of the specific trigger criteria mentioned in section 3. The exact position of the muon in the CMVD wall is not precisely determined from the extrapolated position due to uncertainty in the reconstruction and multiple scattering with detector material. The efficiency of a CMVD is defined as the fraction of events with valide super-clusters near the extrapolated muon positions in the CMVD detector. The muon track in the RPC stack with good fit quality is considered here to reduce the uncertainties in the extrapolated position in the CMVD. A super-cluster as defined above must have at least 2 layers of nearby scintillator detectors and 2 or more SiPMs associated with it must have signal above 2.5 photo-electron. The "good fit quality" of a track is quantified by its and total number of hits (nhits) in the RPC stack.
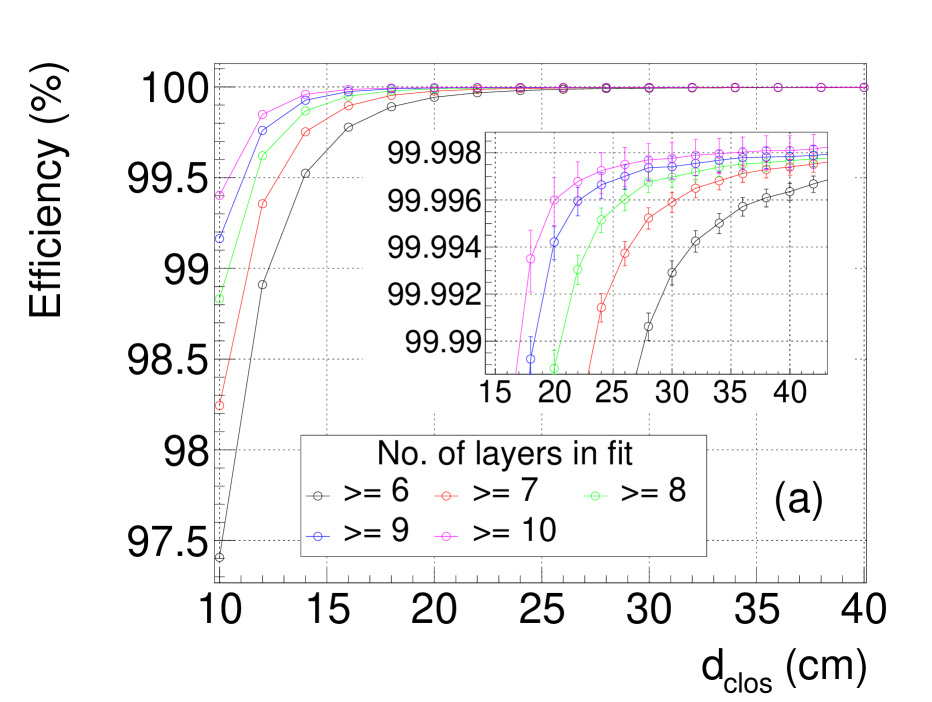
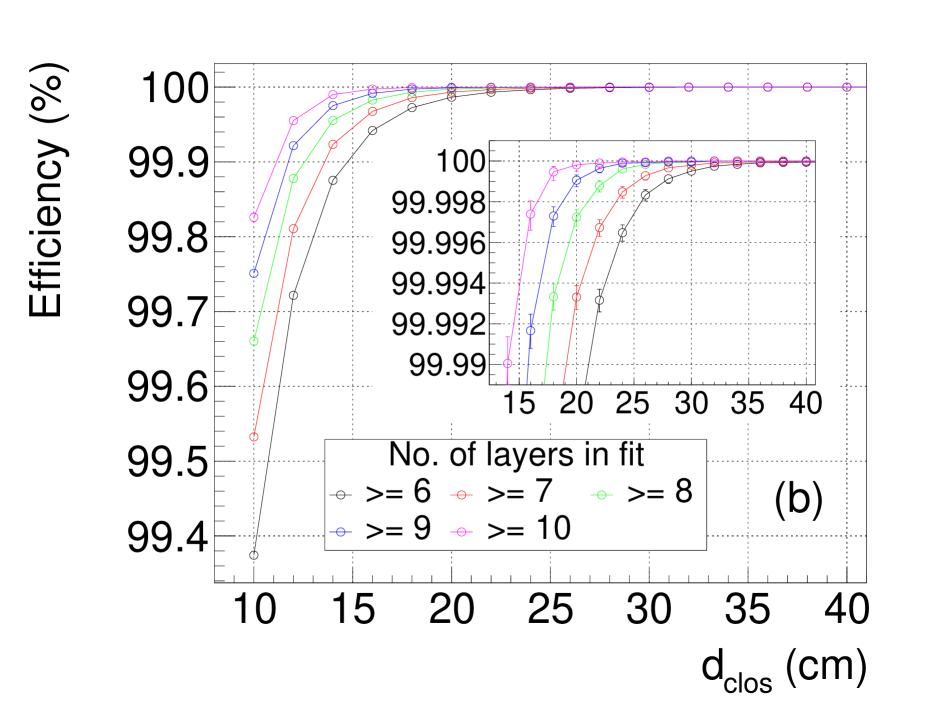
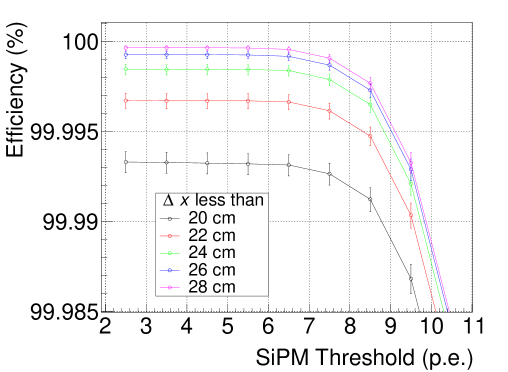
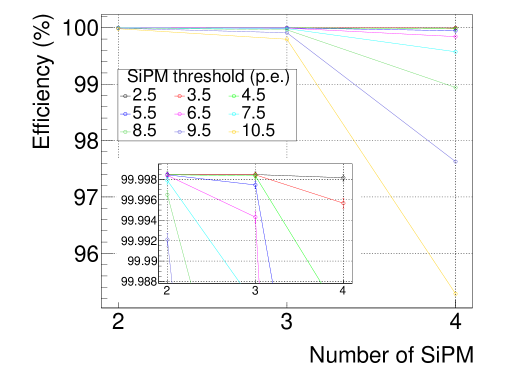
Figure 20 shows efficiency for different values of distance between extrapolated track position and super-cluster position (search window) in the veto wall with and without magnetic field. Since the extrapolated position is dependent on uncertainty in reconstruction, higher number of RPC layers in the muon track reconstruction shows better efficiency. The search area includes just one coordinate (along strip width) because of poor position resolution from timing information, the coordinate along the strip length is not considered for efficiency estimation. In order to achieve efficiency more than 99.99 %, we must increase our search area to at least 30 cm (25 cm) from the extrapolated position with (without) magnetic field for all the selected reconstructed muon tracks in RPC stack. Moreover within the statistics in the current simulation, we did not observe any false positive events. Figure 21 illustrates the variation in efficiency with different threshold values used to form hits in the simulation for different values of search criteria. The veto efficiency is found to remain relatively constant for thresholds up to 6.5 photo-electrons. Figure 22 shows the variation of efficiency for different numbers of SiPMs used in hit formation for different thresholds. All four SiPMs can be utilized for hit formation up to a 3.5 photo-electron threshold, while any three SiPMs can be used for thresholds up to 6.5 photo-electrons. But, in realistic experimental scenario, we do not expect all SiPM will performs like an ideal scenario, thus the selection criteria for the CMVD strips signal remains same as it was studied earlier [10].
10 Conclusion
Based on the noise level in the SiPM detector and the gap between the scintillator strips, the veto criteria is defined for the system [10]. There should be signals above 2.5 pe equivalent in at least two SiPMs in each of these strips and at least 2 layers must have a valid signal. This veto criteria has been evaluated concerning well-fitted tracks ( and ) within the RPC stack. Firstly, tracks with extrapolated points within 30 cm from the front side must be rejected to account for the absence of the front wall. Next, if an extrapolated position of a reconstructed track is located within the detector wall and a hit is detected within 30 cm from the extrapolated position, it should be considered as a muon hit. For tracks outside the detector region, a muon hit is considered if the distance of closest approach between the track and the detector wall edge is within 30 cm. Furthermore, the veto efficiency remains nearly unchanged up to a 6.5 pe SiPM threshold. Additionally, more than 2 SiPMs in a scintillator will register a signal above this threshold, which rejects most of the uncorrelated SiPM noise. The fake rate in efficiency measurements is found to be negligible. Thus, if the scintillator strips are light leak tight and maintained in the same dark environment as the test setup, the veto system can achieve the desired efficiency. By implementing all the criteria in the hits and clustering algorithm, the study aims to distinguish genuine muon hits from noise signals in the detector system and achieve the desired veto efficiency.
References
- [1] G. Majumder and S. Mondal, “Design, construction and performance of magnetised mini-ICAL detector module,” PoS, vol. ICHEP2018, p. 360, 2019.
- [2] N. Panchal, S. Mohanraj, A. Kumar, T. Dey, G. Majumder, R. Shinde, P. Verma, B. Satyanarayana, and V. M. Datar, “A compact cosmic muon veto detector and possible use with the Iron Calorimeter detector for neutrinos,” JINST, vol. 12, no. 11, p. T11002, 2017.
- [3] A. Pla-Dalmau, A. D. Bross, and K. L. Mellott, “Low-cost extruded plastic scintillator,” Nucl. Instrum. Meth. A, vol. 466, pp. 482–491, 2001.
- [4] I. Alekseev, M. Danilov, V. Rusinov, E. Samigullin, D. Svirida, and E. Tarkovsy, “The performance of a new Kuraray wavelength shifting fiber YS-2,” JINST, vol. 17, no. 01, p. P01031, 2022.
- [5] “HAMAMATSU MPPC (Multi-Pixel Photon Counter) datasheet.” https://www.hamamatsu.com/eu/en/product/type/S13360-2050VE/index.html.
- [6] S. Agostinelli et al., “GEANT4: A simulation toolkit,” Nucl. Instrum. Meth., vol. A506, pp. 250–303, 2003.
- [7] M. Saraf et al., “Design, fabrication and large scale qualification of cosmic muon veto scintillator detectors,” JINST, vol. 18, no. 05, p. P05003, 2023.
- [8] D. Heck, J. Knapp, J. N. Capdevielle, G. Schatz, and T. Thouw, “CORSIKA: A Monte Carlo code to simulate extensive air showers,” 2 1998.
- [9] J. B. Birks, “Scintillations from Organic Crystals: Specific Fluorescence and Relative Response to Different Radiations,” Proc. Phys. Soc. A, vol. 64, pp. 874–877, 1951.
- [10] M. Jangra et al., “Characterization of Silicon-Photomultipliers for a Cosmic Muon Veto detector,” JINST, vol. 16, no. 11, p. P11029, 2021.
- [11] “DRS4, DRS4 Evaluation Board User’s Manual.” https://www.psi.ch/sites/default/files/2020-02/manual_rev51.pdf.
- [12] K. Bhattacharya, A. K. Pal, G. Majumder, and N. K. Mondal, “Error propagation of the track model and track fitting strategy for the Iron CALorimeter detector in India-based neutrino observatory,” Comput. Phys. Commun., vol. 185, pp. 3259–3268, 2014.
- [13] S. Pal, Development of the INO-ICAL detector and its physics potential. PhD thesis, HBNI, Mumbai, 2014.