Predicting Depression and Anxiety: A Multi-Layer Perceptron for Analyzing the Mental Health Impact of COVID-19
Abstract.
We introduce a multi-layer perceptron (MLP) called the COVID-19 Depression and Anxiety Predictor (CoDAP) to predict mental health trends, particularly anxiety and depression, during the COVID-19 pandemic. Our method utilizes a comprehensive dataset, which tracked mental health symptoms weekly over ten weeks during the initial COVID-19 wave (April to June 2020) in a diverse cohort of U.S. adults. This period, characterized by a surge in mental health symptoms and conditions, offers a critical context for our analysis. Our focus was to extract and analyze patterns of anxiety and depression through a unique lens of qualitative individual attributes using CoDAP. This model not only predicts patterns of anxiety and depression during the pandemic but also unveils key insights into the interplay of demographic factors, behavioral changes, and social determinants of mental health. These findings contribute to a more nuanced understanding of the complexity of mental health issues in times of global health crises, potentially guiding future early interventions.
1. Introduction
Psychiatric disorders have always imposed significant challenges to public health (Prince et al., 2007), and the advent of the COVID-19 pandemic has intensified these issues (Talevi et al., 2020; Moreno et al., 2020; Cullen et al., 2020). The pandemic has led to increased prevalence and severity of mental health concerns globally, driven by a mix of health fears, social isolation, economic pressures, and general uncertainty. This environment presents new challenges and opportunities for understanding and addressing mental health conditions, in particular depression and anxiety. We employ an MLP to predict depression and anxiety, which can lead to early intervention and better management of such potential mental health conditions. Our approach has the unique ability to process complex data patterns in mental health datasets, making it particularly suitable for the multifaceted nature of mental health. Central to our study is a dataset comprising detailed weekly surveys (Shuster et al., 2021) that offers an invaluable perspective on the psychological impact of the pandemic. This data was collected at the beginning of the COVID-19 pandemic (April - June 2020) in the U.S. Even though the results of this study may not generalize well to pre- and post-pandemic times or other geographical locations, by analyzing this dataset, we gathered valuable insights into the mental health trends of periods during stressful global catastrophes such as the COVID-19 pandemic.
1.1. Contribution
We created a machine learning model designed to predict anxiety and depression levels using qualitative data from an individual during global health crises, such as the COVID-19 pandemic. We utilized model explainability to reveal specific qualitative attributes that increase susceptibility to such mental health issues, which is essential in guiding the creation of targeted mental health interventions, specifically addressing the needs of the most affected individuals. Our work aims to advance predictive modeling in mental health and deepen the understanding of psychological impacts during global health crises, offering valuable insights for practitioners and researchers.
2. Related Work
The exploration of mental health, specifically anxiety and depression, in the context of the COVID-19 pandemic has been a focus of several studies. Our research, utilizing an MLP to decode patterns of depression and anxiety, aligns with these efforts but presents distinct methodologies and insights, as noted below.
Hueniken et al. (Hueniken et al., 2021) utilized surveys to assess mental health symptoms, alongside factors like substance use and COVID-19-related worries, employing principal component analysis. Our work diverges from this work by focusing on extracting patterns specific to anxiety and depression using MLPs. Freyhofer et al. (Freyhofer et al., 2021) offer insights into the impact of coping strategies and external factors on mental health during the pandemic. In contrast, our research delves into qualitative attributes of individuals, using a neural network-based approach to uncover their interplay in mental health disorders. Nemesure et al. (Nemesure et al., 2021) provides methodological insights that could be compared to our MLP approach. While both aim at predictive modeling, our emphasis on quantitative data analysis through an MLP offers a novel perspective. Malik et al. (Malik et al., 2023) discusses using various machine learning models for mental health analysis during COVID-19, using a combination of techniques such as decision trees, k-nearest neighbor, and naive Bayes. Our research contrasts this by predicting patterns of depression and anxiety, providing an alternate view of mental health dynamics.
In contrast to the data analysis methods described above, Shukla and Seneviratne (Shukla and Seneviratne, 2023) implemented a mood prediction system using personal medical devices that tracked patient physiological data. They build a decentralized learning machine learning model called “MentalHealthAI” with federated learning and smart contracts to keep data on the patient’s end without collecting it in a central server. This provides a privacy-preserving methodology for analyzing mental health data. While “MentalHealthAI” (Shukla and Seneviratne, 2023) used a method for predicting mood through psychological data focusing on mental health as a chronic disease, our focus in this paper is on predicting depression and anxiety levels using qualitative survey data collected at the onset of a traumatic global health crisis such as the COVID-19 pandemic. In a similar vein, D’Alfonso (D’Alfonso, 2020) focuses on three of the main ways that AI is applied in mental health: (1) personal sensing or digital phenotyping, (2) natural language processing of clinical texts and social media content, and (3) chatbots. These methodologies exemplify a promising future for integrating AI into digital interventions, especially within web and smartphone applications, and the authors also underscore the ethical challenges associated with using AI in mental health care. Our goal is to develop an application that incorporates these ethical guidelines and advances the integration of AI in mental health services to assist mental health professionals.
3. System Design and Implementation
3.1. Dataset
Our work utilizes the dataset collected by Shuster et al. (Shuster et al., 2021), a 10-week survey with a diverse group of participants that examined 308 demographic and psychological features, including anxiety and depression levels. Participants represented a wide spectrum of diversity, coming from different ethnic backgrounds, genders, religious beliefs, socioeconomic statuses, geographical locations, and varying mental health conditions. Shuster et al. leveraged linear mixed-effects models to examine factors contributing to longitudinal changes in depression and anxiety and discovered that gender, age, income level, previous psychiatric diagnosis, informedness about the pandemic, and marital status correlated with higher overall levels of anxiety and depression.
Using this same dataset, we created an MLP that predicts depression, i.e., sds score, as measured by the Self-Rating Depression Scale (Zung, 1965) and anxiety, i.e., stai-s score, as measured by the state sub-scale of the State-Trait Anxiety Inventory (Spielberger, 1989), based on patient features. Our work extends and enhances the understanding gained from the foundational study that initially collected the data (Shuster et al., 2021). The dataset by Shuster et al. consists of numeric and text data. The numeric data consisted of data from numeric or categorical answers, such as age, gender, race, employment status, mental health disorders, anxiety scores (stai-s), and depression scores (sds). The textual data consists of user answers that were not categorical or numerical. One instance of these questions was where applicants had to describe various images they saw and what emotion they invoked. In our analysis, we only focused on the numerical data.
3.2. Exploratory Data Analysis
Data exploration is crucial for understanding the dataset’s underlying structure and performing feature engineering. To ensure data integrity and consistency for our analyses, we followed a meticulous reformatting process involving several steps, such as selecting complete and consistent participant records, removing null data entries, and standardizing columns across the ten-week time points. An essential aspect of this phase was transforming categorical variables into a numerical format, enhancing their suitability for processing by our MLP. After our exploratory data analysis, we split our dataset into a 70-20-10 for training, testing, and validation.
3.3. Predictive Model
Mental health data, particularly concerning anxiety and depression, often involve intricate patterns and interactions among various factors such as demographic variables, behavioral patterns, and external stressors. Therefore, our choice of model revolved around deep learning-based MLPs, which are well-suited for modeling complex, nonlinear relationships within data, providing more accurate predictions compared to the traditional linear models used in (Shuster et al., 2021). The MLP autonomously adjusts weights to emphasize salient features and diminish less important ones. This capability is vital given the nuanced nature of mental health indicators and the potential for large datasets to contain a mix of relevant and irrelevant information.
At the heart of our predictive model are two critical scores: the sds score and the stai-s score, representing depression and anxiety levels, respectively. Our primary objective was to develop a model that could accurately forecast these scores based on a comprehensive array of variables present in the dataset. These scores were derived through a sophisticated equation incorporating twenty distinct variables. We followed the standard scoring procedures for each instrument to calculate the stai-s score and the sds score, as derived by (Shuster et al., 2021).
3.3.1. COVID-19 Depression and Anxiety Predictor (CoDAP) Architecture
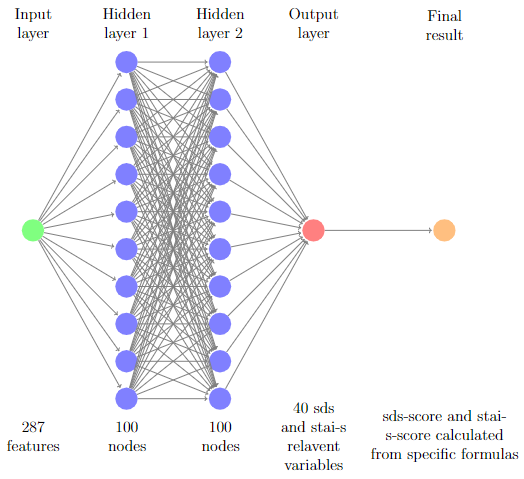
Following our data preparation, we developed an MLP configured to leverage the entire spectrum of features in the dataset, thus enabling precise predictions of the sds score and stai-s score. The model architecture, as seen in Figure 2, was designed to accommodate the complex relationships inherent in mental health data, focusing on capturing subtle patterns and indicators that less sophisticated models might miss. The input layer is marked by a green node, which encapsulates a comprehensive set of 287 unique attributes, excluding target attributes employed to calculate anxiety and depression levels, derived from the dataset by Shuster et al.. These attributes form the foundational data that CoDAP will process. Some of these features include age, gender, race, religion, types of mental health disorders, and other qualitative features about the participants.
Careful consideration was given to the MLP network’s architecture to balance predictive power and model generalizability. It is a fundamental requirement for an MLP to have at least one hidden layer, which enables the model to perform non-linear transformations and learn complex relationships in the input data. During the exploratory phase of our research, we conducted a series of experiments to determine the optimal number of hidden layers. Our empirical investigations revealed that a two-layered hidden structure provided the most robust performance.
In the CODAP model architecture, each layer comprises 100 neurons, illustrated as blue nodes. These neurons are strongly connected, with each neuron in one layer forming connections to every neuron in the subsequent layer. The initial hidden layer acts as a feature transformer, mapping raw inputs into an intermediate space, and the second hidden layer builds upon this transformed feature space, enabling the MLP to integrate these initial patterns into higher-order representations. To enhance the network’s ability to model non-linear relationships, a characteristic essential for capturing the complexities of mental health data, the Rectified Linear Unit (ReLU) activation function was applied within these hidden layers.
The output layer, indicated by red nodes, does not directly output the final sds score and stai-s score. Instead, it produces an intermediary set of 20 features to calculate these mental health scores. The output includes estimates for a series of scores: through and through . Each set comprises 20 distinct scores. The stai-s scores gauge levels of anxiety, ranging from one (indicating minimal presence) to four (indicating a high degree), based on responses to various questions like “I feel calm,” “I feel secure,” and others along these lines.
Similarly, the sds scores measure aspects of depression on the same scale of one to four, with questions geared towards identifying symptoms of depression, such as changes in weight or eating habits, exemplified by statements like “I notice I am losing weight” and “I eat as much as I used to.”
The actual computation of the sds score and stai-s score, symbolized by yellow nodes, is performed using specific formulas derived from (Shuster et al., 2021). The output features include predictions of responses to each item within the questionnaires, which are then used to calculate the total scores for each scale.
The Adam optimization algorithm was employed to refine the network’s predictive accuracy. This optimizer iteratively adjusts the network’s weights to minimize the discrepancy, quantified by the Mean Squared Error (MSE), between CoDAP’s predictions and the actual observed values from the dataset.
3.3.2. Cross Fold Validation
A critical aspect of our methodology was the validation and optimization of our model. We utilized the K-fold cross-validation technique as a robust strategy to counteract overfitting and assure our model’s reliability and generalizability across different subsets of the data demonstrated in Algorithm 1. This method involved partitioning the dataset into several folds, systematically using each as a validation set while training the model on the remaining data. This allowed us to rigorously test and refine the model, ensuring its accuracy and robustness. This is crucial in mental health prediction, where overfitting to a particular subset of data could lead to misleading results. Also, since each fold serves as a validation set at some point, cross-validation reduces the likelihood of the model’s performance being biased by a particular random split of training and test data. This is especially important when dealing with complex and potentially heterogeneous datasets, such as those involving mental health symptoms during a pandemic. Additionally, this method maximizes the data utilization, as the available data was limited. K-fold cross-validation allows for the efficient use of data, as each observation is used for training and validation at some point.
3.3.3. Hyperparameter Tuning
For k-fold cross-validation, we opted for to strike a balance between obtaining a stable estimate of model performance and maintaining efficient computational processing. Additionally, we experimented with various hyperparameter tuning configurations of hidden layers, neurons per layer, and learning rates, each assessing the impact on model performance. This process was crucial for identifying the optimal parameters to produce the most accurate and reliable predictions. As a result, the hyperparameters specified for our model, CoDAP, are as follows: learning rate of 0.01, 100 epochs of training, ReLU activation function, Adam optimization algorithm, and the MSE as the loss function.
| LR | 0.1 | 0.05 | 0.01 | 0.005 | 0.001 |
|---|---|---|---|---|---|
| MSE | 2.8502 | 1.5652 | 0.5239 | 0.5630 | 0.5939 |
| Nodes | 10 | 50 | 100 | 150 | 200 |
|---|---|---|---|---|---|
| MSE | 0.8576 | 0.5474 | 0.5420 | 0.5713 | 0.6234 |
Upon finalizing the hyperparameters, we trained CoDAP using the entire training set, which incorporated all the folds from our cross-validation process. The model thus trained was then employed to predict and compare results with the designated testing set. This approach, encompassing multiple rounds of training, hyperparameter adjustments, and validation, contributed significantly to the robustness and reliability of CoDAP for predictive analysis.
3.4. Explaining the Model Results
To explain the CoDAP model results, we employed Local Interpretable Model-agnostic Explanations (LIME) (Ribeiro et al., 2016) for approximating the model with a simpler, interpretable model around the vicinity of the prediction that needs to be explained. LIME is particularly useful because it is model-agnostic.
Because LIME is designed to explain model predictions for individual instances rather than offering a comprehensive interpretation of the entire model, we created an objective overview of the most important features. We first normalized the values for each of our features. Then, we leveraged LIME’s local interpretation, dividing individual features into categories specified by LIME and averaging importance scores. Afterward, we carried out a series of ten iterative steps. We generated LIME reports in each iteration that focused separately on two specific scores: stai-s score and sds score, based on our test dataset. After the ten iterations, we grouped the same features and averaged their importance scores. This process helped us understand how each category of features influenced the stai-s score and sds score across all iterations. We then created a graphical representation illustrating the most important categories corresponding to both stai-s score and sds score. In this step, a uniform color scheme was adopted for categories belonging to the same feature to improve the readability of the graph. We selected the top 40 most important features from there and grouped items within the same category. This approach helped discern the important features that influence a particular prediction to explain the predictive capabilities of our model.
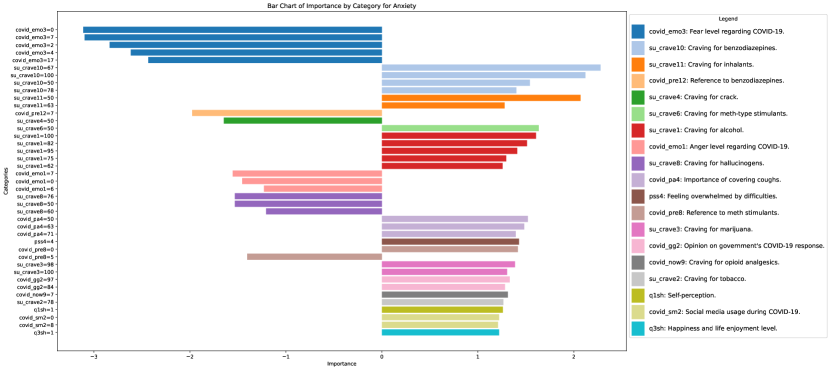
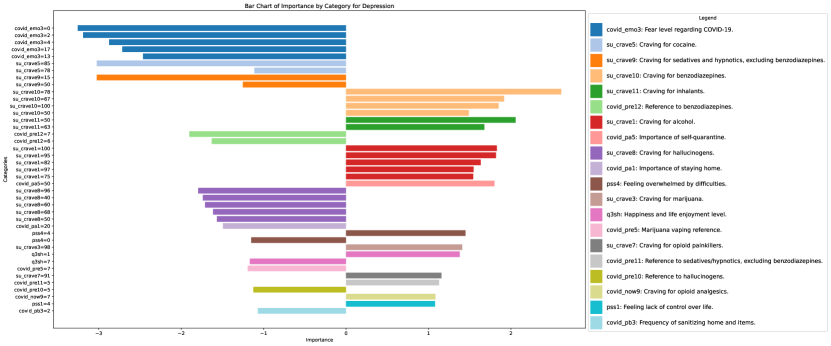
In particular, by averaging the influence scores generated by LIME, we identified key features that significantly impact the model’s predictions. Notably, certain features exerted either a positive or negative influence on the model’s anxiety and depression scores. We started by recognizing the category using the legend and finding the corresponding y-axis score to interpret the graph. The x-axis displays the overall importance score from LIME, where negative values indicate a negative correlation with the anxiety or depression scores, and positive values suggest a positive correlation with the anxiety or depression scores.
Among the most influential features were su_crave10 and su_crave3, which gauge the craving intensity for substances like Xanax and marijuana. Both of these features showed a positive correlation with anxiety, aligning with the understanding that individuals with heightened cravings for addictive substances tend to exhibit increased stress levels. This can be correlated with two alternative explanations due to the COVID-19 pandemic: 1) supply for these drugs was disrupted, leading to increased mood symptoms; 2) people who were taking these already had more mental health issues to start with; therefore, it is not surprising they craved more for drugs during the pandemic and had more depression/anxiety.
Another notable feature, Covid_emo3, measures the fear associated with COVID-19. Interestingly, this feature displayed a negative correlation with anxiety and depression at lower levels, suggesting that individuals with diminished COVID-19 fears might experience less overall stress and, subsequently, fewer mood symptoms. This observation is consistent with the premise that fear of COVID-19 is a primary stressor during this period. Similarly, additional features, such as Covid_emo4, demonstrated parallel trends, reinforcing our model’s ability to capture the nuanced interplay between various factors and their impact on anxiety and depression.
4. Results
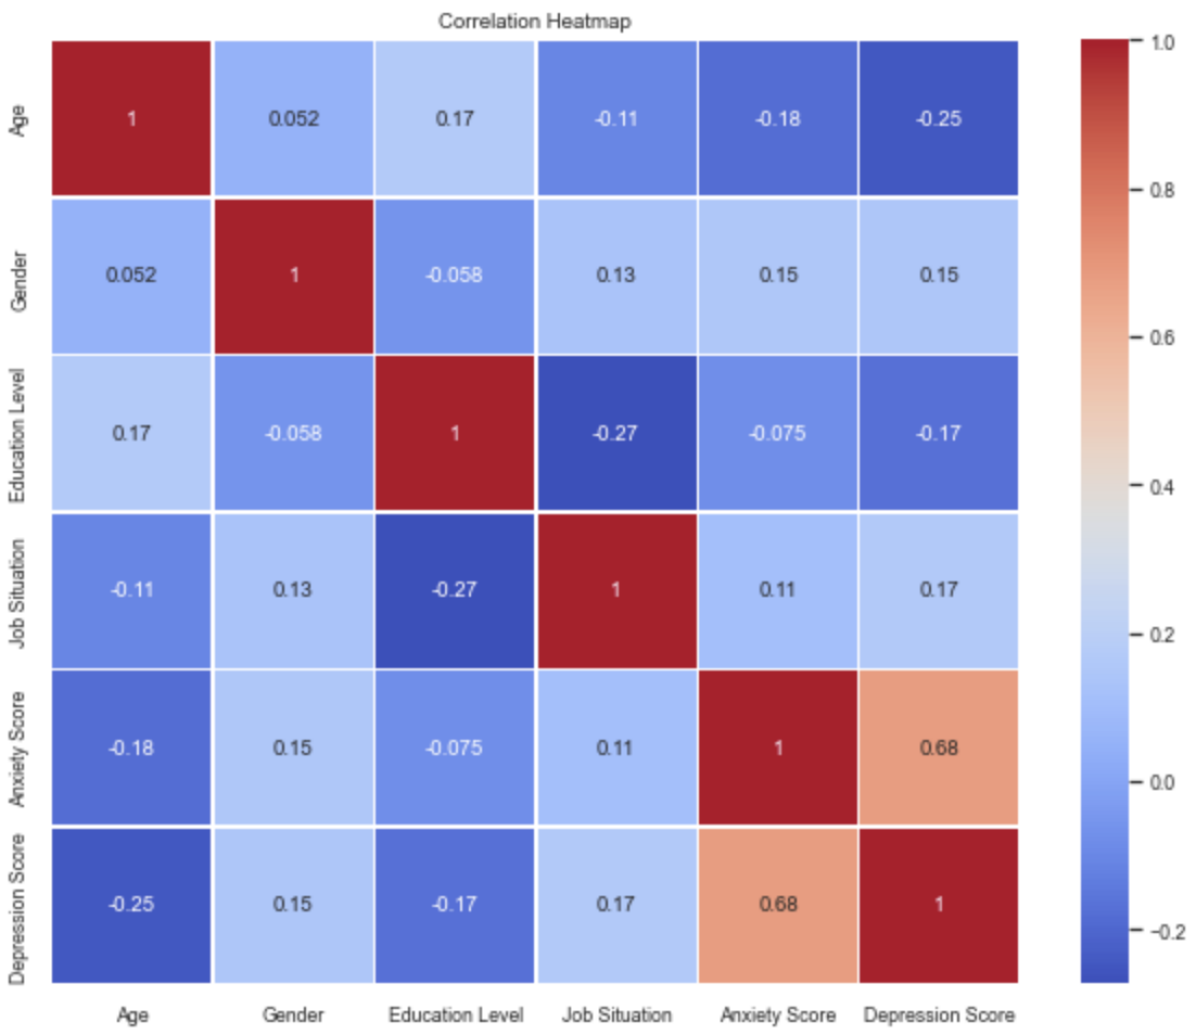
Our exploratory data analysis revealed noteworthy patterns and correlations. We observed trends in mental health scores across different demographic groups and during various pandemic phases. For instance, our findings (see Figure 1) indicate that across all participants and pandemic phases, younger people typically exhibited higher levels of depression and anxiety. Moreover, there was a negative correlation between income and the levels of depression and anxiety, with individuals of lower income often experiencing more pronounced mental health challenges during the pandemic period. These insights were instrumental in shaping the design and focus of CoDAP, providing a solid foundation for predictive analysis.
Since predicting the level of anxiety and depression can be framed as a regression problem, we utilized the MSE, which was particularly suitable for this task. The CODAP model demonstrated high accuracy in predicting the sds and stai-s scores, indicating its effectiveness in capturing the complex relationships within the data. The use of MSE as a loss function was particularly beneficial, given its sensitivity to large errors and computational efficiency. The MSE also provided a standard metric to compare the performance of different models and configurations. Table 3 presents the MSE in the five rounds of the cross-validation process.
| Round | 1 | 2 | 3 | 4 | 5 | Average |
|---|---|---|---|---|---|---|
| MSE | 0.5064 | 0.4924 | 0.5720 | 0.5401 | 0.5393 | 0.5300 |
Throughout the training and k-fold cross-validation process, the CODAP model predicts 20 features each for calculating sds score and stai-s score. Despite the limitation of a relatively small data set, the model’s predictive performance is promising, with an average MSE of approximately 0.53 across five rounds of cross-validation for the feature values utilized in computing the sds score and stai-s score. In the dataset, the feature values were assigned positive or negative weights based on their contributions to increasing or decreasing levels of anxiety and depression. The outcome features sds score and stai-s score were normalized to range from 1 to 4, with 1 denoting the minimum level and 4 representing the maximum level. Also, the cross-validation outcomes affirm the model’s reliability and underline its robustness, with MSE values demonstrating consistency within the range of 0.49 to 0.57 across different training rounds. This consistency is crucial because it suggests that the model is stable and reliable across different subsets of data. Although a smaller MSE would be preferred, given the primary task of the MLP is to understand which features are important predictors of mental health state and the range and the variance of the outcome features, i.e., the target variables, we deem these average MSE of 0.53 to be a good metric for the task at hand.
5. Conclusion and Future Work
Mental health has become an increasingly important area in healthcare, and this trend is anticipated to persist, if not escalate, in the future. As such, being able to predict mental health symptoms is critical for us to monitor and intervene, given the rising level of global health crises, including and beyond COVID-19. Our exploratory data analysis, data reformatting, and robust model validation techniques contribute to the validity of our research findings. The model’s performance suggests a promising foundation, even though it is based on a limited data set. By focusing on the quantitative attributes of individuals (e.g., demographics, COVID-specific behaviors, etc.) and the time elapsed since the event, our research provides valuable insights into the dynamics of mental health during such crises. Our model can be tailored and refined with additional data and feedback. This ongoing improvement is particularly important in a rapidly changing scenario like a pandemic, where initial models may need refinement as more data becomes available and the nature of the mental health challenges evolves. However, since the CoDAP’s training dataset was primarily collected during the COVID-19 pandemic (Shuster et al., 2021), the results may not generalize well to pre- and post-pandemic conditions. Nevertheless, we believe the CODAP model can be adapted and applied to different contexts, providing valuable tools for understanding and predicting mental health responses to various environmental and chronic stressors.
Our vision for CoDAP is to harness the model’s predictive power by integrating it into a user-friendly application that will capture baseline mental health measures, including but not limited to age, income, and craving — features our model identified as having significant predictive importance. The application will then be able to forecast future changes in mental health status based on these baseline measures and ongoing user interaction. Consequently, while direct measures of depression and anxiety are integral components of the initial assessment, the predictive model will be essential for providing longitudinal insights and anticipating future mental health trends for users. This approach aims to offer users not only a snapshot of their current mental health status but also a proactive tool for monitoring and managing their mental health over time. To achieve this, we plan to utilize the Auto-Regressive Integrated Moving Average (ARIMA) model (Nelson, 1998) for time series prediction. Such longitudinal analysis is critical for understanding the dynamics of mental health and identifying patterns or changes that may require intervention.
In conclusion, the ultimate goals of this work are to enhance understanding of mental health dynamics, using the predictive power of MLPs that analyze complex psychological data and extend to other techniques such as time-series analysis and transfer learning to gauge individuals’ mental health conditions in wide-ranging scenarios.
Resources: The GitHub repository with our code and documentation is available at https://github.com/block-iot/MentalHealth.
References
- (1)
- Cullen et al. (2020) Walter Cullen, Gaurav Gulati, and Brendan D Kelly. 2020. Mental health in the COVID-19 pandemic. QJM: An International Journal of Medicine 113, 5 (2020), 311–312.
- D’Alfonso (2020) Simon D’Alfonso. 2020. AI in mental health. Current Opinion in Psychology 36 (2020), 112–117.
- Freyhofer et al. (2021) Sebastian Freyhofer, Niklas Ziegler, Elisabeth M de Jong, and Michaéla C Schippers. 2021. Depression and anxiety in times of COVID-19: How coping strategies and loneliness relate to mental health outcomes and academic performance. Frontiers in psychology 12 (2021), 682684.
- Hueniken et al. (2021) Katrina Hueniken, Nibene Habib Somé, Mohamed Abdelhack, Graham Taylor, Tara Elton Marshall, Christine M Wickens, Hayley A Hamilton, Samantha Wells, Daniel Felsky, et al. 2021. Machine learning–based predictive modeling of anxiety and depressive symptoms during 8 months of the COVID-19 global pandemic: Repeated cross-sectional survey study. JMIR mental health 8, 11 (2021), e32876.
- Malik et al. (2023) Arun Malik, Mohammad Shabaz, Evans Asenso, et al. 2023. Machine learning based model for detecting depression during Covid-19 crisis. Scientific African 20 (2023), e01716.
- Moreno et al. (2020) Carmen Moreno, Til Wykes, Silvana Galderisi, Merete Nordentoft, Nicolas Crossley, Nev Jones, Mary Cannon, Christoph U Correll, Louise Byrne, Sarah Carr, et al. 2020. How mental health care should change as a consequence of the COVID-19 pandemic. The lancet psychiatry 7, 9 (2020), 813–824.
- Nelson (1998) Brian K Nelson. 1998. Time series analysis using autoregressive integrated moving average (ARIMA) models. Academic emergency medicine 5, 7 (1998), 739–744.
- Nemesure et al. (2021) Matthew D Nemesure, Michael V Heinz, Raphael Huang, and Nicholas C Jacobson. 2021. Predictive modeling of depression and anxiety using electronic health records and a novel machine learning approach with artificial intelligence. Scientific reports 11, 1 (2021), 1980.
- Prince et al. (2007) Martin Prince, Vikram Patel, Shekhar Saxena, Mario Maj, Joanna Maselko, Michael R Phillips, and Atif Rahman. 2007. No health without mental health. The lancet 370, 9590 (2007), 859–877.
- Ribeiro et al. (2016) Marco Tulio Ribeiro, Sameer Singh, and Carlos Guestrin. 2016. “Why should I trust you?” Explaining the predictions of any classifier. In Proceedings of the 22nd ACM SIGKDD international conference on knowledge discovery and data mining. ACM, 1135–1144.
- Shukla and Seneviratne (2023) Manan Shukla and Oshani Seneviratne. 2023. MentalHealthAI: Utilizing Personal Health Device Data to Optimize Psychiatry Treatment. In AMIA Annual Symposium Proceedings, Vol. 2023. American Medical Informatics Association, 641.
- Shuster et al. (2021) Anastasia Shuster, Madeline O’Brien, Yi Luo, Laura A Berner, Ofer Perl, Matthew Heflin, Kaustubh Kulkarni, Dongil Chung, Soojung Na, Vincenzo G Fiore, and Xiaosi Gu. 2021. Emotional adaptation during a crisis: Decline in anxiety and depression after the initial weeks of COVID-19 in the United States. Translational psychiatry 11, 1 (2021), 435.
- Spielberger (1989) CD Spielberger. 1989. State-Trait Anxiety Inventory: Bibliography (2nd, Editio ed.).
- Talevi et al. (2020) Dalila Talevi, Valentina Socci, Margherita Carai, Giulia Carnaghi, Serena Faleri, Edoardo Trebbi, Arianna di Bernardo, Francesco Capelli, and Francesca Pacitti. 2020. Mental health outcomes of the CoViD-19 pandemic. Rivista di psichiatria 55, 3 (2020), 137–144.
- Zung (1965) William WK Zung. 1965. A self-rating depression scale. Archives of general psychiatry 12, 1 (1965), 63–70.