![[Uncaptioned image]](/html/2403.05634/assets/x1.png)
Advanced Millimeter-Wave Radar System for Real-Time Multiple Human Tracking and
Fall DetectionAbstract
This study explores an indoor system for tracking multiple humans and detecting falls, employing three Millimeter-Wave radars from Texas Instruments placed on x-y-z surfaces. Compared to wearables and camera methods, Millimeter-Wave radar is not plagued by mobility inconvenience, lighting conditions, or privacy issues. We establish a real-time framework to integrate signals received from these radars, allowing us to track the position and body status of human targets non-intrusively. To ensure the overall accuracy of our system, we conduct an initial evaluation of radar characteristics, covering aspects such as resolution, interference between radars, and coverage area. Additionally, we introduce innovative strategies, including Dynamic DBSCAN clustering based on signal energy levels, a probability matrix for enhanced target tracking, target status prediction for fall detection, and a feedback loop for noise reduction. We conduct an extensive evaluation using over 300 minutes of data, which equates to approximately 360,000 frames. Our prototype system exhibits remarkable performance, achieving a precision of 98.9% for tracking a single target and 96.5% and 94.0% for tracking two and three targets in human tracking scenarios, respectively. Moreover, in the field of human fall detection, the system demonstrates a high accuracy of 98.2%, underscoring its effectiveness in distinguishing falls from other statuses.
1 Introduction
Human activity recognition (HAR) systems have garnered significant attention in industry, particularly in the field of camera-based systems leveraging machine learning techniques [1, 2, 3, 4]. However, these camera-based systems come with drawbacks, including privacy invasion, dependency on specific lighting conditions, and reduced performance in the presence of smoke or fog. As a solution to these challenges, many researchers are turning to Millimeter-Wave (mmWave) radar technology employing the Frequency Modulated Continuous Wave (FMCW) technique.
The mmWave radar operates at a high-frequency range (from 76 to 81 GHz), providing several advantages such as high resolution and improved anti-interference capabilities. Consequently, FMCW mmWave radar technology has demonstrated significant potential in various indoor HAR applications, including posture detection [5, 6, 7] and human identification [8]. Furthermore, human tracking and fall detection represent popular applications for mmWave radar, addressing critical safety concerns in various settings such as the healthcare system for the elderly. Many researchers have proposed numerous mmWave radar systems for human tracking as well [9, 8, 10].
In this paper, we delve into the application of mmWave radar for human tracking and fall detection, covering the operational principles, ongoing research, and development efforts. Additionally, we present a real-time system and elaborate on how it successfully accomplishes its objectives. Leveraging three FMCW radar IWR1843 development boards from Texas Instruments (TI), we enhance the precision of human tracking and fall detection. Consequently, our system delivers accurate real-time results for multiple human targets in indoor environments. The primary contributions of our work include:
-
•
We explore the impact of the mmWave radar’s implementation angle on the system’s coverage. Furthermore, we introduce a new approach to deploying multiple radars with a corresponding coordinate system that expands the coverage area and captures the point cloud from the scene.
-
•
We present a multi-process system designed to handle data reception, synchronization, and pre-processing tasks concurrently for three radars. Additionally, the system encompasses post-processing for human target tracking and status classification in real-time.
-
•
We introduce innovative strategies, including Dynamic DBSCAN for improved target detection, a probability matrix for enhanced target tracking, target status prediction for fall detection, and a feedback loop for noise reduction.
-
•
We assess our system through over 300 minutes of experimentation and demonstrate its high accuracy in both human target tracking and fall detection.
-
•
We make our work open-source at https://github.com/ DarkSZChao to further promote work in this field.
The remaining sections of this paper are organized as follows: Section 2 provides a brief overview of the principles and related works concerning mmWave radar. In Section 3, we conduct an evaluation of the mmWave radar system, covering aspects such as resolution, angle of view compensation, and the relationship between radar placement and coverage. Section 4 illustrates the mmWave radar setup in our test environment. Subsequently, Section 5 delves into the details of our software framework’s workflow and its utilization for human tracking and fall detection. We present an evaluation of our real-time system performance in scenarios involving multiple people in Section 6. Finally, Section 7 outlines our conclusions and discusses avenues for future work.
2 Background and Related Work
In this section, we present an overview of current state-of-the-art mmWave radars using the FMCW technique and novel applications for human tracking and fall detection of this hardware.
2.1 Fall Detection Approaches
The prevalent fall detection methods can be categorized into two approaches: wearable and non-wearable solutions. Wearable devices, incorporating sensors like inertial measurement units, accelerometers, and gyroscopes on the human body, as proposed in [11, 12, 13], enable the fusion of sensor data for fall detection and the safeguard of elderly individuals. However, wearable devices pose inconveniences for the elderly, especially those with poor memory and limited mobility. To address this issue, non-wearable camera-based fall detection systems, as suggested in [3, 4], are adopted, leveraging deep learning and background subtraction techniques for indoor environments. While these systems yield accurate results across various distances, they face challenges related to privacy concerns due to camera intrusiveness and limitations arising from lighting conditions.
To address challenges related to the intrusiveness and lighting limitations faced by camera-based fall detection systems, many researchers have shifted their focus to detecting human bodies using mmWave radars [9, 14, 15]. Typically, mmWave radar is deployed in scenarios demanding higher accuracy due to the use of short-wavelength electromagnetic waves. Beyond its successful application in autonomous driving, mmWave radar has been employed in the field of human tracking and fall detection. A recent real-time human detection and tracking system using Texas Instruments (TI) mmWave radars has been established by [9]. They introduce a software framework capable of communicating with multiple radars, consistently achieving over 90.4% sensitivity for human detection in an indoor environment. Subsequently, research in [5] delves into human posture, presenting an analysis report on the capabilities of mmWave radar in human recognition. Building on this analysis, [7] merges mmWave radars with the Convolutional Neural Networks (CNN) technique to accurately estimate human postures with an average precision of 71.3%. Moreover, [6, 16] implement CNN for point cloud analysis to estimate human skeletons and the postures of patients. Our work, inspired by the human detection system in [9, 14], deploys three IWR1843 mmWave radars on the x-y-z surfaces concurrently to capture more robust human body reflection signals. Additionally, we establish a concurrent real-time system to track humans and classify target status.
2.2 MmWave Radar Preliminaries
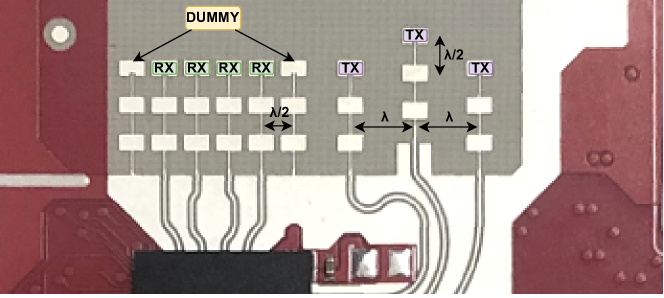
This section provides a concise overview of mmWave radar theory, with more comprehensive details available in [17]. For our experiments on human tracking and fall detection, we employ IWR1843 FMCW mmWave radars developed by Texas Instruments (TI), operating at a frequency range of 76-81 GHz with a maximum available bandwidth of 4 GHz. This radar development board features three transmitters (TX) and four receivers (RX), resulting in twelve virtual antennas operating simultaneously [18, 19] (see Fig.1).
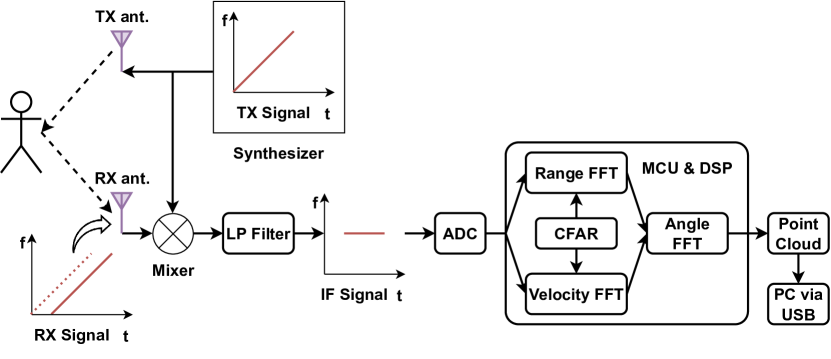
With the FMCW technique, the mmWave radar can transmit chirp signals () with a continuously varying frequency within the bandwidth. The reflected signal () is collected and mixed with to generate an intermediate frequency (IF) signal, as illustrated in Fig.2. The frequency and phase of the IF signal correspond to the difference between and . Utilizing Cortex-R4F and C674x DSP chips, a data processing chain is then applied to the IF signal to create a Range-Doppler Map (RDM) using Fast Fourier transforms (FFT). Subsequently, the Constant False Alarm Rate (CFAR) algorithm is employed to identify peaks by estimating the energy strength on the RDM [20].
2.2.1 Distance Measurement
The target distance can be calculated using Equation (1), where represents the slope rate of the transmitted chirp, and is the time of flight. The time of flight () is the round-trip distance () divided by the speed of light (). Consequently, we can estimate the target distance () as follows:
| (1) |
2.2.2 Velocity Measurement
To ascertain the target velocity, the radar emits two chirps separated by time . Each reflected chirp undergoes FFT processing to identify the range of the target (Range-FFT). The Range-FFT corresponding to each chirp exhibits peaks in the same location, but with a different phase. The observed phase difference corresponds to motion in the target of . The velocity can be computed using Equation (2) where represents the phase difference:
| (2) |
For precise velocity estimation, the radar transmits multiple consecutive chirps to create a chirp frame. Subsequently, it conducts a Doppler-FFT over the phases received from these chirps to determine the velocity.
2.2.3 Angle Measurement
The configuration of multiple transmitters (TX) and receivers (RX), as depicted in Fig.1, introduces a variance in distance between the target and each antenna, causing a phase shift in the peak of the Range-FFT or Doppler-FFT. The FMCW radar system leverages this phase difference between two chirps received by RX modules to calculate the angle of arrival (AoA) for the target, as illustrated in Fig.3.
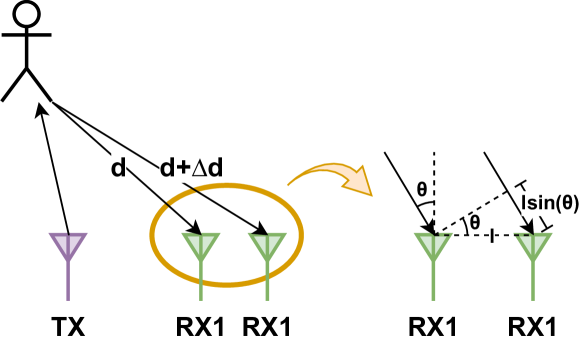
Assuming a known RX antenna with a spacing of (Fig.1), we can determine the AoA () from the measured using Equation (3):
| (3) |
Finally, the Arm Cortex-R4F-based radio control system on board will provide the point cloud of the targets through the XDS110 and USB interface. The raw ADC data is also provided through the LVDS interface for further processing [18, 19]. Additionally, the FMCW radar can operate in both day and night conditions and also has the ability to detect multiple targets simultaneously [21], which makes it suitable for use in our multiple human tracking and fall detection system.
3 Radar System Evaluation
3.1 Radar Resolution
Before evaluating the system’s accuracy, we first assess the resolution of the IWR1843 mmWave radar. Referring to [17, 22] and Fourier Transform theory, for an IF signal to be distinguished from another, the following statement needs to be satisfied:
| (4) |
where is the chirp duration. Since is based on Equation (1), we can express (where the bandwidth is equal to the product of chirp slope rate and duration ). This leads to Equation (5) below:
| (5) |
In this equation, represents the 4 GHz bandwidth of the IWR1843 radar. Consequently, the theoretical resolution () is calculated to be 3.75 centimeters.
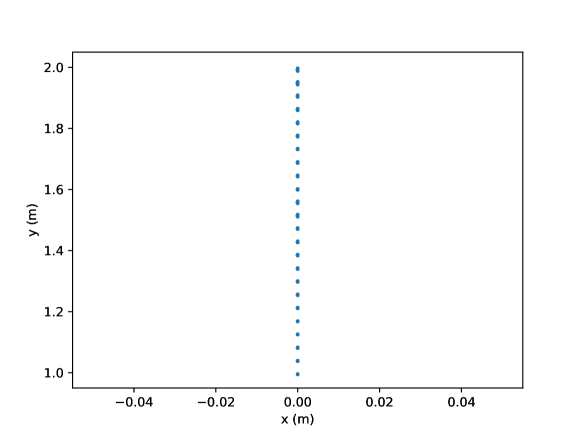
To verify the calculation above in practice, an experiment takes place in an empty room, with the corner reflector being the sole target within the area of interest. This corner reflector, designed to reflect signals in the opposite direction, essentially represents a single reflection point in practical scenarios. To enhance the intensity of the reflected signal, the corner reflector is covered with multiple layers of tin foil. The mmWave radar is positioned at a height of 1.2 meters, matching the corner reflector’s height. The corner reflector is initially placed 1 meter in front of the mmWave radar, with the distance gradually increased by 1 centimeter until it reaches 2 meters. The resolution results are depicted in Fig.4. It was observed that the practical resolution achieved was approximately 4 centimeters, aligning closely with the theoretical resolution above. Such a resolution level is adequate for maintaining user privacy and simultaneously yielding a rich dataset for comprehensive analysis.
3.2 Multiple Radar Arrangement
The theoretical Angle of View (AoV) for mmWave radars is in both horizontal and vertical directions. However, according to the radar perspective analysis report in [5], the effective AoV of a single radar is reduced to around horizontally and vertically due to antenna characteristics and signal attenuation. This reduced vertical AoV means that a radar placed at a height of 1 meter can only capture signals reflected from the human chest to the knee, limiting its ability for complete human body detection.
To address this limitation, a radar placed on the ceiling can capture data points representing the human head. Additionally, employing two radars facing different directions enables the distinction of human targets even when one is positioned behind another, ensuring accurate tracking of multiple human subjects. Therefore, we have deployed three identical TI IWR1843 mmWave radars on both the wall and ceiling. This setup allows us to capture strong signals not only from the human main body but also from the human head. For detailed information, please refer to Section 4.
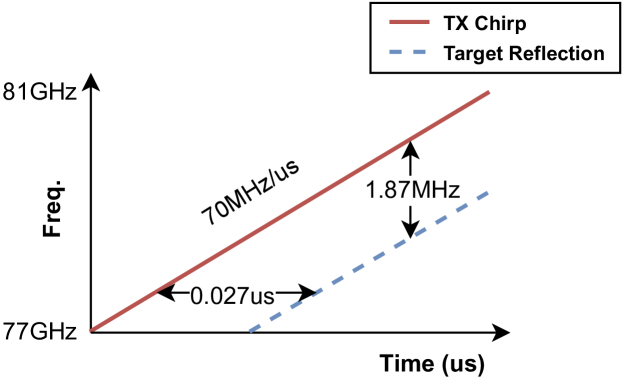
When employing multiple radars, it is crucial to ensure that they do not interfere with each other. If we consider a maximum measurement distance of 4 meters (limited by the longest edge of our experimental field), the round-trip time-of-flight would be 0.027 microseconds. Given a slope rate of 70 MHz/microsecond, this time interval corresponds to a frequency change of approximately 1.87 MHz, as illustrated in Fig.5.
Referring to the interference probability equation (Equation (6)) for radars presented in [9], we can compute the interference probability for our scenario involving three radars. In this equation, represents the 4 GHz chirp bandwidth of the TI radar, and denotes the interference bandwidth. This implies that radars will only interfere if the frequency difference between any two radars falls within the 5.6 MHz range for our experiment [9]. Ultimately, the interference probability for three radars is 0.4%, assuming that the radars are activated at random times.
| (6) |
Additionally, [9] demonstrates that the average variances of radar detection within 3 meters (which covers most cases in our experimental setup) or detections with signal strength greater than -3 dB (when signals are strong enough to be identified) are lower. Consequently, we can conclude that the interference between radars for our experiment is minimal and can be disregarded.
3.3 Radar Placement and Coverage Evaluation
In our previous study [23], a significant effort was made to enhance the resolution of point clouds pertaining to the human body. Initially, we positioned the radars at a height of 1 meter on the wall, placed perpendicular to the ground, thereby ensuring comprehensive coverage from knee to neck level. Despite these efforts, this arrangement yielded suboptimal resolution and restricted recognition capabilities when human subjects approached the radar closely. Specifically, as depicted in Fig.6, this setup led to a diminished coverage area of approximately 50% when the human target approached within 1 meter of the radar. This limitation arose due to the inadequacy of the mmWave signal emitted from the radar (green) positioned at a height of 1 meter, failing to sufficiently spread across the human body’s main area before encountering reflections.
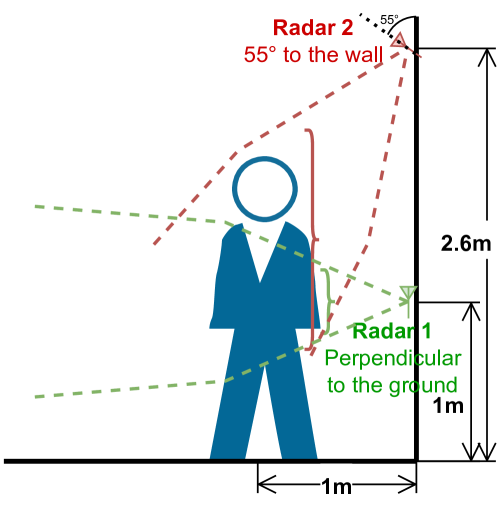
To address this limitation, we choose to move the radar higher and tilt it at a specific angle to point it towards the center of the ground as the radar (red) shown in Fig.6. This alteration aims at broadening the mmWave signal’s coverage, allowing it to encompass a larger area of the human body before reflection. The tilt angle can be adjusted according to height and distance needs. In our experiment, we decided to angle the radar at to the wall, which results in a coverage area twice as large as that of the green radar when a human target approaches it. As illustrated in Fig.7, we utilized 3D printing technology to create the radar case, ensuring easy installation and providing support for the precise tilt.
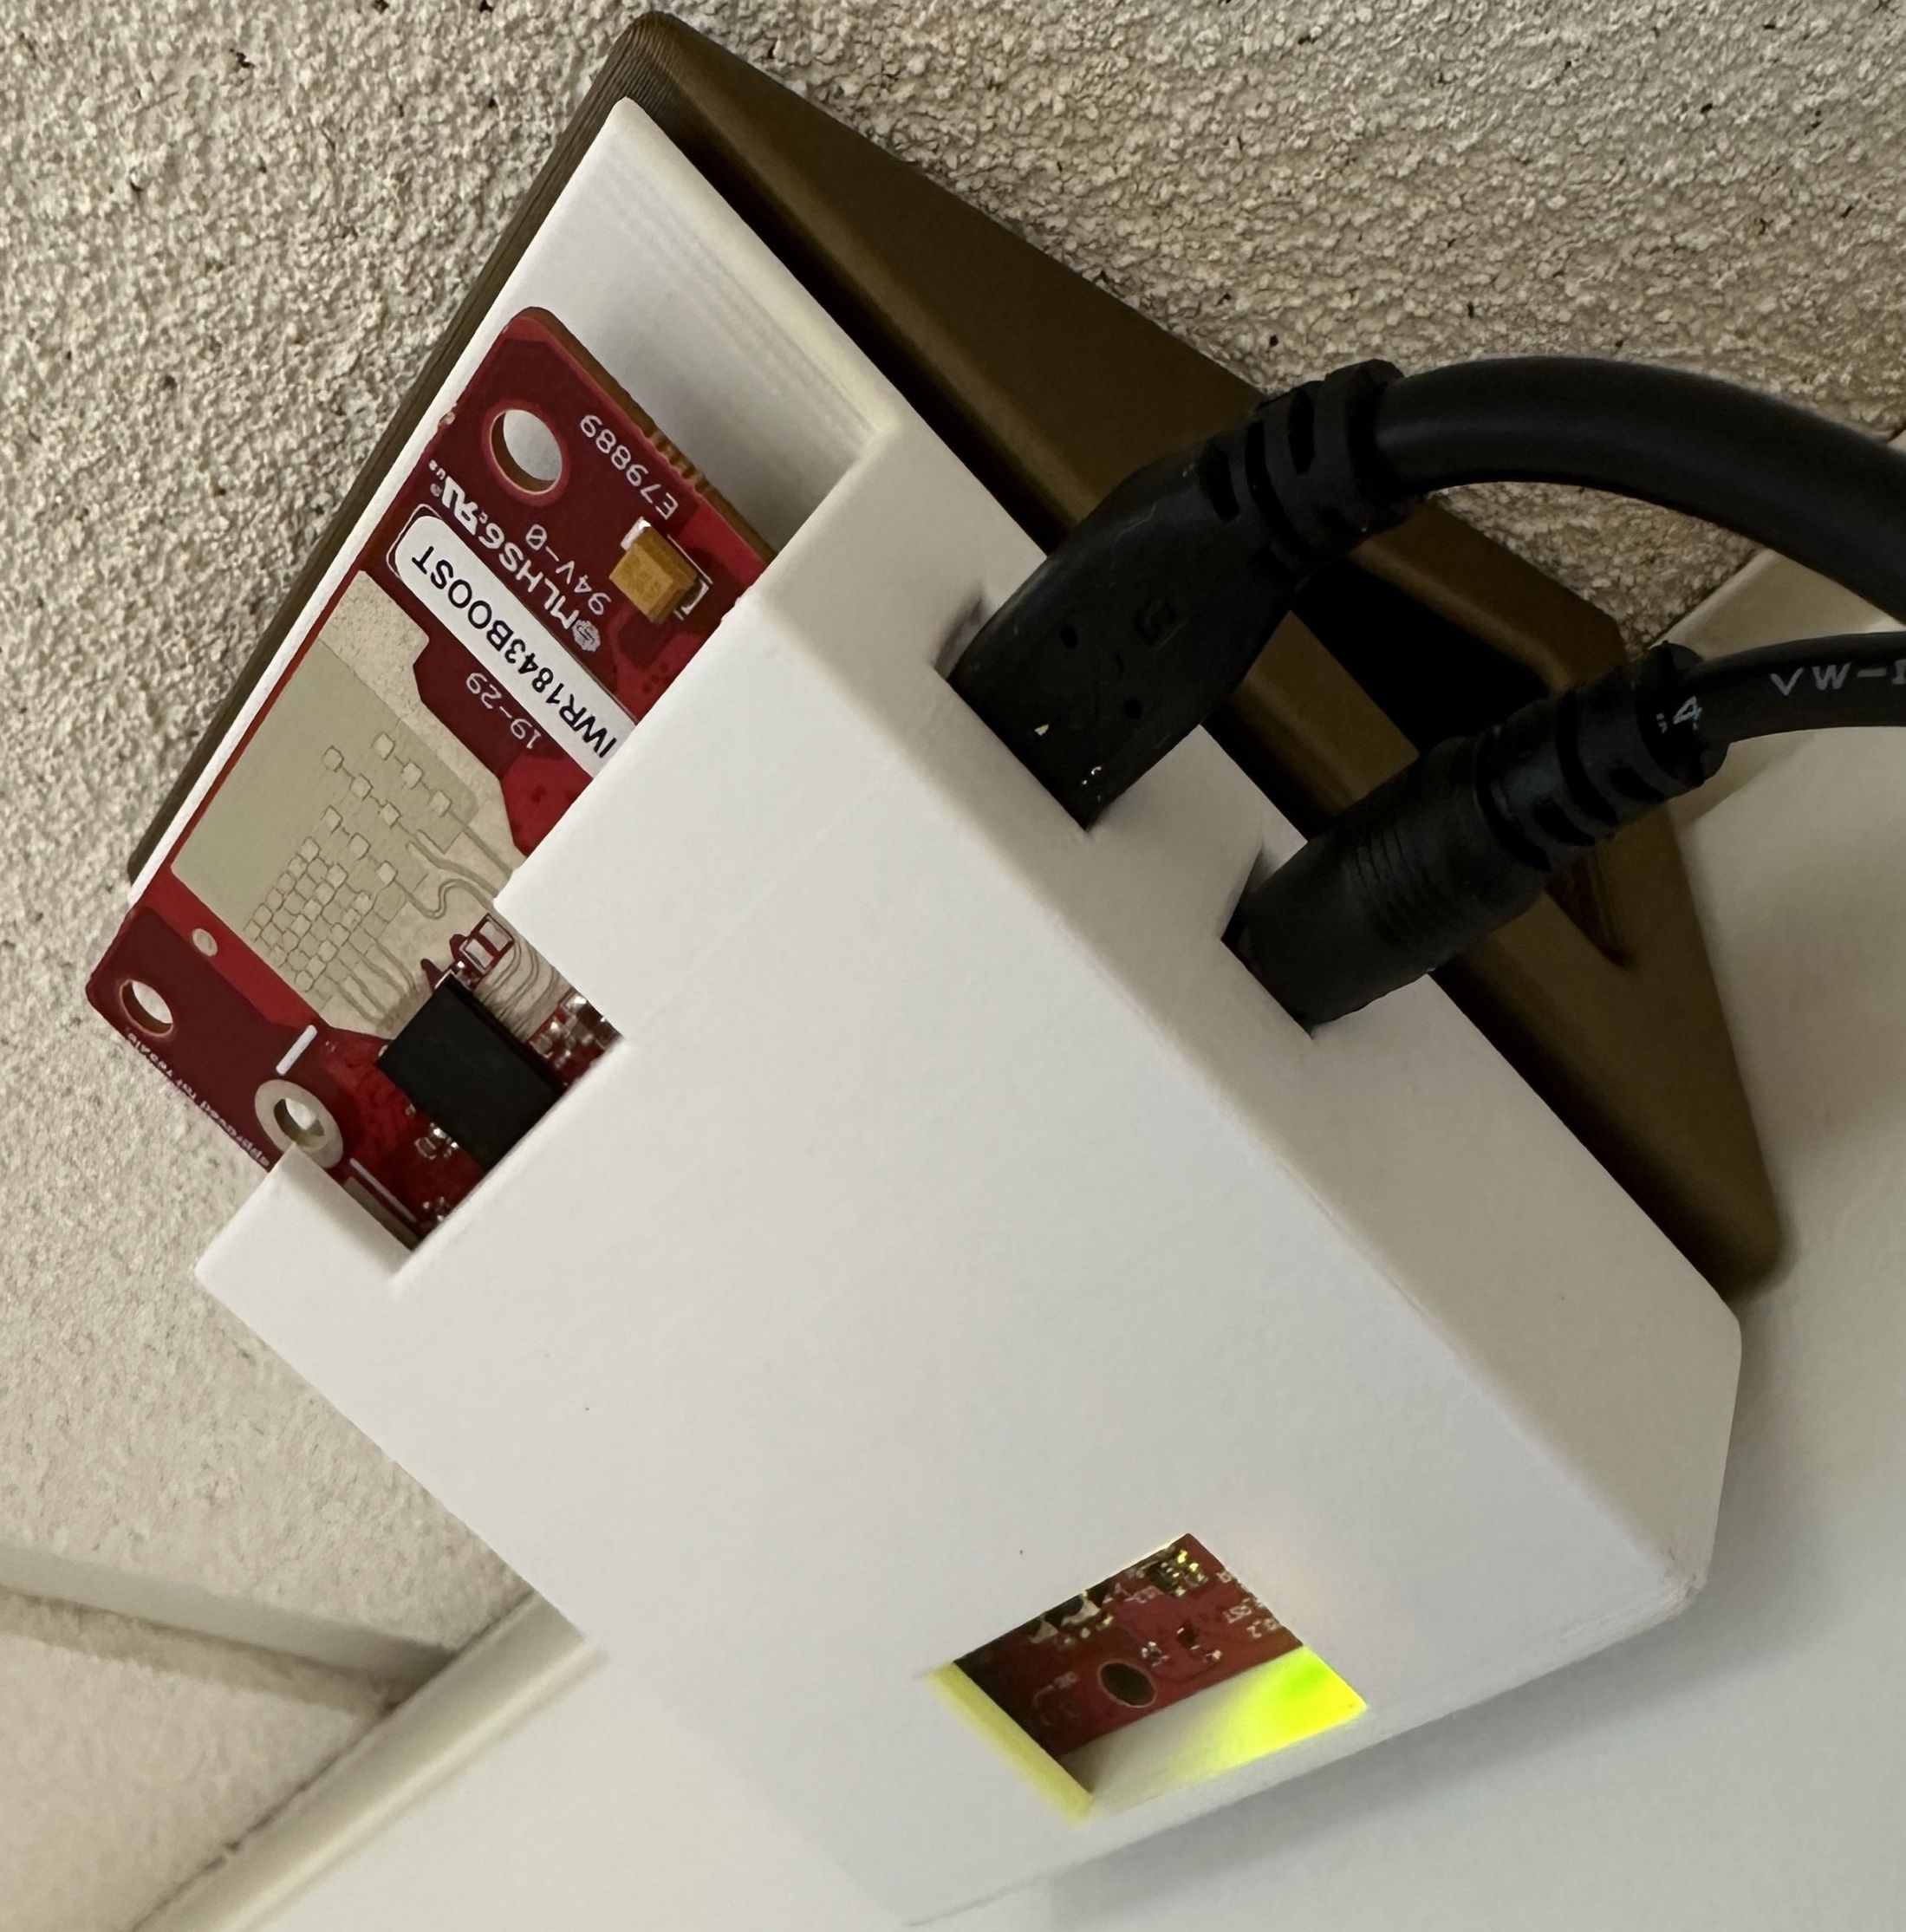
Fig.8 accumulates 200 frames over a span of 10 seconds, depicting a scenario where a person stands stationary approximately 1 meter away from the wall. In the left column, the point cloud received and the corresponding histogram for the radar positioned at a height of 1 meter are displayed. Most data points cluster tightly in the middle of the human target due to the radar’s limited field of vision, leading to the loss of information regarding the head and legs. Consequently, the system might interpret this as a seated human due to the absence of data on the head and chest [23].
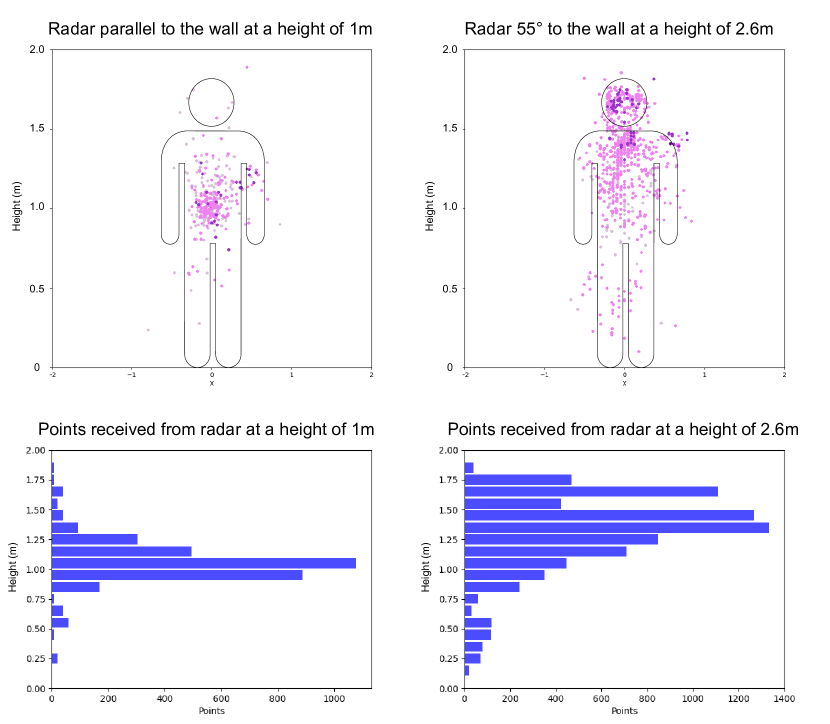
However, the point cloud and histogram shown in the right column, captured by the radar placed at a height of 2.6 meters, reveal a significant concentration of points representing the human head, chest, abdomen, and legs. This comprehensive data ensures accurate classification of the human’s status, even when the person is close to the wall, eliminating any potential blind spots.
In order to compensate for the tilt applied to the radar device, a point cloud rotation adjustment is implemented to map the data points into global coordinates, details of which can be found in Section 5.1.
4 Hardware Setup
The experimental space occupies dimensions of 4 meters in width, 4.2 meters in length, and 2.6 meters in height. Within this space, Radar 1 is vertically positioned on the desk adjacent to the wall, Radar 2 is installed on the wall with a tilt, and Radar 3 is mounted on the ceiling, directed towards the ground, as depicted in Figures 9 and 10. All three radars are connected to the PC through USB cables and extensions, powered by AC/DC adapters providing a 5V DC output. Additionally, a camera is strategically placed at the upper corner of the room to serve as a visual reference. Human targets have the potential to enter the monitored area either through the door or the unmonitored region on the left.
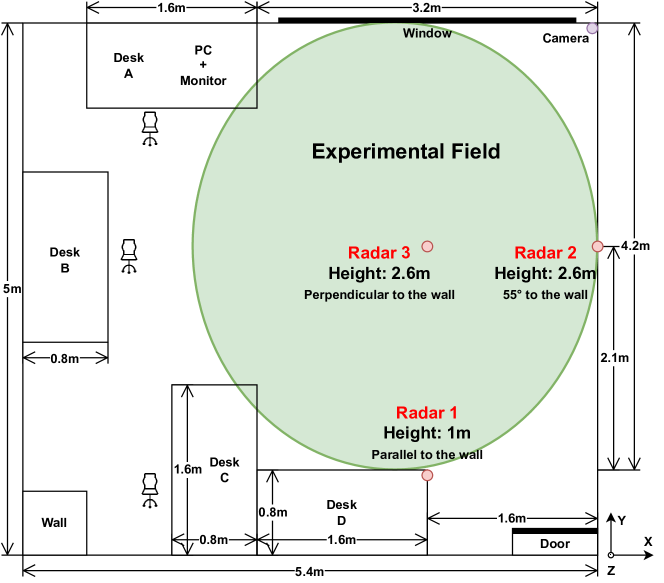
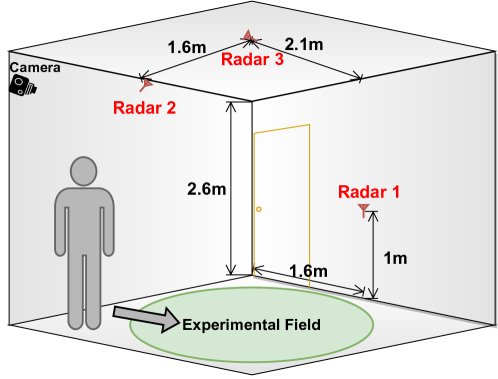
4.1 Coordinate System
To maintain consistency, all cloud point locations are denoted in the format . Consequently, a global coordinate system is established with its origin situated directly beneath Radar 1. In this system, the x-axis extends towards the wall on the right, the y-axis points towards the windows, and the z-axis is perpendicular to the ceiling. Accordingly, Radar 1 is positioned at coordinates without any rotation. Radar 2 is situated at with a 3D rotation of . The coordinates for Radar 3 are , accompanied by a 3D rotation of .
5 Software Framework
Our system has been developed using Python 3.8 and relies on essential libraries like NumPy, Sklearn, and Matplotlib. It operates on a Desktop PC featuring an Intel(R) Core(TM) i7-10850H CPU @ 2.70GHz and 16GB of RAM. The system effectively utilizes point cloud data from radars to implement precise tracking and fall detection. It is worth noting that, thanks to the use of a high-end CPU, the system’s performance bottleneck is primarily attributed to the radar speed, which can only operate at a max FPS of 20 due to the complexity of the 3D point cloud data.
We avoid computationally expensive algorithms, like neural networks, which would require additional Graphic Processing Units (GPU) and a much higher computation cost and power consumption. Therefore, it is possible to migrate the system onto low-power consumption platforms and embedded processors in the future.
Importantly, in our real-time system, we offer a configuration file feature. This file allows users to specify parameters, enabling seamless integration of data from additional radars, thereby expanding the system’s potential applications. Moreover, the configuration file is instrumental in post-processing tasks such as data merging, clustering, and human tracking. It ensures a customized and efficient approach to handling the collected data, making the system adaptable to diverse scenarios and requirements.
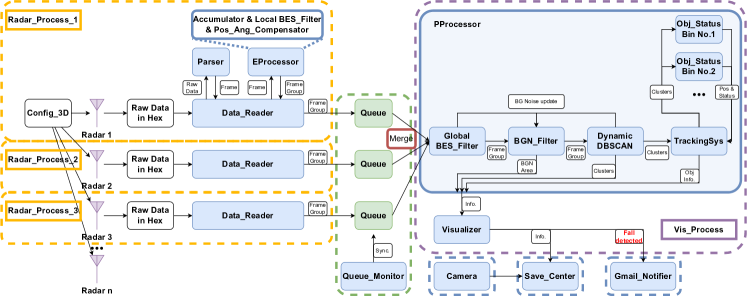
Operating within a multiprocessor environment, the system can leverage multiple CPU cores to concurrently execute multiple modules such as Radar_Process and Vis_Process depicted in Fig.11. This concurrent execution optimizes workload distribution, leading to efficient utilization of system resources. Fig.11 illustrates the system’s architecture, which comprises the following modules:
-
•
Data_Reader: Data Readers establish the connection between the PC and radars and parse the data packages sent by the radars into NumPy format before putting them into Queues.
-
•
EProcessor: The Early Processor stacks the data frame for post-processing and provides data rotation and position compensation based on the radar placement.
-
•
PProcessor: The Post Processor contains the boundary, energy strength, and speed filter (BES_Filter) for merged data. It also provides background recognition (BGN_Filter), DBSCAN clustering (Dynamic DBSCAN), and a tracking system (TrackingSys).
-
•
Visualizer: The Visualizer provides 2D and 3D demonstrations for the human tracking and status results given by PProcessor.
-
•
Queue_Monitor: The Queue Monitor monitors the frame traffic and provides synchronization between Queues. More details can be found in section 5.2.
-
•
Camera: The Camera provides video footage during the experiment as ground truth.
-
•
Save_Center: The Save Center collects all frames from both radar and camera and saves them when a human target is detected.
-
•
Gmail_Notifier: The Gmail Notifier provides an email-sending service when a human fall is detected.
5.1 Radar Raw Data Preprocessing
Prior to data collection using the mmWave radar, it is essential to prepare a configuration file adapted with the TI firmware. This involves enabling all three transmitters (TX) and four receivers (RX) with appropriate CFAR thresholds to ensure the reception of sufficient 3D data. As illustrated in Fig.11, after sending the config_3D file, the three radars collect point cloud data in 3D format, including energy strength and speed information, transmitted via packages through the USB ports.
Upon data reception, the initial step involves parsing the data into a two-dimensional format. The first dimension represents the number of points, while the second dimension includes (x-pos, y-pos, z-pos, energy strength, speed) information for each point. Due to the limited number of data points collected in each frame, we aggregate 10 frames to create a frame group for processing at that moment. A sliding window approach, spanning 10 frames (equivalent to 0.5 seconds), is employed to shift the frames forward, ensuring continuous processing.
To account for the utilization of multiple radars positioned at varying locations and angles, a compensation method for data point rotation and repositioning has been introduced. This method is based on equations derived from sources [24, 25, 26]. The three 3D rotation Equations (7, 8, 9, 10) are presented below:
| (7) |
| (8) |
| (9) |
| (10) |
In the equations provided, , , and represent rotation transformation matrices along the x, y, and z axes, respectively. and denote the point matrices before and after transformation. The rotation angles for the x, y, and z axes, denoted by , , and respectively, are determined by the radar facing angles. The reference point coordinates in 3D, represented as , , and , are set to , indicating the origin in our experiment. Using Equation (11), the data points obtained from radars can be transformed and mapped into a unified global coordinate system. It is important to mention that the order of applying , , and in Equation (11) dictates the order of rotation axes, leading to different outcomes based on the chosen sequence.
| (11) |
For the position compensation, the Equation (12) is applied to correct the radar position offset in the global coordinate system.
| (12) |
After applying point repositioning and rotation algorithms based on the radars’ positions and facing directions, the resulting frame groups are then placed into Queues, where they await further processing and analysis.
5.2 Multiple Radar Data Lines Synchronization
All raw data sent by TI mmWave radar comprising coordinates and speed information is correctly packaged into frames and follows the prescribed TI output packet structure. Occasionally, the hardware may send incomplete packets that cannot be parsed into usable data for the following process. Therefore, these bad packets, highlighted in red as depicted in Fig.12, will be discarded by the Data_Reader upon reception. In situations where multiple radar systems encounter errors, leading to the dropping of packages in one or two radars, the Queue for the radar without errors will begin to accumulate packages. This occurs because the PProcessor systematically extracts one packet from each Queue at a time to ensure sufficient data. Consequently, it will wait for the next good package from the radar line with errors, while the radar line without errors continues to send good packages, causing a disparity in the number of packages in this error-free Queue compared to the other Queues. While this accumulation is manageable for small numbers of packets, it becomes problematic when it extends over several hours or even longer, resulting in hundreds of accumulated packets and causing significant delays for that radar. To elaborate further, the use of a First-In-First-Out (FIFO) queue strategy means that when the PProcessor extracts the packets, the frame packet it receives from the radar with an accumulation issue is from seconds ago. This approach results in the emergence of a ghost shadow issue, significantly impacting the subsequent human detection process.
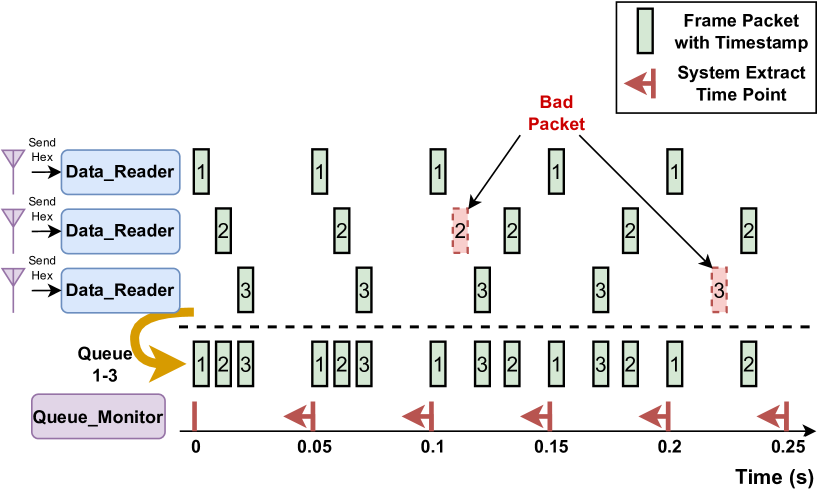
To address this issue, we have implemented a timestamp for all frame packages and introduced a Queue_Monitor module designed to oversee the packet accumulation within the Queues. We have established a criterion: frame packages received from three radars within a 0.05-second window (20 FPS) are considered synchronized, and we merge them before sending them to the PProcessor. Subsequent packages will be aggregated in the next 0.05-second time period, as depicted in Fig.12. In this configuration, there might be only 2 frame packages in specific 0.05-second intervals, which is deemed acceptable. This approach prevents package accumulation and effectively mitigates the ghost shadow problem.
Additionally, the implementation of the FIFO queue strategy enhances the system’s ability to process data in real-time. In situations where there is data congestion within the Queues, PProcessor ensures that it retrieves the earliest data according to the established timeline. This approach guarantees sequential processing, even in worst-case scenarios, thereby ensuring the system’s responsiveness.
5.3 Background Noise
After data retrieval from each radar by the PProcessor in Fig.11, both out-of-range data points and those with low energy strength are identified and stored by the Global BES_Filter module for background recognition. Additionally, noise points identified by Dynamic DBSCAN module are also collected for background recognition in the subsequent process. Utilizing the information provided by both the Global BES_Filter and Dynamic DBSCAN, the BGN_Filter module effectively discerns background noise and isolates areas where data points marked as noise persist for an extended duration. This is especially applicable to cases where static targets such as chairs and tables are present in the field. This feedback loop approach for noise reduction results in a clean frame comprising data points with reduced noise being generated and utilized for DBSCAN clustering.
5.4 Human Target Detection
In the process of identifying clusters representing human beings amidst the noise, we employ the Dynamic DBSCAN module for the Density-Based Spatial Clustering of Applications with Noise (DBSCAN) algorithm. DBSCAN stands out due to its ability to function without the need for specifying the number of clusters in advance, making it particularly suitable for situations where the exact number of human targets is unknown. This algorithm groups closely packed data points into dense regions, differentiating them from sparser areas. Such an approach effectively addresses scenarios where dynamic targets are encountered in our experiment.
However, we have observed that when a human target is stable, fewer data points with a high-energy level are collected due to the mmWave radar’s limited sensitivity to stationary targets, a finding supported by [9]. Because stationary targets cannot be effectively distinguished from background noise in the Range-Doppler Map (RDM) [27], consequently, they are treated as noise and removed in our analysis.
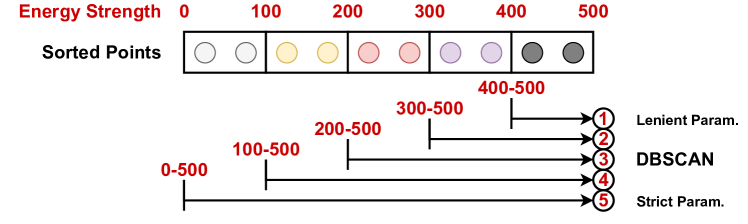
Although we cannot directly address the challenge of distinguishing stationary targets, an inherent characteristic of mmWave radar, we have enhanced accuracy with a novel Dynamic DBSCAN approach which is a multiple-level approach to cluster the data points. Rather than inputting all data points directly into the DBSCAN algorithm, we first categorize the points based on their energy strength. Subsequently, we apply more lenient DBSCAN parameters to points with higher energy strength and stricter parameters to the low-energy points, allowing for a successful clustering when a stationary target appears. As depicted in Fig.13, when clustering lower energy points with DBSCAN, higher energy points are also incorporated by concatenating them together.
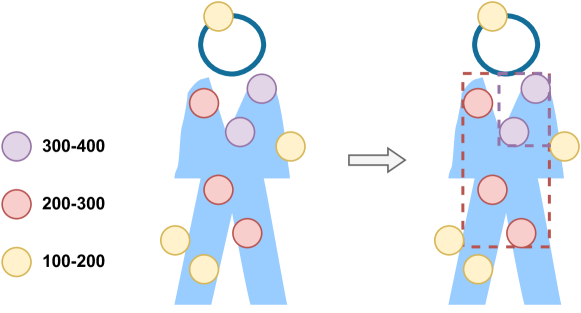
The primary advantage of this approach is the prevention of missing valuable data points with high energy levels, which are highly likely to represent human targets instead of noise. For instance, if we were to treat these points equally and apply a default parameter setting of and , where denotes point distance and is the minimum number of points used by DBSCAN to define a cluster, the cluster would not form due to an insufficient number of points. This scenario is illustrated in the left image of Fig.14 and corresponds to a situation where a stationary human target is present in the field, with the high-energy points representing the human chest, which should be identified as a cluster. To address this, we employ more lenient parameters: and for points with energy levels between 300 and 400, and and for points with energy levels between 200 and 300. These settings allow us to successfully form a cluster representing a stationary human target.
Employing Dynamic DBSCAN necessitates five times the computation for each frame clustering in the worst-case scenario, wherein data points in one frame span all predefined energy regions in Fig.13. However, such a scenario is infrequent. Typically, most data points fall within a single energy region when no human presence is detected, and only two to three regions are occupied when humans are present. Given this observation, we have made an optimization decision. If a specific energy region contains no data points, we choose to skip the corresponding DBSCAN process for that region. This strategy aims to conserve computational resources and enhance processing speed by avoiding unnecessary computations.
5.5 Human Target Tracking
To achieve real-time tracking of the position, status, and moving trajectory of detected human targets, we have provided the Obj_Status Bin modules, designed specifically to store this information. With multiple clusters generated by the Dynamic DBSCAN module, the issue lies in accurately assessing these clusters and assigning them to the corresponding Obj_Status Bin modules for continuous tracking.
To address this challenge, we have introduced the TrackingSys module, outlined in Fig.11. This module serves the crucial role of determining which clusters from the Dynamic DBSCAN module should be allocated to which Obj_Status Bin modules based on the probability matrix. Our strategy of a probability matrix is formed by evaluating the correlation between each potential cluster and the previous information stored in Obj_Status Bin modules, i.e., previous cluster position and shape. The elements of the probability matrix are determined using the following equation, comprising four components:
| (13) |
In this equation, represents the correlation factor between the position of the potential cluster and the previously stored positions in the Obj_Status Bin modules, while indicates the correlation for the cluster shape. Specifically, we use Z-Score to evaluate those relationships and identify outliers that should be disregarded. and denote the position and shape difference between the potential cluster and the predefined expected values. For example, we do not anticipate a cluster located at the ceiling to be identified as a human being. Additionally, we use proportion coefficients for our experiment to balance these four components and calculate a more accurate . These coefficients can be adjusted to adapt the system to various deployment environments, ensuring flexibility and accuracy in the tracking process.
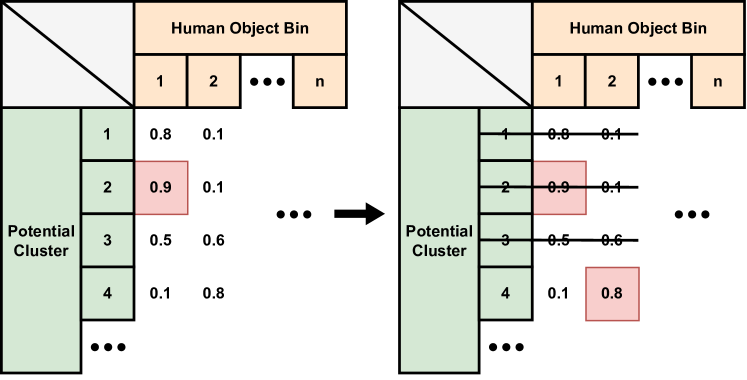
After applying Equation (13) to each current cluster for every Obj_Status Bin module, the TrackingSys module generates the probability matrix. Illustrated in Fig.15, the module utilizes the global maximum probability to update the cluster, highlighted in red, to the corresponding object bin. Subsequently, this cluster and its neighboring clusters are regarded as the same person and removed from consideration. The process is then repeated: the next maximum value from the remaining possibilities is selected and allocated, continuing until there are no non-zero values left in the probability matrix.
Ultimately, the Obj_Status Bin modules provide human tracking and status information to the Visualizer, facilitating the display of human target positions and shapes based on historical cluster data. This method ensures accurate and real-time tracking of human targets within the environment.
5.6 Fall Detection
To determine the current status (standing, sitting, or lying on the ground) of a human target, we have predefined estimated portraits of position and shape for these three statuses. For example, if the target is standing, the centre height of the cluster representing this target is estimated at around 1 meter. Additionally, the cluster shape is modeled as a rectangle cuboid with its long side aligned with the z-axis. When the target is sitting, the centre height is estimated to be around 0.6 meters. If the target is lying on the ground, the centre height is approximately 0.2 meters, close to the ground level. In this case, the cluster shape is a rectangle cuboid with its short side on the z-axis.
| (14) |
To calculate the status probability, We update Equation (13) to Equation (14). and represent the position and shape difference between the cluster and the predefined portraits. To balance these factors, we use proportion coefficients in our experiment. Following this calculation, the status probability for each cluster assigned to the Obj_Status Bin in Section 5.5 is computed. The cluster is then labeled with the status having the highest probability.
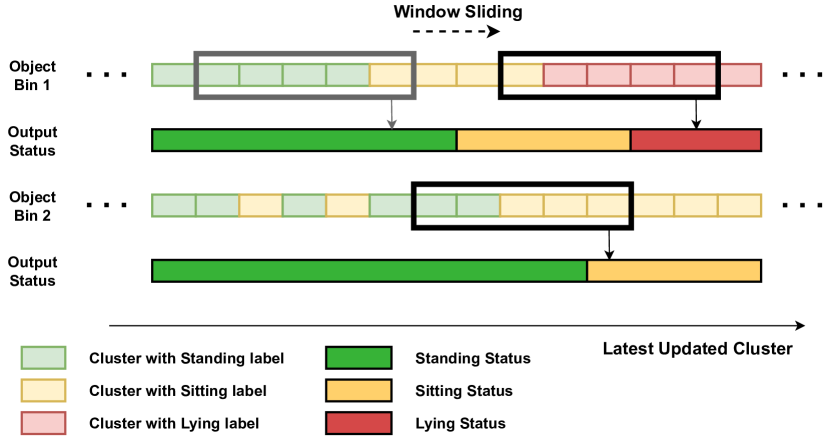
To enhance the stability of the determined target status, we employ a blur process. This process prevents the status from being updated to a new state if there are not enough clusters indicating the new status. As illustrated in Fig.16, we use a sliding window of a certain length (20 in our experiment) along the stored clusters in each Obj_Status Bin. The target status is determined based on which status has the largest number of clusters within the sliding window.
5.7 Adaptive Computing
Continuing to perform computations for human target detection when no one is present in the field results in unnecessary resource consumption and prolonged device heating. To address this, we have implemented a solution where we dynamically adjust the frames per second (FPS) rate. In ’Working Mode’, the FPS is set to 20 frames per second, but when TrackingSys does not detect any human targets for a period of time, the system switches to ’Standby Mode’ with a reduced FPS of 1. Additionally, to conserve resources, less critical modules like the Camera are temporarily turned off in ’Standby Mode’. When TrackingSys detects a human target, the system will automatically revert to ’Working Mode’ with a frame rate of 20 FPS.
6 System Evaluation
To assess our real-time system’s performance, we analyze valid frames with a total length of more than 300 minutes (360k frames). The distribution of scenarios includes 50% for the case with one person, 33.3% for the case with two people, and 16.7% for the case with three people. Meanwhile, we take a video recording as the ground truth by placing a camera at the top corner of the experimental field. We utilized the Yolo-v3 model [29] to obtain the ground truth, establishing a baseline for human detection evaluation.
6.1 Multiple Human Tracking Evaluation
We specified that a successful detection requires the centroids of the human target labeled by both our system and the camera detection to be within 0.25 meters of each other, with a minimum overlapping frame area of 70%, as outlined in [9]. The following metrics are employed for the evaluation of our human tracking system.
-
•
Positives (P): Humans are present in the experimental field.
-
•
True Positives (TP): Humans are present and all identified by the radar, with their positions verified by the camera.
-
•
False Positives (FP): Humans are absent and identified by the radar caused by noise or other objects, or positions are not verified by the camera.
-
•
Sensitivity (TP/P): The ability to identify humans with valid positions when they are present in the detection area.
-
•
Precision (TP/(TP+FP)): The ability to identify humans with valid positions from false detection caused by noise.
| Sensitivity | Precision | |
|---|---|---|
| For 1 target | 97.8% | 98.9% |
| For 2 targets | 98.2% | 96.5% |
| For 3 targets | 97.9% | 94.0% |
Leveraging three radars in the field and our techniques, we achieve approximately 98% sensitivity and 98.9% precision for scenarios with a single target in the field as shown in Table 1. This implies that our system can effectively track a human target when it appears and exhibits a strong ability to distinguish it from noise. For scenarios involving two and three people in the field, the sensitivity remains high, while precision experiences a slight drop of 2.8% and 5.3%, respectively. This decline is attributed to the increased presence of moving people in the field, leading to more noise and false detections at incorrect positions.
Fig.17 displays three examples featuring two and three mobile human targets in the given environment. In the images on the left column, the top views of the point cloud are presented. Three radars are denoted as dark red dots, while the dots with varying shades represent the point cloud with different energy levels. The DBSCAN clusters are depicted using red rectangles. The middle-column images show the trajectories of the multiple human targets’ movements in the field, labeled in green, purple, and sky blue, respectively. The corresponding ground truth, captured by the camera, is displayed in the images on the right column.
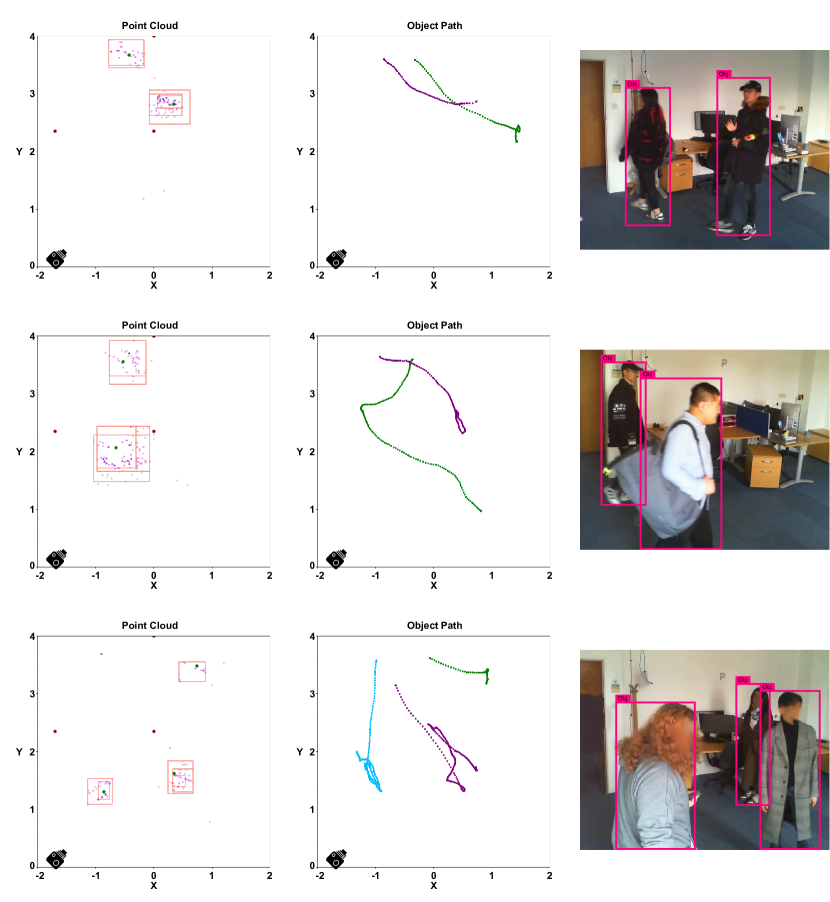
A limitation of our radar system is the challenge of distinguishing multiple people at short distances, particularly when individuals are standing close to each other. This limitation is less pronounced under typical daily conditions when individuals are usually separated. While [9] has achieved success at distances of 1 meter, we have improved the system’s distinguishability to 0.5 meters when targets are in motion and 0.3 meters when targets are stationary, utilizing both our radar setup and techniques.
6.2 Human Fall Detection Evaluation
We evaluate the human status using the data classified as True Positives (TP) in the last Section 6.1. Fig.18 illustrates the confusion matrix for the three statuses we classified: standing, sitting, and fall detection (lying or sitting on the ground). We achieve a high accuracy level of 98.2% for fall detection and 93.1% for standing. Although we observe a relatively lower accuracy of 89.2% when the target is sitting, it is noteworthy that most of the false cases are classified as standing rather than fall detection. This indicates that, while our system has approximately a 7% to 8% chance of misjudgment between standing and sitting statuses, it effectively distinguishes fall detection from the other two statuses.
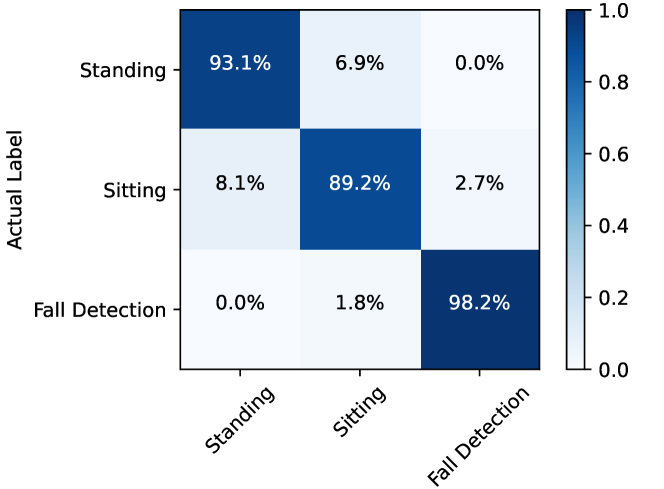
Fig.19 displays the 3D point cloud when a human target falls in the left column. The middle column shows the moving trajectories with the target status marked by green (standing), yellow (sitting), and red (fall detected) dots. The camera image serves as the ground truth. When human targets fall and lie on the ground, the point clouds are concentrated at a lower height, allowing them to be identified as a fall on the ground using the method introduced in Section 5.6.
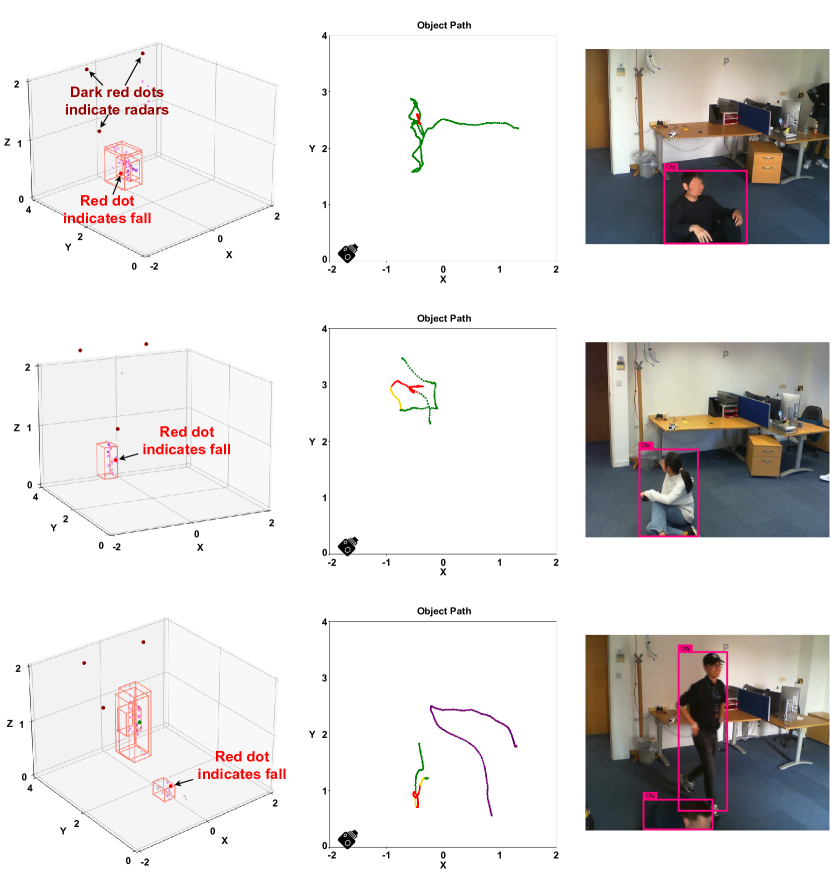
The presence of yellow dots in the trajectories of the second and third examples does not signify that the targets were sitting. Rather, these dots appear because the targets simulated falling to the ground during our experiments. The fall speed was intentionally slow, not corresponding to a real fall, which resulted in not skipping the sitting status. Sitting is considered a transitional state between standing and falling on the ground (lying). Therefore, the presence of yellow dots in the trajectories captured by our system is a normal outcome. In the third example, our system detects a fall when there are multiple people in the room. Because the second human target remained standing throughout the observation period, to distinguish this trajectory from the first target, we mark it as purple in the visualization.
6.3 Human Fall Posture Estimation
| Wearables [12] | Camera [4] | MmWave Radar [30] | MmWave Radar [15] | MmWave Radar [9] | MmWave Radar (Ours) | |
|---|---|---|---|---|---|---|
| Fall Detection | Acc. 93.0% | Acc. >96.0% | Acc. 97.6% | Acc. 98.7% | No | Acc. 98.2% |
| Human Tracking | No | Yes | No | No | Prec. 98.6%(<0.25m) | Prec. 98.9%(<0.25m) |
| Multiple People | No | No | No | No | Yes | Yes |
| Fall Detection Alert | Yes | Yes | No | No | No | Yes |
| Real-time Proc. | Yes | Yes | Yes | No | Yes | Yes |
| Privacy Concerns | Low | Severe | Low | Low | Low | Low |
| Deployment | Inconvenient | Easy | Easy | Easy | Easy & Extendable | Easy & Extendable |
Fall posture estimation is a crucial step following a successful fall detection, especially for elderly individuals. Knowing the posture during a fall can help healthcare providers assess the severity of the fall and provide appropriate medical intervention.
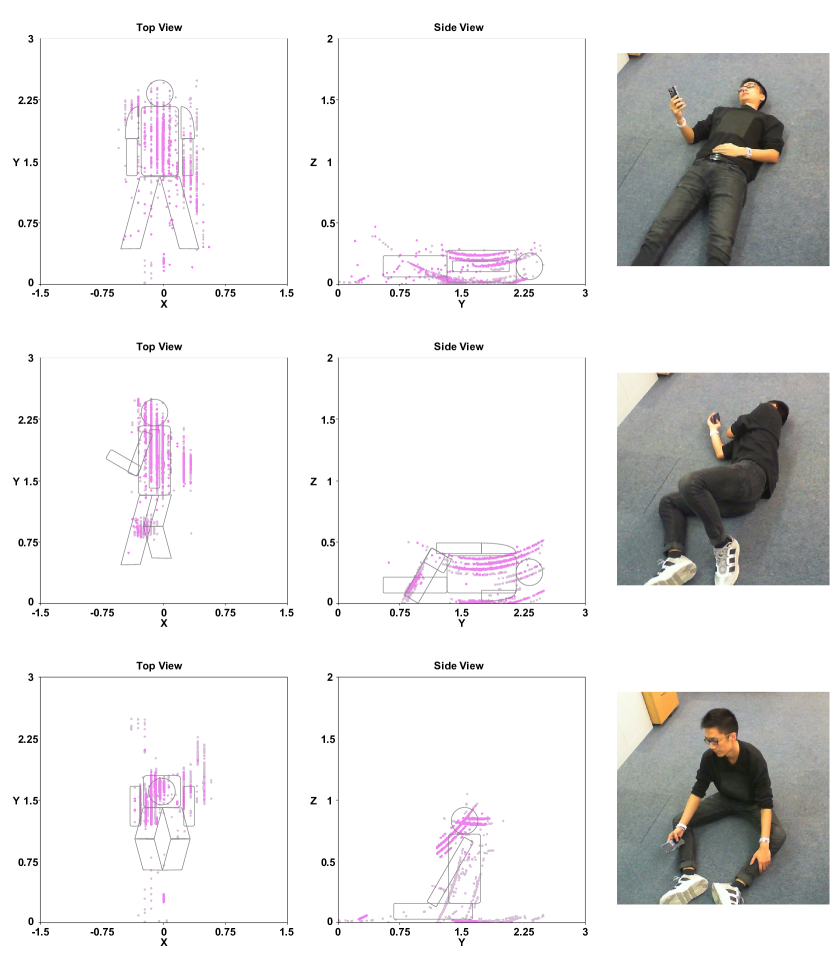
We assume that the person remains relatively stationary after falling. To determine the posture after a fall, we accumulate point clouds over a period of 30 seconds and analyze the resulting data points. As illustrated in Fig.20, point clouds from both the top view and side view, as well as camera images, are compared for three different fall scenarios: lying facing up, lying facing sideways, and sitting on the ground.
In the scenario where the person is lying facing up, the top view exhibits the largest reflection area and the lowest gathering of point clouds, occurring approximately 0.25 meters above the ground. In the second scenario, where the person is lying facing sideways, the top view shows a narrower area, and the gathering of points occurs at a higher position around 0.5 meters in the side view. Finally, in the scenario where the person is sitting on the ground, the top view displays the smallest area, and points gather around 1 meter above the ground, representing the human head.
Hence, it is viable to assess and categorize typical human fall postures by analyzing the point clouds collected by mmWave radars. Further exploration may involve the introduction of additional posture classes and real-time estimation as part of future work.
6.4 System Comparison
We present a comparative analysis of human tracking and fall detection approaches in Table 2. Although wearables [12] and camera-based [4] methods demonstrate high accuracy in fall detection, they encounter challenges related to inconveniences in deployment and severe privacy issues, respectively. In contrast, mmWave radar solutions do not experience these issues. Approaches from [30, 15] achieve over 97% accuracy in fall detection, but they lack support for human tracking and for scenarios involving multiple individuals. Particularly, the method proposed in [15] considers various real-life cases but falls short in real-time processing, a critical aspect for fall detection.
On the other hand, [9] demonstrates high-precision for indoor human tracking at 98.6% precision, with a criterion of less than 0.25 meters, and it supports tracking multiple individuals. However, it does not address fall detection. Inspired by the work in [9], our real-time system achieves high accuracy and precision in both human tracking and fall detection. Furthermore, we provide support for multiple individuals in both features and offer a fall detection alert service utilizing Gmail. Moreover, our system has the flexibility to integrate additional radars for complex indoor environments to cover blind spots if necessary.
7 Conclusion
In this paper, we have developed a real-time tracking and fall detection system designed for indoor multiple human targets by deploying three mmWave radars developed by TI in a multi-threaded environment. Our discussion has delved into how our experimental field setup maximizes the radars’ ability to recognize humans. Additionally, we have introduced novel strategies, including Dynamic DBSCAN clustering, a probability matrix for tracking updates, target status prediction, and a feedback loop for noise reduction for both the tracking system and fall detection. Our comprehensive evaluation showcases impressive results, achieving 98.9% precision for a single target, 96.5% and 94.0% for two and three targets in human tracking, respectively. For human fall detection, the accuracy reaches 98.2%, demonstrating the system’s capability to distinguish falls from other statuses. Moreover, we assess the practicality of fall posture estimation utilizing the 3D point clouds. This estimation holds the potential to offer remote medical intervention before on-site medical assistance arrives.
This research lays the groundwork for the development of advanced techniques in human tracking and fall detection using mmWave radar technology. The outcome is a non-intrusive, contactless system featuring real-time processing at 20 FPS on a general-purpose CPU, suitable for applications in industrial and home Internet of Things (IoT) settings. Furthermore, the utilization of lightweight techniques makes it feasible to transfer the system onto low-power consumption platforms. The success achieved in human detection and tracking opens avenues for future research in more complex Human Activity Recognition (HAR) tasks using mmWave radars.
Acknowledgment
Special Thanks to Mingxin, Lianghao, Kenny, Kris, Xinyi, and Qingyu, from the University of Bristol for the experimental data collection.
References
- [1] K. Sun, B. Xiao, D. Liu, and J. Wang, “Deep high-resolution representation learning for human pose estimation,” in Proceedings of the IEEE/CVF Conference on Computer Vision and Pattern Recognition, 2019, pp. 5693–5703.
- [2] A. Toshev and C. Szegedy, “Deeppose: Human pose estimation via deep neural networks,” in Proceedings of the IEEE conference on computer vision and pattern recognition, 2014, pp. 1653–1660.
- [3] N. T. Cam, N. Van Nhinh, and T. H. Trang, “Fall detection system based on pose estimation in videos,” in International Conference on Intelligent Computing & Optimization. Springer, 2023, pp. 162–172.
- [4] K. De Miguel, A. Brunete, M. Hernando, and E. Gambao, “Home camera-based fall detection system for the elderly,” Sensors, vol. 17, no. 12, p. 2864, 2017.
- [5] H. Cui and N. Dahnoun, “Human posture capturing with millimetre wave radars,” in 2020 9th Mediterranean Conference on Embedded Computing (MECO). IEEE, 2020, pp. 1–4.
- [6] A. Sengupta, F. Jin, R. Zhang, and S. Cao, “mm-pose: Real-time human skeletal posture estimation using mmwave radars and cnns,” IEEE Sensors Journal, vol. 20, no. 17, pp. 10 032–10 044, 2020.
- [7] H. Cui and N. Dahnoun, “Real-time short-range human posture estimation using mmwave radars and neural networks,” IEEE Sensors Journal, vol. 22, no. 1, pp. 535–543, 2021.
- [8] P. Zhao, C. X. Lu, J. Wang, C. Chen, W. Wang, N. Trigoni, and A. Markham, “Human tracking and identification through a millimeter wave radar,” Ad Hoc Networks, vol. 116, p. 102475, 2021.
- [9] H. Cui and N. Dahnoun, “High precision human detection and tracking using millimeter-wave radars,” IEEE Aerospace and Electronic Systems Magazine, vol. 36, no. 1, pp. 22–32, 2021.
- [10] J. Pegoraro and M. Rossi, “Real-time people tracking and identification from sparse mm-wave radar point-clouds,” IEEE Access, vol. 9, pp. 78 504–78 520, 2021.
- [11] T. Shany, S. J. Redmond, M. R. Narayanan, and N. H. Lovell, “Sensors-based wearable systems for monitoring of human movement and falls,” IEEE Sensors journal, vol. 12, no. 3, pp. 658–670, 2011.
- [12] V. S. Kumar, K. G. Acharya, B. Sandeep, T. Jayavignesh, and A. Chaturvedi, “Wearable sensor-based human fall detection wireless system,” in Wireless Communication Networks and Internet of Things: Select Proceedings of ICNETS2, Volume VI. Springer, 2019, pp. 217–234.
- [13] S. Gasparrini, E. Cippitelli, E. Gambi, S. Spinsante, J. Wåhslén, I. Orhan, and T. Lindh, “Proposal and experimental evaluation of fall detection solution based on wearable and depth data fusion,” in International conference on ICT innovations. Springer, 2015, pp. 99–108.
- [14] J. Wu, H. Cui, and N. Dahnoun, “A novel high performance human detection, tracking and alarm system based on millimeter-wave radar,” in 2021 10th Mediterranean Conference on Embedded Computing (MECO). IEEE, 2021, pp. 1–4.
- [15] Y. Yao, C. Liu, H. Zhang, B. Yan, P. Jian, P. Wang, L. Du, X. Chen, B. Han, and Z. Fang, “Fall detection system using millimeter-wave radar based on neural network and information fusion,” IEEE Internet of Things Journal, vol. 9, no. 21, pp. 21 038–21 050, 2022.
- [16] F. Jin, R. Zhang, A. Sengupta, S. Cao, S. Hariri, N. K. Agarwal, and S. K. Agarwal, “Multiple patients behavior detection in real-time using mmwave radar and deep cnns,” in 2019 IEEE Radar Conference (RadarConf). IEEE, 2019, pp. 1–6.
- [17] Texas Instruments, “The fundamentals of millimeter wave radar sensors,” https://www.ti.com/lit/wp/spyy005a/spyy005a.pdf, 2021, accessed May 2022.
- [18] ——, “Iwr1843 single-chip 76- to 81-ghz fmcw mmwave sensor,” https://www.ti.com/lit/ds/symlink/iwr1843.pdf, 2022, accessed October 2022.
- [19] ——, “xwr1843 evaluation module (xwr1843boost) single-chip mmwave sensing solution,” https://www.ti.com/lit/ug/spruim4b/spruim4b.pdf, 2020, accessed October 2022.
- [20] G. M. Brooker et al., “Understanding millimetre wave fmcw radars,” in 1st international Conference on Sensing Technology, vol. 1, 2005.
- [21] S. Gupta, P. K. Rai, A. Kumar, P. K. Yalavarthy, and L. R. Cenkeramaddi, “Target classification by mmwave fmcw radars using machine learning on range-angle images,” IEEE Sensors Journal, vol. 21, no. 18, pp. 19 993–20 001, 2021.
- [22] Texas Instruments, “Introduction to mmwave sensing: Fmcw radars,” https://adasauto.blogspot.com/2018/04/introduction-to-mmwave-sensing-fmcw.html, 2018, accessed June 2023.
- [23] Z. Shen, J. Nunez-Yanez, and N. Dahnoun, “Multiple human tracking and fall detection real-time system using millimeter-wave radar and data fusion,” in 2023 12th Mediterranean Conference on Embedded Computing (MECO). IEEE, 2023, pp. 1–6.
- [24] P. R. Evans, “Rotations and rotation matrices,” Acta Crystallographica Section D: Biological Crystallography, vol. 57, no. 10, pp. 1355–1359, 2001.
- [25] C.-K. Shene, “Geometric transformations,” https://pages.mtu.edu/~shene/COURSES/cs3621/NOTES/geometry/geo-tran.html, accessed May 2023.
- [26] B. Zhuo, “Transformation matrix of points in 3d coordinate system,” https://zhuanlan.zhihu.com/p/388164543, accessed May 2023.
- [27] Karthik Ramasubramanian, “mmwave radar for automotive and industrial applications,” https://www.ti.com/content/dam/videos/external-videos/2/3816841626001/5675916489001.mp4/subassets/Mmwave_webinar_Dec2017.pdf, 2017, accessed October 2023.
- [28] G. C. Platform, “Oauth api verification faqs,” https://support.google.com/cloud/answer/9110914?authuser=1#zippy=%2Cgmail-api, accessed June 2023.
- [29] J. Redmon and A. Farhadi, “Yolov3: An incremental improvement,” arXiv preprint arXiv:1804.02767, 2018.
- [30] C. Yu, Z. Xu, K. Yan, Y.-R. Chien, S.-H. Fang, and H.-C. Wu, “Noninvasive human activity recognition using millimeter-wave radar,” IEEE Systems Journal, vol. 16, no. 2, pp. 3036–3047, 2022.
[![[Uncaptioned image]](/html/2403.05634/assets/Authers/Shen.png) ]Zichao Shen received the M.Eng. degree in electrical and electronic engineering from the University of Bristol in 2020. He is currently pursuing the Ph.D. degree in electrical and electronic engineering at the University of Bristol, U.K. His research interests include computer vision, neural networks on edge devices, millimeter-wave radars, and human activity recognition (HAR).
{IEEEbiography}[
]Zichao Shen received the M.Eng. degree in electrical and electronic engineering from the University of Bristol in 2020. He is currently pursuing the Ph.D. degree in electrical and electronic engineering at the University of Bristol, U.K. His research interests include computer vision, neural networks on edge devices, millimeter-wave radars, and human activity recognition (HAR).
{IEEEbiography}[![[Uncaptioned image]](/html/2403.05634/assets/Authers/Wu.png) ]Jiacheng Wu received the B.Sc. degree in Marine Communication from the University of Xiamen, Xiamen, China in 2018. He received the M.S. degree in image & video communication and signal processing from the University of Bristol, Bristol, U. K. in 2019. He is currently working toward the Ph.D. at the University of Bristol, Bristol, U.K. His research interests include signal processing of the millimeter-wave radar.
{IEEEbiography}[
]Jiacheng Wu received the B.Sc. degree in Marine Communication from the University of Xiamen, Xiamen, China in 2018. He received the M.S. degree in image & video communication and signal processing from the University of Bristol, Bristol, U. K. in 2019. He is currently working toward the Ph.D. at the University of Bristol, Bristol, U.K. His research interests include signal processing of the millimeter-wave radar.
{IEEEbiography}[![[Uncaptioned image]](/html/2403.05634/assets/Authers/Nunez.png) ]Jose Nunez-Yanez received PhD in hardware-based parallel data compression from the University of Loughborough, UK, with three patents awarded on the topic of high-speed parallel data compression. Previous to his arrival in Linköping I was a reader (associate professor) at Bristol University, UK. He spent a few years working in industry working at ST Micro (Milan), ARM (Cambridge), and Sensata Systems (Swindon) doing Marie Curie and Royal Society fellowships. His main area of expertise is in the design of hardware architectures and embedded systems for signal processing with a focus on run-time adaptation, parallelism, and energy efficiency using heterogeneous systems with FPGAs and CPUs. His teaching has focused on digital systems, real-time and embedded systems, and advanced FPGA implementations.
{IEEEbiography}[
]Jose Nunez-Yanez received PhD in hardware-based parallel data compression from the University of Loughborough, UK, with three patents awarded on the topic of high-speed parallel data compression. Previous to his arrival in Linköping I was a reader (associate professor) at Bristol University, UK. He spent a few years working in industry working at ST Micro (Milan), ARM (Cambridge), and Sensata Systems (Swindon) doing Marie Curie and Royal Society fellowships. His main area of expertise is in the design of hardware architectures and embedded systems for signal processing with a focus on run-time adaptation, parallelism, and energy efficiency using heterogeneous systems with FPGAs and CPUs. His teaching has focused on digital systems, real-time and embedded systems, and advanced FPGA implementations.
{IEEEbiography}[![[Uncaptioned image]](/html/2403.05634/assets/Authers/Dahno.png) ]Naim Dahnoun received the Ph.D. degree in biomedical engineering from the University of Leicester, U.K., in 1990. He worked with Leicester University as a Lecturer and then as a Research Associate with UMIST University, U.K. Subsequently, he joined the University of Bristol, U.K., in 1994. He is a Senior Fellow of the Higher Education Academy (SFHEA) and the Director of the Computer Science and Electronics Programme, School of Computer Science, Electrical and Electronic Engineering and Engineering Mathematics. His main research interests include real-time digital signal processing applied to biomedical engineering, video surveillance, automotive, photonics, and autonomous health monitoring using radar sensors.
]Naim Dahnoun received the Ph.D. degree in biomedical engineering from the University of Leicester, U.K., in 1990. He worked with Leicester University as a Lecturer and then as a Research Associate with UMIST University, U.K. Subsequently, he joined the University of Bristol, U.K., in 1994. He is a Senior Fellow of the Higher Education Academy (SFHEA) and the Director of the Computer Science and Electronics Programme, School of Computer Science, Electrical and Electronic Engineering and Engineering Mathematics. His main research interests include real-time digital signal processing applied to biomedical engineering, video surveillance, automotive, photonics, and autonomous health monitoring using radar sensors.