Infrared Emission of Specific Polycyclic Aromatic Hydrocarbon Molecules: Indene
Abstract
Polycyclic aromatic hydrocarbon (PAH) molecules have long been suggested to be present in the interstellar medium (ISM). Nevertheless, despite their expected ubiquity and sustained searching efforts, identifying specific interstellar PAH molecules from their infrared (IR) spectroscopy has so far been unsuccessful. However, due to its unprecedented sensitivity, the advent of the James Webb Space Telescope (JWST) may change this. Meanwhile, recent years have witnessed breakthroughs in detecting specific PAH molecules (e.g., indene, cyanoindene, and cyanonaphthalene) through their rotational lines in the radio frequencies. As JWST holds great promise for identifying specific PAH molecules in the ISM based on their vibrational spectra in the IR, in this work we model the vibrational excitation of indene, a molecule composed of a six-membered benzene ring fused with a five-membered cyclopentene ring, and calculate its IR emission spectra for a number of representative astrophysical regions. This will facilitate JWST to search for and identify indene in space through its vibrational bands and to quantitatively determine or place an upper limit on its abundance.
keywords:
ISM: dust, extinction — ISM: lines and bands — ISM: molecules — Astrochemistry1 Introduction
Polycyclic aromatic hydrocarbon (PAH) molecules are composed of multiple hexagonal benzene rings. These aromatic rings join together in flat sheets whose edges are decorated with hydrogen atoms. On Earth, PAHs are a common by-product of the incomplete combustion of organic matter, and are often seen in auto exhaust and grilled meat. PAHs are believed to be also widespread and abundant in extraterrestrial environments (see Li 2020). The “unidentified infrared” emission (UIE) bands at 3.3, 6.2, 7.7, 8.6, 11.3 and 12.7,111There is strong consensus within the astronomical community to name these “UIE” bands the “aromatic infrared bands” (AIBs). Even though specific molecules have not been assigned, the dominant aromatic nature of these bands is beyond doubt (e.g., see Peeters et al. 2004, Yang & Li 2023). ubiquitously seen in a wide variety of astrophysical regions, have long been attributed to the C–H and C–C stretching and bending vibrational modes of PAHs (Léger & Puget 1984, Allamandola et al. 1985, Candian et al. 2018, Li 2020).
Despite the remarkable success of the assignment of the UIE bands to a cosmic mixture of PAHs of different sizes and charging states (e.g., see Allamandola et al. 1999, Li & Draine 2001), a long-standing criticism had remained ever since the PAH model was first proposed in the 1980s, that is, not a single specific PAH molecule had been identified in the interstellar space (e.g., see Kwok & Zhang 2011). However, this story has just changed in recent years.
Utilizing the 100 m Green Bank Telescope (GBT), McGuire et al. (2021) carried out radio observations of the Taurus Molecular Cloud (TMC) in the frequency range of 8 to 34. The rotational transitions of two specific PAH species—1-cyanonaphthalene (1-CNN) and 2-cyanonaphthalene (2-CNN), two isomers of cyanonaphthalene (C10H7CN) in which a cyano (–CN) group replaces one of the hydrogen atoms of naphthalene (C10H8)—were detected in the dark molecular cloud TMC-1. Similarly, also based on radio observations with GBT in the frequency range of 2–12 and 18–34, Burkhardt et al. (2021) detected the rotational transitions of indene (C9H8), also in the TMC-1 cloud. Cernicharo et al. (2021) also detected the rotational lines of indene in TMC-1 in the frequency range of 31–50, using the Yebes 40 m radio telescope. While 1- and 2-CNN are the first specific PAH species ever identified in the interstellar medium (ISM), indene, composed of both a five- and six-membered ring, is the first pure PAH molecule ever detected in space. Cyanonaphthalenes are not pure PAH species, instead, they are derivatives of naphthalene, substituting a CN group for a hydrogen atom. More recently, Sita et al. (2022) reported the detection of 2-cyanoindene (1H-indene-2-carbonitrile; 2-C9H7CN), an isomer of cyanoindene (which is a nitrile derivative of indene), also in the TMC-1 cloud. This detection, also made with the GBT at centimeter wavelengths, provides the first direct measure of the ratio of a cyano-substituted PAH molecule to its pure hydrocarbon counterpart in the same source.
The detection of indene, 2-cyanoindene, 1- and 2-CNN as well as benzonitrile (C6H5CN; McGuire et al. 2018), a single benzene ring with an attached CN group, through radio observations of their rotational spectra relies on the fact that these molecules have a reasonably large electric dipole moment. Although benzene (the parent molecule of benzonitrile) and naphthalene (C10H8; the parent molecule of 1- and 2-CNN) lack a permanent dipole moment and therefore have no pure rotational spectra, the presence of a cyano group dramatically increases the dipole moment of their CN-substituted derivatives. On the other hand, with an asymmetrical structure, indene is a polar molecule and has a permanent dipole moment and this enables its detection through rotational spectroscopy.
However, neither cyanonaphthalenes nor indene have been detected through their IR vibrational signals. As a matter of fact, IR identification of specific PAH molecules has not yet been successful even for just a single species. Although the UIE bands are widely used as evidence for the existence of PAHs in space, they are mostly indicative of the general class of molecules. Therefore, identifying which specific molecular species are present through the UIE bands is difficult. Nevertheless, as demonstrated in the NASA/Ames PAH Database (see Boersma et al. 2014, Bauschlicher et al. 2018, Mattioda et al. 2020), a treasure library of a large variety of specific neutral and cationic molecules (and relatively fewer anions) of different sizes and structures, individual PAH molecules do exhibit certain characteristic IR features. The nondetection of individual PAH molecules in the IR could be partly attributed to the lack of knowledge of their exact IR spectra, particularly in the far-IR.222Although rather arbitrary, we divide the IR wavelength range into the near-IR ( 1–5), mid-IR ( 5–15), and far-IR 15). Compared to the near- and mid-IR vibrational bands which are more representative of functional groups, the far-IR bands are sensitive to the skeletal characteristics of a molecule, hence they contain specific fingerprint information about the molecular identity of a PAH molecule. However, without a prior knowledge of which specific molecules are present in space, searching for the IR signals of an individual PAH molecule is like finding a needle in a haystack, since interstellar PAHs are unlikely a single species, but a cosmic mixture of a large number of species of different sizes and charge states (e.g., see Allamandola et al. 1999, Li & Draine 2001). The definite detection of individual, specific PAH molecules such as cyanonaphthalenes and indene made through their rotational transitions (McGuire et al. 2021, Burkhardt et al. 2021), therefore, offers us a valuable, effective guidance to search for their IR signals in the ISM.
For an individual PAH molecule, even if it is indeed present in space, its abundance is not expected to be high. Note that interstellar PAHs as a family lock up 40–60 parts per million (ppm) of the interstellar carbon (relative to hydrogen; see Li & Draine 2001). If an individual molecule accounts for 1% of the PAH abundance, its IR emission is expected to be weaker than the UIE bands by a factor of 100. While it may be challenging for the Infrared Space Observatory (ISO) and even the Spitzer Space Telescope to detect such weak signals, with the advent of the James Webb Space Telescope (JWST), this may become possible due to its unprecedented sensitivity.333Indeed, benzene has recently been identified by JWST in a protoplanetary disk around a low-mass star, based on the detection of three emission features around 14.85 which are attributed to the Q branches of the fundamental and hot bending mode of benzene (Tabone et al. 2023). The 14.85 bending band has previously been seen in absorption by the Infrared Space Observatory (ISO) in CRL 618, a protoplanetary nebula (Cernicharo et al. 2001). To facilitate JWST to search for the IR signals of specific PAH molecules in space, we perform a systematic exploration of the theoretical IR emission spectra of various specific PAH species expected in different astrophysical environments.
In this work we model the vibrational excitation of indene in a number of representative environments and calculate its IR emission spectrum. In a separate paper we will present the model IR emission spectra of cyanonaphthalenes (Li et al. 2024). Because of the energy balance, the amount of power emitted in the IR should equal to that absorbed in the ultraviolet (UV). Therefore, we first synthesize in §2 the UV absorption cross sections of indene from the experimental data available in the literature. The UV absorption cross sections determine how indene absorbs starlight in the ISM. In §2 we present the IR absorption cross sections of indene which determine how it emits in the IR. The vibrational excitation and de-excitation processes of indene are discussed in §3. The model IR emission spectra of indene are presented in §4 and discussed in §5. The major results are summarized in §6.
2 UV and IR Absorption Cross Sections
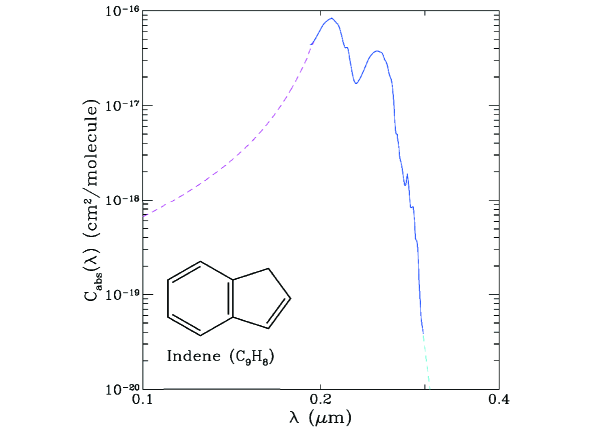
The UV absorption has been measured for indene over the wavelength range of (Perkampus 1992). For the absorption at and , we lack laboratory data and therefore have to extrapolate from the experimental data of Perkampus (1992) at . Figure 1 shows the resulting UV absorption cross sections of indene. It is apparent that indene absorbs very little at . This is not unexpected as the absorption edge occurs at shorter wavelengths for smaller PAHs (see Appendex A2 of Li & Draine 2001). Admittedly, the extrapolation of the absorption at is somewhat simplified. If additional absorption bands are present at , the UV absorption of indene would be higher than that represented by the dashed magenta line in Figure 1. However, we will show in §5, with an enhanced UV absorption, the IR emission spectrum of indene remains essentially the same, except the overall emission intensity is higher.
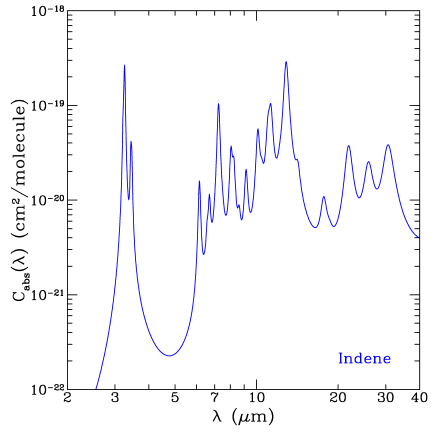
In the IR, the vibrational frequencies and intensities of indene have been computed by the NASA/Ames Astrochemistry Group, using the B3LYP density functional theory (DFT) in conjunction with the 4-31G basis set. We take the computed vibrational frequencies and intensities of indene from the NASA Ames PAH IR Spectroscopic Database (Boersma et al. 2014, Bauschlicher et al. 2018, Mattioda et al. 2020). We represent each vibrational transition by a Drude function, characterized by the peak wavelength and intensity of the vibrational transition. For each transition, we assign a width of 30, consistent with the natural line width expected from a vibrationally excited PAH molecule (see Allamandola et al. 1999). Figure 2 shows the resulting IR absorption sections of indene. We note that Klots (1995) had measured the vibrational spectra of indene vapor using the Fourier Transform IR Spectroscopy and Raman spectroscopy. On the other hand, Zilberg et al. (1996) had performed ab initio calculations. The major absorption bands seen in Figure 2 can also be found in the experimental spectra of Klots (1995) and the computational spectra of Zilberg et al. (1996). However, neither Klots (1995) nor Zilberg et al. (1996) reported the band intensities; also, the vibrational frequencies were not reported for all the modes. In modeling the IR emission of indene, a knowledge of the frequencies of all vibrational modes and the intensities of the major bands is required.
3 Vibrational Excitation of Indene
Indene has 17 atoms and 45 vibrational degrees of freedom. With such a small number of atoms, its energy content (which is proportional to the number of atoms) is often smaller than the energy of a single stellar photon. Therefore, upon absorption of an UV stellar photon, indene will undergo stochastic heating. Following the absorption of an energetic photon, a PAH molecule has three major competing decay channels to relax its energy: radiation,444The emission process is dominated by fluorescence (transitions between vibrational states of same multiplicity) in the IR and part in the visible. Phosphorescence (transitions between vibrational states of different multiplicity) is less important (see Li 2004). In this work we will thus only consider IR emission via fluorescence. photoionization, and photodissociation (see Li 2004). In this work, we assume that the absorbed starlight photon energy is exclusively lost through radiative relaxation (i.e., ignoring ionization and dissociation). Such an assumption is a common practice in modeling the IR emission of PAHs (e.g., see Draine & Li 2001, Draine et al. 2021). At conditions with intense and hard UV photons, indene may be ionized. However, there are no experimental or computational data on the photoionization and electron-recombination of indene. This prevents a quantitative determination of the ionization fraction of indene in the ISM. Also, there lack data on the UV absorption of ionized indene.555Chalyavi et al. (2013) had measured the gas-phase electronic absorption spectrum of indene cation in the visible and near-UV regions at 3000–6000, using resonance-enhanced photodissociation spectroscopy of He- and Ar-tagged ions. More recently, Chu et al. (2023) obtained the electronic spectrum of untagged indene cation in the 5500–-5800 wavelength range, using sensitive cavity ring-down spectroscopy in a supersonically expanding planar plasma. However, neither Chalyavi et al. (2013) nor Chu et al. (2023) could measure the absorptivities which are required to determine how much power an indene cation would absorb when exposed to starlight heating. Also, as the interstellar radiation field is often far stronger at than at , the measured absorption spectra of Chalyavi et al. (2013) and Chu et al. (2023) do not have the wavelength coverage to properly determine the heating of cationic indene. This makes it difficult to model its vibrational excitation and calculate its IR emission spectrum. Since so far only the neutral forms of specific PAH molecules have been detected in the ISM, in this work we therefore limit ourselves to neutral indene.
To model the vibrational excitation and radiative relaxation of indene, we take the “exact-statistical” method developed by Draine & Li (2001). We characterize the state of indene by its vibrational energy , and group its energy levels into “bins”, where the -th bin ( = 0, …, ) is , with representative energy +/2, and width –. Let be the probability of finding indene in bin with energy . The probability vector evolves according to
| (1) |
where the transition matrix element is the probability per unit time for indene in bin to make a transition to one of the levels in bin . We solve the steady state equations
| (2) |
to obtain the +1 elements of , and then calculate the resulting IR emission spectrum (see eq. 55 of Draine & Li 2001).
In calculating the state-to-state transition rates for transitions , we distinguish the excitation rates (from to , ) from the deexcitation rates (from to , ). For a given starlight energy density , the rates for upward transitions (i.e., the excitation rates) are just the photon absorption rates:
| (3) |
The rates for downward transitions (i.e., the deexcitation rates) can be determined from the detailed balance analysis of the Einstein coefficient:
| (4) |
where is the Planck constant, and the degeneracies and are the numbers of energy states in bins and , respectively:
| (5) |
where is the vibrational density of states of indene at internal energy .
For indene, the frequencies and the oscillator strengths of all its 45 vibrational modes have already been computed from DFT/B3LYP in conjunction with the 4-31G basis set (see Bauschlicher et al. 2018) and made available in the NASA/Ames PAH Database. We adopt the Beyer-Swinehart numerical algorithm (Beyer & Swinehart 1973, Stein & Rabinovitch 1973) to calculate from these vibrational frequencies the vibrational density of states and therefore the degeneracies for each vibrational energy bin. As mentioned in §2, we obtain the IR absorption cross section by summing up all the vibrational transitions with each approximated as a Drude profile.
For a given astrophysical environment characterized by its starlight energy density , we first calculate the excitation rates (from to , ) according to eq. 3, using the UV absorption cross setions described in §2. We then calculate the deexcitation rates (from to , ) according to eq. 4, using the degeneracy and the IR absorption cross section derived from the DFT-computed vibrational frequencies and intensities. With the state-to-state transition rates determined, we solve the steady-state probability evolution equation (see eq. 2) to obtain the steady-state energy probability distribution and finally calculate the resulting IR emission spectrum, according to eq. 55 of Draine & Li (2001). For computational convenience, we consider 500 energy bins (i.e., ).
4 Model Emission Spectra
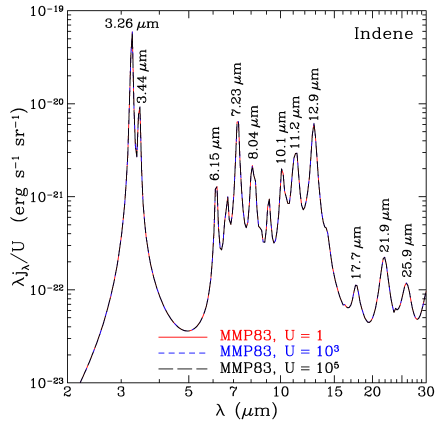
We first consider indene in the diffuse ISM excited by the solar neighborhood interstellar radiation field of Mathis et al. (1983; hereafter MMP83). As shown in Figure 3, the IR emission spectrum of indene exhibits a prominent C–H stretching band at 3.26 attributed to the six-membered benzene ring, as well as a satellite band at 3.44 arising from the C–H stretches of the five-membered ring. Also prominent are two broad complexes at 6–9 and 10–14 which are respectively composed of a number of C–C stretching bands at 6.15, 7.23, 8.04 and 9.15 and C–H out-of-plane bending bands at 10.1, 11.2, and 12.9. In addition, indene also emits three weak bands at 17.7, 21.9, and 25.9 attributed to its skeleton vibrations.
To examine how the IR emission of indene varies with the starlight intensity, we calculate the vibrational emission spectra of indene excited by starlight intenser than the MMP83 radiation field. For illustration, we show in Figure 3 the IR emission spectra of indene exposed to MMP83-type radiation fields, but enhanced by a factor of = 1000 and 105 ( = l,1 corresponds to the MMP83 radiation field). As demonstrated in Figure 3, when scaled by , the IR emission spectra are identical for different starlight intensities . This is not unexpected: in the stochastic heating regime, the IR emission spectral shape does not vary with the starlight intensity (see Figure 13 of Li & Draine 2001, Figure 13 of Draine & Li 2007, and Figure 10 of Draine et al. 2021).
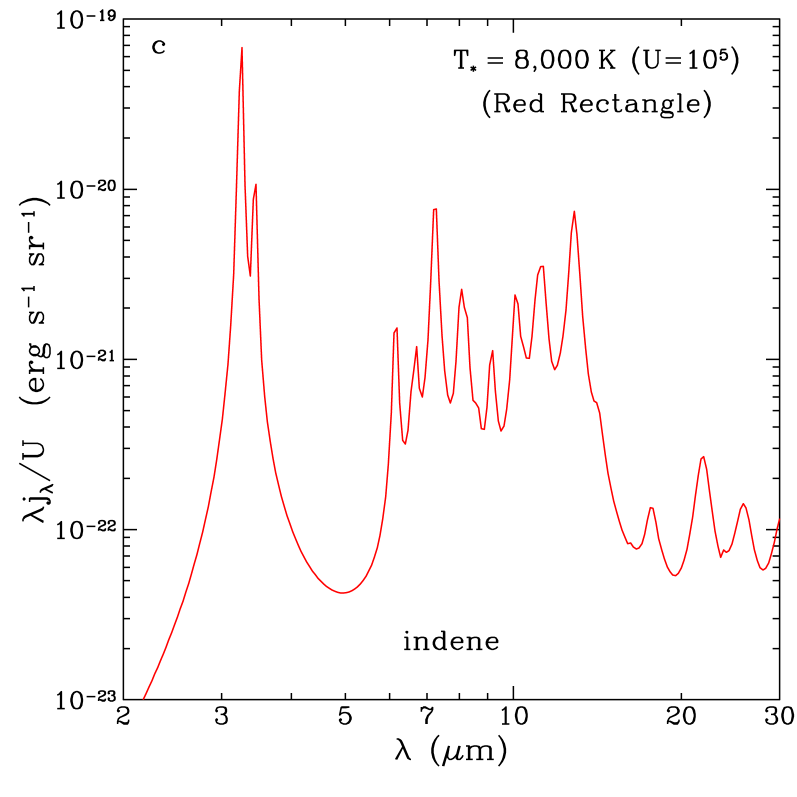
We also examine how the IR emission of indene varies with the starlight spectrum. The spectral shape of the exciting starlight characterizes the “hardness” of the radiation field. We consider indene exposed to stars with different effective temperatures: = 40,000, 22,000, 8,000. The starlight spectra are approximated by the Kurucz model atmospheric spectra.
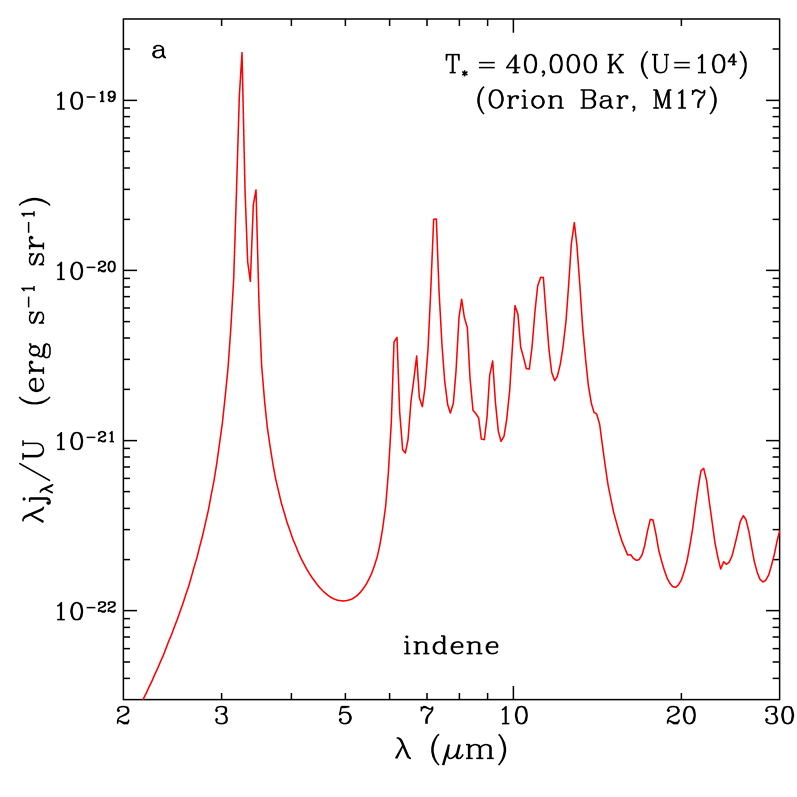
Figure 4a shows the IR emission of indene illuminated by stars of = 40,000 (like O6V stars) with an intensity of = 104, with defined as
| (6) |
where is the MMP83 radiation intensity, and is the intensity of starlight approximated by the Kurucz model atmospheric spectrum. Such a starlight spectrum and intensity resemble that of the Orion Bar photodissociation region and the M17 star-forming region. A comparison of Figure 4a with Figure 3 reveals that the IR emission spectra are almost identical for indene excited by the MMP83 field and by stars of = 40,000, except the emissivity level is higher for the latter since the mean absorbed photon energy is higher for the latter.
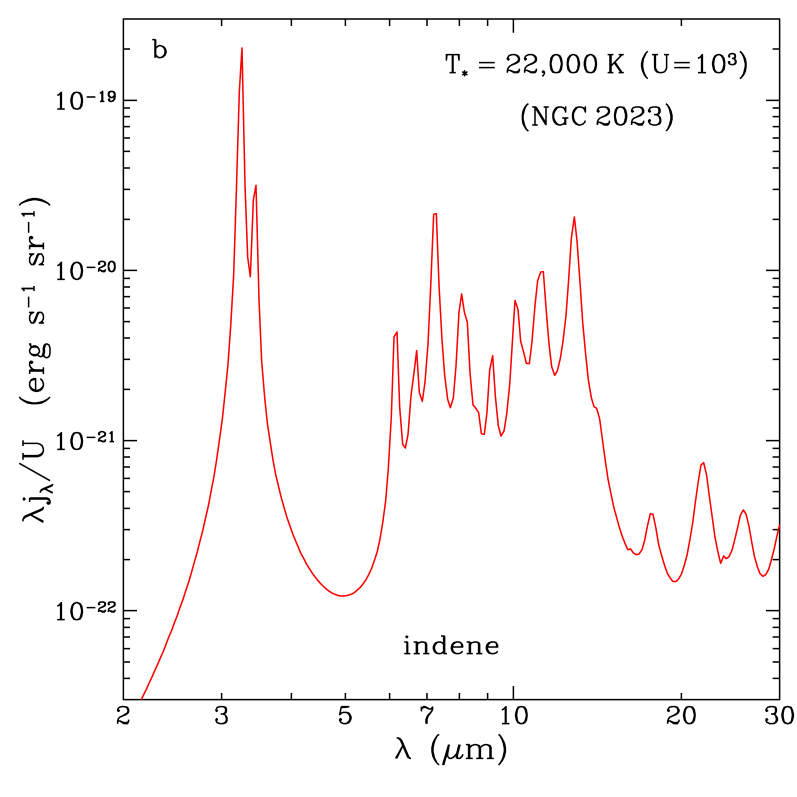
Figure 4b and Figure 4c respectively show the IR emission of indene illuminated by stars of = 22,000 (like B1.5V stars) with an intensity of = 103 and of = 8,000 (like A5V stars) with an intensity of = 105. While the former applies to the reflection nebula NGC 2023, the latter is like the Red Rectangle protoplanetary nebula. When scaled by , the IR emission spectra for both = 22,000 and = 8,000 are essentially identical to that for = 40,000.
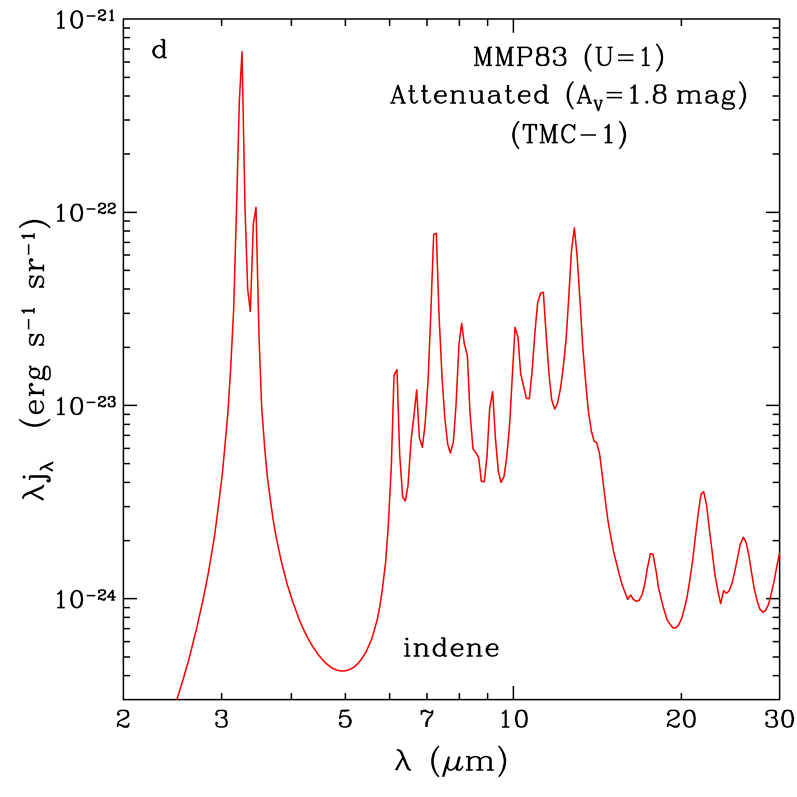
As indene has been detected in the TMC-1 molecular cloud through its rotational lines, we calculate the IR emission expected for indene in TMC-1, which is externally illuminated by the general interstellar radiation field but attenuated by dust extinction with a visual extinction of 3.6 (Whittet et al. 2004). We approximate the starlight by the MMP83 interstellar radiation field attenuated by , where = 1.8 is the visual extinction, is the extinction at wavelength , and , the wavelength-dependence of extinction, is taken to be that of the Galactic average extinction curve of , where is the total-to-selective extinction ratio (see Cardelli et al. 1989). Figure 4d shows the IR emission of indene calculated for the TMC-1 cloud. Compared to that excited by the MMP83 radiation field (see Figure 3) and stars of = 40,000, 22,000, 8,000, the overall IR emission spectrum of indene expected in the TMC-1 cloud is closely similar.
5 Discussion
We have shown in §4 that the spectral shape of the IR emission of indene does not vary with the spectral shape of the illuminating starlight radiation field (see Figures 3, 4a–d). This is because indene only has 45 vibrational degrees of freedom and its heat capacity is so small that even photons of a couple of electron volts can excite indene sufficiently to emit in its vibrational modes. In the TMC-1 molecular cloud, the mean energy of photons absorbed by indene is , considerably lower than that in the diffuse ISM () and in regions illuminated by stars with = 40,000 (), 22,000 (), and 8,000 (). This demonstrates that the hardness of the starlight does not affect the IR emission spectral shape of indene.
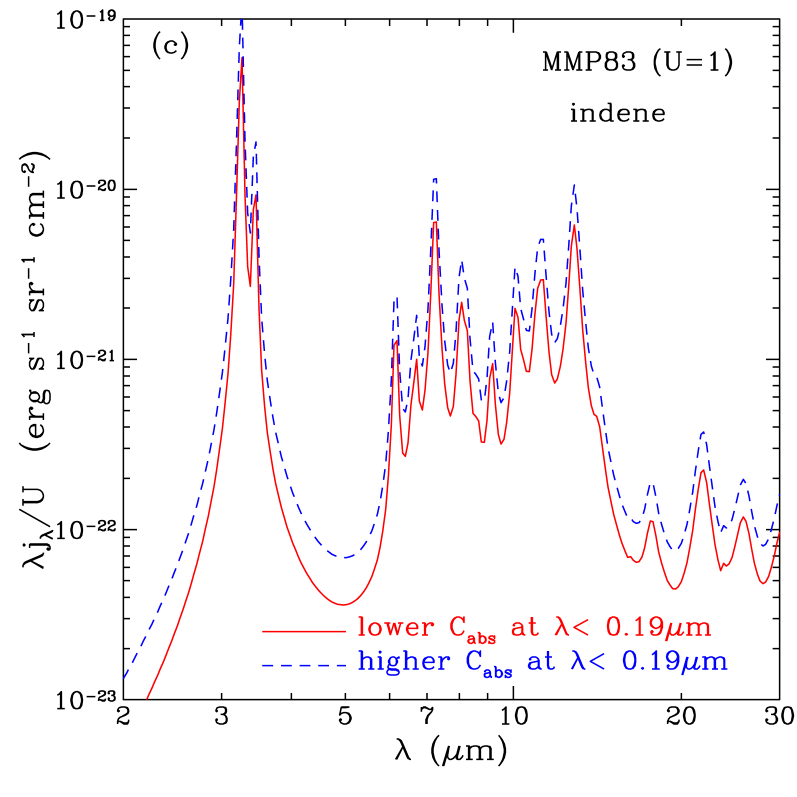
We note that the model emission spectra presented in §4 were obtained by approximating the UV absorption of indene at as a simple extrapolation from that at (see Figure 1). If indene has additional absorption bands at , such an extrapolation would underestimate the UV absorption of indene, and by implication, underestimate the power emitted by indene in the IR. To quantitatively examine this, as shown in Figure 5a, we arbitrarily elevate its absorption cross section at to a level substantially exceeding the extrapolated one. We also show in Figure 5b the starlight radiation fields for the diffuse ISM (MMP83), the Orion Bar or M17 (), NGC 2023 (), and the Red Rectangle (). Figures 5a and 5b clearly show that, in the wavelength range where the starlight radiation fields (except that of ) are strong, the adopted UV absorption at would substantially affect the heating of indene. However, as shown in Figure 5c, the model IR emission spectrum calculated with such an elevated UV absorption for the diffuse ISM is essentially the same as that with a lower, extrapolated UV absorption, except that the overall emissivity is higher by 70%. Note that, with such an elevated UV absorption at , the mean energy of photons absorbed by indene in the diffuse ISM is now , exceeding that with a lower UV absorption () by 20%. This implies that the IR emission cannot be simply scaled by . This also implies that, in modeling the IR emssion of small PAH molecules, the assumption of a single photon energy for their vibrational energy contents is somewhat simplified. To properly predict their IR emission, we should consider the absorption over the entire starlight spectrum.

The fact that the IR emission spectral shape of indene remains essentially invariant both with the intensity and with the hardness of the starlight radiation field makes the identification of indene through its vibrational emission spectrum simpler. However, the broad emission complex at 6–14 occurs at the same wavelength range of the 6.2, 7.7, 8.6, 11.3 and 12.7 UIE bands. It is therefore difficult to search for the IR signals of indene through the 6–14 emission complex. In contrast, the C–H stretching bands at 3.26 and 3.44 could potentially allow one to identify indene in space. While the Infrared Spectrograph (IRS) on Spitzer only operates longward of 5.2 and does not cover the characteristic 3.26 and 3.44 bands of indene, the Short Wavelength Spectrometer (SWS) on board ISO and the Infrared Camera (IRC) on board AKARI lack the sensitivity to detect weak signals from specific PAH molecules such as indene. The Near InfraRed Spectrograph (NIRSpec) on JWST spans the wavelength range of the characteristic C–H bands of indene. This, combined with its unprecedented high sensitivity, JWST could potentially place the detection of the C–H bands of indene on firm ground.
It should be noted that the characteristic 3.26 and 3.44 bands of indene are close in wavelengths to the 3.3 UIE band and its satellite band at 3.4, respectively. The 3.4 band is commonly attributed to the aliphatic C–H stretch of PAHs with aliphatic sidegroups (see Yang et al. 2017) or superhydrogenated PAHs (see Yang et al. 2020). With a spectral resolution of 1000, the JWST/NIRSpec Multi-Object Spectroscopy may be capable of distinguishing these bands. Moreover, as illustrated in Figure 6, the model-predicted 3.26/3.44 band ratio () is essentially constant and insensitive to the physical conditions. In contrast, the 3.3/3.4 band ratio shows a strong dependence on the hardness of the exciting radiation field, as illustrated in Figure 15 of Yang & Li (2003). Furthermore, the far-IR bands of indene at 17.7, 21.9, and 25.9 (see Figures 3 and 4) can also be used to probe its presence in the ISM as the far-IR bands arise from the bending of the whole PAH skeleton (mostly out-of-plane) and are thus intrinsically related to the molecular structure (see Zhang et al. 2010).

Let be the hydrogen column density along the line of sight to an astrophysical region. Let be the number of carbon atoms (per H nucleon) locked up in indene. The intensity of the IR emission (erg) expected from indene would be
| (7) |
where the denominator “9” accounts for the fact that an indene molecule has nine carbon atoms. The column density of indene is simply
| (8) |
Therefore, by comparing the observed intensity with the model emissivity (e.g., see Figure 4a–d), one can derive . If is known, then one can determine how much carbon (per H nucleon) is locked up in indene. On the other hand, if is known from the measurements of its rotational lines, one can predict the IR emission intensity by multiplying the model emissivity shown in Figure 4a–d with .
Finally, we admit that how indene forms and survives in the ISM is still puzzling. It is generally believed that only PAHs with more than 20 carbon atoms may survive in the ISM (see Tielens 2008). However, Iida et al. (2022) recently found that small carbon clusters with as few as nine carbon atoms can be efficiently stablized with the aid of the so-called “Recurrent Fluorescence” (also known as Poincaré fluorescence, see Léger et al. 1988), a radiative relaxation channel in which optical photons are emitted from thermally populated electronically excited states. Regarding the detection of indene in TMC-1, Maté et al. (2023) argued that volatile molecules like indene should freeze to a large extent on the ice mantles of dust grains in TMC-1, and therefore the detection of gas-phase indene may require the cycling of this molecule between the gas and the solid, probably through balancing the freezing and accretion of indene on solid grains by cosmic ray sputtering (e.g., see Dartois et al. 2022). On the other hand, current models, including gas-phase and grain surface reactions, underpredict the observed indene abundances in TMC-1 by three orders of magnitude (Burkhardt et al. 2021). By exploiting crossed molecular beam experiments, Doddipatla et al. (2021) suggested an unusual pathway leading to the formation of indene via a barrierless bimolecular reaction involving the simplest organic radical—methylidyne (CH)—and styrene (C6H5C2H3) through the hitherto elusive methylidyne addition–cyclization–aromatization (MACA) mechanism. While this could be a viable route in dense clouds, it remains unclear how indene could form in the diffuse ISM.
6 Summary
We have modeled the vibrational excitation of indene, the first pure, specific PAH species ever identified in space, and have calculated its IR emission spectra for a number of representative astrophysical regions, from the diffuse ISM to regions illuminated by stars of different effective temperatures. Also calculated is the TMC-1 dark molecular cloud where indene was detected through its rotational lines. It is found that the IR emission spectral shape of indene remains essentially invariant with environments. With the most prominent bands occuring at 3.26 and 3.44, indene may be detectable by the NIRSpec instrument on board JWST.
Acknowledgements
We thank the anonymous referees for helpful comments and suggestions. We thank B.M. Broderick, B.T. Draine, B.A. McGuire, and E.F. van Dishoeck for stimulating discussions. KJL and TTF are supported by the National Key R&D Program of China under No. 2017YFA0402600, and the NSFC grants 11890692, 12133008, and 12221003, as well as CMS-CSST-2021-A04. XJY is supported in part by NSFC 12333005 and 12122302 and CMS-CSST-2021-A09.
Data Availability
The data underlying this article will be shared on reasonable request to the corresponding authors.
References
- [] Allamandola, L.J., Tielens, A.G.G.M., & Barker, J.R. 1985, ApJ, 290, L25
- [] Allamandola, L.J., Hudgins, D.M., & Sandford, S.A. 1999, ApJ, 511, 115
- [] Bauschlicher, C. W., Ricca, A., Boersma, C., & Allamandola, L.J. 2018, ApJS, 234, 32
- [] Beyer, T., & Swinehart, D.F. 1973, Commun. Assoc. Comput. Machinery, 16, 379
- [] Boersma, C., Bauschlicher, C.W., Ricca, A., et al. 2014, ApJS, 211, 8
- [] Burkhardt, A. M., Lee, K.L.K., Changala, P.B., et al. 2021, ApJL, 913, L18
- [] Candian, A., Zhen, J., & Tielens, A. G. G. M. 2018, Physics Today, 71, 38
- [] Cardelli, J. A., Clayton, G. C., & Mathis, J. S. 1989, ApJ, 354, 245
- [] Cernicharo, J., Heras, A. M., Tielens, A. G. G. M., et al. 2001, ApJL, 546, L123
- [] Cernicharo, J., Agúndez, M., Cabezas, C., et al. 2021, A&A, 649, L15
- [] Chalyavi, N., Dryza, V., Sanelli, J.A., & Bieske, E.J. 2013, J. Chem. Phys., 138, 224307
- [] Chu, W.Y., Yu, C.T., Xiao, Z.J., Zhang, Q., Chen Y., & Zhao, D.F. 2023, Molecular Physics, 121, e2150703
- [] Dartois, E., Chabot, M., Koch, F., et al. 2022, A&A, 663, A25
- [] Doddipatla, S, Galimova, G.R., Wei, H., et al. 2021, Sci. Adv., 7, eabd4044
- [] Draine, B.T., & Li, A. 2001, ApJ, 551, 807
- [] Draine, B.T., & Li, A. 2007, ApJ, 657, 810
- [] Draine, B.T., Li, A., Hensley, B.S., et al. 2021, ApJ, 917, 3
- [] Eddington, A.S. 1926, Bakerian Lecture: Diffuse Matter in Interstellar Space, Proc. R. Soc. Lond. A, 111, 424
- [] Iida, S., Hu, W., Zhang, R., et al. 2022, MNRAS, 514, 844
- [] Klots, T.D. 1995, Spectrochimica Acta A, 51, 2307
- [] Kwok, S., & Zhang, Y. 2011, Nature, 479, 80
- [] Léger, A., & Puget, J. 1984, A&A, 137, L5
- [] Léger, A., Boissel, & d’Hendecourt, L.B. 1988, Phys. Rev. Lett., 60, 921
- [] Li, A. 2004, in Astrophysics of Dust, Witt, A.N., Clayton, G.C., & Draine, B.T. (eds.), ASP Conf. Ser., 309, 417
- [] Li, A. 2020, Nature Astronomy, 4, 339
- [] Li, A., & Draine, B.T. 2001, ApJ, 554, 778
- [] Li, K.J., Li, A., Yang, X.J., & Fang, T.T. 2024, ApJ, 961, 107
- [] Maté, B., Tanarro, I., Timón, V., et al. 2023, MNRAS, 523, 5887
- [] Mathis, J.S., Mezger, P.G., & Panagia, N. 1983, A&A, 128, 212
- [] Mattioda, A.L., Hudgins, D.M., Boersma, C., et al. 2020, ApJS, 251, 22
- [] McGuire, B. A., Burkhardt, A. M., Kalenskii, S., et al. 2018, Science, 359, 202
- [] McGuire, B. A., Loomis, R. A., Burkhardt, A. M., et al. 2021, Science, 371, 1265
- [] Peeters, E., Allamandola, L.J., Hudgins, D.M., Hony, S., & Tielens, A.G.G.M. 2004, in Astrophysics of Dust (ASP Conf. Ser. 309), ed. A.N. Witt, G.C. Clayton, & B.T. Draine (San Francisco, CA: ASP), 141
- [] Perkampus, H.H. 1992, UV-VIS Atlas of Organic Compounds (2nd ed.), VCH, Weinheim
- [] Sita, M. L., Changala, P. B., Xue, C., et al. 2022, ApJL, 938, L12
- [] Stein, S.E., & Rabinovitch, B.S. 1973, J. Chem. Phys., 58, 2438
- [] Tabone, B., Bettoni, G., van Dishoeck, E.F., et al. 2023, Nature Astronomy, 7, 805
- [] Tielens, A.G.G.M. 2008, ARA&A, 46, 289
- [] Whittet, D.C.B., Shenoy, S. S., Clayton, G. C., & Gordon, K.D. 2004, ApJ, 602, 291
- [] Yang, X.J., Glaser, R., Li, A., & Zhong, J.X. 2017, New Astron. Rev., 77, 1
- [] Yang, X.J., Li, A., & Glaser, R. 2020, ApJS, 247, 1
- [] Yang, X.J., & Li, A. 2023, ApJS, 268, 50
- [] Zhang, J., Han, F.Y., Pei, L.S., Kong, W., & Li, A. 2010, ApJ, 715, 485
- [] Zilberg, S., Kendler, S., & Haas, Y. 1996 J. Phys. Chem., 100, 10869