Ergonomic Design of Computer Laboratory Furniture: Mismatch Analysis Utilizing Anthropometric Data of University Students
Abstract
Many studies have shown how ergonomically designed furniture improves productivity and well-being. As computers have become a part of students’ academic lives, they will grow further in the future. We propose anthropometric-based furniture dimensions suitable for university students to improve computer laboratory ergonomics. We collected data from 380 participants and analyzed 11 anthropometric measurements, correlating them to 11 furniture dimensions. Two types of furniture were found and studied in different university computer laboratories: (1) a non-adjustable chair with a non-adjustable table and (2) an adjustable chair with a non-adjustable table. The mismatch calculation showed a significant difference between existing furniture dimensions and anthropometric measurements, indicating that 7 of 11 existing furniture dimensions need improvements. The one-way ANOVA test with a significance level of 5% also showed a significant difference between anthropometric data and existing furniture dimensions. All 11 dimensions were determined to match the student’s anthropometric data. The proposed dimensions were found to be more compatible and showed reduced mismatch percentages for 9 furniture dimensions and nearly zero mismatches for SW, BH, and UTH for both males and females compared to existing furniture dimensions. The proposed dimensions of the furniture set with adjustable seat height showed slightly improved results for SH and STC, which showed zero mismatches compared to the non-adjustable furniture set. The TW and TD dimensions were suggested according to Barnes and Squires’ ergonomic work envelope model, considering hand reach. The position for the keyboard and mouse was also suggested according to the work envelope. The monitor position and viewing angle were proposed according to OSHA guidelines. This study suggests that the proposed dimensions can improve comfort levels, reducing the risk of musculoskeletal disorders among students. Further studies on the implementation and long-term effects of these proposed dimensions in real-world computer laboratory settings are recommended.
keywords:
Ergonomics , ANOVA , Anthropometric measurements , Mismatch analysis , Computer lab furniture , Furniture design[inst1]organization=Department of Industrial Engineering and Management,addressline=Khulna University of Engineering and Technology (KUET), city=Khulna, postcode=9203, country=Bangladesh
[inst2]organization=Department of Computer Science,addressline=American International University-Bangladesh (AIUB), city=Dhaka, postcode=1229, country=Bangladesh
1 Introduction
The use of computers in professional environments is experiencing an upward trend. Moreover, the use of home computers for both occupational and educational purposes has seen a notable surge over the preceding decades (Py Szeto et al.,, 2014). Poor posture linked to furniture is a recognized factor that can increase the likelihood of developing musculoskeletal disorders (MSDs) (Magnusson and Pope,, 1998). Therefore, human body measurements are the most critical factor in designing furniture that can effectively adapt to posture, thereby enhancing comfort (Kopardekar,, 1996). Anthropometry plays a vital role in designing work environments to reduce the occurrence of MSDs among employers and employees, ultimately leading to increased productivity (Afzan et al.,, 2012). A study was conducted on the postural angles of primary body segments, including the neck, elbow, and wrist, among six sets of parents and children while using a computer at home (Williams and Jacobs,, 2002). Ergonomics seeks to create work environments that allow individuals to work easily, efficiently, and safely (Savanur et al.,, 2007). Creating equipment, merchandise, furniture, and other devices that match the human body’s needs can enhance the comfort, physical health, well-being, and performance of individuals (Parvez et al.,, 2018).
The motivation for this study stems from the growing recognition of the importance of ergonomic design in enhancing human productivity and well-being. In recent years, numerous studies have demonstrated the positive impact of ergonomically designed furniture on comfort, health, and performance, particularly in settings where individuals spend prolonged periods of time seated at desks, such as offices and educational institutions. As computers and digital technology continue to permeate various aspects of academic and professional life, ensuring optimal ergonomic conditions in computer labs has become increasingly crucial. While ergonomic guidelines and standards exist for general office environments, there is a notable gap in tailored guidelines for computer labs, particularly for university students.
The prevalence of computers in educational settings, especially universities, highlights the need to prioritize students’ physical comfort and health by providing ergonomically sound furniture. However, the lack of specific guidelines for computer laboratories presents a challenge in achieving this objective. This study addresses this gap by proposing anthropometric-based furniture dimensions that are specifically designed for university students. By analyzing data collected from 380 participants and correlating 11 anthropometric measurements to 11 furniture dimensions, this research aimed to optimize furniture design in university computer labs to better accommodate students’ physical characteristics.
We aimed to identify potential mismatches between students’ anthropometric measurements and computer lab furniture dimensions to establish better dimensions for the design parameters of computer lab furniture for university students, considering relevant anthropometric measurements of students sitting to minimize potential mismatches and prolonged health issues. This research aims to assess and compare the potential mismatch between two existing sets of computer tables and chairs and propose standardized design criteria and dimensions based on anthropometry and safety guidelines for students. This will involve analyzing 11 anthropometric data points along 11 furniture dimensions using ANOVA for decision-making. It is anticipated that aligning furniture more closely with the human body will result in a notable reduction in MSDs and an associated increase in productivity. Both non-adjustable and adjustable furniture dimensions must be adjusted according to the anthropometric data of the undergraduate students.
This study focuses on optimizing university furniture design using personalized anthropometric measurements tailored to university student populations. By analyzing 11 key anthropometric measurements and comparing them with existing furniture, I provide a comprehensive understanding of students’ ergonomic needs. ANOVA statistical analysis adds robust validation to my findings, ensuring that any proposed ergonomic design is grounded in solid statistical evidence. My research proposes innovative and ergonomically designed furniture solutions based on current student body measurement data, potentially improving student comfort, productivity, and overall well-being. These findings have significant implications for educational institutions and furniture manufacturers, highlighting the importance of customizing furniture designs to meet users’ specific needs. My research contributes to the ergonomics and design fields by addressing the literature gap regarding the ergonomic needs of university students. The proposed ergonomic designs have practical applications in real-world settings, such as university classrooms, computer labs, and study areas, where they can enhance the learning environment and promote student health and well-being. This research also opens the door for further exploration of the ergonomic needs of different user groups and the development of more tailored furniture solutions for various settings.
The contributions of the proposed work are given below:
-
1.
This study highlights the importance of considering anthropometric measurements in furniture design for educational institutions, serving as a reference for future research and informing the design of ergonomic furniture in other educational settings.
-
2.
By identifying the mismatch between existing furniture dimensions and anthropometric measurements, this research offers practical insights for designing ergonomic furniture in university environments, improving comfort, health, and productivity among students and staff.
-
3.
Designing ergonomic furniture that meets the specific needs of university students and staff may lead to potential cost savings for educational institutions through reduced absenteeism, increased productivity, and improved overall well-being.
-
4.
We collected and analyzed anthropometric data from university students, providing valuable insights into the body measurements of the target population.
-
5.
We conducted a correlation analysis among 11 anthropometric measurements, shedding light on the interrelationships between different body dimensions.
-
6.
By comparing the mismatch between two different types of existing furniture and anthropometric data, the study offers a nuanced understanding of how different furniture designs affect users’ comfort and well-being.
-
7.
The study employed ANOVA for better decision-making, providing a robust statistical framework for assessing the significance of differences among existing furniture types and anthropometric measurements.
-
8.
Drawing from the current students’ body measurement data, this study proposes ergonomically designed furniture that aligns with the specific needs and dimensions of the target population, offering practical solutions for enhancing comfort and productivity in university settings.
The paper is structured as follows: The “Introduction” section overviews the research problem and outlines the significance of addressing ergonomic challenges in university environments. In the “Literature Review” section, we review existing studies on ergonomics and anthropometric measurements in university settings, highlighting the gaps that our research aims to fill. The “Methodology” section details our approach to collecting anthropometric data and designing furniture based on these measurements. In the “Results and Discussion” section, we present the findings of our anthropometric survey, evaluate the proposed ergonomic furniture design, interpret and discuss the results. The “Conclusions” section summarizes the main findings and contributions of the study and proposes future research directions.
2 Literature Review
Self et al., (2019) conducted a study that examined the potential factors that promote or hinder interdisciplinary education in design, specifically from the viewpoint of student learning. The researchers conducted a series of detailed interviews with students from two interdisciplinary design schools, one located in the Republic of Korea and the other in the UK. This study discusses the implications of adopting interdisciplinary approaches in design education and proposes areas for further research in this domain (Self et al.,, 2019). Laeser et al., (1998) recognized the necessity for furniture designed for 6th and 8th grade children. In their study, students from these grades performed keyboarding and mousing tasks at two distinct computer workstations. One workstation was a conventional desktop setup, whereas the other featured an adjustable keyboard. The study found that the overall posture scores of the students improved when using the adjustable workstation, as indicated by the Rapid Upper Limb Assessment. Thariq, (2010) found that current side-mounted desktop chair designs are not suited to fulfilling the postural and comfort requirements of university students in their learning environment. In response, the researchers conducted an anthropometric survey of university students in Sri Lanka. The survey aimed to create fixed-type and side-mounted desktop chairs and evaluate their comfort levels based on design dimensions. This research emphasizes the significance of chairs that support the development of a healthy and comfortable posture among students, which can contribute to creating a healthy workforce in various industries. Taifa and Desai, (2017) recognized the issue of poorly designed furniture for engineering students in India. The authors employed a health survey, specifically an ergonomic assessment, to gather and analyze the data in their study. Based on their findings, the authors proposed the design of adjustable classroom furniture as a solution to reduce MSDs.
Hoque et al., (2014) found that classroom furniture does not consider ergonomics. The authors conducted an anthropometric survey of 500 Bangladeshi university students, followed by a mismatch analysis. Based on their findings, the authors recommend the use of ergonomically fit furniture. Joshi et al., (2015) addressed the significant rise in the design of computer workstations and associated health and safety issues for users. Their research aimed to evaluate students’ knowledge at the G.B.P. University of Agriculture and Technology concerning the use of ergonomically appropriate computer workstations. The authors conducted a postural assessment using the participative ergonomic technique of Rapid Upper Limb Assessment (RULA). The study revealed that most computer users lacked adequate information regarding the positioning of computer workstations, and a substantial number of computer operators reported issues with their upper extremities. Mowatt et al., (2018) aimed to determine the prevalence of computer vision syndrome (CVS) and ergonomic practices among students in the Faculty of Medical Sciences at The University of the West Indies, Jamaica. A cross-sectional study was conducted for research purposes using a self-administered questionnaire. The study found that ocular symptoms and neck pain were less likely when the device was held just below eye level. The study highlighted a high prevalence of CVS symptoms among university students, suggesting that adopting improved ergonomic practices could potentially reduce issues such as neck pain, eye strain, and burning. Kahya, (2019) investigated the congruence between the dimensions of school furniture and anthropometric measurements of students. They assessed nine anthropometric dimensions of 225 students from nine departments. The results indicated a significant mismatch, with a seat height discrepancy of 44.45% discrepancy, seat depth of 100% discrepancy, and desk height of 21.28% discrepancy. This study lays the groundwork for and encourages further exploration of classroom ergonomics in university settings. Abd Rahman et al., (2018) developed an anthropometric database tailored to Malaysian operators, focusing on sitting and standing dimensions. The database was constructed from measurements of 146 male and 168 female participants aged 18 - 45 years. Thirty-six anthropometric dimensions were chosen to compare their common availability across the four countries. This knowledge of population variations is crucial for designing workstations and facilities that accommodate the needs of the industrial environment.
Zayed et al., (2021) sought to understand the prevalence and factors associated with Digital Eye Strain (DES) among IT professionals at Tanta University, Egypt. They employed an interview questionnaire to collect and analyze data, revealing significant predictors of DES, including sex, age, wearing eyeglasses, prolonged computer use, an unadjusted ergonomic workstation, and a dry environment. The study concluded that DES can be mitigated by increasing knowledge and awareness through eye health education, regular training in ergonomic workstations, and adjustments to create a comfortable workplace environment. Parvez et al., (2018) identified that poorly fitting furniture could contribute to various MSDs and discomforts. To delve into this issue, they surveyed ten primary schools in Bangladesh, revealing a notable disparity between furniture dimensions and student body measurements. Moreover, this paper proposes furniture dimensions that could notably decrease the mismatch percentage among students from 90% to 10%. Shohel Parvez et al., (2022) acknowledged that inadequately designed furniture could potentially exacerbate MSDs. They conducted a survey of 400 university students (250 males and 150 females) who volunteered for the study. The Standard Nordic Musculoskeletal Questionnaire was used to evaluate MSDs. The authors recommended that modifying the design of academic furniture could help alleviate or prevent MSD.
Dessie et al., (2018) observed that prolonged computer use could increase the risk of CVS in users. They conducted a cross-sectional study to gauge the prevalence of CVS and its related factors among government employees in Debre Tabor town, encompassing 607 participants. The research revealed that computer users with a comprehensive understanding of computer use safety measures and associated adverse effects were less susceptible to CVS. Boadi-Kusi et al., (2020) emphasized the importance of addressing poor ergonomic office setups that can lead to university administrative staff in Ghana spending prolonged periods behind computer screens, thus increasing the risk of developing CVS. To address this issue, a cross-sectional survey was conducted among 200 administrative staff members at the University of Cape Coast. The results indicated that raising awareness about CVS and adhering to recommended ergonomic practices are crucial in reducing the prevalence of CVS and, consequently, enhancing work satisfaction and productivity. Moradi et al., (2017) conducted an ergonomic risk assessment of auto mechanics. This study found that the back and waist had the highest prevalence of work-related MSDs. Fazi et al., (2019) utilized the Rapid Upper Limb Assessment (RULA) method to assess risks in an automotive manufacturing company. These findings demonstrated an exceptionally high level of risk, highlighting the urgent need for immediate changes. Kibria, (2019) developed a self-report Nordic ergonomic assessment questionnaire to identify discrepancies between furniture dimensions and anthropometric measurements. The proposed ergonomically designed computer workstation, informed by anthropometric measurements and guidelines, could potentially alleviate MSDs among university teachers. This study could significantly influence ergonomic furniture design in universities and other organizations, addressing computer-related ergonomic challenges.
The current literature on ergonomics and its impact on user health and performance has identified several research gaps that warrant further investigation. First, comprehensive research on interdisciplinary education in design and its impact on student learning outcomes is lacking. Second, few studies have been conducted on the impact of ergonomic furniture design on children’s posture and health. Third, there is a shortage of research on the ergonomic needs of university students, particularly in different countries and cultural contexts. Fourth, studies on the prevalence and impact of CVS among university students and professionals in various occupational settings are scarce. Fifth, there is a lack of research on the effectiveness of ergonomic interventions in reducing the risk of MSDs and other ergonomic-related issues in occupational settings. Sixth, limited research has been conducted on the impact of ergonomic interventions on improving work satisfaction, productivity, and overall well-being in various occupational settings. Seventh, there is a shortage of research on the long-term effects of ergonomic interventions on employees’ health, performance, and retention. Finally, there is a lack of studies on the cost-effectiveness of ergonomic interventions and their potential return on investment in different occupational settings. Addressing these research gaps will contribute to developing more effective ergonomic interventions and overall well-being in various occupational settings. However, there has been a limited emphasis on the design of furniture and computer labs for undergraduate education in universities, and there is a lack of established standards for computer lab furniture in Bangladeshi universities. Bangladeshi universities typically use desktops, chairs, and tables as computer lab furniture. Prolonged use of these improperly designed furniture pieces could exacerbate MSDs in young adults. Hence, ergonomically fitted furniture is crucial. Failure to address these issues in a timely manner could result in undetected severe health problems among the students.
3 Methodology
The main goal of this study is to assess the current state of computer laboratories in Bangladesh. This will be accomplished by gathering anthropometric data from the students. The objective was to establish standardized criteria and measurements for the design of computer tables in Bangladesh. The sequential steps of this study are outlined in Figure 1.
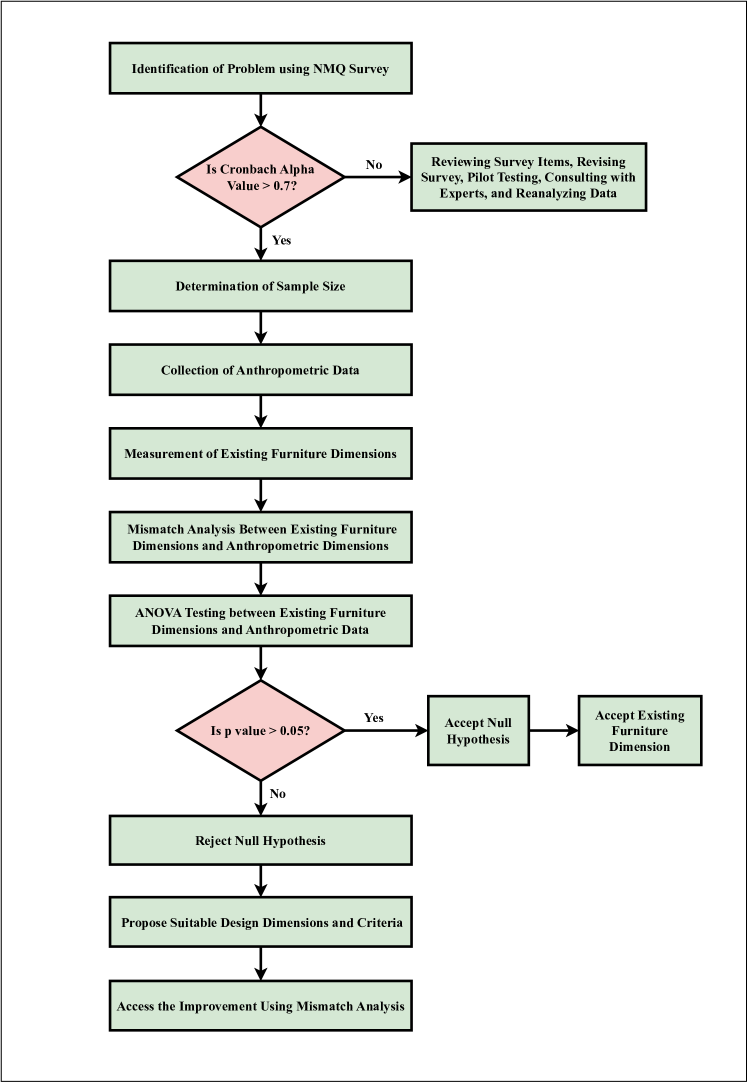
3.1 Problem Identification
In our research, we sought to assess the ergonomic risks that students face due to prolonged sitting at their desks and the potential development of Work-related MSDs (WMSDs). We developed a comprehensive self-reported questionnaire based on the Nordic Musculoskeletal Questionnaire (NMQ), which has been extensively used and validated in previous studies. The questionnaire was designed to gather information on the frequency and severity of musculoskeletal symptoms experienced by teachers, focusing on areas such as the neck, shoulders, back, and wrists, which are commonly affected by prolonged sitting and poor ergonomics. Participants were asked to report the frequency of musculoskeletal symptoms they experienced, classifying them as “constantly” (most of the time during the day), “occasionally” (two to four times a month), or “frequently” (more than four times a month). We also asked the participants whether they had experienced musculoskeletal pain in the past 12 months. This allowed us to assess the prevalence of musculoskeletal pain among teachers and to identify any data patterns or trends. Approximately 78.42% of students reported experiencing MSD-related pains. In this group, 77.67% were male, and 81.25% were female. We collected demographic information, such as age, gender, and level of study, to better understand how these factors might influence the prevalence and severity of musculoskeletal symptoms. The questionnaire was administered to a sample of KUET students. The collected data were analyzed to identify any significant associations between ergonomic factors, such as prolonged sitting and poor posture, and the development of WMSDs. The reliability test for the NMQ survey yielded a Cronbach’s alpha value of 0.77, indicating an “acceptable” level of internal consistency. This value falls within the 95% confidence interval of 0.733 and 0.803, suggesting that if the survey were repeated with different samples, the actual value of Cronbach’s alpha would likely fall within this range 95% of the time.
3.2 Sample Collection
A subset of students was chosen from two departments at the Khulna University of Engineering & Technology (KUET), Khulna, Bangladesh. Equation 1 was used to establish the necessary sample size.
| (1) |
where, represents the sample size or population size, denotes the total population, and refers to the desired precision level set at 5% with a 95% confidence level.
According to KUET’s official database, there are currently 5,240 students enrolled, comprising 4,318 males and 922 females. This yielded a male-to-female ratio of approximately 4.68:1. According to Equation 1, a minimum of 372 or more data points should be collected. This study gathered anthropometric data from 300 males and 80 females, representing up to 7,000 students. All the students’ ages ranged from 17 to 26 years. The Director of Research & Extension, KUET, approved the experimental procedures, which were conducted in accordance with the principles stated in the Declaration of Helsinki. Participation in the survey was voluntary, and participants had the right to withdraw at any time without penalties. Confidentiality of participant responses was strictly maintained, and all data collected were anonymized and stored securely. The dataset, available for further exploration, can be found in “Anthropometric Data of KUET students” (Jahin and Saha,, 2024).
| Study level | Male | Female |
|---|---|---|
| 1st year student | 70 | 20 |
| 2nd year student | 70 | 20 |
| 3rd year student | 70 | 20 |
| 4th year student | 90 | 20 |
| Total | 300 | 80 |
3.3 Anthropometric Measurements
The 11 anthropometric measurements described in Table 2 were obtained for this study (see Figure 2). These dimensions were measured using definitions employed in earlier studies (Kroemer et al.,, 1997). A chair and a Harpenden Anthropometer were used to determine the seating dimensions, and sitting assistance was used to support participants in maintaining a straight posture with their feet flat on the floor. Before data collection, rigorous calibration of all equipment was conducted in accordance with the established standards to maintain the accuracy and precision of the measurements. Throughout the trial, the participants were instructed to maintain a straight posture on a flat-surfaced seat, with their knees positioned at a angle. Standardized posture is crucial for the consistency and comparability of anthropometric data. Participants were briefed about the study objectives, and precise postures were maintained during anthropometric measurements. All measurements were documented in millimeters (mm).


| Anthropometric dimensions | Acronym | Description |
|---|---|---|
| Popliteal Height | PH | Vertical distance from the floor to the popliteal angle, located on the lower surface of the knee, while keeping the feet flat on the floor. |
| Sitting Elbow Height | SEH | Distance from the seat surface to the underside of the elbow, with the forearm horizontal and the upper arm hanging freely downwards. |
| Buttock Popliteal Length | BPL | Distance from the back of the seat to the back of the knee, where the backs of the lower legs meet the underside of the thighs. |
| Buttock Knee Length | BKL | Horizontal distance from the back of the buttocks to the back of the knee. |
| Hip Breadth | HB | The horizontal measurement taken across the hips while the participant is sitting and keeping their knees together (maximum width). |
| Sitting Shoulder Height | SSH | Vertical distance from the seat surface to the acromion (bony shoulder point). |
| Sitting Elbow Height | SEB | Horizontal distance across the lateral surfaces of the elbows. |
| Thigh Thickness | TT | Vertical distance from the seat surface to the top of the thigh, where the uncompressed soft tissue of the thigh meets the abdomen. |
| Arm Length | AL | Vertical distance from the scapula’s lowest point (inferior angle) to the participant’s sitting surface. |
| Elbow Fingertip Length | EFL | Horizontal distance from the back of the elbow to the tip of the middle finger in a standard sitting position. |
| Subscapular Height | SCH | Vertical distance from the scapula’s lowest point (inferior angle) to the participant’s sitting surface. |
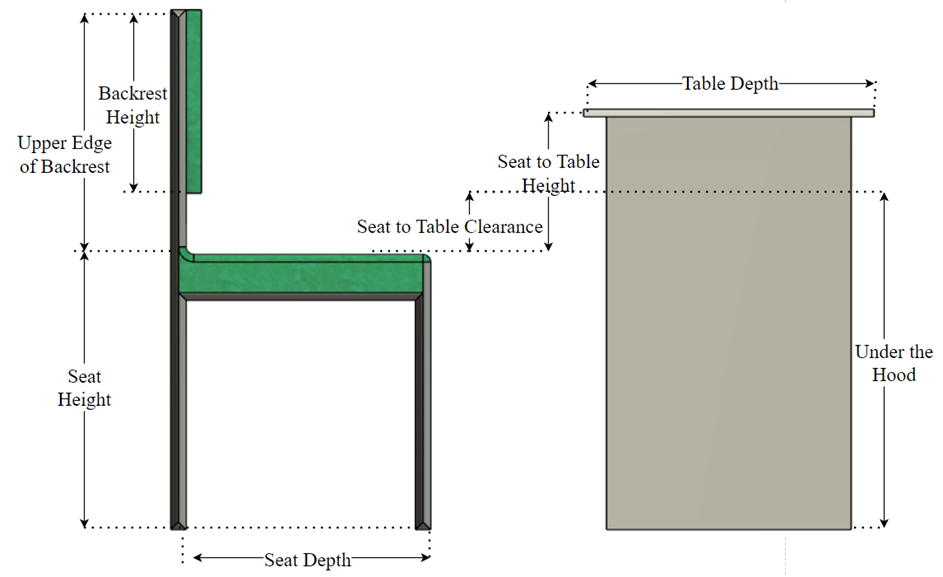
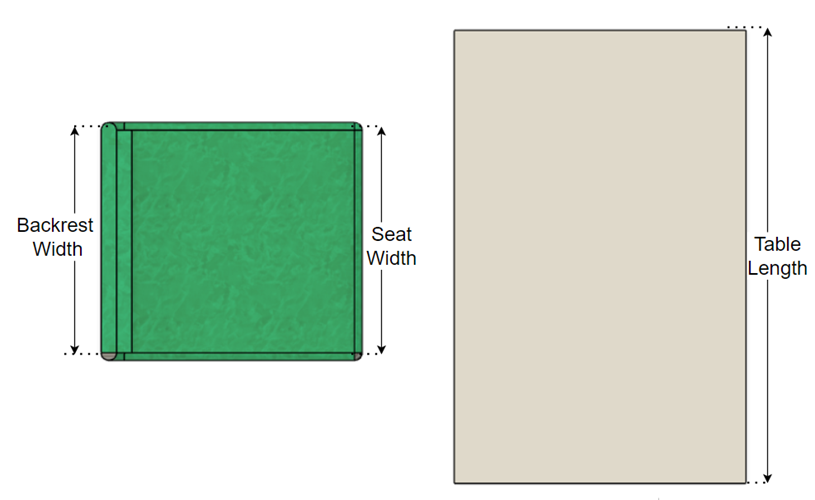
3.4 Furniture Dimensions
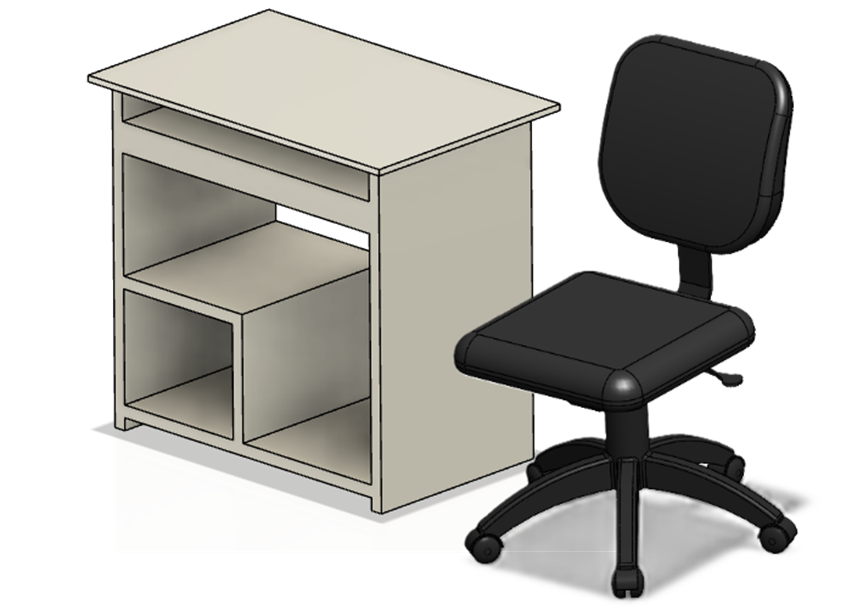
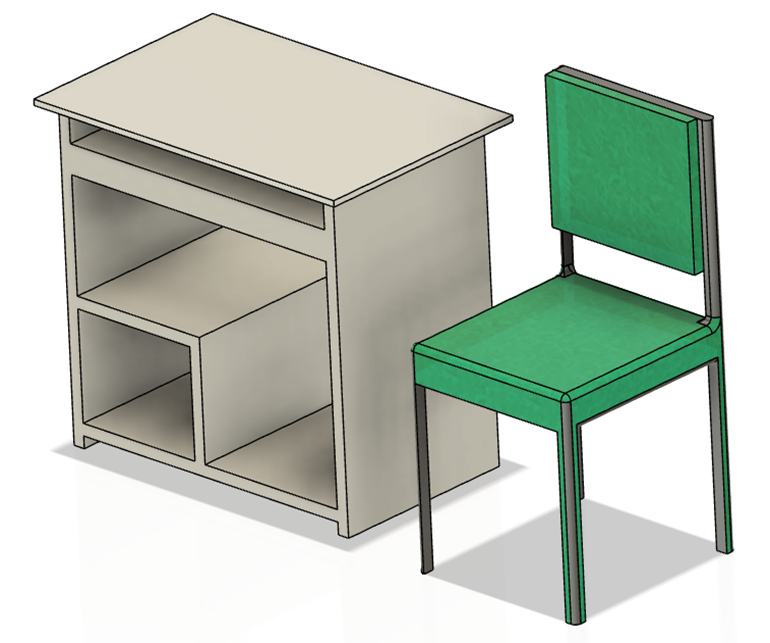
The dimensions used for designing the furniture are shown in Figure 3 with identities. This study evaluated two types of university furniture used in computer labs at KUET. One was a ‘table with adjustable chairs,’ and the other was a ‘table with non-adjustable chairs,’ both commonly used in computer labs at KUET. Figure 3 depicts the computer lab furniture design parameters, whereas Figure 4 shows the two furniture sets. As such, the study measured 11 design parameters for the two types of existing computer furniture, as described in Table 3.
| Furniture dimension | Acronym | Description |
|---|---|---|
| Seat Height | SH | Vertical distance from the floor to the top of the seat surface. |
| Seat Width | SW | Horizontal distance between the lateral edges of the seat. |
| Seat Depth | SD | Horizontal distance from the front edge to the back edge of the seat surface. |
| Backrest Height | BH | Vertical distance from the seat surface’s top edge to the backrest’s top edge. |
| Backrest Width | BW | Horizontal distance between the lateral edges of the backrest. |
| Seat to Table Height | STH | Vertical distance from the seat surface’s top edge to the table surface’s top edge. |
| Table Depth | TD | Horizontal distance from the front edge to the back edge of the table surface. |
| Table Length | TL | The maximum horizontal distance between the lateral edges of the table surface |
| Table Height | TH | Vertical distance from the floor to the top edge of the table surface. |
| Underneath Table Height | UTH | Vertical distance from the lowest point below the table to the floor’s surface. |
| Upper Edge of Backrest | UEB | Vertical distance from the backrest’s top edge to the headrest’s top edge. |
3.5 Furniture Dimensions and Anthropometric Data Mismatch
Considering the students’ anthropometric measurements when designing and evaluating computer lab furniture is essential. This involves using relevant anthropometric estimations and ergonomic standards to determine the acceptable range for each furniture measurement.
3.5.1 PH against SH
Popliteal height (PH) and seat height (SH) are typically connected. SH should provide knee flexion to align the lower legs with the body’s craniocaudal axis at a angle (JFM et al.,, 2003). According to Parcells et al., (1999), PH should be higher than SH. This means that the shin-thigh position should be between and , and the lower leg should create an angle with a vertical axis of to . While an unduly low SH can strain the ischial tuberosities, an extremely high SH can increase the pressure on the bottom of the knee and nerves, decreasing blood circulation (Hoque et al.,, 2014). The SH should be less than 40 mm, or 88% of the PH, to prevent putting excessive pressure on the buttocks (JFM et al.,, 2003). The PH measurement considered the shoe height by adding 30 mm. Therefore, Equation 2 can be used to represent the relationship between PH and SH:
| (2) |
3.5.2 HB against SW
To allow for both furniture flexibility and essential motions, the seat width (SW) should be broad enough to accommodate people with the widest hip breadth (Evans et al.,, 1988; Sanders and McCormick,, 1993). A proper fit is suggested by research, and the 95th percentile of HB is a good place to start when measuring SW (Evans et al.,, 1988; Occhipinti et al.,, 1993; Oborne,, 1995; Sanders and McCormick,, 1993). The SW should be wider than the HB. Previous research has suggested that the optimal SW should to be within the range of 10% to 30% of HB (Dianat et al.,, 2013; Gouvali and Boudolos,, 2006). Consequently, the link between the HB and SW can be established using Equation 3:
| (3) |
3.5.3 BPL against SD
There is a strong relationship between SD and BPL, with BPL frequently serving as a guide for SD development and evaluation. The fifth percentile of the BPL should be used as the basis for the seat depth, according to several studies (Hossain and Ahmed,, 2010; Sanders and McCormick,, 1993; Oborne,, 1995; Panagiotopoulou et al.,, 2004). This guarantees that the seat backrest can support the lumbar spine without compressing the popliteal surface. The seat may not support the thigh when the SD is much shorter than the BPL (Castellucci et al.,, 2010). On the other hand, the user might be unable to use the backrest to support their lumbar spine if the SD is larger than the BPL (Milanese and Grimmer,, 2004). Accordingly, when SD is either 95% of BPL or less, there is a mismatch between the SD and BPL (Afzan et al.,, 2012; Altaboli et al.,, 2015; Dianat et al.,, 2013). Equation 4 can be used to express the connection between BPL and SD.
| (4) |
3.5.4 SEH against STH
According to several studies, the SEH is a critical factor in SDH determination (Bendix and Bloch,, 1986; Milanese and Grimmer,, 2004; JFM et al.,, 2003). Developing an appropriate TH requires careful consideration of shoulder biomechanics, including shoulder flexion angles between and and abduction angles between and (Agha,, 2010; Altaboli et al.,, 2015; Gouvali and Boudolos,, 2006). Furthermore, keeping the arms on the desk significantly reduces strain on the spine. Consequently, according to ref (Poulakakis and Marmaras,, 1998)[50 Pheasant, 51 Poulakakis], the STH should be 3-5 cm higher than the SEH. A synchronized measure was created to verify that the SEH is the most important TH parameter and that the TH height should not increase above 50 mm above the SEH. Equation 5 expresses the link between TH and SEH.
| (5) |
3.5.5 SSH against BH
Flexibility of the arms and upper trunk depends on the appropriate BH. It is recommended that the BH value is not higher than that of the scapula [31 Evans]. Therefore, an ideal BH is between 60% and 80% of sitting shoulder height (Agha,, 2010; Dianat et al.,, 2013; Castellucci et al.,, 2015). BH dimensions should also be less than or equal to the top margin of the scapula. This creates a match criterion, and Equation 6 shows how BH and SSH relate to one another.
| (6) |
3.5.6 TT against SDC
The SDC should be sufficiently large to provide adequate space for leg movement and for the user to move the chair below the table (García-Acosta and Lange-Morales,, 2007; JFM et al.,, 2003). If the SDC is larger than the TT, it is considered a standard dimension (Parcells et al.,, 1999). However, the ideal dimension of SDC should be 20 mm higher than the knee height (Gouvali and Boudolos,, 2006). Therefore, a match criterion was developed, and the relationship between SDC and TT is shown in Equation 7.
| (7) |
3.5.7 PH and TT against UTH
The user should have support for simple access to the seat, leg mobility, and getting off the seat from the Underneath Table Height (UTH) or Under Desktop Height (UDH). In addition, the design must incorporate SH, TT, and an additional 20 mm of space to allow for a shift in leg posture and the lowest standard dimension of UTH (Pérez-Gosende,, 2017). However, according to Gouvali and Boudolos, (2006), the highest dimension of UTH cannot be greater than the difference between the maximum dimension of TH and the table’s thickness, which is 30mm. Consequently, the link between UTH, PH, and TT yields a match equation, as shown in Equation 8.
| (8) |
3.5.8 HB against BW
The HB is regarded as a key metric in the BW design process. The dimensions of BW have been considered by several authors (Thariq,, 2010). Taifa and Desai, (2017) has recently suggested that HB is considered a pertinent anthropometric measurement for BW design. Consequently, an equation was created, and Equation 9 illustrates the relationship between HB and BW:
| (9) |
3.5.9 BKL against TL
The TL is crucial for providing sufficient room for shifting lower body posture or movement. Previous research has suggested that TL should be higher than BKL (Pérez-Gosende,, 2017). Thus, Equation 10 defines the TL minimal limit.
| (10) |
3.5.10 SEB against TD
The TD and SEB anthropometric measurements were connected. The partial widths of the AL and SEB should be included in the lower bound of the TD (Pérez-Gosende,, 2017). Sufficient room is needed for a table so that one can enter and leave the seat. TD thus permits elbow abduction at with a 20 mm margin (Afzan et al.,, 2012; Agha,, 2010; Altaboli et al.,, 2015; Gouvali and Boudolos,, 2006). Equation 11 considers these factors.
| (11) |
3.5.11 SCH against UEB
Another important anthropometric criterion for evaluating UEB is SCH (Bendix and Bloch,, 1986). Numerous studies have indicated that the scapula and arm are immobile if the SCH is smaller than the UEB (Castellucci et al.,, 2010; García-Acosta and Lange-Morales,, 2007; Gouvali and Boudolos,, 2006). Equation 12, therefore, depicts the link between SCH and UEB.
| (12) |
3.6 Level of Compatibility
Some equations have single-directional limitations, while others have dual constraints to assess how well participants’ anthropometric measurements match furniture dimensions. Match and mismatch categories were designed to evaluate compatibility in single-directional connections. Three categories were established for the dual-directional relationships: (a) match (where the anthropometric measurement falls between the limits), (b) low mismatch (where the anthropometric measurement falls below the maximum limit of the relationship), and (c) high mismatch (where the minimum limit of the relationship exceeds the anthropometric measurement).
4 Results and Discussion
4.1 Analysis of Anthropometric Measurements
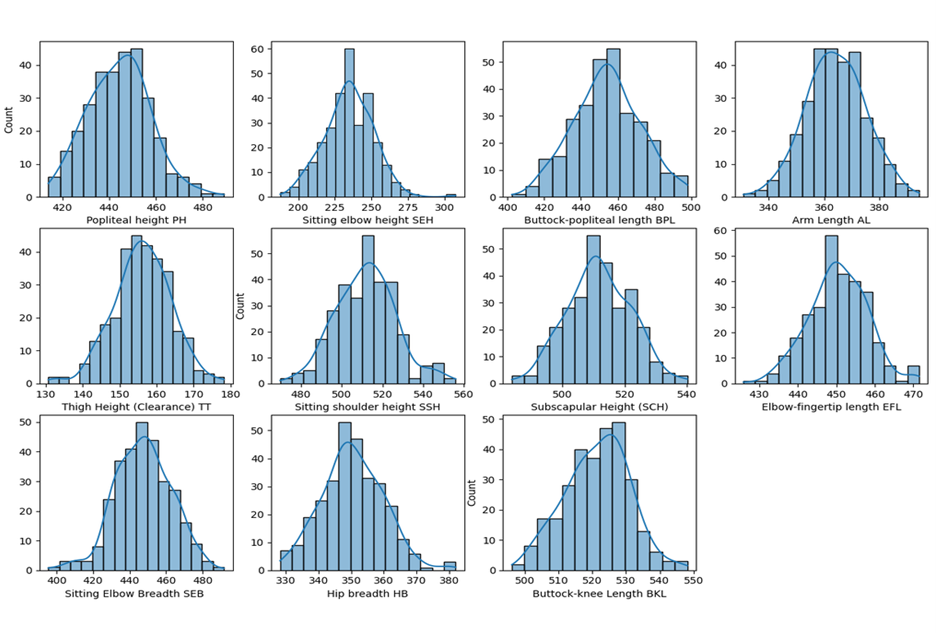
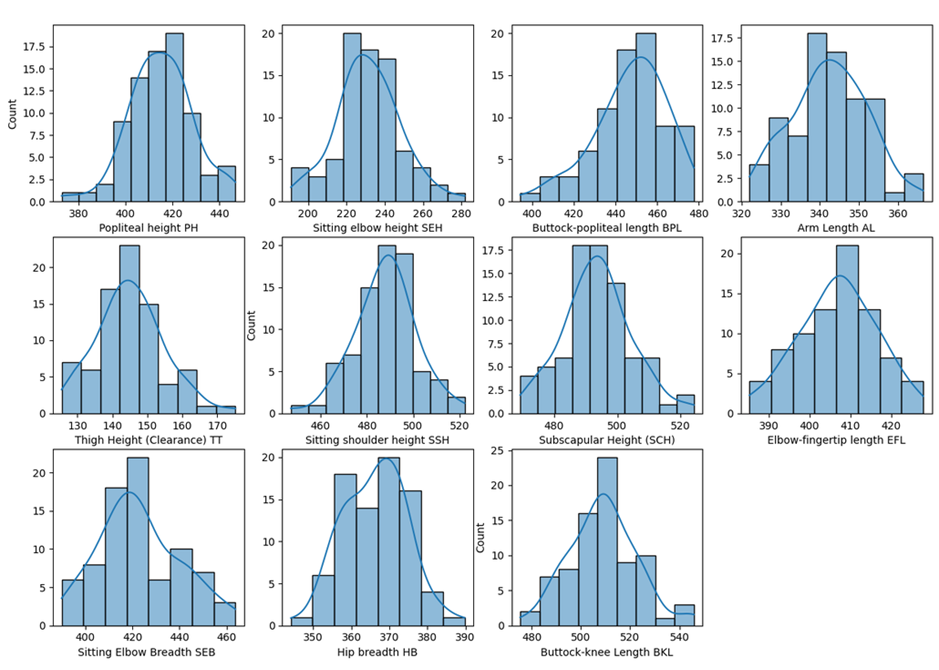
Eleven anthropometric measures were used to compute descriptive statistics using Microsoft Excel 2021. The following values were estimated to create a standard database, as shown in Table 4: minimum (min), maximum (max), mean, standard deviation, and various percentile values (5th, 50th, and 95th percentiles). The anthropometric measurements of the male and female participants in this study were computed independently.
| Measurements | Gender | Min | Max | Mean | Standard Deviation | Percentile | ||
| 5th | 50th | 95th | ||||||
| PH | Male | 414 | 489 | 444.37 | 13.37 | 422.65 | 444.96 | 466.49 |
| female | 373 | 447 | 415.1 | 13.5 | 395.2 | 414.6 | 438.4 | |
| SEH | Male | 188 | 308 | 234.7 | 16.73 | 205.99 | 235.05 | 261.23 |
| female | 191 | 282 | 231.3 | 16.7 | 200.6 | 230.3 | 257.6 | |
| BPL | Male | 402 | 498 | 454.03 | 18.17 | 422.91 | 454.1 | 483.72 |
| female | 394 | 478 | 447.2 | 17.3 | 412.8 | 448.2 | 471 | |
| AL | Male | 331 | 394 | 364.1 | 10.77 | 346.35 | 363.86 | 382.29 |
| female | 322 | 366 | 342.4 | 9.6 | 327 | 342.1 | 355.9 | |
| TT | Male | 131 | 178 | 156.14 | 7.76 | 143.46 | 155.99 | 168.68 |
| female | 126 | 175 | 145.1 | 9.7 | 129.3 | 144.6 | 161.4 | |
| SSH | Male | 470 | 556 | 511.78 | 14.9 | 488.6 | 512.03 | 539.42 |
| female | 447 | 522 | 488 | 13.3 | 467 | 488.9 | 509.2 | |
| SCH | Male | 484 | 540 | 511.7 | 10.22 | 495.19 | 511.42 | 528.01 |
| female | 469 | 524 | 493.6 | 10.8 | 475.1 | 493.8 | 510.1 | |
| EFL | Male | 426 | 471 | 450.46 | 7.67 | 437.08 | 450.21 | 462.3 |
| female | 385 | 428 | 406.9 | 9.5 | 391.7 | 407.5 | 421.4 | |
| SEB | Male | 396 | 492 | 447.47 | 15.36 | 424.46 | 447.56 | 470.46 |
| female | 390 | 464 | 422.9 | 17.2 | 396.1 | 421.2 | 452.9 | |
| HB | Male | 328 | 382 | 350.53 | 9.4 | 335.31 | 350.23 | 365.34 |
| female | 344 | 390 | 366.2 | 8.5 | 353.3 | 367.2 | 379.4 | |
| BKL | Male | 496 | 548 | 521.47 | 9.54 | 505 | 522.23 | 536.1 |
| female | 475 | 546 | 509 | 13.7 | 489.2 | 509 | 529.9 | |
The normal bell-shaped curves observed in Figures 5(a) and 5(b) indicate the reliability and consistency of the collected data. In statistics, a normal distribution is often considered a hallmark of reliable data, as it suggests that the measurements are evenly distributed around the mean, with fewer extreme values and more values clustered around the center. The presence of these curves in the data for both sexes indicates that the measurements were taken accurately and consistently without significant outliers or inconsistencies. This reliability is crucial in ergonomic research, as it ensures that the collected data accurately represent the population and can be used to make informed decisions about furniture design and ergonomics. Additionally, the normal distributions in both male and female datasets suggest that the collected measurements represent the general population rather than being skewed or biased toward one gender. This further enhances the reliability and validity of the dataset and supports its applicability in various settings and industries.
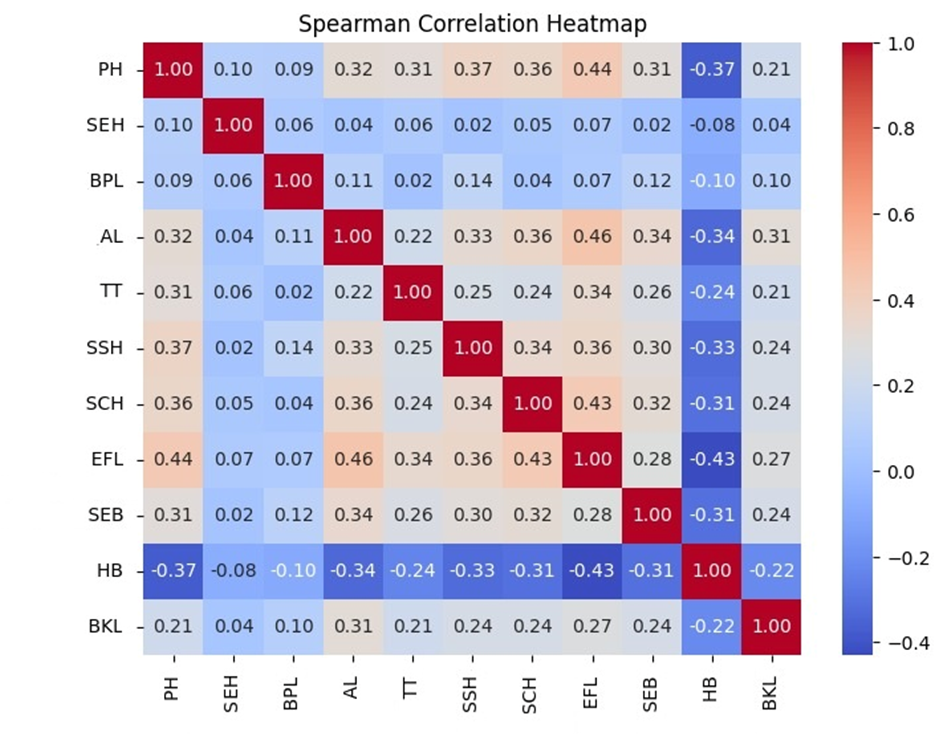
The Spearman correlation method was used to analyze the correlation between all 11 anthropometric measurements. As depicted in Figure 6, the heatmap generated from the analysis represents positive correlations in red and negative correlations in blue. Notably, the elbow fingertip length exhibited a medium positive correlation with PH (0.44), AL (0.46), and SCH (0.43). Conversely, HB was moderately negatively correlated with EFL (-0.43). SEH and BPL showed negligible correlation with other anthropometric measurements, with values close to zero. The Spearman correlation heatmap values ranged from -1 to +1, indicating the strength and direction of the correlations between the variables.
4.2 Analysis of Existing Furniture Dimensions
Table 5 lists the 11 existing furniture dimensions of the computer furniture that were measured. Type-1 indicates a table with a non-adjustable chair, whereas type-2 indicates a table with an adjustable chair.
| Dimensions | Type-1 Furniture set (mm) | Type-2 Furniture set (mm) |
|---|---|---|
| SH | 457.2 | 431.8 - 533.4 |
| SW | 393.7 | 457.2 |
| SD | 406.4 | 431.8 |
| BH | 304.8 | 304.8 |
| BW | 355.6 | 393.7 |
| UEB | 406.4 | 406.4 |
| STH | 241.3 | 228.6 - 330.2 |
| STC | 88.9 | 95.25 - 196.85 |
| UTH | 546.1 | 628.65 |
| TL | 482.6 | 457.2 |
| TD | 749.3 | 749.3 |
4.3 Mismatch Analysis
To evaluate the degree of mismatch between the current library furniture and body measurements, equations 2 through 12 were applied. A mismatch was found if the equation was not satisfied for equations with one-way relationships. Three classes were established to quantify the match or mismatch for equations with two-way relations. A match was found when the anthropometric measurement was in between the ranges. When the relation’s highest limit is less than the anthropometric measurement, a low mismatch is shown. A high mismatch is observed when the relation’s lowest limit is greater than the measurement. To find a mismatch, the writers looked into 11 aspects of computer furniture. Individual matches or mismatches were identified by comparing the dimensions of the furnishings with the body measurements of each participant. Finally, a percentage representing the measured match or mismatch for the sample population was given.
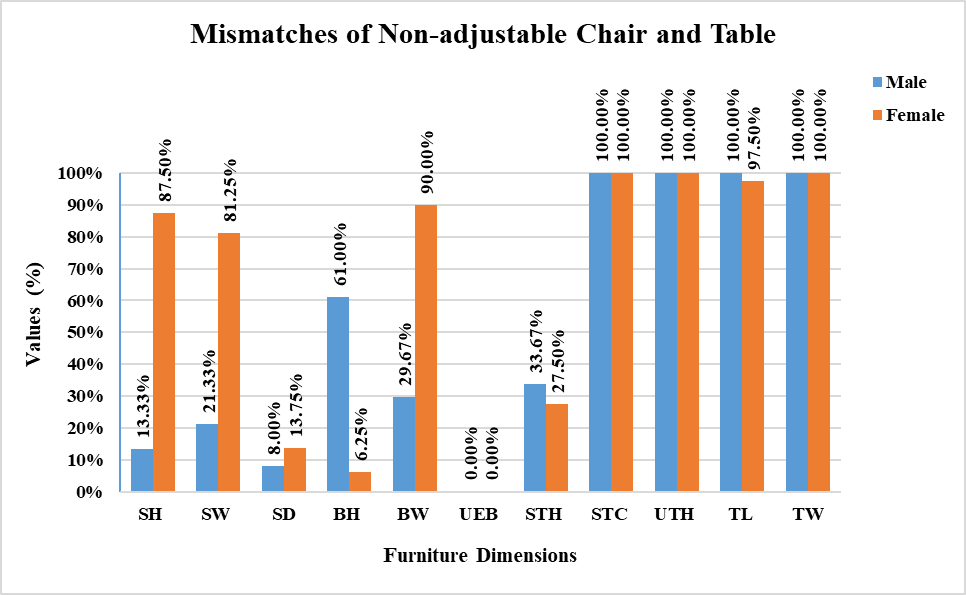
In Table 6, for the first type of furniture (non-adjustable chair with non-adjustable table), the mismatch level is notably higher for male body measurements than females in parameters, such as SH is 74.17%, SW is 59.92%, BW is 60.33% and SD is 5.75% higher whereas BH is 54.75%, and STH is 6.17% lower. Only one parameter, UEB, was found to be a 100% match for both genders. The results were particularly poor for the table-related parameters, indicating that furniture was poorly fitted for its users in these dimensions. All the parameters are compared in Figure 7 to better understand the scenario.
| Dimensions and anthropometry | Gender | Match (%) | Lower mismatch (%) | Upper mismatch (%) | Total mismatch (%) |
| SH against PH | Male | 86.67 | 13.33 | 0 | 13.33 |
| female | 12.5 | 87.5 | 0 | 87.5 | |
| SW against HB | Male | 78.67 | 0 | 21.33 | 21.33 |
| female | 18.75 | 0 | 81.25 | 81.25 | |
| SD against BPL | Male | 92 | 8 | 0 | 8 |
| female | 86.25 | 13.75 | 0 | 13.75 | |
| BH against SSH | Male | 39 | 0 | 61 | 61 |
| female | 93.75 | 0 | 6.25 | 6.25 | |
| BW against HB | Male | 70.33 | - | - | 29.67 |
| female | 10 | - | - | 90 | |
| UEB against SCH | Male | 100 | - | - | 0 |
| female | 100 | - | - | 0 | |
| STH against SEH | Male | 66.33 | 0.33 | 33.33 | 33.67 |
| female | 72.5 | 1.25 | 26.25 | 27.5 | |
| STC against TT | Male | 0 | - | - | 100 |
| female | 0 | - | - | 100 | |
| UTH against TT, SEH, PH and AL | Male | 0 | 0 | 100 | 100 |
| female | 0 | 0 | 100 | 100 | |
| TL against BKL | Male | 0 | - | - | 100 |
| female | 2.5 | - | - | 97.5 | |
| TD against SEB, AL and EFL | Male | 0 | 100 | 0 | 100 |
| female | 0 | 100 | 0 | 100 |
The results for the second type of furniture (adjustable chair and non-adjustable table) in Table 7 show significantly lower mismatch levels than the first type of furniture for SH, SW, BW, STC, and UTH. For this particular furniture set, BW, UEB, and STH showed zero mismatches and needed no improvements. However, the outcomes for the table-related parameters remain subpar, indicating that furniture is still not well-suited for its users in these dimensions. Figure 8 compares all the parameters more explicitly.
| Dimensions and anthropometry | Gender | Match (%) | Lower mismatch (%) | Upper mismatch (%) | Total mismatch (%) |
| SH against PH | Male | 100 | 0 | 0 | 0 |
| female | 82.5 | 17.5 | 0 | 17.5 | |
| SW against HB | Male | 43 | 57 | 0 | 57 |
| female | 96.25 | 3.75 | 0 | 3.75 | |
| SD against BPL | Male | 49.67 | 50.33 | 0 | 50.33 |
| female | 38.75 | 61.25 | 0 | 61.25 | |
| BH against SSH | Male | 39 | 0 | 61 | 61 |
| female | 93.75 | 0 | 6.25 | 6.25 | |
| BW against HB | Male | 100 | - | - | 0 |
| female | 100 | - | - | 0 | |
| UEB against SCH | Male | 100 | - | - | 0 |
| female | 100 | - | - | 0 | |
| STH against SEH | Male | 100 | 0 | 0 | 0 |
| female | 100 | 0 | 0 | 0 | |
| STC against TT | Male | 99.33 | - | - | 0.67 |
| female | 100 | - | - | 0 | |
| UTH against TT, SEH, PH and AL | Male | 92 | 0 | 8 | 8 |
| female | 97.5 | 0 | 2.5 | 2.5 | |
| TL against BKL | Male | 0 | - | - | 100 |
| female | 0 | - | - | 100 | |
| TD against SEB, AL and EFL | Male | 0 | 100 | 0 | 100 |
| female | 0 | 100 | 0 | 100 |

4.4 ANOVA Test
A one-way ANOVA test was used to determine whether there were any statistically significant differences between the means of three or more independent groups. In this study, furniture dimensions were tested against anthropometric dimensions to determine if there were any significant differences. The level of significance () value was set at 5%, meaning that a result was considered statistically significant if the p-value was . The result was not statistically significant if the p-value was .
The ANOVA test resulted in a critical value (F-value) and a probable value (p-value). The F-value measures the variance between groups compared with the variance within the groups. The p-value is the probability of observing a result as extreme as that obtained, assuming that the null hypothesis is true. If the p-value was less than the value (5% in this case), the null hypothesis was rejected, and it was concluded that there was a statistically significant difference between the groups. If the p-value was greater than the value, the null hypothesis was not rejected, and it was concluded that there was no statistically significant difference between the groups.
In this study, ANOVA was used to determine whether there were any statistically significant differences in furniture dimensions and anthropometric measurements, both for males and females. The results showed that SH, SW, BH, UEB, STH, STC, and TL of furniture dimensions were rejected for non-adjustable chairs and tables, meaning there were statistically significant differences between the groups. In contrast, the SD and STH were accepted, indicating that there were statistically no significant differences between the groups (Table 8). For the adjustable chair non-adjustable table, we considered both the highest and lowest limits of SH, STH, and STC. If either the highest or lowest limit is accepted for males and females, we consider the parameter accepted. According to the ANOVA test for adjustable chairs with non-adjustable tables, only SH, SD, and STH dimensions were accepted. The rest of the dimensions, SW, BH, BW, UEB, STC, and TL were rejected (Table 9).
-
•
(null hypothesis): There is no effect or difference between the anthropometric measurements and existing furniture dimensions.
-
•
(alternative hypothesis): There is an effect or difference between the anthropometric measurements and existing furniture dimensions.
| Furniture Dimensions vs Anthropometric Dimensions | Gender | Value Type | Percentile | F -value | p - value | Decision | ||
| 5th | 50th | 95th | ||||||
| SH vs PH | Male | Observed | 422.65 | 444.96 | 466.49 | 0.71 | 0.447 | Accept |
| Expected | 443.79 | 457.2 | 470.61 | |||||
| Female | Observed | 395.17 | 414.58 | 438.4 | 7.83 | 0.049 | Reject | |
| Expected | 443.79 | 457.2 | 470.61 | |||||
| SW vs HB | Male | Observed | 335.31 | 350.23 | 365.34 | 11.19 | 0.029 | Reject |
| Expected | 376.98 | 393.7 | 410.42 | |||||
| Female | Observed | 353.28 | 367.24 | 379.45 | 4.51 | 0.101 | Accept | |
| Expected | 375.97 | 393.7 | 411.43 | |||||
| SD vs BPL | Male | Observed | 422.91 | 454.1 | 483.72 | 5.38 | 0.081 | Accept |
| Expected | 388.67 | 406.4 | 424.13 | |||||
| Female | Observed | 412.78 | 448.24 | 470.99 | 3.61 | 0.13 | Accept | |
| Expected | 388.67 | 406.4 | 424.13 | |||||
| BH vs SSH | Male | Observed | 488.6 | 512.03 | 539.42 | 173.83 | 0 | Reject |
| Expected | 294.62 | 304.8 | 314.98 | |||||
| Female | Observed | 467.05 | 488.85 | 509.16 | 184.73 | 0 | Reject | |
| Expected | 294.62 | 304.8 | 314.98 | |||||
| BW vs HB | Male | Observed | 335.31 | 350.23 | 365.34 | 0.28 | 0.625 | Accept |
| Expected | 346.88 | 355.6 | 364.32 | |||||
| Female | Observed | 353.28 | 367.24 | 379.45 | 1.48 | 0.29 | Accept | |
| Expected | 346.88 | 355.6 | 364.32 | |||||
| UEB vs SCH | Male | Observed | 495.19 | 511.42 | 528.01 | 70.93 | 0.001 | Reject |
| Expected | 392.32 | 406.4 | 420.48 | |||||
| Female | Observed | 475.12 | 493.8 | 510.12 | 44.56 | 0.003 | Reject | |
| Expected | 392.32 | 406.4 | 420.48 | |||||
| STH vs SEH | Male | Observed | 205.99 | 235.05 | 261.23 | 0.17 | 0.694 | Accept |
| Expected | 230.81 | 241.3 | 251.79 | |||||
| Female | Observed | 200.65 | 230.26 | 257.61 | 0.45 | 0.538 | Accept | |
| Expected | 230.81 | 241.3 | 251.79 | |||||
| STC vs TT | Male | Observed | 143.46 | 155.99 | 168.68 | 58.13 | 0.002 | Reject |
| Expected | 80.32 | 88.9 | 97.48 | |||||
| Female | Observed | 129.33 | 144.58 | 161.45 | 28.58 | 0.006 | Reject | |
| Expected | 80.32 | 88.9 | 97.48 | |||||
| TL vs BKL | Male | Observed | 505 | 522.23 | 536.1 | 13.8 | 0.021 | Reject |
| Expected | 473.68 | 482.6 | 491.52 | |||||
| Female | Observed | 489.25 | 509.05 | 529.86 | 4.37 | 0.105 | Accept | |
| Expected | 473.68 | 482.6 | 491.52 | |||||
| Furniture Dimensions vs Anthropometric Dimensions | Gender | Value Type | Percentile | F-value | p-value | Decision | ||
| 5th | 50th | 95th | ||||||
| SH (lowest limit) vs PH | Male | Observed | 422.65 | 444.96 | 466.49 | 0.527 | 0.508 | Accept |
| Expected | 410.21 | 431.8 | 453.39 | |||||
| Female | Observed | 395.17 | 414.58 | 438.4 | 0.796 | 0.423 | Accept | |
| Expected | 410.21 | 431.8 | 453.39 | |||||
| SH (highest limit) vs PH | Male | Observed | 422.65 | 444.96 | 466.49 | 19.804 | 0.011 | Reject |
| Expected | 506.73 | 533.4 | 560.07 | |||||
| Female | Observed | 395.17 | 414.58 | 438.4 | 35.008 | 0.004 | Reject | |
| Expected | 506.73 | 533.4 | 560.07 | |||||
| SW vs HB | Male | Observed | 335.31 | 350.23 | 365.34 | 45.836 | 0.002 | Reject |
| Expected | 434.34 | 457.2 | 480.06 | |||||
| Female | Observed | 353.28 | 367.24 | 379.45 | 35.436 | 0.004 | Reject | |
| Expected | 434.34 | 457.2 | 480.06 | |||||
| SD vs BPL | Male | Observed | 422.91 | 454.1 | 483.72 | 1.023 | 0.369 | Accept |
| Expected | 410.21 | 431.8 | 453.39 | |||||
| Female | Observed | 412.78 | 448.24 | 470.99 | 0.337 | 0.593 | Accept | |
| Expected | 410.21 | 431.8 | 453.39 | |||||
| BH vs SSH | Male | Observed | 488.6 | 512.03 | 539.42 | 148.401 | 0 | Reject |
| Expected | 289.56 | 304.8 | 320.04 | |||||
| Female | Observed | 467.05 | 488.85 | 509.16 | 149.574 | 0 | Reject | |
| Expected | 289.56 | 304.8 | 320.04 | |||||
| BW vs HB | Male | Observed | 335.31 | 350.23 | 365.34 | 9.223 | 0.039 | Reject |
| Expected | 374.02 | 393.7 | 413.39 | |||||
| Female | Observed | 353.28 | 367.24 | 379.45 | 3.926 | 0.119 | Accept | |
| Expected | 374.02 | 393.7 | 413.39 | |||||
| UEB vs SCH | Male | Observed | 495.19 | 511.42 | 528.01 | 48.612 | 0.002 | Reject |
| Expected | 386.08 | 406.4 | 426.72 | |||||
| Female | Observed | 475.12 | 493.8 | 510.12 | 31.274 | 0.005 | Reject | |
| Expected | 386.08 | 406.4 | 426.72 | |||||
| STH (lowest limit) vs SEH | Male | Observed | 205.99 | 235.05 | 261.23 | 0.101 | 0.766 | Accept |
| Expected | 217.17 | 228.6 | 240.03 | |||||
| Female | Observed | 200.65 | 230.26 | 257.61 | 0.003 | 0.962 | Accept | |
| Expected | 217.17 | 228.6 | 240.03 | |||||
| STH (highest limit) vs SEH | Male | Observed | 205.99 | 235.05 | 261.23 | 26.745 | 0.007 | Reject |
| Expected | 313.69 | 330.2 | 346.71 | |||||
| Female | Observed | 200.65 | 230.26 | 257.61 | 28.057 | 0.006 | Reject | |
| Expected | 313.69 | 330.2 | 346.71 | |||||
| STC (lowest limit) vs TT | Male | Observed | 143.46 | 155.99 | 168.68 | 61.03 | 0.001 | Reject |
| Expected | 90.49 | 95.25 | 100.01 | |||||
| Female | Observed | 129.33 | 144.58 | 161.45 | 26.571 | 0.007 | Reject | |
| Expected | 90.49 | 95.25 | 100.01 | |||||
| STC (highest limit) vs TT | Male | Observed | 143.46 | 155.99 | 168.68 | 19.526 | 0.012 | Reject |
| Expected | 187.01 | 196.85 | 206.69 | |||||
| Female | Observed | 129.33 | 144.58 | 161.45 | 22.616 | 0.009 | Reject | |
| Expected | 187.01 | 196.85 | 206.69 | |||||
| TL vs BKL | Male | Observed | 505 | 522.23 | 536.1 | 16.011 | 0.016 | Reject |
| Expected | 434.34 | 457.2 | 480.06 | |||||
| Female | Observed | 489.25 | 509.05 | 529.86 | 8.739 | 0.042 | Reject | |
| Expected | 434.34 | 457.2 | 480.06 | |||||
4.5 Proposed Dimensions of Furniture
Autodesk Fusion 360 software was used for designing furniture. Table 10 outlines the suggested dimensions for furniture, categorized into chairs and tables, based on principles that consider the anthropometric measurements of the participants. The proposed UTH for both table types is 645mm as shown in Figure 9. The SH is suggested to be between 400 mm and 450 mm for adjustable chairs, based on the 5th percentile of female popliteal height with 30 mm shoe clearance (see Figure 10(a)). The recommended SH is 430 mm for non-adjustable chairs, as shown in Figure 10(b). The proposed SW is 425 mm, based on the 95th percentile of female HB. The recommended SD is 385 mm, determined by the 5th percentile of female BPL. BH is suggested to be 350 mm, considering the 5th percentile of female SSH. The recommended BW is 390 mm, based on the 95th percentile of male SEB. UEB is proposed to be 465 mm, considering the minimum subscapular height of female participants. The suggested UTH is 645 mm, considering the 5th percentile of male SEH.


| Dimensions | For type-1 furniture set | For type-2 furniture set |
| SH | 430 | 400 - 450 |
| SW | 425 | 425 |
| SD | 385 | 385 |
| BH | 350 | 350 |
| BW | 390 | 390 |
| UEB | 465 | 465 |
| STH | 260 | 235 - 310 |
| STC | 200 | 95.25 - 200 |
| UTH | 645 | 645 |
For non-adjustable chairs and tables, Table 11 presents the mismatch percentages of the proposed furniture measurements. This is also shown graphically in Figure 11. The SH against PH showed 5% and 12.5% for males and females, respectively. The SW against HB showed zero mismatch for Male and only 1.25 lower mismatch for females. The SD against BPL showed 7.33% high mismatch and 0.33 % low mismatch for males, whereas 0% high mismatch and 1.25% low mismatch for females. It is necessary to reduce the high mismatch for females as much as possible while designing the chair’s SD. The BH, BW, UEB, and STC showed a 100% match for both males and females. It was not possible to design a single non-adjustable chair and table set for 100% match for both males and females. So, the dimensions were maintained to balance a reduced mismatch percentage for both males and females for STH and UTH dimensions. For adjustable chairs with tables, it was possible to match the 100% furniture dimensions for both males and females. SH and STH showed better results for both males and females due to the chair’s height adjustability. SW, SD, and UTH showed similar results to non-adjustable chairs with table furniture sets. Though adjustable chairs showed improved results in some scenarios, we considered both types of furniture to be financially feasible and avoided design complexity.
VDT should be placed according to recent studies; computer monitor placement should be based on the needs of the particular user and should be performed within a modest height range below eye level with a head tilt that is physiologically beneficial (Woo et al.,, 2016). OSHA (2008) suggests that monitors should be positioned 50–100 cm away from users while maintaining a viewing angle of – (Weidling and Jaschinski,, 2015).
Using a keyboard and mouse is a frequent task in a computer lab; it should be placed in the frequent or regular zone of the Barnes and Squires Work Envelope Model. This indicates that the keyboard and mouse should be placed within the 394 mm of table depth and 1194 mm of table length (Norman,, 2013).
Compared to the previous mismatch percentages in university furniture, the proposed dimensions exhibited reduced mismatches for both males and females. The suggested measurements are more compatible than the previous dimensions, leading to improved comfort levels and reduced risks of MSDs for users.
| Dimensions and anthropometry | Gender | Match (%) | Low mismatch (%) | High mismatch (%) | Total mismatch (%) |
| SH against PH | Male | 95 | 0 | 5 | 5 |
| female | 87.5 | 12.5 | 0 | 12.5 | |
| SW against HB | Male | 100 | 0 | 0 | 0 |
| female | 98.75 | 1.25 | 0 | 1.25 | |
| SD against BPL | Male | 92.33 | 0.33 | 7.33 | 7.67 |
| female | 98.75 | 1.25 | 0 | 1.25 | |
| BH against SSH | Male | 100 | 0 | 0 | 0 |
| female | 100 | 0 | 0 | 0 | |
| BW against HB | Male | 100 | - | - | 0 |
| female | 100 | - | - | 0 | |
| UEB against SCH | Male | 100 | - | - | 0 |
| female | 100 | - | - | 0 | |
| STH against SEH | Male | 87.5 | 8.75 | 3.75 | 12.5 |
| female | 87.5 | 8.75 | 3.75 | 12.5 | |
| STC against TT | Male | 100 | - | - | 0 |
| female | 100 | - | - | 0 | |
| UTH against TT, SEH, PH and AL | Male | 100 | 0 | 0 | 0 |
| female | 98.75 | 0 | 1.25 | 1.25 |

Table 12 presents the mismatch percentages of the proposed furniture measurements for adjustable chairs and tables. This is also shown in Figure 12. Compared to previous mismatch percentages in university furniture, the proposed dimensions exhibited reduced mismatches for both males and females. The suggested measurements are more compatible than the previous dimensions, leading to improved comfort levels and reduced risks of MSDs for users.
| Dimensions and anthropometry | Gender | Match (%) | Low mismatch (%) | High mismatch (%) | Total mismatch (%) |
| SH against PH | Male | 100 | 0 | 0 | 0 |
| female | 100 | 0 | 0 | 0 | |
| SW against HB | Male | 100 | 0 | 0 | 0 |
| female | 98.75 | 0 | 1.25 | 1.25 | |
| SD against BPL | Male | 92.33 | 0.33 | 7.33 | 7.67 |
| female | 98.75 | 1.25 | 0 | 1.25 | |
| BH against SSH | Male | 100 | 0 | 0 | 0 |
| female | 100 | 0 | 0 | 0 | |
| BW against HB | Male | 100 | - | - | 0 |
| female | 100 | - | - | 0 | |
| UEB against SCH | Male | 100 | - | - | 0 |
| female | 100 | - | - | 0 | |
| STH against SEH | Male | 100 | 0 | 0 | 0 |
| female | 100 | 0 | 0 | 0 | |
| STC against TT | Male | 100 | - | - | 0 |
| female | 100 | - | - | 0 | |
| UTH against TT, SEH, PH and AL | Male | 100 | 0 | 0 | 0 |
| female | 98.75 | 0 | 1.25 | 1.25 |

5 Conclusions
This research comprehensively analyzes anthropometric measurements and their correlation with furniture dimensions in university settings. It proposes new dimensions for non-adjustable chairs and tables, as well as adjustable chairs and non-adjustable tables, to better suit the needs of students. The ANOVA test results demonstrated significant differences between the proposed and existing furniture dimensions, indicating the potential benefits of new measurements regarding comfort and ergonomics. The proposed dimensions showed reduced mismatch percentages for both males and females compared with existing furniture, suggesting a higher level of compatibility. This could improve comfort levels and lower the risk of MSDs among students who use the furniture. These findings highlight the importance of considering anthropometric measurements when designing furniture for educational environments.
The limitations of this research include the reliance on a specific population (university students), the exclusion of certain anthropometric measurements, and the lack of consideration of other factors influencing furniture design (e.g., cultural preferences and environmental constraints). Additionally, the proposed furniture dimensions may not be universally applicable and require further validation in other settings or populations. Future research could explore the implementation of the proposed dimensions in real-world classroom settings and assess their long-term impacts on student comfort and well-being. Additionally, further studies should investigate the effects of different furniture designs on student performance and productivity in academic settings.
This study provides a comprehensive analysis of the ergonomic dimensions of furniture, particularly chairs and tables, in an educational setting. This highlights the importance of designing furniture that caters to anthropometric measurements of university students, ensuring comfort and promoting a healthy posture. By collecting anthropometric data and correlating them with existing furniture dimensions, this study identifies mismatches and provides recommendations for optimized furniture design. The findings have significant practical implications, as they can guide the development of furniture that promotes better ergonomics and reduces the risk of MSDs among students. Moreover, this study’s methodology and insights can be applied beyond the educational setting, informing furniture design for various industries and environments. This underscores the importance of considering cultural preferences and environmental constraints when designing furniture. This study contributes to the growing body of ergonomics research and can potentially improve the well-being and productivity of individuals in diverse settings.
References
- Abd Rahman et al., (2018) Abd Rahman, N. I., Md Dawal, S. Z., Yusoff, N., and Mohd Kamil, N. S. (2018). Anthropometric measurements among four Asian countries in designing sitting and standing workstations. Sādhanā, 43(1):10.
- Afzan et al., (2012) Afzan, Z. Z., Hadi, S. A., Shamsul, B. T., Zailina, H., Nada, I., and Rahmah, A. R. S. (2012). Mismatch between school furniture and anthropometric measures among primary school children in Mersing, Johor, Malaysia. In 2012 Southeast Asian Network of Ergonomics Societies Conference (SEANES), pages 1–5.
- Agha, (2010) Agha, S. R. (2010). School furniture match to students’ anthropometry in the Gaza Strip. Ergonomics, 53(3):344–354. Publisher: Taylor & Francis _eprint: https://doi.org/10.1080/00140130903398366.
- Altaboli et al., (2015) Altaboli, A., Belkhear, M., Bosenina, A., and Elfsei, N. (2015). Anthropometric Evaluation of the Design of the Classroom Desk for the Fourth and Fifth Grades of Benghazi Primary Schools. Procedia Manufacturing, 3:5655–5662.
- Bendix and Bloch, (1986) Bendix, T. and Bloch, I. (1986). How should a seated workplace with a tiltable chair be adjusted? Applied Ergonomics, 17(2):127–135.
- Boadi-Kusi et al., (2020) Boadi-Kusi, S. B., Abu, S. L., Acheampong, G. O., Adueming, P. O.-W., and Abu, E. K. (2020). Association between Poor Ergophthalmologic Practices and Computer Vision Syndrome among University Administrative Staff in Ghana. Journal of Environmental and Public Health, 2020:e7516357. Publisher: Hindawi.
- Castellucci et al., (2015) Castellucci, H. I., Arezes, P. M., and Molenbroek, J. F. M. (2015). Equations for defining the mismatch between students and school furniture: A systematic review. International Journal of Industrial Ergonomics, 48:117–126.
- Castellucci et al., (2010) Castellucci, H. I., Arezes, P. M., and Viviani, C. A. (2010). Mismatch between classroom furniture and anthropometric measures in Chilean schools. Applied Ergonomics, 41(4):563–568.
- Dessie et al., (2018) Dessie, A., Adane, F., Nega, A., Wami, S. D., and Chercos, D. H. (2018). Computer Vision Syndrome and Associated Factors among Computer Users in Debre Tabor Town, Northwest Ethiopia. Journal of Environmental and Public Health, 2018:e4107590. Publisher: Hindawi.
- Dianat et al., (2013) Dianat, I., Karimi, M. A., Asl Hashemi, A., and Bahrampour, S. (2013). Classroom furniture and anthropometric characteristics of Iranian high school students: Proposed dimensions based on anthropometric data. Applied Ergonomics, 44(1):101–108.
- Evans et al., (1988) Evans, W. A., Courtney, A. J., and Fok, K. F. (1988). The design of school furniture for Hong Kong schoolchildren: An anthropometric case study. Applied Ergonomics, 19(2):122–134.
- Fazi et al., (2019) Fazi, H. B. M., Mohamed, N. M. Z. B. N., and Basri, A. Q. B. (2019). Risks assessment at automotive manufacturing company and ergonomic working condition. IOP Conference Series: Materials Science and Engineering, 469(1):012106. Publisher: IOP Publishing.
- García-Acosta and Lange-Morales, (2007) García-Acosta, G. and Lange-Morales, K. (2007). Definition of sizes for the design of school furniture for Bogotá schools based on anthropometric criteria. Ergonomics, 50(10):1626–1642. Publisher: Taylor & Francis _eprint: https://doi.org/10.1080/00140130701587541.
- Gouvali and Boudolos, (2006) Gouvali, M. K. and Boudolos, K. (2006). Match between school furniture dimensions and children’s anthropometry. Applied Ergonomics, 37(6):765–773.
- Hoque et al., (2014) Hoque, A., Parvez, M., Halder, P., and Szecsi, T. (2014). Ergonomic design of classroom furniture for university students of Bangladesh. Journal of Industrial and Production Engineering, 31(5):239–252. Publisher: Taylor & Francis _eprint: https://doi.org/10.1080/21681015.2014.940069.
- Hossain and Ahmed, (2010) Hossain, M. S. J. and Ahmed, M. T. (2010). An anthropometric study to determine the mismatches of furniture used by Bangladeshi university students, a case study: Bangladesh University of Engineering and Technology (BUET). Case study report, BUET Department of IPE, Bangladesh.
- International Organization for Standardization, (2017) International Organization for Standardization (2017). Iso 7250-1:2017 - basic human body measurements for technological design – part 1: Body measurement definitions and landmarks. International Standard. ISO 7250-1:2017.
- Jahin and Saha, (2024) Jahin, M. A. and Saha, A. K. (2024). Anthropometric Data of KUET students. Publisher: Mendeley Data.
- JFM et al., (2003) JFM, M., YMT, K.-R., and CJ, S. (2003). Revision of the design of a standard for the dimensions of school furniture. Ergonomics, 46(7):681–694. Publisher: Taylor & Francis _eprint: https://doi.org/10.1080/0014013031000085635.
- Joshi et al., (2015) Joshi, P., Karki, I., and Sharma, P. (2015). Computer Workstation Ergonomics: Knowledge Testing of State Agricultural Universities (SAU) Students. Journal of Human Ecology, 49(3):335–339. Publisher: Routledge _eprint: https://doi.org/10.1080/09709274.2015.11906853.
- Kahya, (2019) Kahya, E. (2019). Mismatch between classroom furniture and anthropometric measures of university students. International Journal of Industrial Ergonomics, 74:102864.
- Kibria, (2019) Kibria, G. (2019). Ergonomic Computer Workstation Design for University Teachers in Bangladesh. Jordan Journal of Mechanical and Industrial Engineering, 13(2).
- Kopardekar, (1996) Kopardekar, P. (1996). A Review of: “A guide to the Ergonomics of Manufacturing”, by MARTIN HELANDER. Taylor & Francis, London (1995), pp. xi + 210, £14·95, ISBN 07484-0122-9. Ergonomics, 39(5):808–809. Publisher: Taylor & Francis _eprint: https://doi.org/10.1080/00140139608964501.
- Kroemer et al., (1997) Kroemer, K. H. E., Kroemer, H. J., and Kroemer-Elbert, K. E. (1997). Engineering Physiology: Bases of Human Factors/Ergonomics. John Wiley & Sons. Google-Books-ID: gnvftWcCc0sC.
- Laeser et al., (1998) Laeser, K. L., Maxwell, L. E., and Hedge, A. (1998). The Effect of Computer Workstation Design on Student Posture. Journal of Research on Computing in Education, 31(2):173–188. Publisher: Routledge _eprint: https://doi.org/10.1080/08886504.1998.10782249.
- Magnusson and Pope, (1998) Magnusson, M. L. and Pope, M. H. (1998). A REVIEW OF THE BIOMECHANICS AND EPIDEMIOLOGY OF WORKING POSTURES (IT ISN’T ALWAYS VIBRATION WHICH IS TO BLAME!). Journal of Sound and Vibration, 215(4):965–976.
- Milanese and Grimmer, (2004) Milanese, S. and Grimmer, K. (2004). School furniture and the user population: an anthropometric perspective. Ergonomics, 47(4):416–426. Publisher: Taylor & Francis _eprint: https://doi.org/10.1080/0014013032000157841.
- Moradi et al., (2017) Moradi, M., Poursadeghiyan, M., Khammar, A., Hami, M., Darsnj, A., and Yarmohammadi, H. (2017). REBA method for the ergonomic risk assessment of auto mechanics postural stress caused by working conditions in Kermanshah (Iran). Annals of Tropical Medicine and Public Health.
- Mowatt et al., (2018) Mowatt, L., Gordon, C., Santosh, A. B. R., and Jones, T. (2018). Computer vision syndrome and ergonomic practices among undergraduate university students. International Journal of Clinical Practice, 72(1):e13035. _eprint: https://onlinelibrary.wiley.com/doi/pdf/10.1111/ijcp.13035.
- Norman, (2013) Norman, L. (2013). Integrated approach to the analysis of eighteenth-century horns. PhD thesis, The University of Edinburgh. Accepted: 2014-05-27T14:11:04Z Publisher: The University of Edinburgh.
- Oborne, (1995) Oborne, D. J. (1995). Ergonomics at Work: Human Factors in Design and Development, 3rd Edition. Wiley, Chichester ; New York, 3rd edition edition.
- Occhipinti et al., (1993) Occhipinti, E., Colombini, D., Molteni, G., and Grieco, A. (1993). Criteria for the ergonomic evaluation of work chairs. La Medicina del lavoro, 84(4):274–285.
- Panagiotopoulou et al., (2004) Panagiotopoulou, G., Christoulas, K., Papanckolaou, A., and Mandroukas, K. (2004). Classroom furniture dimensions and anthropometric measures in primary school. Applied Ergonomics, 35(2):121–128.
- Parcells et al., (1999) Parcells, C., Stommel, M., and Hubbard, R. P. (1999). Mismatch of classroom furniture and student body dimensions: Empirical findings and health implications. Journal of Adolescent Health, 24(4):265–273.
- Parvez et al., (2018) Parvez, M. S., Parvin, F., Shahriar, M. M., and Kibria, G. (2018). Design of Ergonomically Fit Classroom Furniture for Primary Schools of Bangladesh. Journal of Engineering, 2018:e3543610. Publisher: Hindawi.
- Poulakakis and Marmaras, (1998) Poulakakis, G. and Marmaras, N. (1998). A model for the ergonomic design of office. In Proceedings of the Ergonomics Conference in Cape Town: Global Ergonomics, pages 500–504. Elsevier Ltd.
- Py Szeto et al., (2014) Py Szeto, G., Tsui, M. M. S., Sze, W. W. Y., Chan, I. S. T., Chung, C. C. F., and Lee, F. W. K. (2014). Issues about home computer workstations and primary school children in Hong Kong: a pilot study. Work (Reading, Mass.), 48(4):485–493.
- Pérez-Gosende, (2017) Pérez-Gosende, P. (2017). Anthropometry-based approach for side-mounted desktop chairs design evaluation for university students in Ecuador. In 2017 IEEE Second Ecuador Technical Chapters Meeting (ETCM), pages 1–5.
- Sanders and McCormick, (1993) Sanders, M. S. and McCormick, E. J. (1993). Human factors in engineering and design. McGraw-Hill, New York, 7th ed edition. OCLC: 25245564.
- Savanur et al., (2007) Savanur, C. S., Altekar, C. R., and De, A. (2007). Lack of conformity between Indian classroom furniture and student dimensions: proposed future seat/table dimensions. Ergonomics, 50(10):1612–1625. Publisher: Taylor & Francis _eprint: https://doi.org/10.1080/00140130701587350.
- Self et al., (2019) Self, J. A., Evans, M., Jun, T., and Southee, D. (2019). Interdisciplinary: challenges and opportunities for design education. International Journal of Technology and Design Education, 29(4):843–876.
- Shohel Parvez et al., (2022) Shohel Parvez, M., Tasnim, N., Talapatra, S., Ruhani, A., and Hoque, A. S. M. M. (2022). Assessment of Musculoskeletal Problems among Bangladeshi University Students in Relation to Classroom and Library Furniture. Journal of The Institution of Engineers (India): Series C, 103(3):279–292.
- Taifa and Desai, (2017) Taifa, I. W. and Desai, D. A. (2017). Anthropometric measurements for ergonomic design of students’ furniture in India. Engineering Science and Technology, an International Journal, 20(1):232–239.
- Thariq, (2010) Thariq, M. M. (2010). Designing chairs with mounted desktop for university students: Ergonomics and comfort. International Journal of Industrial Ergonomics.
- Weidling and Jaschinski, (2015) Weidling, P. and Jaschinski, W. (2015). The vertical monitor position for presbyopic computer users with progressive lenses: how to reach clear vision and comfortable head posture. Ergonomics, 58(11):1813–1829.
- Williams and Jacobs, (2002) Williams, C. D. and Jacobs, K. (2002). The effectiveness of a home-based ergonomics intervention on the proper use of computers by middle school children. Work (Reading, Mass.), 18(3):261–268.
- Woo et al., (2016) Woo, E. H. C., White, P., and Lai, C. W. K. (2016). Ergonomics standards and guidelines for computer workstation design and the impact on users’ health – a review. Ergonomics, 59(3):464–475. Publisher: Taylor & Francis _eprint: https://doi.org/10.1080/00140139.2015.1076528.
- Zayed et al., (2021) Zayed, H. A. M., Saied, S. M., Younis, E. A., and Atlam, S. A. (2021). Digital eye strain: prevalence and associated factors among information technology professionals, Egypt. Environmental Science and Pollution Research, 28(20):25187–25195.
Appendix A NMQ Survey Questionnaire Format
Ergonomic Assessment
| Serial no: |
| Age: |
| Gender: |
| Date of Assessment: |
Question: Do you experience pain or discomfort in any of the following body parts when using your computer? If “yes,” please mention which part of your body.
(a) Neck
(b) Shoulders/upper arm
(c) Upper back
(d) Lower back
(e) Elbow/forearm
(f) Wrist/Hand
(g) Hips/Buttocks/Thighs
(h) Knees and legs
(i) Feet/Ankles
Please mention in which form is affected.
-
(i)
Constantly (most time of the day)
-
(ii)
Frequently (more than four times a month)
-
(iii)
Occasionally (two to four times a month)
-
(iv)
Never