The TELPERION survey for extended emission regions around AGN: a strongly-interacting and merging galaxy sample
Abstract
We present the results of a search for Extended Emission-Line Regions (EELRs) ionized by extant or recently-faded active galactic nuclei (AGN), using [O III] narrowband imaging and spectroscopic followup. The sample includes 198 galaxies in 92 strongly interacting or merging galaxy systems in the range . Among these, three have EELRs extended beyond 10 kpc in projection from the nucleus detected in previous studies. We identify a single new distant emission region, projected 35 kpc from UGC 5941. Our optical spectrum does not detect He II, but its strong-line ratios put this in the same class as securely-characterized EELR clouds. The nucleus of UGC 5941 is dominated by recent star formation, preventing detection of any weak ongoing AGN. Overall counts of distant EELRs in this and the previous TELPERION samples give incidence 2–5% depending on galaxy and AGN selection, 20-50 times higher than the Galaxy Zoo EELR survey with its higher surface-brightness threshold and much larger input sample. AGN in interacting and merging systems have an increased detection rate %, while none are detected around noninteracting AGN. Some of these AGN are at luminosity low enough to require additional X-ray or far-infrared information to tell whether the EELR ionization level suggests long-term fading.
keywords:
galaxies: active – galaxies: interactions – galaxies: Seyfert1 Introduction
Among active galactic nuclei (AGN), most types are characterised by strong emission lines, whose ionization level distinguishes their spectra from those of objects powered by star formation. In addition to the high-density broad-line region and surrounding narrow-line region, some AGN also have extended emission-line regions (EELRs) extending for kiloparsecs or tens of kiloparsecs from the nucleus itself.
Objects described as EELRs in the literature are ionized directly or indirectly by AGN, as distinct from other kinds of extended emission-line regions such as starburst winds, widespread star formation, or shocks occurring in merging galaxies. EELRs may be photoionized by radiation from the AGN, or ionized by the effects of jets or broader outflows from radio-loud AGN, generally including shocks and associated with emission-line Doppler widths km s-1 (Stockton, Fu, & Canalizo, 2006).
Photoionized EELRs offer the opportunity to learn about the AGN’s ionizing radiation in directions or at times we cannot sample directly. They often occur in pairs, triangular in projection and pointing to the AGN (ionization cones, reviewed by Wilson 1996), which furnish strong evidence in favor of a broad picture of circumnuclear obscuration producing much of the difference between type 1 and 2 AGN (depending on whether the broad-line region is obscured or not along our line of sight). A second facet of photoionized EELRs was exemplified by the discovery of Hanny’s Voorwerp (Lintott et al., 2009) during the initial Galaxy Zoo project (Lintott et al., 2008), where the ionizing luminosity needed to match the EELR’s luminosity and ionization level far exceed what is seen from the host galaxy’s nucleus directly. This provides the possibility of sampling the AGN luminosity at times up to years earlier than the direct view, giving the promise of retrieving the accretion history of supermassive black holes over timescales not otherwise possible on human timescales. The characterization of Hanny’s Voorwerp led to a followup search by Galaxy Zoo volunteers, based on the distinctive colour of low-redshift [O III] emission regions in colour-composite renditions of Sloan Digital Sky Survey (SDSS) images. This project confirmed another 19 distant EELRs, most found for the first time, and allowed a rough estimate (0.2–2 years) of the duration of luminous accretion events for these AGN (Keel et al., 2012). About 0.12% of the AGN examined were found to show distant EELRs to surface-brightness levels apparent in SDSS data.
To complement the Galaxy Zoo searches, we have carried out a phased survey called TELPERION111An acronym for Tracing Emission Lines Probing Extended Regions Ionized by Once-active Nuclei, and recalling a past age of vanished brilliance for readers of J.R.R. Tolkien’s stories of the First Age of Middle-Earth.. This uses narrowband imaging of several hundred galaxies in a convenient redshift range to seek emission clouds at lower surface brightness than was detectable in the original SDSS images, out to projected distances in principle as much as 250 kpc from the AGN hosts (so, for photoionized EELRs, we could detect clouds tracing the luminosity of the AGN as much as years before the directly-observed epoch). TELPERION includes samples of galaxies which are complete in various senses. The initial phase of the survey (Knese et al., 2020) was comprised of Seyfert galaxies with known H I properties, so it was clear which systems had enough neutral gas to produce detectable [O III] emission. This phase uncovered one distant EELR, Mkn 1, out of 26 AGN hosts. A second survey phase (Keel et al., 2022) targeted 111 luminosity-selected AGN hosts (and any companions), finding distant EELRs in NGC 235 and NGC 5514. This phase also included merging galaxies from an enhanced version of the “Toomre sequence" of ongoing mergers in our redshift range, recovering the EELR previously found in NGC 7252 by Schweizer et al. (2013).
Our primary interest in these surveys is identification of EELRs extending beyond 10 kpc in projection from the AGN, which we term distant EELRs. Compared to regions smaller and closer to the galaxy nuclei, these are less likely to consist of the ordinary ISM of the host galaxy, allow us to probe longer light-travel-time delays, and are easier to detect outside the bright parts of host galaxies for better completeness of our samples. We also note that the great majority of distant EELRs in both the Galaxy Zoo sample and TELPERION are found around radio-quiet AGN (simply because most AGN are not radio-loud objects with kpc-scale jets). Radio-loud objects have EELRs that often reflect outflow associated with the jets or shocks as the jets encounter the host galaxy ISM, rather than the more kinematically-quiescent AGN-photoionized clouds we focus on.
A recurring pattern among the distant EELRs found in both the Galaxy Zoo and TELPERION surveys has been that almost all are found in interacting or merging galaxies, possibly because tidal features often include neutral gas that can be observed when ionized by escaping UV continuum from the AGN (and such features often depart from the host galaxy’s plane, reducing the absorption along the path of the ionizing photons). We present here results of a further phase of the TELPERION survey specifically aimed at interacting and merging galaxies, and preliminary statistics of the occurrence of distant EELRs among all four sample phases of the TELPERION survey.
2 Sample Selection and Observations
2.1 Sample selection
To further examine the connection between distant EELRs and strong interactions or mergers, we selected galaxies from the Darg et al. (2010) sample, of galaxies having been flagged as mergers in the Galaxy Zoo project (Lintott et al., 2008), which classified galaxies from data release 7 (DR7) of the SDSS (Abazajian et al., 2009). This sample includes ongoing mergers, tidally distorted interacting systems, and a small admixture of projected pairs at substantially different distances (Keel et al., 2013). As in the previous TELPERION phases, we used off-the-shelf narrowband filters to detect [O III] -Å emission (hereinafter simply [O III]) within the range , a range which includes 217 systems from the Darg et al. (2010) catalog. We did not require the galaxy nucleus to be classified as an AGN from optical spectra, but we did omit galaxies with central starbursts as judged from SDSS spectra, to avoid emission from outlying star-forming regions or starburst winds, not associated with an AGN. Following Stasińska & Leitherer (1996), Fernandes, Leão, & Lacerda (2003), and Bergvall et al. (2016), we omitted galaxy pairs where a non-AGN nuclear spectrum has H equivalent width EW(H Å. This criterion helps make our EELR survey more efficient, though we cannot apply it completely, since some pairs have only a single SDSS spectrum available, and some galaxies’ spectra represent off-nuclear knots rather than their nuclei. This left 95 systems, most with two members. Of these, three systems are found to be projections of unrelated and undistorted galaxies based on redshifts in later SDSS data releases, so we omit these from our analysis: MCG +06-20-035, SDSS J114328.50+094947.2, and SDS J140531.65-012147.9. IC 3935 includes a background system, but the foreground disc is asymmetric across a wide radial range so we include it as the aftermath of a strong interaction or minor merger. Our sample then includes 92 strongly-interacting and merging systems containing 198 distinct galaxies (although what counts as “distinct" in an ongoing merger is sometimes a matter of individual judgment).
The Darg et al. (2010) sample of interacting and merging galaxies was selected using classifications of galaxies in SDSS DR7. One system observed in our sample, NGC 5541 was included as a photometric object (SDSS J141631.80+393520.5) in SDSS DR7 but not DR9 (Ahn et al., 2012) and later, apparently because of sky-subtraction issues due to the bright star HD 125111 projected 9′ away. A coordinate-based match cross-match of sample objects between DR7 and DR9 would miss this one.
To help understand the content of the sample further, we classified the nuclear spectra of the galaxies based on SDSS spectra and our previous observations (Keel et al., 1985), for simplicity using the [O III]/H-[N II]/H BPT diagram (Baldwin et al. 1981, Kewley et al. 2001, Kauffmann et al. 2003) for emission-line spectra. The pipeline classifications for AGN listed in the SDSS database use a linear approximation to the Seyfert+LINER lower bound which falls above the maximum-starburst curves from Kewley et al. (2001), and Kauffmann et al. (2003) everywhere, so we work from the SDSS line fluxes when model-corrected for underlying stellar absorption (and apply color-based corrections for H and H absorption for our own data). From emission lines, we find 68 star-forming objects, 32 LINERS, 11 Seyfert galaxies including objects near the Seyfert/LINER boundary, and 3 composite nuclei near the AGN lower boundary. Four nuclei show absorption spectra with strong Balmer lines, indicating post-starburst systems. We find 37 quiescent systems, with the equivalent width of H emission less than 3 Å and no other emission detected except in some cases [O II]. No optical spectra were available for 43 of the 198 galaxy nuclei in this sample.
2.2 Imaging observations
Our imaging procedures followed those in the previous phases of the TELPERION survey (Knese et al. 2020, Keel et al. 2022). We searched for extended and distant [O III] features using a filter with center wavelength 510 nm and nominal half-transmission points at 505 and 515 nm (denoted F510), which should shift blueward in a converging beam by no more than 4 Å in our telescopes. Our sample includes galaxies where the stronger [O III] emission line is observed within this range (). Our narrowband images were obtained with the remotely-operated 1-m telescopes of the SARA observatory (Keel et al., 2017) at Kitt Peak (KP, 0.44″per pixel, field of view 14.5′ square) and La Palma (the Jacobus Kapteyn Telescope, JKT; 0.34″per pixel, field of view 11.6′ square). While explicit continuum subtraction often has large residuals in star images due to PSF mismatch, we did obtain images for comparison, with one of those telescopes or the 0.6m SARA instrument at Cerro Tololo (CT). Our survey F510 images typically reach a surface brightness limit erg cm-2 s-1 arcsec-2 in the line. The continuum images were exposed to have at least twice the signal-to-noise ratio of the narrowband data. As noted with the previous TELPERION samples, use of [O III] for such a survey helps suppress detections not only of star-forming regions relative to AGN-ionized gas, but other emission clouds not ionized by AGN, including large-scale shocks in merging systems and low-ionization material in the cores of galaxy clusters, in which the strongest optical emission lines are typically H and [N II].
The imaging observations are documented in Table 1, with observing site and UTC date for each observation. When poor image quality led us to repeat an observation, only the higher-quality one is listed. Images were examined with various levels of Gaussian and median smoothing in search of diffuse [O III] structures. Potential diffuse [O III] clouds were reobserved for confirmation before performing spectroscopic followup, to reduce time spent on false positives near the detection threshold (effectively allowing the survey to reach a deeper limiting surface brightness).
For the previously unknown distant [O III] cloud near UGC 5941, we obtained a total of 13 one-hour exposures in F510 to examine its structure, at both KP and the JKT.
Images were acquired for this project over the time frame from January 2017 to May 2022. It was interrupted not only by shutdowns associated with unavailability of onsite support personnel during the CoViD-19 pandemic lockdowns at each site, but the Cumbre Vieja volcanic eruption on the island of La Palma (September 2021 - January 2022) and the aftermath of the Contreras wildfire at Kitt Peak (June 2022 - January 2023).
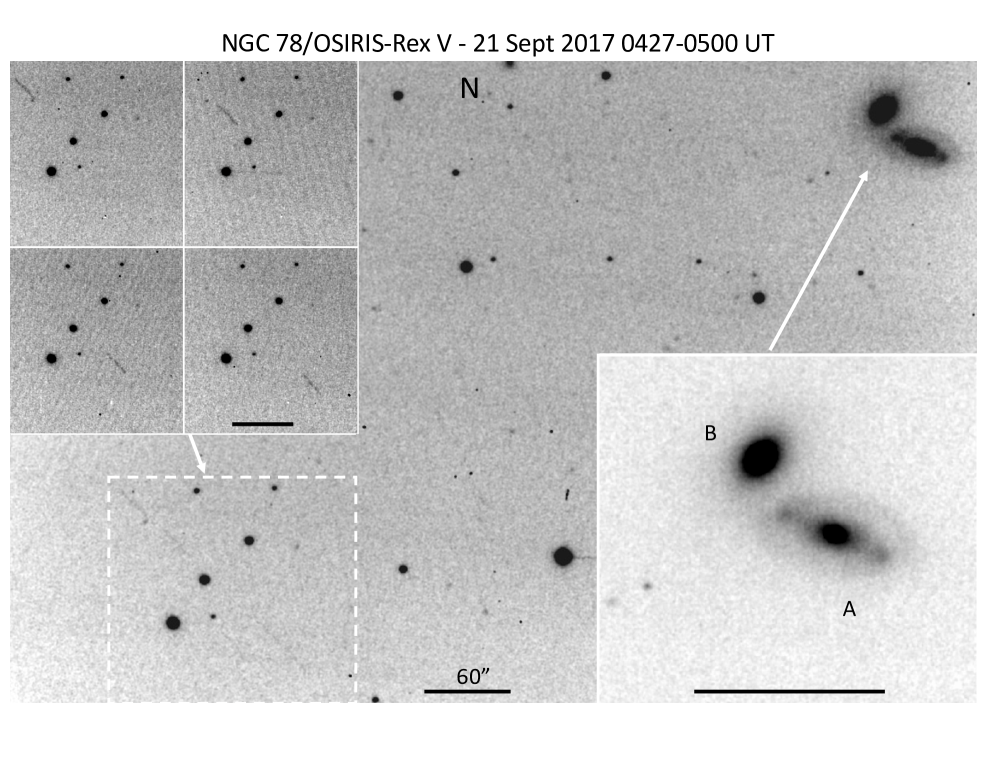
These images were not as confused by asteroid trails as the previous TELPERION phase. However, attention to the order of targets during one night allowed us to include the OSIRIS-REx asteroid probe in the image of the NGC 78 system during an Earth swingby. We illustrate this, along with the continuum image of this galaxy pair, in Fig. 1. Coordinates and spacecraft range were calculated using the JPL Horizons ephemeris service222https://ssd.jpl.nasa.gov/horizons/app.html#/ .
2.3 Spectroscopic followup
The single candidate EELR newly found in this survey, near UGC 5941, was observed spectroscopically using the SCORPIO-2 multimode instrument (Afanasiev & Moiseev, 2011) on the 6-meter telescope (Bol’shoi Teleskop Azimutal’nyi, BTA) at the Special Astrophysical Observatory of the Russian Academy of Sciences. The SCORPIO-2 instrument was operated in its long-slit spectroscopic mode, employing a 1″ slit with a usable length of 394″, oriented in position angle 39∘ through the nucleus of UGC 5941. We obtained a 4500s exposure on 2023 March 15 UTC with the E2V 261-84 CCD detector (Afanasieva et al., 2023). The spectrum covered the range 3930–8560 Å with 1.21 Å pixel sampling (reciprocal dispersion). As well as the potential EELR, the spectrum records fainter emission from a region just to the SW of the galaxy disc. Since the [S II] lines overlap the spectral range affected by telluric B-band absorption, a correction was applied based on the spectrum of a reference star. The sensitivity of this spectrum detects a larger extent to the cloud than even our deepest stacked direct image, showing [O III] for 9″along the slit and two emission peaks.
We derive error and upper-limit estimates by adding fictitious lines at random wavelengths while simultaneously fitting multiple Gaussian profiles in each wavelength range (using the IRAF splot task), so these estimates include the effects of line width as derived from the strong lines and nonlinear effects of the fitting algorithm.
We also incorporate long-slit data from SCORPIO-2 in three slit positions covering the emission filaments in NGC 5278/9, as described in Keel et al. (2019).
2.4 Additional narrowband images
We make use of further narrowband [O III] images of two previously-detected EELR systems, Mkn 266 and NGC 5278/9. On- and off-band images of NGC 5278/9 for [O III] were obtained with the MaNGaL tunable-filter system (Moiseev, Perepelitsyn, & Oparin, 2020) at the 2.5 telescope of the Caucasus Mountain Observatory333http://lnfm1.sai.msu.ru/kgo/main.php (Shatsky et al. 2020, Potanin et al. 2017), with 2400s exposures for each. A scaled difference image was used to isolate pure [O III] emission. For Mkn 266, we examine an [O III] image produced by line fits through a data cube obtained with SCORPIO-2 in its Fabry-Perot scanning mode (Moiseev, 2021), with total exposure 3600s.
| SDSS name | V date | V site | F510 date | F510 site | Other ID | Notes | |
|---|---|---|---|---|---|---|---|
| SDSS J001755.39+002006.8 | 0.018 | 2017-11-16 | CT | 2022-01-20 | KP | MCG +00-01-059 | |
| SDSS J002027.50+005000.8 | 0.018 | 2017-09-20 | JKT | 2021-10-06 | KP | NGC 78 | |
| SDSS J014503.30-001805.4 | 0.018 | 2017-01-17 | JKT | 2020-12-21 | KP | UGC 1225 | |
| SDSS J020920.84-100759.1 | 0.013 | 2017-09-20 | CT | 2017-12-20 | KP | NGC 833 | |
| SDSS J024213.22-082934.9 | 0.024 | 2017-09-28 | JKT | 2020-01-01 | KP | KUG 0239-087 | |
| SDSS J032045.32-010314.2 | 0.021 | 2017-10-31 | CT | 2018-01-17 | KP | UGC 2691 | |
| SDSS J075121.01+501409.8 | 0.024 | 2017-11-13 | KP | 2021-12-08 | KP | UGC 4052 | |
| SDSS J080724.81+065147.5 | 0.015 | 2017-11-20 | CT | 2021-02-10 | KP | ||
| SDSS J080945.62+255253.2 | 0.025 | 2018-03-13 | JKT | 2018-03-12 | KP | IC 2229 | |
| SDSS J081312.31+402510.3 | 0.026 | 2018-03-15 | JKT | 2018-12-13 | KP | ||
| SDSS J082724.89+233402.1 | 0.019 | 2018-03-15 | JKT | 2019-01-14 | KP | ||
| SDSS J083031.67+181221.9 | 0.027 | 2017-11-20 | CT | 2022-03-31 | KP | ||
| SDSS J083824.01+254516.2 | 0.018 | 2019-03-06 | JKT | 2019-03-04 | KP | NGC 2623 | |
| SDSS J084740.18+255336.6 | 0.022 | 2018-01-17 | KP | 2022-04-05 | KP | UGC 4597 | |
| SDSS J084924.19+190427.4 | 0.013 | 2018-05-15 | JKT | 2020-12-21 | KP | NGC 2673 | |
| SDSS J085601.86+421624.6 | 0.028 | 2018-11-15 | JKT | 2020-02-12 | KP | MCG +07-19-002 | |
| SDSS J090159.93+352031.9 | 0.026 | 2019-12-17 | JKT | 2020-02-12 | KP | ||
| SDSS J090554.49+471045.5 | 0.027 | 2021-03-17 | JKT | 2021-03-17 | JKT | UGC 4765 | |
| SDSS J091029.79+203344.3 | 0.028 | 2019-12-27 | JKT | 2020-12-14 | JKT | ||
| SDSS J091646.06+454849.6 | 0.026 | 2019-02-04 | JKT | 2020-12-21 | KP | MCG +08-17-066 | |
| SDSS J092229.43+502548.4 | 0.027 | 2019-11-25 | JKT | 2021-02-10 | KP | MCG +08-17-087 | |
| SDSS J092540.12+221920.8 | 0.025 | 2019-11-26 | JKT | 2021-02-16 | KP | CGCG 121-087 | |
| SDSS J093456.42+384441.9 | 0.015 | 2019-11-26 | JKT | 2021-03-10 | KP | ||
| SDSS J093634.03+232627.0 | 0.028 | 2021-03-17 | JKT | 2021-03-17 | JKT | CGCG 122-029 | |
| SDSS J093939.93-001407.0 | 0.016 | 2021-03-12 | JKT | 2020-02-24 | KP | NGC 2951 | |
| SDSS J094751.71+084950.8 | 0.018 | 2019-11-26 | JKT | 2021-03-10 | KP | MCG +02-25-036 | |
| SDSS J095648.41+530853.8 | 0.025 | 2018-03-13 | JKT | 2019-04-24 | KP | VV 740 | |
| SDSS J100358.83+221633.8 | 0.020 | 2018-05-15 | JKT | 2020-12-21 | KP | UGC 5420 | |
| SDSS J100549.83+003800.0 | 0.021 | 2019-12-27 | JKT | 2020-01-06 | KP | IC 590 | |
| SDSS J102424.36+280143.3 | 0.021 | 2019-12-27 | JKT | 2020-02-12 | KP | NGC 3232 | |
| SDSS J102743.61+011138.2 | 0.022 | 2019-12-27 | JKT | 2021-02-16 | KP | ||
| SDSS J103635.16+374228.6 | 0.023 | 2019-12-27 | JKT | 2021-03-17 | JKT | ||
| SDSS J104503.59+002603.6 | 0.026 | 2019-12-27 | JKT | 2020-12-14 | JKT | ||
| SDSS J104646.71+030942.8 | 0.022 | 2019-12-27 | JKT | 2022-04-04 | KP | ||
| SDSS J105021.59+412750.5 | 0.024 | 2018-03-13 | JKT | 2019-05-04 | KP | UGC 5941 | New [O III] cloud |
| SDSS J105143.63+510119.7 | 0.025 | 2019-12-27 | JKT | 2020-02-24 | KP | NGC 3406 | |
| SDSS J105237.39+080024.1 | 0.022 | 2021-03-12 | JKT | 2022-01-10 | KP | ALFALFA 5-358 | |
| SDSS J105738.52+410317.6 | 0.025 | 2020-01-14 | JKT | 2021-12-08 | KP | ||
| SDSS J111809.78+302424.3 | 0.026 | 2021-03-12 | JKT | 2021-02-10 | KP | UGC 6314 | |
| SDSS J113218.80+555540.8 | 0.021 | 2020-01-14 | JKT | 2021-12-09 | KP | ||
| SDSS J113240.25+525701.4 | 0.026 | 2018-05-15 | JKT | 2018-12-13 | KP | Mkn 176 | |
| SDSS J114044.47+222646.9 | 0.024 | 2018-01-17 | KP | 2022-03-31 | KP | NGC 3808 | |
| SDSS J114222.33+084611.5 | 0.022 | 2018-05-15 | JKT | 2022-04-05 | KP | IC 720 | |
| SDSS J115805.22+275244.0 | 0.011 | 2021-03-12 | JKT | 2021-02-10 | KP | NGC 4004 | |
| SDSS J120445.19+311132.9 | 0.025 | 2021-03-12 | JKT | 2021-03-10 | KP | ||
| SDSS J120607.51+325340.9 | 0.027 | 2020-01-14 | JKT | 2020-02-24 | KP | IC 2993 | |
| SDSS J121155.07+403918.2 | 0.022 | 2021-03-12 | JKT | 2022-02-03 | KP | ||
| SDSS J121535.84+281039.4 | 0.022 | 2018-03-13 | JKT | 2022-04-05 | KP | NGC 4211 | |
| SDSS J121917.19+120058.2 | 0.026 | 2021-04-05 | CT | 2022-02-28 | KP | IC 3147 | |
| SDSS J122257.72+103253.9 | 0.026 | 2020-03-16 | CT | 2021-02-10 | KP | NGC 4320 | |
| SDSS J122814.15+442711.7 | 0.023 | 2021-03-12 | JKT | 2021-03-10 | KP | UGC 7593 | |
| SDSS J123108.37+003649.3 | 0.023 | 2021-04-05 | CT | 2022-03-31 | KP | NGC 4493 | |
| SDSS J123634.26+111419.9 | 0.008 | 2022-05-22 | KP | 2022-03-27 | KP | NGC 4567/8 | |
| SDSS J124109.46+293219.1 | 0.024 | 2021-03-12 | JKT | 2022-01-31 | KP | ||
| SDSS J124549.51+404904.2 | 0.024 | 2021-12-08 | KP | 2021-12-08 | KP | ||
| SDSS J124610.14+304354.9 | 0.022 | 2021-03-17 | JKT | 2021-02-16 | KP | NGC 4676 | |
| SDSS J125649.89+481800.4 | 0.028 | 2019-06-28 | KP | 2022-04-04 | KP | NGC 4837 | UGC 8068 |
| SDSS J125731.95+282836.9 | 0.023 | 2019-06-19 | KP | 2022-04-04 | KP | NGC 4841 | |
| SDSS J125818.23+290743.6 | 0.026 | 2018-07-05 | JKT | 2022-04-04 | KP | IC 3935 | |
| SDSS J125821.70+280855.5 | 0.026 | 2022-04-05 | KP | 2022-02-11 | JKT | NGC 4851 | |
| SDSS J125940.10+275117.7 | 0.013 | 2022-05-01 | KP | 2022-02-28 | KP | ||
| SDSS J130004.24+280918.3 | 0.022 | 2022-05-02 | JKT | 2022-02-03 | KP | ||
| SDSS J130125.26+291849.5 | 0.023 | 2019-06-28 | KP | 2018-05-15 | KP | NGC 4922 |
Sample galaxies and log of imaging observations Table 3: SDSS name V date V site F510 date F510 site Other ID Notes SDSS J130147.06+290435.9 0.023 2022-05-02 JKT 2022-03-27 KP SDSS J130702.74+133814.4 0.027 2021-03-12 CT 2022-01-31 KP KPG 365A SDSS J132035.40+340821.7 0.023 2018-06-14 KP 2021-02-21 KP IC 883 SDSS J132652.11-023436.6 0.012 2021-04-15 CT 2022-03-31 KP SDSS J133525.40+332641.6 0.024 2020-07-24 JKT 2022-04-04 KP SDSS J133817.77+481641.0 0.028 2021-03-17 JKT 2021-03-17 JKT Mkn 266 Keel et al. (2012) cloud SDSS J134139.62+554014.3 0.025 2015-03-27 . KP 2015-03-27 KP. NGC 5278 Keel et al. (2019) cloud SDSS J135837.97+372528.2 0.012 2021-03-17 JKT 2020-02-21 KP NGC 5394/5 SDSS J140037.96-025422.7 0.025 2021-03-10 KP 2021-03-10 KP IC 968 SDSS J140141.38+334936.5 0.026 2020-07-24 JKT 2021-05-07 KP NGC 5421 SDSS J140821.09+354221.3 0.028 2022-04-05 KP 2022-02-03 KP SDSS J140834.22+091147.7 0.023 2021-04-15 CT 2022-03-31 KP SDSS J141338.69+073935.8 0.024 2021-03-17 JKT 2021-03-17 JKT NGC 5514 TELPERION cloud SDSS J141342.00+081316.3 0.025 2021-04-15 CT 2022-02-03 KP UGC 9103 SDSS J141422.99+025831.5 0.026 2020-03-16 CT 2022-02-28 KP SDSS J141631.80+393520.5 0.026 2020-07-23 JKT 2022-02-03 KP NGC 5541 DR7, not in DR12 SDSS J141702.52+363417.7 0.010 2020-07-24 JKT 2022-03-27 KP NGC 5544/5 SDSS J141814.94+342659.8 0.028 2020-07-23 JKT 2022-03-03 KP SDSS J142409.12+121531.1 0.027 2021-04-15 CT 2022-20-28 KP SDSS J144042.83+032755.5 0.027 2019-06-03 CT 2022-03-27 KP NGC 5718 SDSS J144514.14+384344.1 0.015 2018-03-13 JKT 2022-04-04 KP NGC 5752 SDSS J150448.33+410016.1 0.028 2020-07-23 JKT 2022-02-11 JKT SDSS J151100.89+233633.3 0.017 2020-07-24 JKT 2022-03-27 KP MCG +04-36-024 SDSS J152607.95+414033.8 0.009 2020-07-21 JKT 2019-07-03 KP NGC 5929/30 SDSS J153926.06+245636.9 0.023 2020-07-23 JKT 2019-05-04 KP Mkn 860A SDSS J155912.54+204548.0 0.015 2020-07-21 JKT 2022-04-05 KP NGC 6027 SDSS J162946.50+405229.5 0.028 2017-09-28 JKT 2019-07-03 KP SDSS J215507.85-004613.0 0.027 2021-10-06 KP 2021-10-06 KP SDSS J235410.08+002258.2 0.026 2021-10-06 KP 2021-10-06 KP NGC 7783
3 Results: EELRS in a large interacting and merging sample
This survey recovered previously-known distant EELRs in three systems, and one probable new one. The three are Mkn 266 (with the highest-surface-brightness EELR from the Galaxy Zoo sample, Keel et al. 2012), the emission filaments beyond the stellar discs of NGC 5278/9 (Keel et al., 2019), and the very distant cloud in the tidal tails of NGC 5514, found in the TELPERION AGN-host sample (Keel et al., 2022). The new [O III] structure was found near UGC 5941 (see Fig. 2), at projected separation 70″or 35 kpc from the nucleus. The BTA spectrum in Fig. 3 shows ratios of the strong emission lines that place it in the AGN section of common classification diagrams, although its signal-to-noise ratio is not sufficient to detect He II . The upper limit to the ratio He II /H is high enough to be consistent with the values seen on other EELRs (Keel et al. 2012, Knese et al. 2020, Keel et al. 2022). This line ratio has proven important in distinguishing the ionization sources of gas at low metallicity, where the AGN and star-formation loci can overlap in the most common BPT diagram (Baldwin et al. 1981, Kewley et al. 2001, Kauffmann et al. 2003), as discussed by Groves, Heckman, & Kauffmann (2006). It lies close in the BPT diagrams to previously-identified EELRs with He II detections.
Properties measured from the spectrum of the UGC 5941 cloud are listed in Table 2, as are measures of weaker and more diffuse emission just outside the galaxy disc along the slit. The redshifts are slightly smaller than that we measure for the galaxy nucleus, although the radial-velocity differences are barely significant (listed under in the table, in the sense object minus nucleus).
| Property | Cloud | Inner Emission |
|---|---|---|
| 10:50:17.69 | 10:50:20.00 | |
| +41:26:56 | +41:27:36 | |
| , km s-1 | ||
| [O III] H | ||
| [N II] H | ||
| [O I] H | ||
| H/H | ||
| [S II] /H |

3.1 Emission-line ratios and classifications
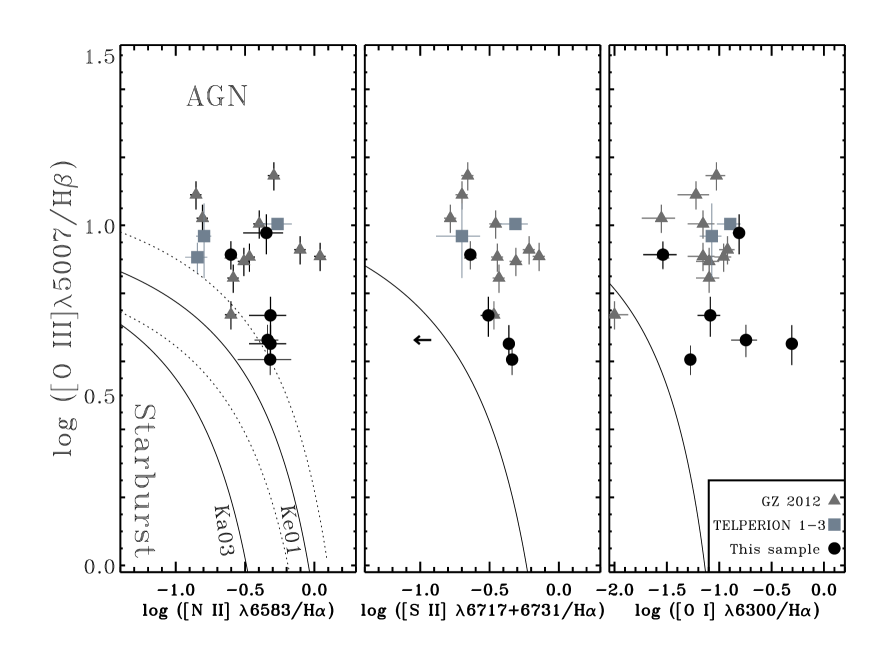
Common tools for understanding the energy input to gaseous nebulae, especially for galactic nuclei, are the BPT diagrams (Baldwin et al., 1981) comparing ratios of strong emission lines, as revised by later empirical and modeling studies (Veilleux & Osterbrock 1987, Kewley et al. 2001, Kauffmann et al. 2003). The classic BPT classification diagrams are shown in Fig. 4 for the various phases of the TELPERION survey, highlighting the objects appearing in this work, and for the Galaxy Zoo EELR clouds, including Hanny’s Voorwerp near IC 2497 and sharing Mkn 266 in common with the sample observed for this paper. Only for UGC 5941 is there not a detection of He II at intensity H to further support the identification of AGN ionization; its cloud lies in the AGN region, above the maximum-starburst lines shown. The Galaxy Zoo objects as a group have higher excitation (larger values of [O III]/H) than the TELPERION clouds, attributable to higher ionization parameter and reflecting the deeper surface-brightness threshold of the TELPERION narrowband survey compared to broad-band selection from SDSS images.

3.2 Incidence of distant EELRs
A straightforward way to estimate the incidence of distant EELRs is to consider the fractions of galaxies and known AGN hosts with such objects in the various phases of the TELPERION survey. These include a sample of Seyfert galaxies with H I detections (H I AGN in Table 3), so that it would be known where any ionized structures lie with respect to extended neutral gas (Knese et al., 2020); an extended version of the Toomre merging sequence (Toomre seq), a sample of AGN hosts selected on luminosity (Keel et al., 2022); and the present work selecting a larger sample of strongly interacting and merging galaxies (Mergers). For completeness, we list the number of galaxies in each sample (Targeted) and the number of galaxies examined for EELRs including any additional comparably luminous galaxies at matching redshifts (All); no EELRs appeared near these additional galaxies.
Simple tallies of the distant EELRs we have detected in the various TELPERION samples are given in Table 3, where values for combined samples account for galaxies in common between samples to avoid double-counting. These occur because the sample selections for various phases of the TELPERION survey used different kinds of criterion, and some galaxies satisfy more than one so were included in multiple samples. This interacting and merging sample selected in this work overlaps with the Toomre-sequence galaxies from Keel et al. (2022) in the systems NGC 2623, NGC 4676, and IC 883, and has NGC 5394/5, NGC 5514, and UGC 7064 in common with the AGN-host sample. In assessing the detection statistics, we note further overlaps between the TELPERION samples as follows: The H I AGN list (Knese et al., 2020) and AGN-host list from Keel et al. (2022) share the four systems UGC 3995, NGC 7469, NGC 7591, and NGC 7682.
We consider the numbers of galaxies, systems, and Seyfert galaxies. Notably, for the Toomre sample, the EELR-to-Seyfert galaxy ratio is undefined due to the unique case of NGC 7252, which has an EELR without directly-observed nuclear activity; (Schweizer et al., 2013). Various catalog sources differ in their thresholds for listing Seyfert nuclei as distinct from some LINERs, especially among the heterogenous sources used in compiling the VCV AGN catalog (Véron-Cetty & Véron, 2010) used in constructing the AGN-host sample. Our values include the UGC 5941 cloud as AGN-ionized, based on its location in Fig. 4. Uncertainties in the occurrence rates for distant EELRs (EELRs/galaxy and EELRs/Seyfert) use the binomial expression444where the 1- uncertainty is for sample size and fractional occurrence ., since the number of galaxies observed was set independently of the number of cloud detections.
LINERs counted here all have strong enough H emission (equivalent width Å ) to be in the AGN family, except for shocked gas in ongoing mergers as in NGC 5514 (Lípari et al., 2004) and NGC 6240, although even in this very dusty ultraluminous infrared galaxy (ULIRG) system there is evidence for AGN photoionization in some directions (Medling et al., 2021).
| Sample | Galaxies: | Nuclei: | EELRs | EELR/galaxy | EELR/Seyfert | Reference | ||
|---|---|---|---|---|---|---|---|---|
| Targeted | All | Seyfert | LINER | |||||
| H I AGN | 26 | 34 | 21 | 5 | 1 | Knese et al. (2020) | ||
| Toomre seq | 17 | 21 | 0 | 9 | 1 | — | Keel et al. (2022) | |
| AGN hosts | 120 | 185 | 87 | 30 | 2 | Keel et al. (2022) | ||
| Mergers | 92 | 198 | 9 | 31 | 4 | This work | ||
| Toomre seq+merger | 106 | 215 | 9 | 35 | 5 | |||
| H I AGN+AGN host | 141 | 211 | 103 | 32 | 3 | |||
| Interacting AGN | 34 | 34 | 34 | 40 | 5 | — | ||
| All | 241 | 415 | 111 | 71 | 7 | |||
Whether counting per galaxy or per system, and whether we consider only interacting and merging galaxies or wider samples, we find distant EELR clouds near 2-4% of them. This contrasts with the Galaxy Zoo sample taken from a much larger set of galaxies (roughly 16,000 potential AGN hosts) but with a surface-brightness limit in [O III] emission several times higher. That survey found 19 clouds for a fraction of order 0.001. The redshift bounds for the samples in the TELPERION survey enforce effective limits on galaxy luminosity; for the previous phase of the survey, AGN hosts were observed only if brighter than absolute magnitude . We find occurrence fractions in TELPERION 20-40 times higher than the Galaxy Zoo sample, which may suggest that the number of EELRs climbs steeply toward lower surface brightness, so that even deeper imaging surveys might prove very fruitful.
Our results continue the pattern of distant EELRs occurring preferentially in interacting and merging systems, as was seen in the Galaxy Zoo objects. Among galaxies with Seyfert nuclei in the Toomre sequence sample and the merger sample from this paper, roughly half (% ) show distant EELRs. We can extend the statistics slightly by including interacting AGN (Seyferts and LINERs) from the AGN-host and H I AGN samples, taking the labels for tidal disturbance from Table 7 of Keel et al. (2022) and those listed by Kuo et al. (2008) in their Group I, where H I features trace tidal interactions. Excluding duplications with the other TELPERION samples, this addition comprises 25 Seyfert galaxies, 5 LINERs, and two EELRs near Seyfert galaxies. As shown in the “Interacting AGN" entry in Table 3, this category includes all but one of the EELRs found in the whole TELPERION program. EELRs have been detected near % of this combined sample (and none of the noninteracting AGN observed).
3.3 Galaxies and AGN with distant EELRs
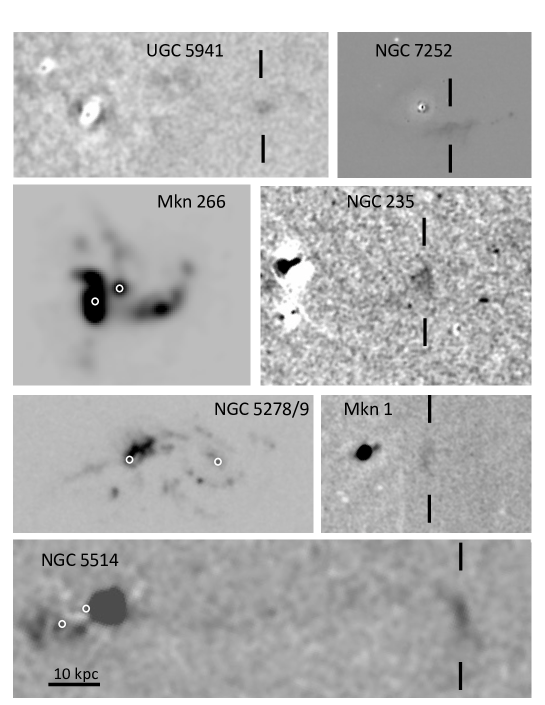
Combining the results of the four TELPERION phases, it is appropriate to compare the nuclei and clouds of each of the 7 systems with distant EELRs. Fig. 5 provides a visual comparison of the TELPERION EELRs, including UGC 5941, at the same scales in linear size and [O III] surface brightness. These systems are discussed starting with the four found in this paper’s merger sample.
Mkn 266 (NGC 5256) is part of a merging system, whose [O III] clouds have the highest surface brightness among detections in the Galaxy Zoo survey (Keel et al., 2012). With far-IR luminosity erg s-1, it qualifies as a luminous infrared galaxy (LIRG). Both nuclei show Sy 2 spectra in the optical range; this is one of the rare local examples of a dual AGN, with components separated by 5.6 kpc in projection (Mazzarella et al., 2012). This, together with the ongoing merger and consequent deep blending of the nuclei in far-IR observations, makes it difficult to apportion the luminosity between the two galaxies to tell whether one nucleus dominates the photoionization. Further, an ongoing starburst accounts for roughly half of the far-IR (and therefore bolometric) luminosity (Wang et al. 1997, Mazzarella et al. 2012). Mkn 266 is part of the merger sample reported in this paper, and also appeared in the Galaxy Zoo sample (Keel et al., 2012) due to the very high surface brightness of its EELR filaments.
NGC 5278/9 (Arp 239, VV 19, Mkn 271) form a strongly-interacting pair of spirals, which Vorontsov-Velyaminov (1977) called the “Telephone Handset" system, noting a now-dated resemblance. Kinematic studies show the two distinct rotating discs which are prominent morphologically, but departures from circular coplanar motion are locally almost as large as the circular velocities (Klimanov, Reshetnikov, & Burenkov 2002, Repetto et al. 2010.) Simulations suggest that this combination, and the lack of bright tidal tails seen in the starlight, mark a galaxy pair on an initial close approach before the main bodies spiral inward toward merger. Both nuclei have similar optical spectra, near the Seyfert/LINER boundary in BPT diagrams depending on aperture size. Each is accompanied by highly-ionized filaments extending to projected distances 28-58″from the nuclei (Keel et al., 2019); the spectroscopic values we use here were obtained from new measurements on the data obtained for that paper. Here again, the far-IR data blend both galaxies, and assessing how much AGN radiation may be reradiated by dust is further complicated by the evident levels of star formation in the discs. We have explored the IR characteristics of this system using the Spitzer data obtained in the Star Formation Reference Survey (SFRS; Ashby et al. 2011). The SFRS project used the consistent continuum slope of a wide range of stellar populations across the mid-infrared bands, from 3.6-8m and therefore well longward of the generic 1.6m peak in their spectral energy distributions, to generate images which largely remove the direct light of stars at 8m, by subtracting an appropriately scaled version of the 3.6m image. The resulting image, their “NS" combination, is especially powerful in isolated both warm dust in star-forming regions and emission from AGN. This technique applied to NGC 5279 shows a central source at 8m that is 4 times as bright as the core of NGC 5278, in contrast to their more equal fluxes in narrow (optical) emission lines (where NGC 5279 is brighter in [O III] by a factor 1.5).
NGC 5514 is an advanced merger with two prominent tidal tails. The EELR, initially reported by Keel et al. (2022), is near the tip of one tail, at the extraordinary projected distance 75 kpc. Detailed analysis of that work’s optical spectra in the main body, including the presence of multiple superimposed velocity components, suggests that shock ionization is important here, so that scaling from the emission-line luminosity will overestimate the AGN luminosity. Integral-field spectra suggest that off-nuclear starburst regions and associated outflows dominate the shock emission (Lípari et al., 2004), rather than the large-scale shocks sometimes found in ongoing mergers. Unlike most of the other LINER systems we deal with, in this case the line ratios must largely reflect shocks. In contrast, the very distant EELR is in a region near the end of a stellar tail where large-scale cloud collisions are unlikely, shows small line widths and notably higher ionization levels than gas near the galaxy center, all of which suggest photoionization by a (possibly faded) AGN. The direct emission signature of such an AGN is lost in the complex environment of other processes near the galaxy nuclei, providing us only with an upper limit to AGN luminosity from available data.
UGC 5941 is an M51-type interacting pair, with a smaller companion projected 25″away near the tip of a tidal arm; the pair is accompanied by a similarly luminous edge-on spiral (SDSS J105008.59+412638.8) projected 162″from UGC 5941 at a similar redshift.
Mkn 1 (NGC 449) shows an opposing pair of ionized clouds projected kpc from the nucleus found in the initial H I AGN phase of TELPERION (Knese et al., 2020). One of these clouds has spectroscopic data of quality sufficient to show a high He II /H ratio indicating AGN photoionization. The host galaxy is in a pair with the spiral NGC 451 at projected separation 109″(equivalent to 35 kpc). Kuo et al. (2008) find a common H I envelope including a tidal bridge and tails, suggesting that the asymmetry and kinematic disturbance of the H I in the disc of Mkn 1 (also noted by Omar et al. 2002 from GMRT data) have been caused by this interaction. The nucleus shows a typical Sy 2 optical spectrum.
NGC 235, also designated NGC 235A in NED, is part of a tidally-distorted interacting triple including NGC 232 and the smaller galaxy NGC 235B, seen projected against the disc of NGC 235. The EELR (Keel et al., 2022) lies between NGC 235 and NGC 232, whose nuclear optical spectrum shows star formation without a significant AGN contribution.
NGC 7252, part of the original Toomre sequence, is a merger remnant in an advanced state with a single nucleus, small-scale spiral pattern with star-forming regions, and extensive tidal tails. Its EELR was reported by Schweizer et al. (2013), and recovered in the TELPERION merging-sequence sample (Keel et al., 2022). The ionized gas roughly follows one of the tidal tails over a radial range 5-13 kpc from the nucleus. This system is notable for having no detected AGN, furnishing a very strong case for essentially complete shutdown of accretion luminosity over years.
Since many of the distant EELRs from the Galaxy Zoo sample are so bright as to suggest that the AGN has faded over years, we consider the available data for the TELPERION objects to see whether some show evidence for fading. (AGN brightening is more difficult to demonstrate, since it has the same energy-balance signature as lack of extended neutral gas or greater-than-average AGN obscuration). For the luminous Galaxy Zoo AGN examined by Keel et al. (2012), a simple picture could be used to bound the ionizing luminosity, in which all ionizing radiation leaving the nucleus either ionizes observable gas (estimated using scaling relations from [O III] luminosity) or is absorbed and reradiated by dust, so the mid- and far-infrared luminosities are proxies for the remaining fraction of ionizing radiation emitted from the AGN. As we find EELRs associated with weaker (and sometimes unobservably faint) AGN, these assumptions become progressively less realistic. The contribution to grain heating from star formation becomes relatively more important for lower AGN luminosity, and a larger fraction of the observed infrared fluxes for lower angular resolution. Likewise, lower-luminosity AGN may have signatures in the optical spectra that cannot be reliably separated from central star formation using only the strong emission lines incorporated in the BPT diagrams. The TELPERION objects are clearly in this more complex regime.
This complexity may be seen from the data in Table 4, which includes information on the implied [O III] luminosity of each nucleus, and its bolometric luminosity under the assumption that the entire far-infrared output comes from the nucleus, as was done for the Galaxy Zoo sample. Here, L is the luminosity of the nucleus in the [O III] line, while the bolometric luminosity LBol combines contributions traced by [OIII] and the far-infrared luminosity. All these values of Lion,cloud are in fact lower limits, calculated for complete absorption of the incident ionizing continuum, so the more realistic case of incomplete absorption increases the required luminosity of the AGN. The column labelled “Ratio" is the ratio of this implied bolometric output to the ionizing luminosity Lion,cloud needed to ionize the cloud at the observed H surface brightness and (projected) distance from the nucleus, again estimated following Keel et al. (2012); values smaller than unity would indicate that the AGN has faded over the relevant light-travel time. To the extent that surrounding star-forming regions produce additional far-IR emission within the large beams of available FIR data, this ratio must be an overestimate, sometimes by a very large factor. From these data, the AGN in NGC 5278/9, NGC 5514, and NGC 7252 show evidence of fading over timespans 0.9, 2.4, and 0.4 years, respectively. Mkn 1 is consistent with a constant luminosity obscured along our line of sight, while the situations in Mkn 266 and NGC 235 remain ambiguous.
The case of the UGC 5941 EELR cloud illustrates some of the limits on this energy-balance approach for galaxies so distant that existing mid- and far-infrared data do not separate emission from the nucleus and disk of the host galaxy. The AGN is faint enough to be lost in the star-forming signatures of the galaxy both spectroscopically and in integrated infrared flux. Even if all the IR output of the galaxy is assigned to reprocessed AGN radiation, the cloud ionization still somewhat exceeds the level powered by an unobscured line of sight from the cloud to the AGN, accounting for a fraction of it from Table 4). UGC 5941 is therefore a candidate for modest fading over years. The optical spectrum from the nucleus shows star formation, securely below the starburst dividing curves in all three BPT diagrams, with [N II]/H=0.48, [O III]/H=0.21. These ratios suggest that only a small fraction of the H or H emission at the nucleus comes from an unobscured AGN, based on a simple mixing model of two components typical of high-metallicity star-forming regions in galaxy nuclei and of Seyfert-galaxy line ratios.
We can start to address the limitations of IR sky survey data, improving luminosity estimates for low-luminosity AGN in star-forming host galaxies, for NGC 5278/9, using the Spitzer data from 3.6-24 m obtained by the SFRS project (Ashby et al., 2011). This exercise sets tighter limits on the IR output from the nuclei - at 8m, the nucleus of NGC 5278 (NGC 5279) contributes no more than a fraction 0.034 (0.067) of the total system flux after correction for stellar photospheric light, while at 24m, the limit is 0.31 (0.23). If these values are representative of the system at longer wavelengths, the ratios in Table 4 should be divided by these fractions, which would push the NGC 5278/9 EELR clouds into the regime requiring a fading AGN. Clearly this question will benefit from improved angular resolution throughout the infrared. An order-of-magnitude improvement in discrimination of AGN from surrounding star formation at these redshifts, for example, would come from quite short exposures using MIRI on JWST.
Similarly, X-ray measurements can isolate AGN emission and provide strong constraints on the ionizing continuum, with appropriate caution about the possibility of the source being strongly obscured at energies below by surrounding material at high column densities. For the EELR hosts in the TELPERION samples, the data do not yet exist to use this test at any greater sensitivity than spatially integrated far-IR fluxes. The bright AGN in this group, NGC 235, Mkn 266, and Mkn 1, which are energetically capable of photoionizing the EELR according to the simple model described above, have X-ray detections that are compatible with this conclusion. NGC 7252, with no optical or IR evidence of an AGN, has an X-ray luminosity and spectral parameters compatible with emission from its young stellar population and ISM (Brightman & Nandra, 2011). All the other TELPERION EELR hosts - NGC 5278/9, NGC 5514, and UGC 5941 - still lack even catalog X-ray detections which are usefully deep for this purpose. Scaling from the bright detections suggests that point-source sensitivity near erg cm-2 s-1 from 2-10 keV would show more conclusively whether, for example, all the clouds in the NGC 5278/9 system show fading of the AGN, anchoring the SED of each AGN at energies where other sources are weaker and can be estimated from the stellar population of the host galaxy.
| Object | Type | L, erg s-1 | LBol | Lion,cloud | Ratio | Projected distance, kpc | |
|---|---|---|---|---|---|---|---|
| Mkn 1 | 0.016 | Sy 2 | <34 | 13 | |||
| NGC 7252 | 0.016 | — | - | - | — | 13 | |
| NGC 235 | 0.022 | Sy 2 | <1.16 | 26 | |||
| NGC 5514 | 0.024. | Sy 2 | <0.35 | 75 | |||
| Mkn 266 | 0.028 | Sy2x2 | <2.8 | 25 | |||
| NGC 5278 inner | 0.025 | LINER/Sy 2 | <2.5 | 14 | |||
| NGC 5278 outer | 0.025 | LINER/Sy 2 | <0.38 | 29 | |||
| NGC 5279 | 0.025 | LINER/Sy 2 | <0.28 | 18 | |||
| UGC 5941 | 0.024 | Star-forming | FAGN | <0.6 | 35 |
4 Conclusions
We present the results of a narrow-band imaging search for distant EELRs (extending kpc from the nucleus) around galaxies with and without AGN seen directly, to assess the luminosity history of the AGN as well as contribute to our understanding of the pattern of emerging radiation from the cores. In a sample of 198 strongly-interacting and merging galaxies within 92 systems, we have identified 3 previously-identified and one newly recognized distant EELR, with an AGN too weak to separate from signatures of ongoing star formation but with the cloud lying in the AGN-ionized regions of BPT classification diagrams. Collecting these results with the three previous TELPERION samples, we find detection rates of distant EELRs from 20-40 times higher than in the Galaxy Zoo survey, which examined a much larger galaxy sample to [O III] surface brightness levels several times higher than reached with our current narrow-band images. Detection rates for distant EELRs around interacting Seyfert galaxies are particularly high, %, continuing the earlier preponderance of EELRs in interacting and merging systems. This must at least in part reflect the presence of distant, often extraplanar H I in tidally distorted galaxies.
One of our motivations for the TELPERION survey was to assess the duration of bright periods in episodic AGN accretion. We have detected EELRs around AGN sufficiently faint that the simple picture used earlier to ask whether AGN are more likely to be obscured or faded can no longer be applied with available data, because the integrated far-IR output is dominated by surrounding star formation and X-ray catalogs are not yet deep enough. Analysis of this kind will need to await higher-resolution data in the mid and far-infrared or deeper high-resolution X-ray observations.
Acknowledgements
The narrowband filters were obtained thanks to a University of Alabama College of Arts and Sciences Dean’s Leadership Board Faculty Fellowship. Acquisition of new imagers for the SARA Observatory was supported by the National Science Foundation through grant 0922981 to East Tennessee State University, and retrofitting of the Jacobus Kapteyn Telescope through grant 1337566 to Texas A&M University – Commerce. We thank Steve Willner and Matt Ashby for copies of the processed SFRS Spitzer observations, and Francois Schweizer for the Las Campanas [O III] image of NGC 7252.
Observations with the SAO RAS telescopes are supported by the Ministry of Science and Higher Education of the Russian Federation. The renovation of telescope equipment is currently provided within the national project “Science and Universities". We obtained part of the observed data on the unique scientific facility “Big Telescope Alt-azimuthal" as well as analysed the 2.5-m and 6-m telescopes data with the financial support of grant No075-15-2022-262 (13.MNPMU.21.0003) of the Ministry of Science and Higher Education of the Russian Federation.
The authors are honored to be permitted to conduct astronomical research on Iolkam Du’ag (Kitt Peak), a mountain with particular significance to the Tohono O’odham Nation. This research has made use of the NASA/IPAC Extragalactic Database (NED), which is operated by the Jet Propulsion Laboratory, Caltech, under contract with the National Aeronautics and Space Administration. This research has made use of the VizieR catalogue access tool, CDS, Strasbourg, France (DOI : 10.26093/cds/vizier). The original description of the VizieR service was published in 2000, A&AS 143, 23.
Funding for the Sloan Digital Sky Survey V has been provided by the Alfred P. Sloan Foundation, the Heising-Simons Foundation, the National Science Foundation, and the Participating Institutions. SDSS acknowledges support and resources from the Center for High-Performance Computing at the University of Utah. SDSS telescopes are located at Apache Point Observatory, funded by the Astrophysical Research Consortium and operated by New Mexico State University, and at Las Campanas Observatory, operated by the Carnegie Institution for Science. The SDSS web site is www.sdss.org.
SDSS is managed by the Astrophysical Research Consortium for the Participating Institutions of the SDSS Collaboration, including Caltech, The Carnegie Institution for Science, Chilean National Time Allocation Committee (CNTAC) ratified researchers, The Flatiron Institute, the Gotham Participation Group, Harvard University, Heidelberg University, The Johns Hopkins University, L’Ecole polytechnique fédérale de Lausanne (EPFL), Leibniz-Institut für Astrophysik Potsdam (AIP), Max-Planck-Institut für Astronomie (MPIA Heidelberg), Max-Planck-Institut für Extraterrestrische Physik (MPE), Nanjing University, National Astronomical Observatories of China (NAOC), New Mexico State University, The Ohio State University, Pennsylvania State University, Smithsonian Astrophysical Observatory, Space Telescope Science Institute (STScI), the Stellar Astrophysics Participation Group, Universidad Nacional Autónoma de México, University of Arizona, University of Colorado Boulder, University of Illinois at Urbana-Champaign, University of Toronto, University of Utah, University of Virginia, Yale University, and Yunnan University.
Data Availability
The SARA images, and BTA long-slit spectrum of UGC 5941, are available at Zenodo.org under DOI 10.5281/zenodo.8374640. The Spitzer data may be retrieved from the Spitzer Heritage Archive at IRSA (https://irsa.ipac.caltech.edu/applications/Spitzer/SHA).
References
- Abazajian et al. (2009) Abazajian K. N., Adelman-McCarthy J. K., Agüeros M. A., Allam S. S., Allende Prieto C., An D., Anderson K. S. J., et al., 2009, ApJS, 182, 543. doi:10.1088/0067-0049/182/2/543
- Afanasiev & Moiseev (2011) Afanasiev V. L., Moiseev A. V., 2011, BaltA, 20, 363. doi:10.1515/astro-2017-0305
- Afanasieva et al. (2023) Afanasieva I., Murzin V., Ardilanov V., Ivaschenko N., Pritychenko M., Moiseev A., Shablovinskaya E., et al., 2023, Photo, 10, 774. doi:10.3390/photonics10070774
- Ahn et al. (2012) Ahn C. P., Alexandroff R., Allende Prieto C., Anderson S. F., Anderton T., Andrews B. H., Aubourg É., et al., 2012, ApJS, 203, 21. doi:10.1088/0067-0049/203/2/21
- Ashby et al. (2011) Ashby M. L. N., Mahajan S., Smith H. A., Willner S. P., Fazio G. G., Raychaudhury S., Zezas A., et al., 2011, PASP, 123, 1011. doi:10.1086/661920
- Baldwin et al. (1981) Baldwin, J. A., Phillips, M. M., & Terlevich, R., 1981, PASP, 93, 5. doi:10.1086/130766
- Bennett et al. (2014) Bennett C. L., Larson D., Weiland J. L., Hinshaw G., 2014, ApJ, 794, 135. doi:10.1088/0004-637X/794/2/135
- Bergvall et al. (2016) Bergvall N., Marquart T., Way M. J., Blomqvist A., Holst E., Östlin G., Zackrisson E., 2016, A&A, 587, A72. doi:10.1051/0004-6361/201525692
- Brightman & Nandra (2011) Brightman M., Nandra K., 2011, MNRAS, 413, 1206. doi:10.1111/j.1365-2966.2011.18207.x
- Fernandes, Leão, & Lacerda (2003) Fernandes R. C., Leão J. R. S., Lacerda R. R., 2003, MNRAS, 340, 29. doi:10.1046/j.1365-8711.2003.06203.x
- Darg et al. (2010) Darg D. W., Kaviraj S., Lintott C. J., Schawinski K., Sarzi M., Bamford S., Silk J., et al., 2010, MNRAS, 401, 1043. doi:10.1111/j.1365-2966.2009.15686.x
- Groves, Heckman, & Kauffmann (2006) Groves B. A., Heckman T. M., Kauffmann G., 2006, MNRAS, 371, 1559. doi:10.1111/j.1365-2966.2006.10812.x
- Kauffmann et al. (2003) Kauffmann G., Heckman T. M., Tremonti C., Brinchmann J., Charlot S., White S. D. M., Ridgway S. E., et al., 2003, MNRAS, 346, 1055. doi:10.1111/j.1365-2966.2003.07154.x
- Keel et al. (1985) Keel W. C., Kennicutt R. C., Hummel E., van der Hulst J. M., 1985, AJ, 90, 708. doi:10.1086/113779
- Keel et al. (2012) Keel W. C., Chojnowski S. D., Bennert V. N., Schawinski K., Lintott C. J., Lynn S., Pancoast A., et al., 2012, MNRAS, 420, 878. doi:10.1111/j.1365-2966.2011.20101.x
- Keel et al. (2013) Keel W. C., Manning A. M., Holwerda B. W., Mezzoprete M., Lintott C. J., Schawinski K., Gay P., et al., 2013, PASP, 125, 2. doi:10.1086/669233
- Keel et al. (2017) Keel W. C., Oswalt T., Mack P., Henson G., Hillwig T., Batcheldor D., Berrington R., et al., 2017, PASP, 129, 015002. doi:10.1088/1538-3873/129/971/015002
- Keel et al. (2019) Keel W. C., Bennert V. N., Pancoast A., Harris C. E., Nierenberg A., Chojnowski S. D., Moiseev A. V., et al., 2019, MNRAS, 483, 4847. doi:10.1093/mnras/sty3332
- Keel et al. (2022) Keel W. C., Moiseev A., Kozlova D. V., Ikhsanova A. I., Oparin D. V., Uklein R. I., Smirnova A. A., et al., 2022, MNRAS, 510, 4608. doi:10.1093/mnras/stab3656
- Kewley et al. (2001) Kewley L. J., Dopita M. A., Sutherland R. S., Heisler C. A., Trevena J., 2001, ApJ, 556, 121. doi:10.1086/321545
- Klimanov, Reshetnikov, & Burenkov (2002) Klimanov S. A., Reshetnikov V. P., Burenkov A. N., 2002, AstL, 28, 579. doi:10.1134/1.1505501
- Knese et al. (2020) Knese E. D., Keel W. C., Knese G., Bennert V. N., Moiseev A., Grokhovskaya A., Dodonov S. N., 2020, MNRAS, 496, 1035. doi:10.1093/mnras/staa1510
- Kuo et al. (2008) Kuo C.-Y., Lim J., Tang Y.-W., Ho P. T. P., 2008, ApJ, 679, 1047. doi:10.1086/587044
- Lintott et al. (2008) Lintott C. J., Schawinski K., Slosar A., Land K., Bamford S., Thomas D., Raddick M. J., et al., 2008, MNRAS, 389, 1179. doi:10.1111/j.1365-2966.2008.13689.x
- Lintott et al. (2009) Lintott C. J., Schawinski K., Keel W., van Arkel H., Bennert N., Edmondson E., Thomas D., et al., 2009, MNRAS, 399, 129. doi:10.1111/j.1365-2966.2009.15299.x
- Lípari et al. (2004) Lípari S., Mediavilla E., Garcia-Lorenzo B., Díaz R. J., Acosta-Pulido J., Agüero M. P., Taniguchi Y., et al., 2004, MNRAS, 355, 641. doi:10.1111/j.1365-2966.2004.08368.x
- Mazzarella et al. (2012) Mazzarella J. M., Iwasawa K., Vavilkin T., Armus L., Kim D.-C., Bothun G., Evans A. S., et al., 2012, AJ, 144, 125. doi:10.1088/0004-6256/144/5/125
- Medling et al. (2021) Medling A. M., Kewley L. J., Calzetti D., Privon G. C., Larson K., Rich J. A., Armus L., et al., 2021, ApJ, 923, 160. doi:10.3847/1538-4357/ac2ebb
- Moiseev (2021) Moiseev A. V., 2021, AstBu, 76, 316. doi:10.1134/S1990341321030081
- Moiseev, Perepelitsyn, & Oparin (2020) Moiseev A., Perepelitsyn A., Oparin D., 2020, ExA, 50, 199. doi:10.1007/s10686-020-09672-x
- Omar et al. (2002) Omar A., Dwarakanath K. S., Rupen M., Anantharamaiah K. R., 2002, A&A, 394, 405. doi:10.1051/0004-6361:20021152
- Potanin et al. (2017) Potanin S. A., Gorbunov I. A., Dodin A. V., Savvin A. D., Safonov B. S., Shatsky N. I., 2017, ARep, 61, 715. doi:10.1134/S106377291707006X
- Repetto et al. (2010) Repetto P., Rosado M., Gabbasov R., Fuentes-Carrera I., 2010, AJ, 139, 1600. doi:10.1088/0004-6256/139/4/1600
- Schweizer et al. (2013) Schweizer F., Seitzer P., Kelson D. D., Villanueva E. V., Walth G. L., 2013, ApJ, 773, 148. doi:10.1088/0004-637X/773/2/148
- Shatsky et al. (2020) Shatsky N., Belinski A., Dodin A., Zheltoukhov S., Kornilov V., Postnov K., Potanin S., et al., 2020, gbar.conf, 127. doi:10.26119/978-5-6045062-0-2_2020_127
- Stasińska & Leitherer (1996) Stasińska G., Leitherer C., 1996, ApJS, 107, 661. doi:10.1086/192377
- Stockton, Fu, & Canalizo (2006) Stockton A., Fu H., Canalizo G., 2006, NewAR, 50, 694. doi:10.1016/j.newar.2006.06.024
- Stoklasová et al. (2009) Stoklasová I., Ferruit P., Emsellem E., Jungwiert B., Pécontal E., Sánchez S. F., 2009, A&A, 500, 1287. doi:10.1051/0004-6361/200811225
- Veilleux & Osterbrock (1987) Veilleux S., Osterbrock D. E., 1987, ApJS, 63, 295. doi:10.1086/191166
- Véron-Cetty & Véron (2010) Véron-Cetty M.-P., Véron P., 2010, A&A, 518, A10. doi:10.1051/0004-6361/201014188
- Vorontsov-Velyaminov (1977) Vorontsov-Velyaminov B. A., 1977, A&AS, 28, 1
- Wang et al. (1997) Wang J., Heckman T. M., Weaver K. A., Armus L., 1997, ApJ, 474, 659. doi:10.1086/303499
- Wilson (1996) Wilson A. S., 1996, VA, 40, 63. doi:10.1016/0083-6656(95)00102-6
- Wright (2006) Wright E. L., 2006, PASP, 118, 1711. doi:10.1086/510102