Exploring the Impact of Opinion Polarization on Short Video Consumption
Abstract.
This article investigates the impact of Opinion Polarization (OP) in the increasingly popular domain of short video consumption, a critical component of the contemporary digital landscape with a significant influence on public opinions and social interactions. We assess the effect of OP on viewers’ perceptions and behaviors, revealing that traditional user feedback metrics, such as likes and watch time, inadequately capture and measure OP. To address this challenge, our research employs Electroencephalogram (EEG) signals, introducing an innovative, non-invasive method to evaluate the neural reactions associated with OP’s influence on perception and cognition. Our empirical analysis demonstrates OP’s profound impact on viewers’ emotions, manifested through observable changes in brain activity. Additionally, our results underscore the potential of using EEG data to predict users’ exposure to polarized short video content. By exploring the relationship between OP, neural activity, and viewer behavior, this study offers a novel perspective on the dynamics of short video consumption and proposes a unique method for quantifying OP’s effects in this context.
1. Introduction
In recent years, internet-based social platforms have become increasingly important for the dissemination of information and the formation of public opinion. However, these platforms have also been criticized for their role in promoting opinion polarization (Pariser, 2011; Hosanagar et al., 2014) across many aspects, including politics (Groshek and Koc-Michalska, 2017; Martinovic, 2018), healthcare (Holone, 2016), and science (McCright and Dunlap, 2011). Opinion polarization (OP) refers to the widening divergence of individuals’ stances on specific issues, where stances shift from moderate, centrist opinions to more extreme opinions. OP is now recognized as a significant factor in propagating or even creating biases that can influence decisions and opinions (Pariser, 2011; Abebe et al., 2018). For example, Gao et al. (2023) revealed that users on short video platforms often encounter content tailored to specific polarized opinions, leading to the development of entrenched and emotionally charged sentiments toward political issues. Asker and Dinas (2019) observed a significant correlation between user’s emotional intensity and OP in social media.
As the phenomenon of OP becomes more prevalent in the digital age, existing efforts have been undertaken to understand the phenomenon of OP by quantifying its strength and mitigating its effect on societal polarization. Typically, they detect and quantify OP through artificially designed metrics based on clicks or other behavior signals collected in the logs of internet-based social platforms. For instance, some studies starting from an individual perspective argue that greater click entropy on content with similar opinions indicates stronger OP (Chen et al., 2022). Others, approaching from a group perspective, cluster users based on their behavior signals on the same items and define the strength of OP according to the distance between various clustering groups (Chitra and Musco, 2020). Based on these OP measurements, they proposed several methods to alleviate the potential negative impact of OP, including more exploratory recommendation systems (Chen et al., 2021; Chen, 2021), presenting opposing view (Einav et al., 2022), and group discussion (Strandberg et al., 2019). The above studies are limited to using user behavior metrics as a quantification of OP. Unfortunately, there is no guarantee that these user behaviors, especially implicit user behaviors, can directly reflect the effect of OP on human users. For example, Criss et al. (2021) observed that on Twitter 111https://twitter.com/, users’ click and like behavior on some polarized content does not necessarily alter their opinions or attitudes towards the polarization of certain content. Hence, existing methods for detecting and quantifying OP may be fraught with inaccuracies and fail to directly reflect the impact of OP on users. How to understand and quantify OP in terms of its impacts on users in social media content is still an open question to the research communities.
To mitigate the issue of solely relying on user behavior metrics, some existing qualitative research has delved into the phenomenon of OP by collecting several explicit responses, such as interviewing (Mäs and Flache, 2013) and analysis on content posted by individual users (Lee, 2016). Their research has demonstrated that OP can affect an individual’s sentiment (Mäs and Flache, 2013; Criss et al., 2021), affective state (Lee, 2016), and several other complex cognitive processes regarding a specific topic in social platforms (Druckman et al., 2021). However, collecting explicit signals requires a lot of user effort and there is a lack of systematic effort in connecting explicit signals with OP in a quantitive manner. Few studies have considered how to utilize these explicit responses to detect and quantify OP, particularly in the context of internet-based social platforms such as short video streaming platforms and personalized search engines.
Recently, researchers have attempted to user’s brain signals as a measurement to understand several concepts in information access and interaction systems, such as relevance judgment (Ye et al., 2023; Moshfeghi et al., 2013), information need (Moshfeghi et al., 2019), knowledge state (Pinkosova et al., 2023), etc. As a portable and economical device for collecting brain signals, electroencephalogram (EEG) has been a widely used neurological measurement for understanding users’ perception, attention, memory, and affective state during information processing. EEG can provide a quantitative measure of the users’ neural processing of perception and cognition in real-time, and it can be collected during the task process without interfering with the user. Therefore, we believe that EEG could complement other behavioral signals and provide important insights for understanding the connections between short video browsing and opinion polarization. Hence, EEG is also a potential alternative to explicit response and behavior signals for understanding user’s neural processing of content perception in OP scenarios.
In this paper, we aim to predict and quantify the existence of OP, and explore the relationship between OP and various signals including user’s behavior signals, explicit responses, and brain signals, respectively. Specifically, we focus on the following research questions:
-
•
RQ1: How does opinion polarization in short video browsing affect users’ sentiment judgment?
-
•
RQ2: How do opinion polarization exposure affect users’ brain signal patterns?
-
•
RQ3: How can we predict the possibility of users’ exposure to short videos with polarized opinions?
To shed light on these research questions, we conduct a user study examining the influence of browsing polarized short videos about different historical personages on human participants. We conduct a multi-faceted analysis with various user signals collected: sentiment annotations, behavior signals, and EEG signals collected during the short video browsing process. Based on the user study, we reveal that OP has a significant effect on users’ sentiment judgments of the personages. In addition, we also observe a detectable difference between users’ brain signal response to the video content of these personages before and after the influence of OP. These differences in brain activity can be underpinned by various neuroscientific factors such as emotions, memory, and attention during the user’s perception procedures. Finally, we conduct a classification experiment using behavior signals, explicit annotations, and brain signals, as well as their possible combinations to predict a participant’s exposure to polarized short videos. The experimental results suggest that quantification and detection of OP based on explicit responses and brain signals are more accurate compared to previous methods that relied on implicit behavior signals.
2. Methodology
In this section, we first present how we selected target personages, constructed a video set, and designed a video platform for the experiment, as the preliminary part. Then we introduce the procedure of the whole experiment, followed by Participants and Ethics. Finally, we present an overview of the dataset 222The data and code are available in https://github.com/bangdedadi/Understanding-the-Effect-of-Opinion-Polarization-in-Short-Video-Browsing we collected.
2.1. Preliminary
2.1.1. Target personages selection
To study how short video browsing could affect people’s opinions, we selected ten historical or fictional personages based on the following criteria: (1) the personages should be famous or controversial enough so that we could find short videos with different opinions on them; (2) the personages should not be so popular that participants in our experiments have already developed strong opinions on the personages by their own. Specifically, the personages we selected include Thomas Alva Edison, Cao Cao, Christopher Columbus, Emperor Wu of Han, Catherine the Great, Walter White, Michael Corleone, Isaac Newton, Qin Shi Huang, and Xiang Yu. Detailed information about these personages is provided in the appendix.
2.1.2. Video set construction
To conduct experiments on short video browsing, We further constructed a video set regarding the ten personages for the user study, 16 videos for each personage. The video set construction involved video collection and annotation processes. Using keyword searches, videos themed around the target personages were gathered from the Tiktok 333https://www.douyin.com/ and bilibili 444https://www.bilibili.com/. The principle for selecting videos is (1) the main topic of the video should focus on the target personage; (2) the video should exhibit clear polarity (i.e., positive, negative). Each video was meticulously truncated to a duration of one minute without affecting the key content of the video.
The videos were categorized into positive and negative polarities by human annotation. Three experts, recruited via WeChat for their demonstrated ability to analyze video polarity, participated in the annotation process. Each video on a Likert scale is annotated ranging from 1 to 5, where 1 represents the most negative opinion, while 5 signifies the most positive opinion. The polarity of the videos was determined based on the average scores from three experts where scores above and below 3 denote positive and negative polarity, respectively. Further details regarding the annotation procedures are provided in Appendix A.4.
To better simulate short video browsing scenarios and prevent the participants from identifying the goal of our lab and field studies, we also included a background video set in our experiments. This set contains 120 one-minute clips unrelated to the target personages, each also edited to one minute in duration. Additionally, 40 videos from the SEED-IV dataset (a well-known dataset for sentiment analysis)(Zheng et al., 2018), were included and truncated to a one-minute duration. The final video set comprised three types of videos: positive videos about target personages (pos-videos), negative videos about target personages (neg-videos), and clips unrelated to the personages (distractors).
2.1.3. Platform
To facilitate data collection and mitigate the influence of habitual use of a single platform, a custom experimental webpage for video playback was developed for this study. The video playback interface is shown in Appendix A.1. The webpage can collect user interactions, including “likes” and viewing duration. More details regarding the Platform are provided in the Appendix.
2.2. Procedure
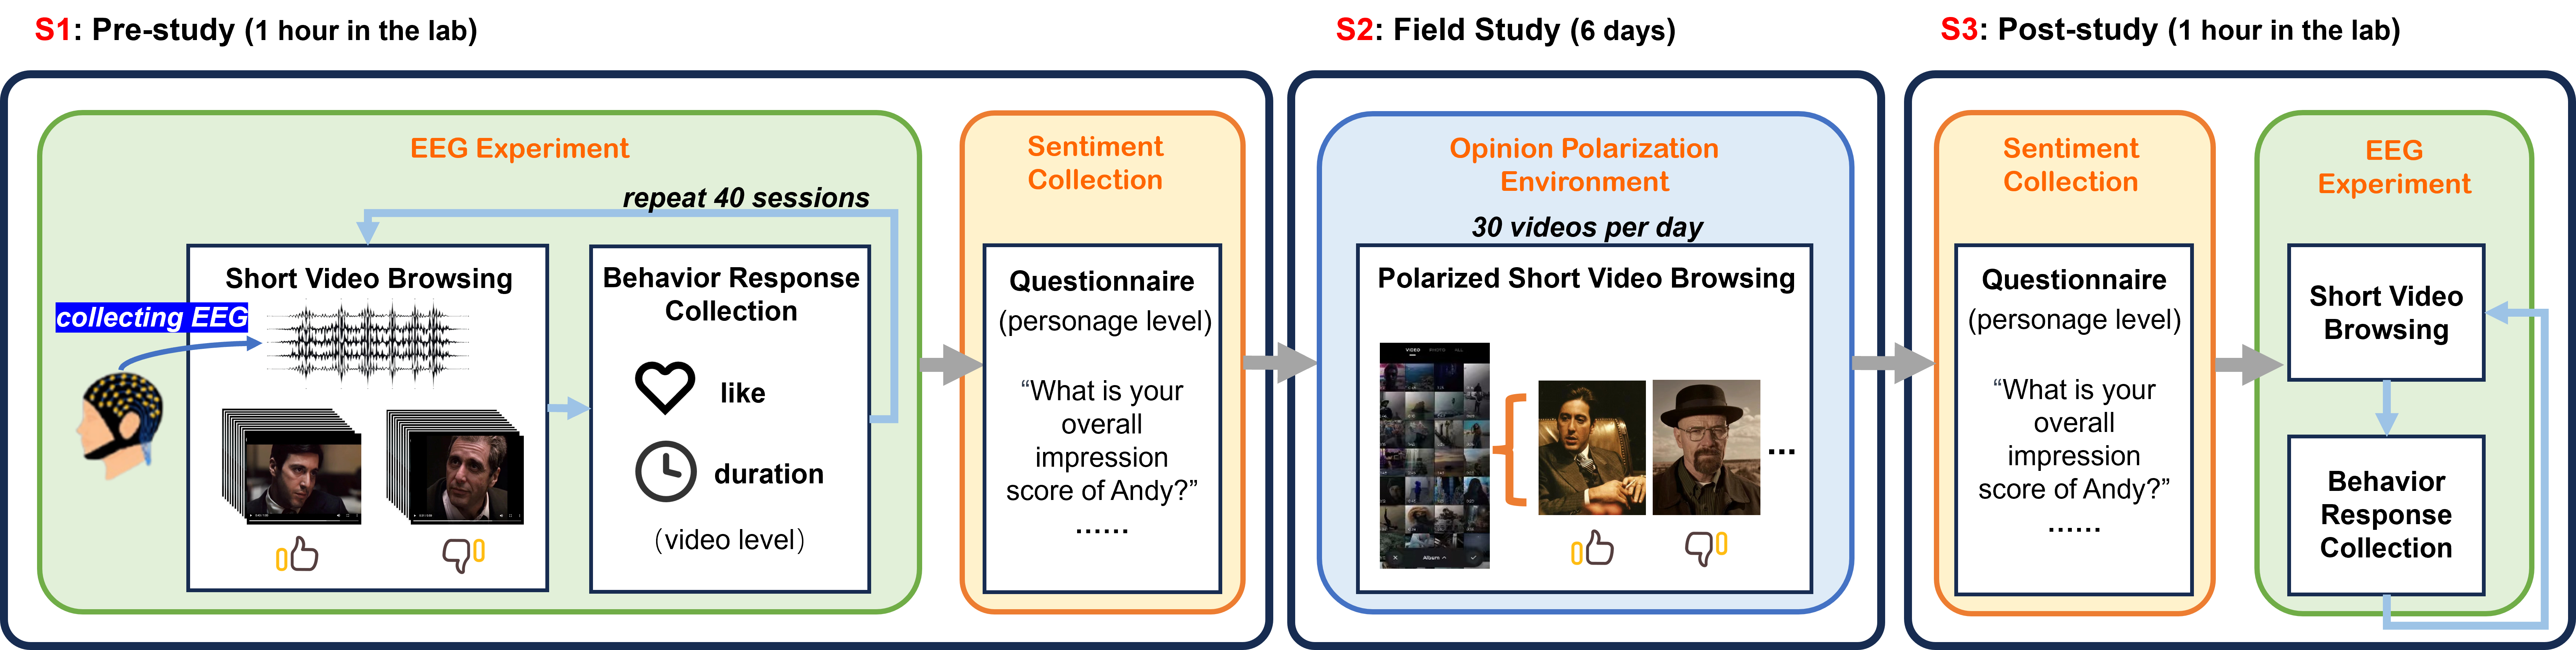
The procedure of our user study is shown in Figure 1. Our experiment contains three stages: pre-study, field study, and post-study.
Pre-study. The goal of the pre-study is to collect participants’ initial opinions and their brain signal patterns when watching the video of different personages. Specifically, we collected the participants’ brain signals with an EEG device. In the pre-study stage, participants were asked to first go through a brief training process to ensure that they were familiar with the Platform and understand the experiment procedure. As the experiment officially started, participants were instructed to stay relaxed throughout the process and avoid large physical movements or frequent blinking to minimize potential noise interference with EEG signals.
Each participant was required to watch 40 videos, each lasting one minute. These 40 videos included 20 videos about specific personages, which we refer to as the personage-type videos, and 20 extracted from SEED-IV (Zheng et al., 2018) (a well-known dataset for sentiment analysis), which we refer to as the SEED videos. The SEED videos serve as “distractors” to prevent the participants from identifying the goal of our study at the beginning of our experiments, otherwise, they could manipulate the experiment results intentionally. Note that, after the whole experiment procedure, we explicitly informed the participants about our experiment objectives and let them decide whether we could use their data for future analysis to avoid potential ethical risks. Each personage-type video talks about one personage, and there were 10 personages involved in our experiment in total. Specifically, in the pre-study stage, each personage was associated with two videos: one presenting a positive opinion and the other a negative opinion. Each video is 60 seconds in duration. The first 30 seconds are presented, after which users are allowed to skip the rest of the video via a button click. All participants watched the same group of videos, but the order in which the videos were presented was randomized for each participant.
After the EEG experiment, as depicted in Figure 1, participants were instructed to complete a questionnaire. The questionnaire comprised 40 items, with 20 questions about 10 distinct personages. For each personage, participants were asked to (1) provide a sentiment score from 1 (poor impression) to 5 (excellent impression) for each personage, expressed as ”Intuitively, what is your overall impression score of [the personage]?” (2) rate their familiarity from 1 (strongly disagree) to 5 (strongly agree) with each personage, phrased as ”Do you consider yourself well-acquainted with [the personage]?”. The remaining 20 questions focus on the content of the background video and are unrelated to the selected experimental personages, with the same 1-5 scale. For example, “How would you rate Jackie Chan’s performance in ‘The Accidental Spy’?”. These distractors help us prevent the participants from identifying the objective of our experiment and manipulate their responses on purpose. Questions in the questionnaire are randomized to mitigate the potential order effect.
Field Study. To investigate the impact of opinion polarization (OP) on individuals, in the field study, we constructed two types of environment bias for each personage used in the pre-study stage: one fostering a positive opinion and the other a negative opinion. Each of the ten target personages a participant encountered was randomly assigned with environmental bias. If a personage’s association with a participant falls under the positive/negative opinion environment, all the videos related to the personage presented to the participant during the field study would portray a favorable/adverse stance towards that target personage.
During the field study stage, participants were required to log in daily to a designated account to browse short videos. Each participant was required to watch 30 one-minute videos daily. Among these videos, 10 videos talked about 10 different target personages, each conveying either a positive or negative opinion about the respective personage. The remaining 20 videos were unrelated to the personages, aiming at preventing the participants from focusing excessively on any single personage and creating a more realistic information environment. The sequence of these 30 videos was randomized for each participant. The likes and viewing duration for each video playback were recorded.
To ensure that participants carefully watched videos in the field study, each day, a simple question related to the content of that day’s videos was sent to the participants. The questions were straightforward and could be answered easily if the participants had watched the videos. For example, “Have you watched any content related to ‘The Hulk’? Please describe the main plot”. In our experiments, all participants correctly answered the daily questions. The Field Study began on the day following the completion of the pre-study and extended over six days.
Post-study. The post-study consists of a questionnaire and an EEG experiment. Both steps resemble the procedures elaborated in the pre-study. The only difference between the pre-study and the post-study is the timing of the questionnaire. In the pre-study, questionnaires were given after the EEG experiments, while in the post-study, they were given before them. This ensured that any differences observed between the two questionnaires were attributable solely to the field study and not influenced by the laboratory studies.
2.3. Participants and Ethics
Our study included 24 participants, who are active users of short video platforms, with ages ranging from 18 to 25 years. Participants comprised 13 males and 11 females from various academic backgrounds, including Computer Science, Environmental Science, Automation, and Life Sciences. All participants are right-handed and reported no history of neurological disorders, ensuring uniformity in terms of brain function and manual dexterity for the tasks involved in the study. Each participant was remunerated approximately 50 USD for their involvement.
This study has been reviewed and approved by the Department of Science and Technology Ethics Committee, Tsinghua University(THU01-20230221). We ensured the experiments were harmless to all participants. Participants were required to sign a consent form before the user study. The consent form detailed the nature and purpose of the study and emphasized the confidentiality and anonymity of responses. It also assured participants of their right to withdraw from the study at any point without any penalty.
2.4. Data Statistics
The collected dataset consists of 24 participants, among which one participant’s data was discarded for technical issues, yielding data for 230 user-personage pairs. Each pair includes EEG signals, behavior responses (i.e., like and duration) while viewing the video about the specific personage, and sentiment annotations on the personage.
3. Result Analysis
To comprehensively analyze the impact of opinion polarization in short video contexts, we conducted an analysis in Section 3.1 on “Explicit Feedback through Annotations”, which includes sentiment annotations (i.e., sentiment scores collected in the questionnaire) and behavioral responses (i.e., like rates and viewing duration ratios), and represented the findings in bar graphs. In Section 3.2, we focused on “Implicit Feedback through Brain Signals”. We explored the connection between opinion polarization and brain activity.
3.1. Questionnaire and External Behaviors
To more comprehensively analyze the impact of opinion polarization, we examined sentiment annotations through the questionnaire and analyzed external user behaviors.
3.1.1. Sentiment annotations on personages before and after the field study
To examine the influence of Opinion polarization (abbreviated as OP hereafter) on user sentiment, sentiment scores for each personage were obtained from participants before and after the field study through questionnaires, using a five-point Likert scale. Control sentiment data were also gathered for each distractor, which consisted of questions about entities not included in the field study.
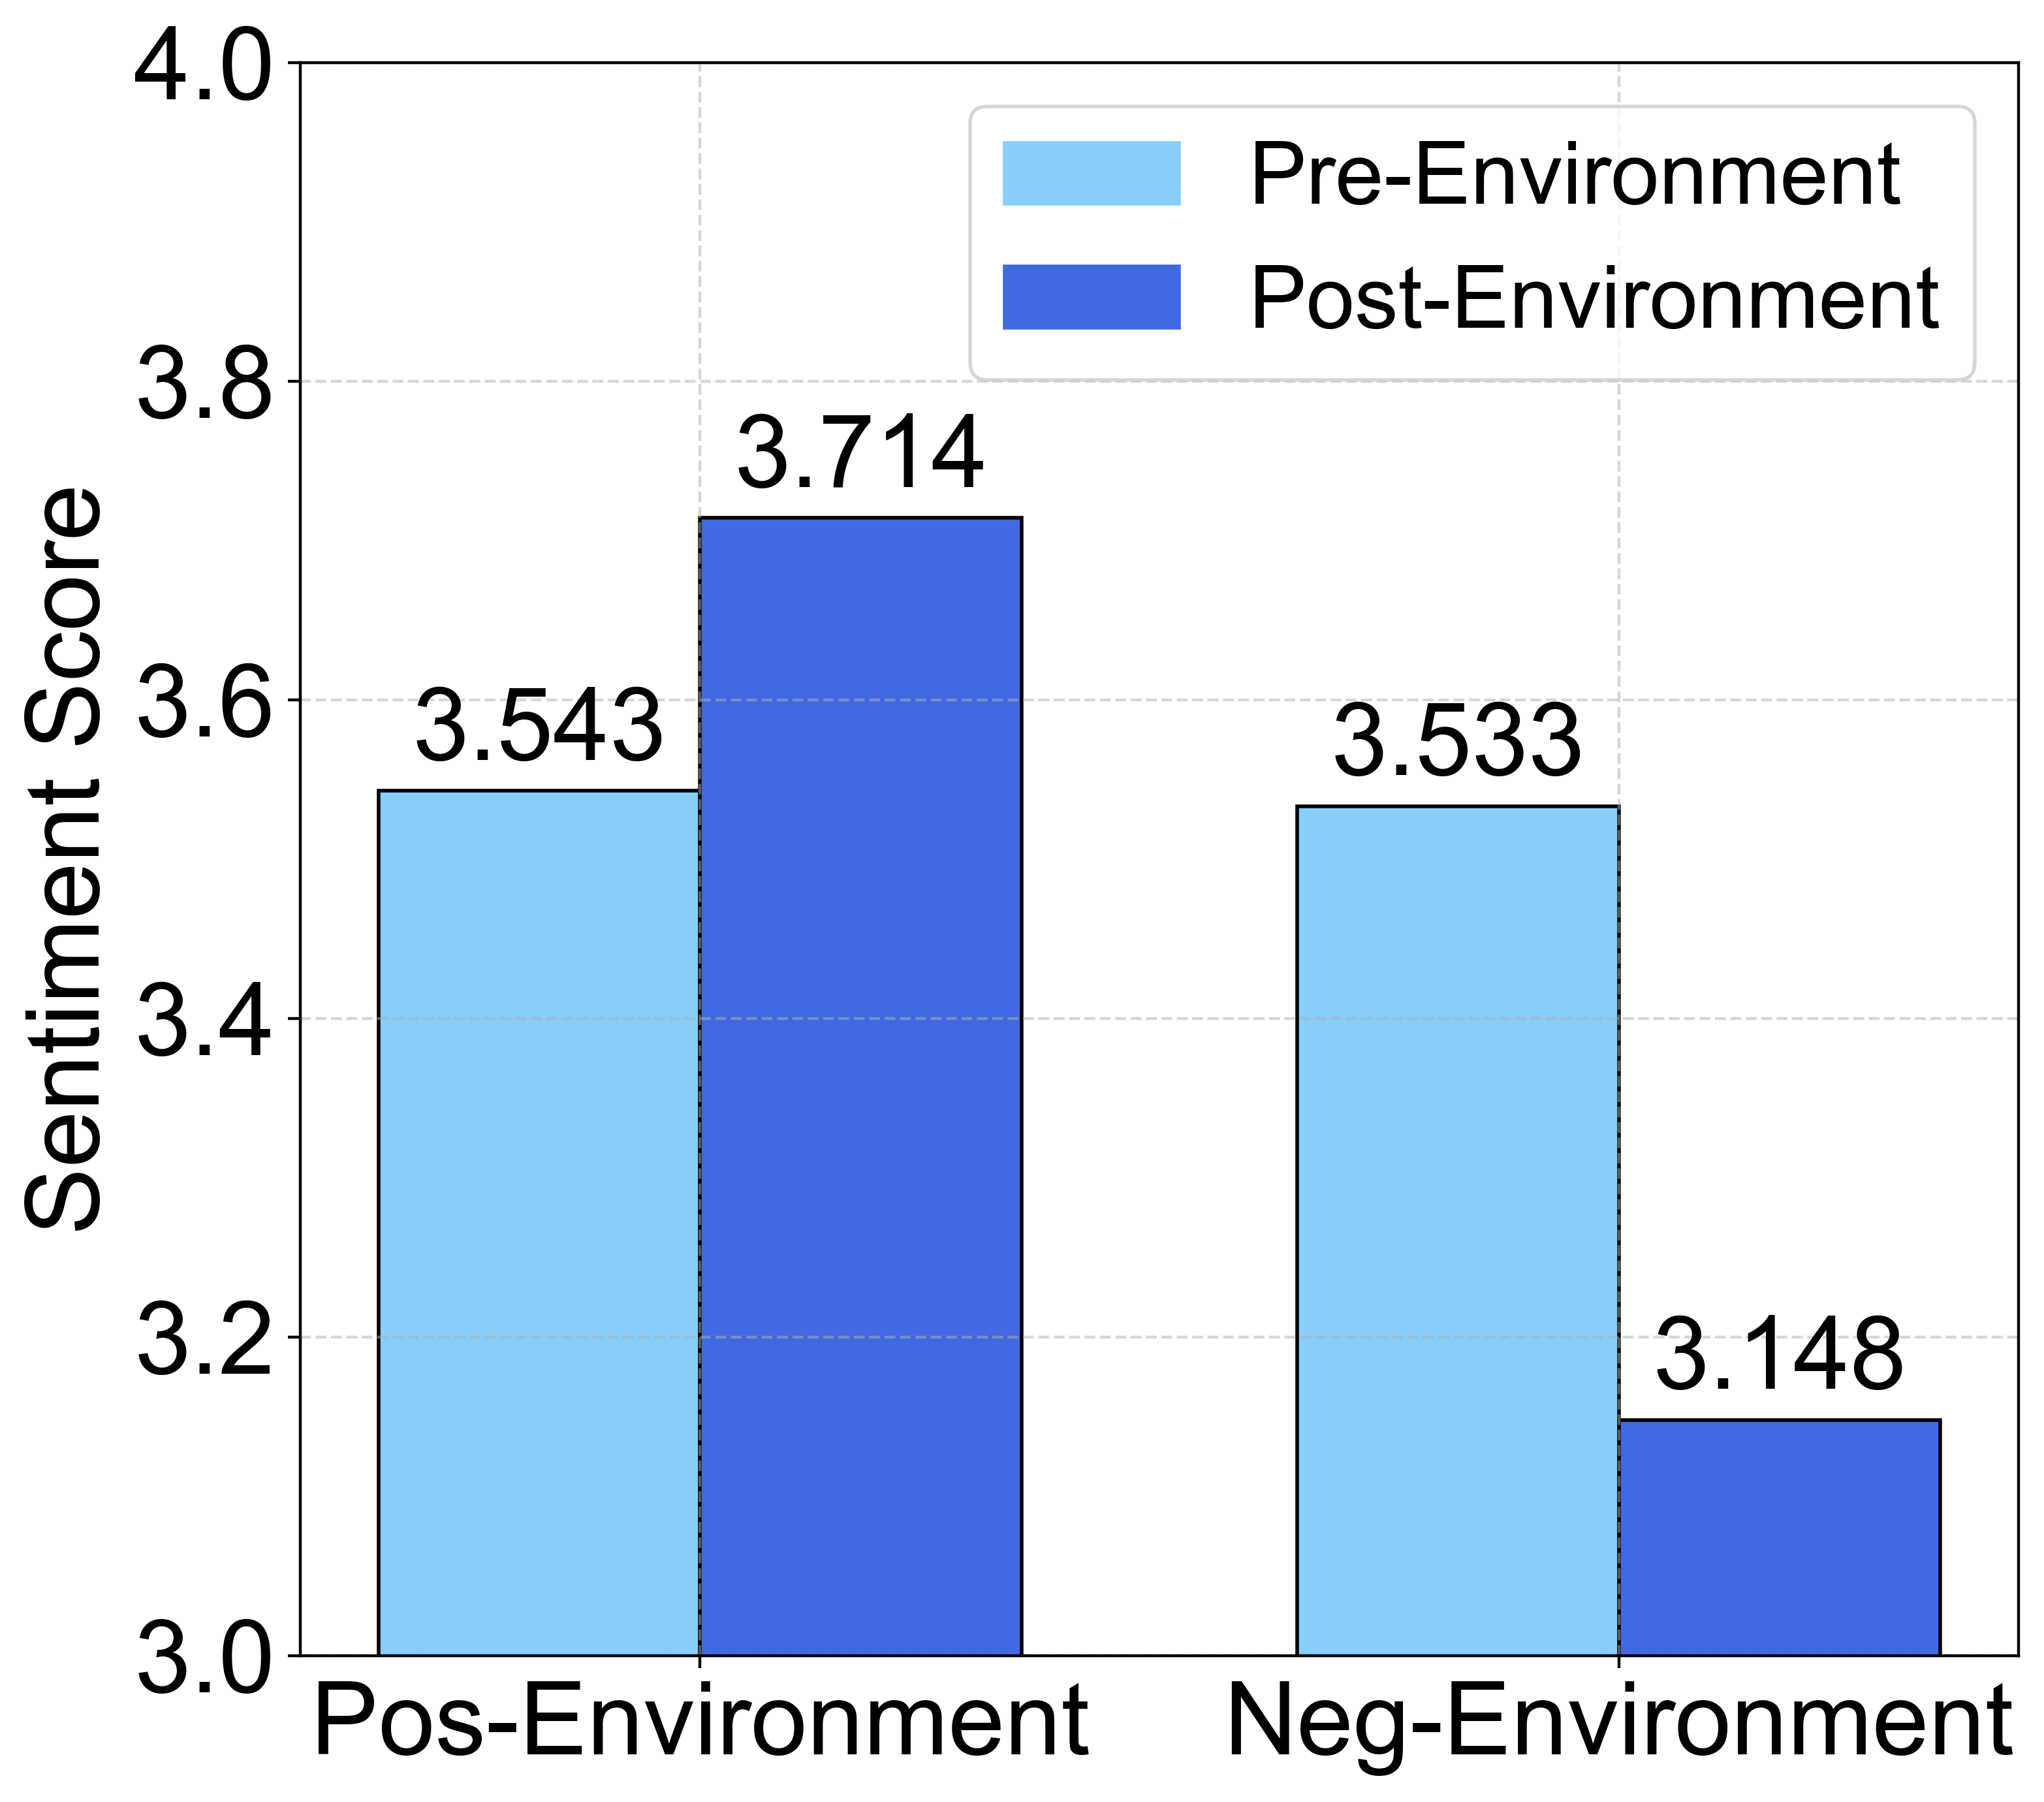
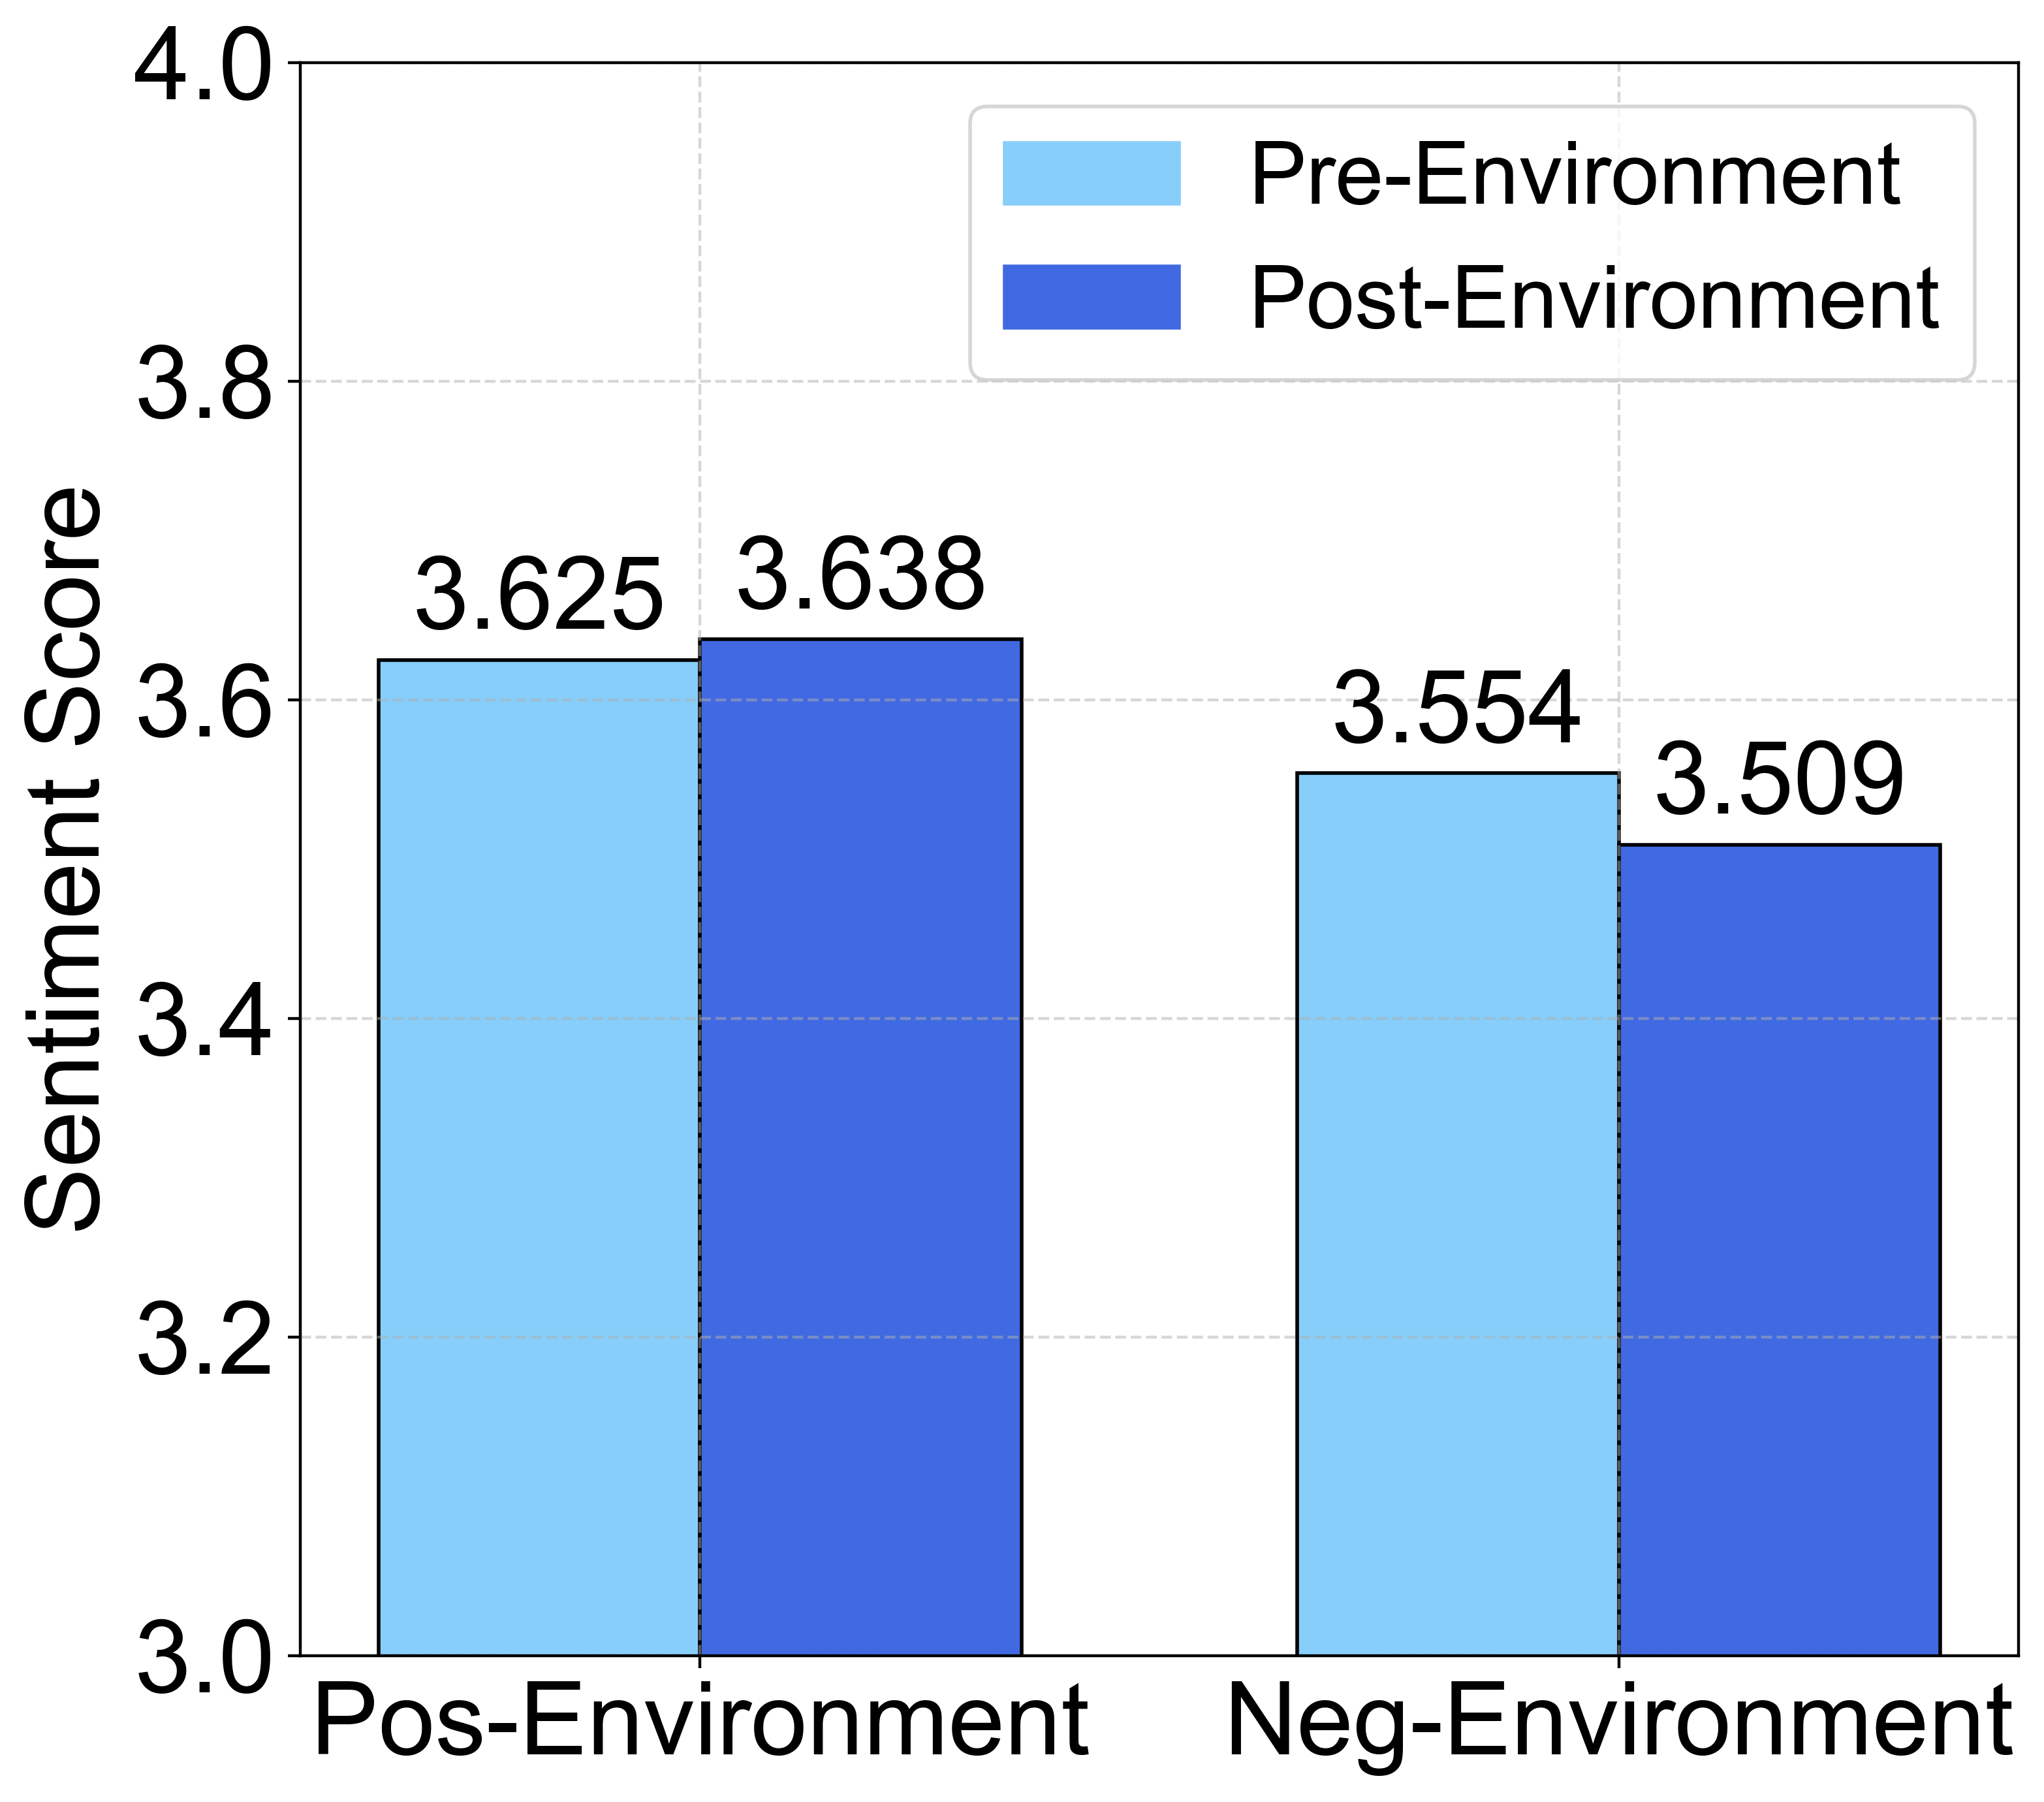
The average sentiment scores across participants for all personages in both pre- and post- polarized environments were calculated, shown in Figure 2. There are two kinds of polarized environments: i.e., positive and negative. Before exposure to polarized environments, there is no significant difference in terms of averaged sentiment scores between the two environments(i.e., 3.543 and 3.533). Sentiment scores significantly increased in the positive opinion environment, rising from 3.543 (Pre Positive, i.e., before exposing to the positive opinion environments in the field study) to 3.714 (Post Positive, i.e., after exposing to the positive opinion environment in the field study). Conversely, in the negative opinion environment, scores notably decreased, dropping from 3.533 (i.e., Pre Negative) to 3.148 (i.e., Post Negative). On the other hand, the sentiment scores of background video (i.e., the distractors), showed no significant change before and after the study. These observations indicate that the polarized environment could significantly affect users’ sentiment judgment towards personages.
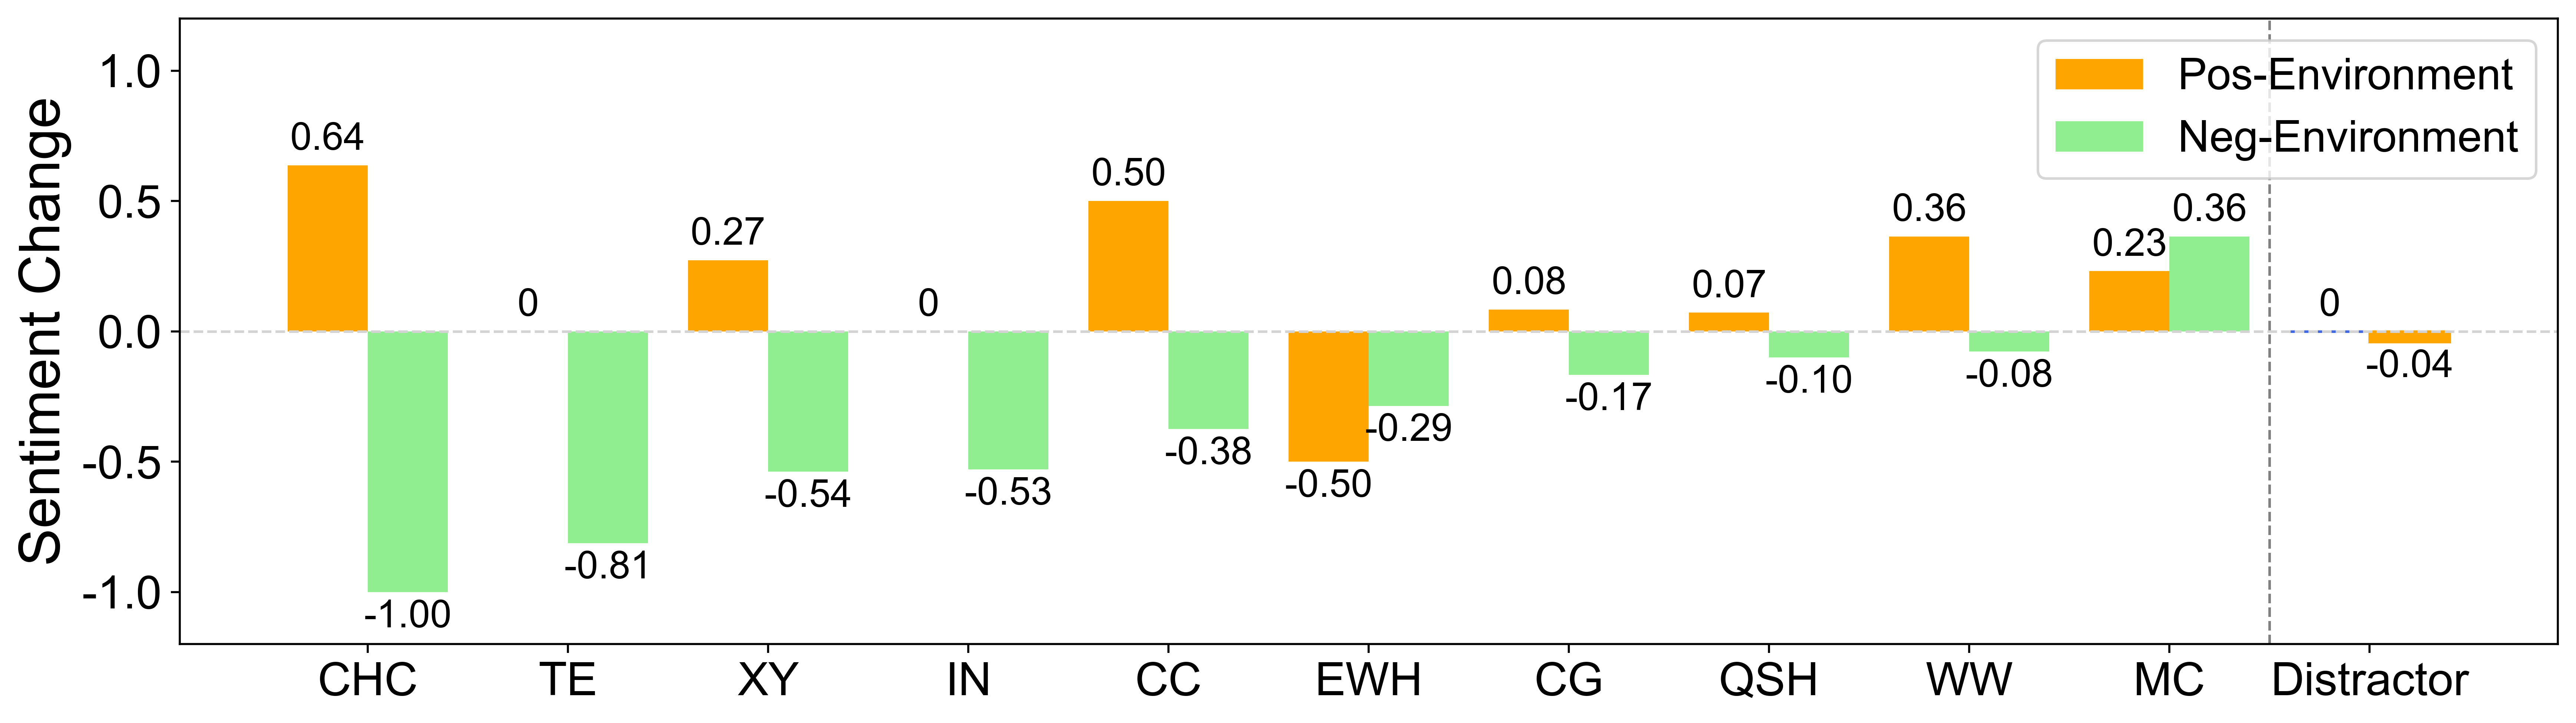
To illustrate the impact of OP on the sentiment judgment of different personages, we computed the change in sentiment scores pre- and post-exposure to the polarized environment (i.e., before and after the field study) for each personage. We found a significant difference (p=0.0153 ¡ 0.05) in sentiment change between positive and negative environments. As shown in Figure 3, for personages Christopher Columbus (CHC), Thomas Alva Edison (TE), Xiang Yu (XY), Isaac Newton (IN), Cao Cao (CC), Catherine the Great (CG), Qin Shi Huang (QSH), and Walter White (WW), pos-environment cause a positive sentient change, and neg-environment cause a negative sentiment change. However, personages Emperor Wu of Han (EWH) and Michael Corleone (MC) exhibit different sentiment changes in positive and negative environments, respectively. Further, an analysis of three experts’ annotations on video opinions showed varying consistency scores (i.e., kappa scores) among personages. Notably, Emperor Wu of Han (EWH) and Michael Corleone (MC) demonstrated lower consistency than other personages, possibly accounting for their anomalous sentiment changes. Details of video annotation consistency scores for all personages are included in Appendix A.4.
3.1.2. Behavior Response during short video browsing
We analyzed the collected behavioral data, including likes and viewing durations. The like rate and viewing duration ratio are calculated as follows:
| (1) |
| (2) |
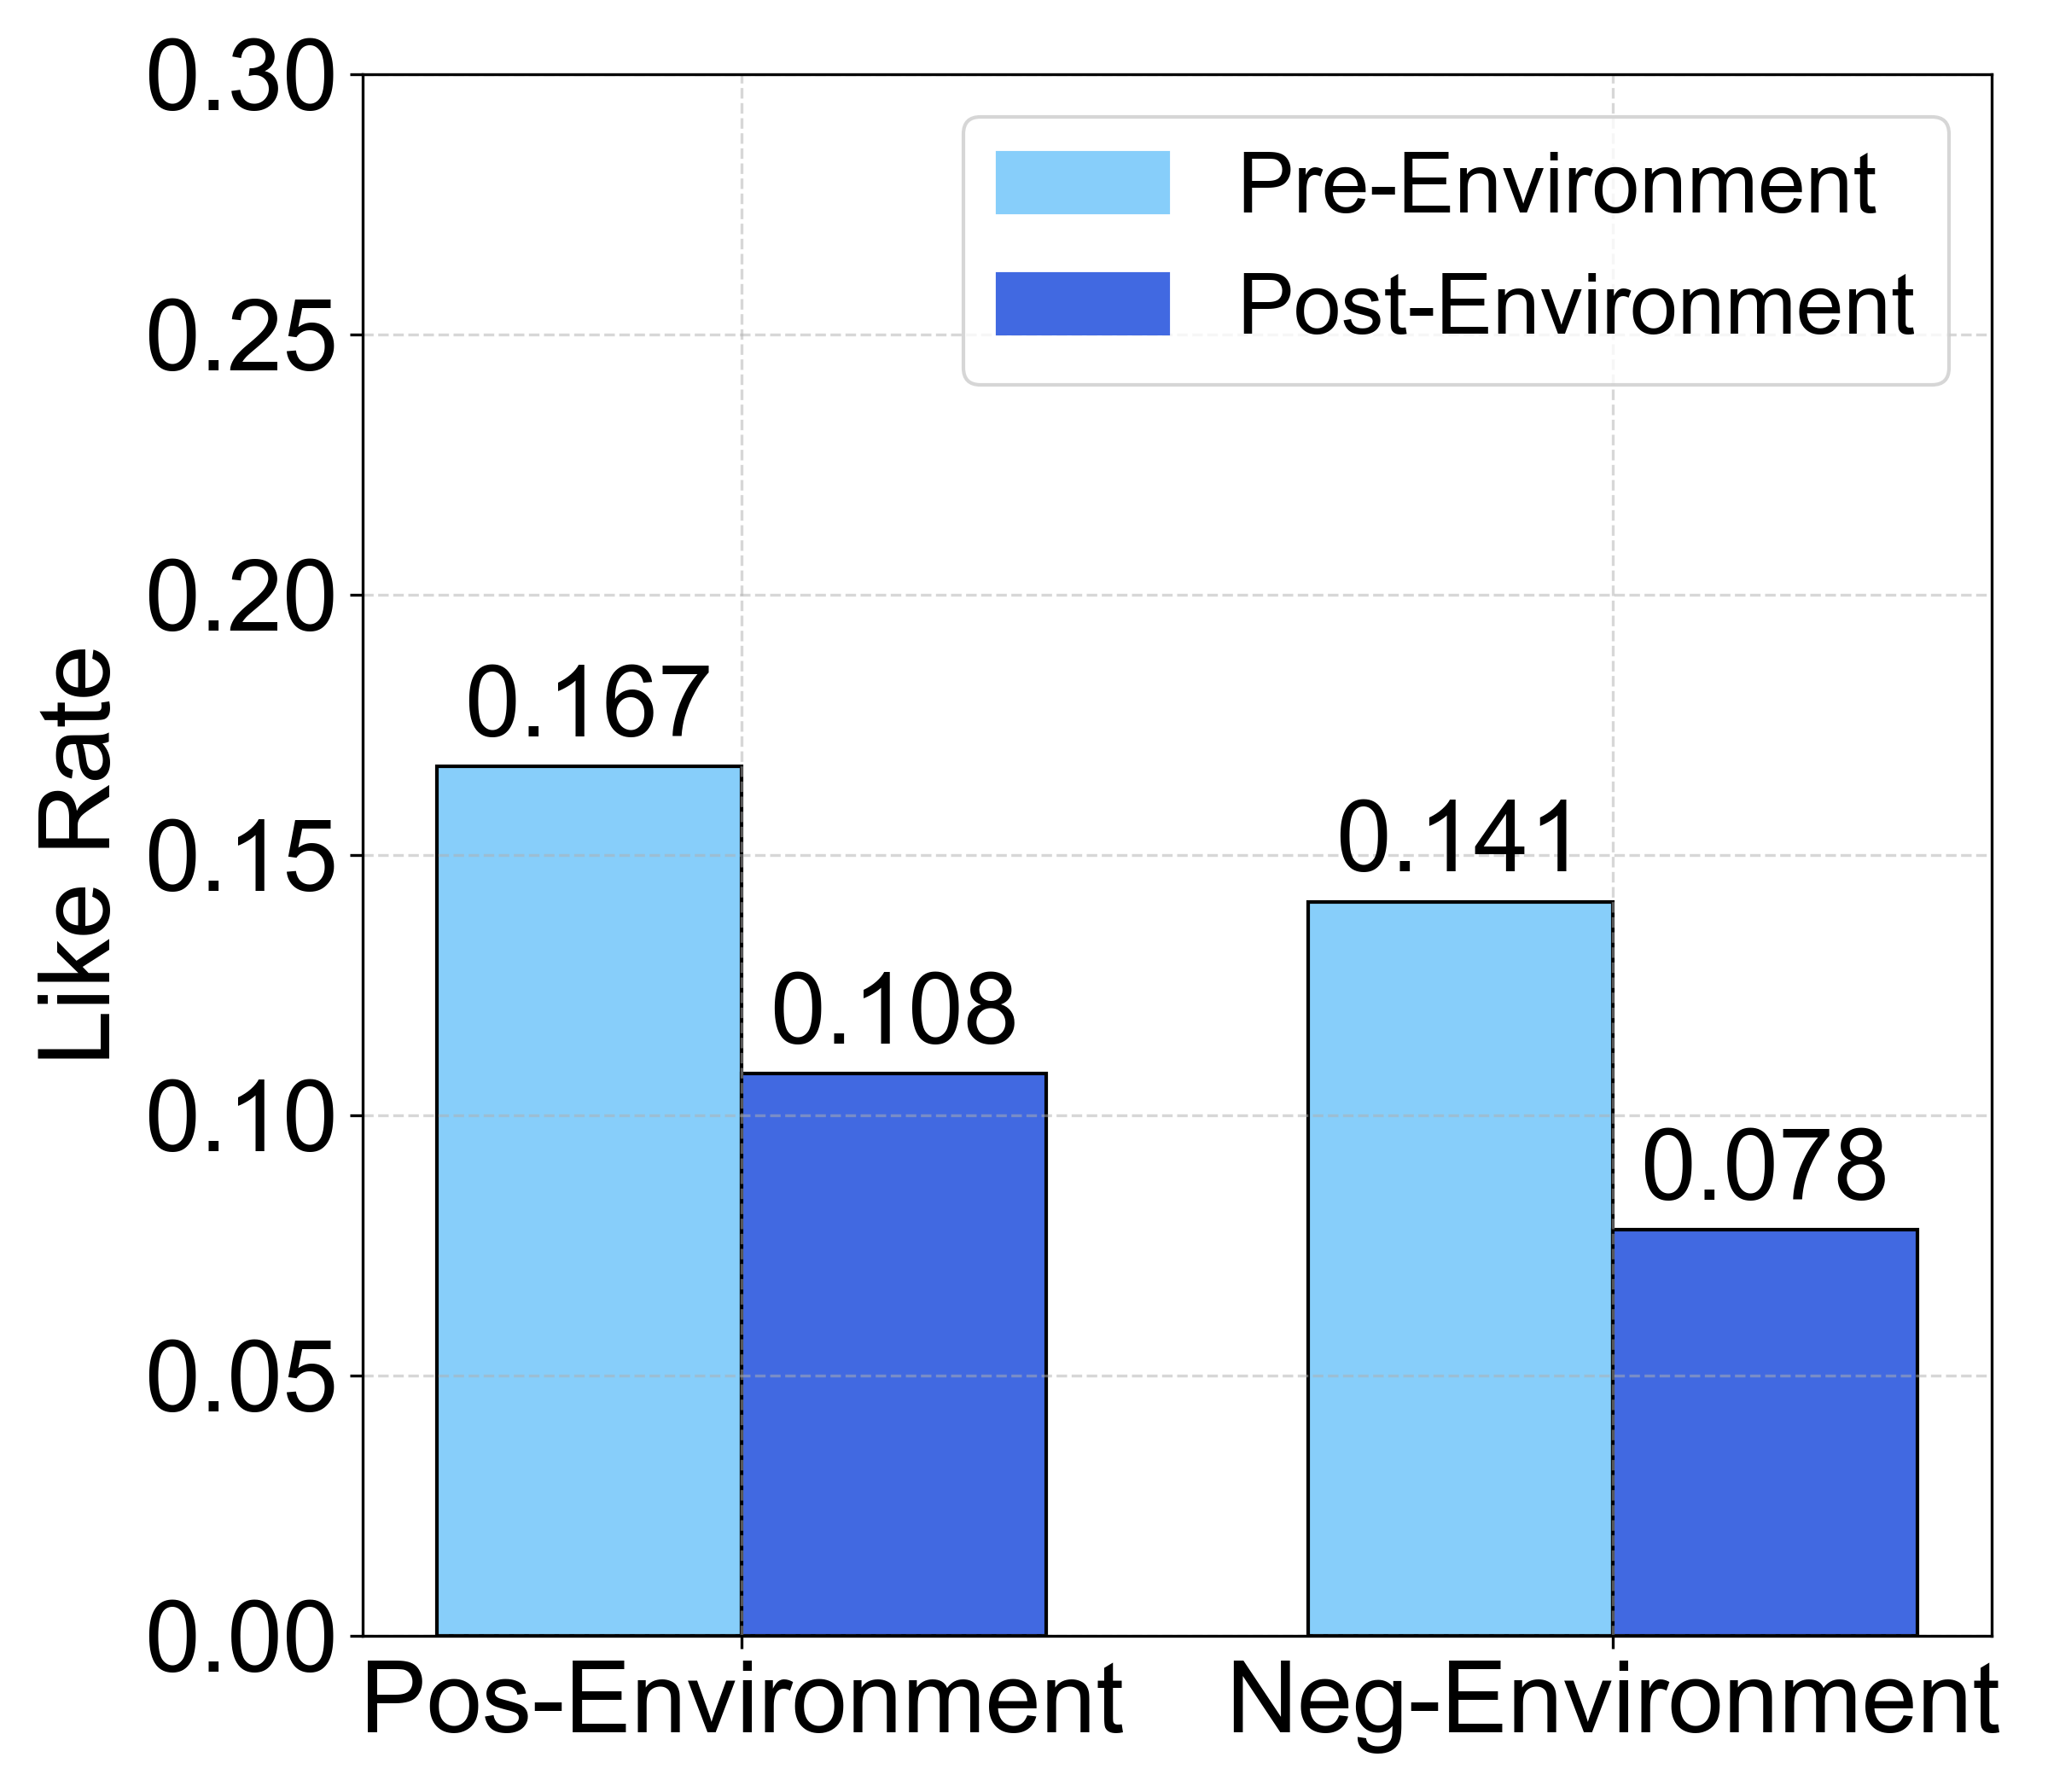
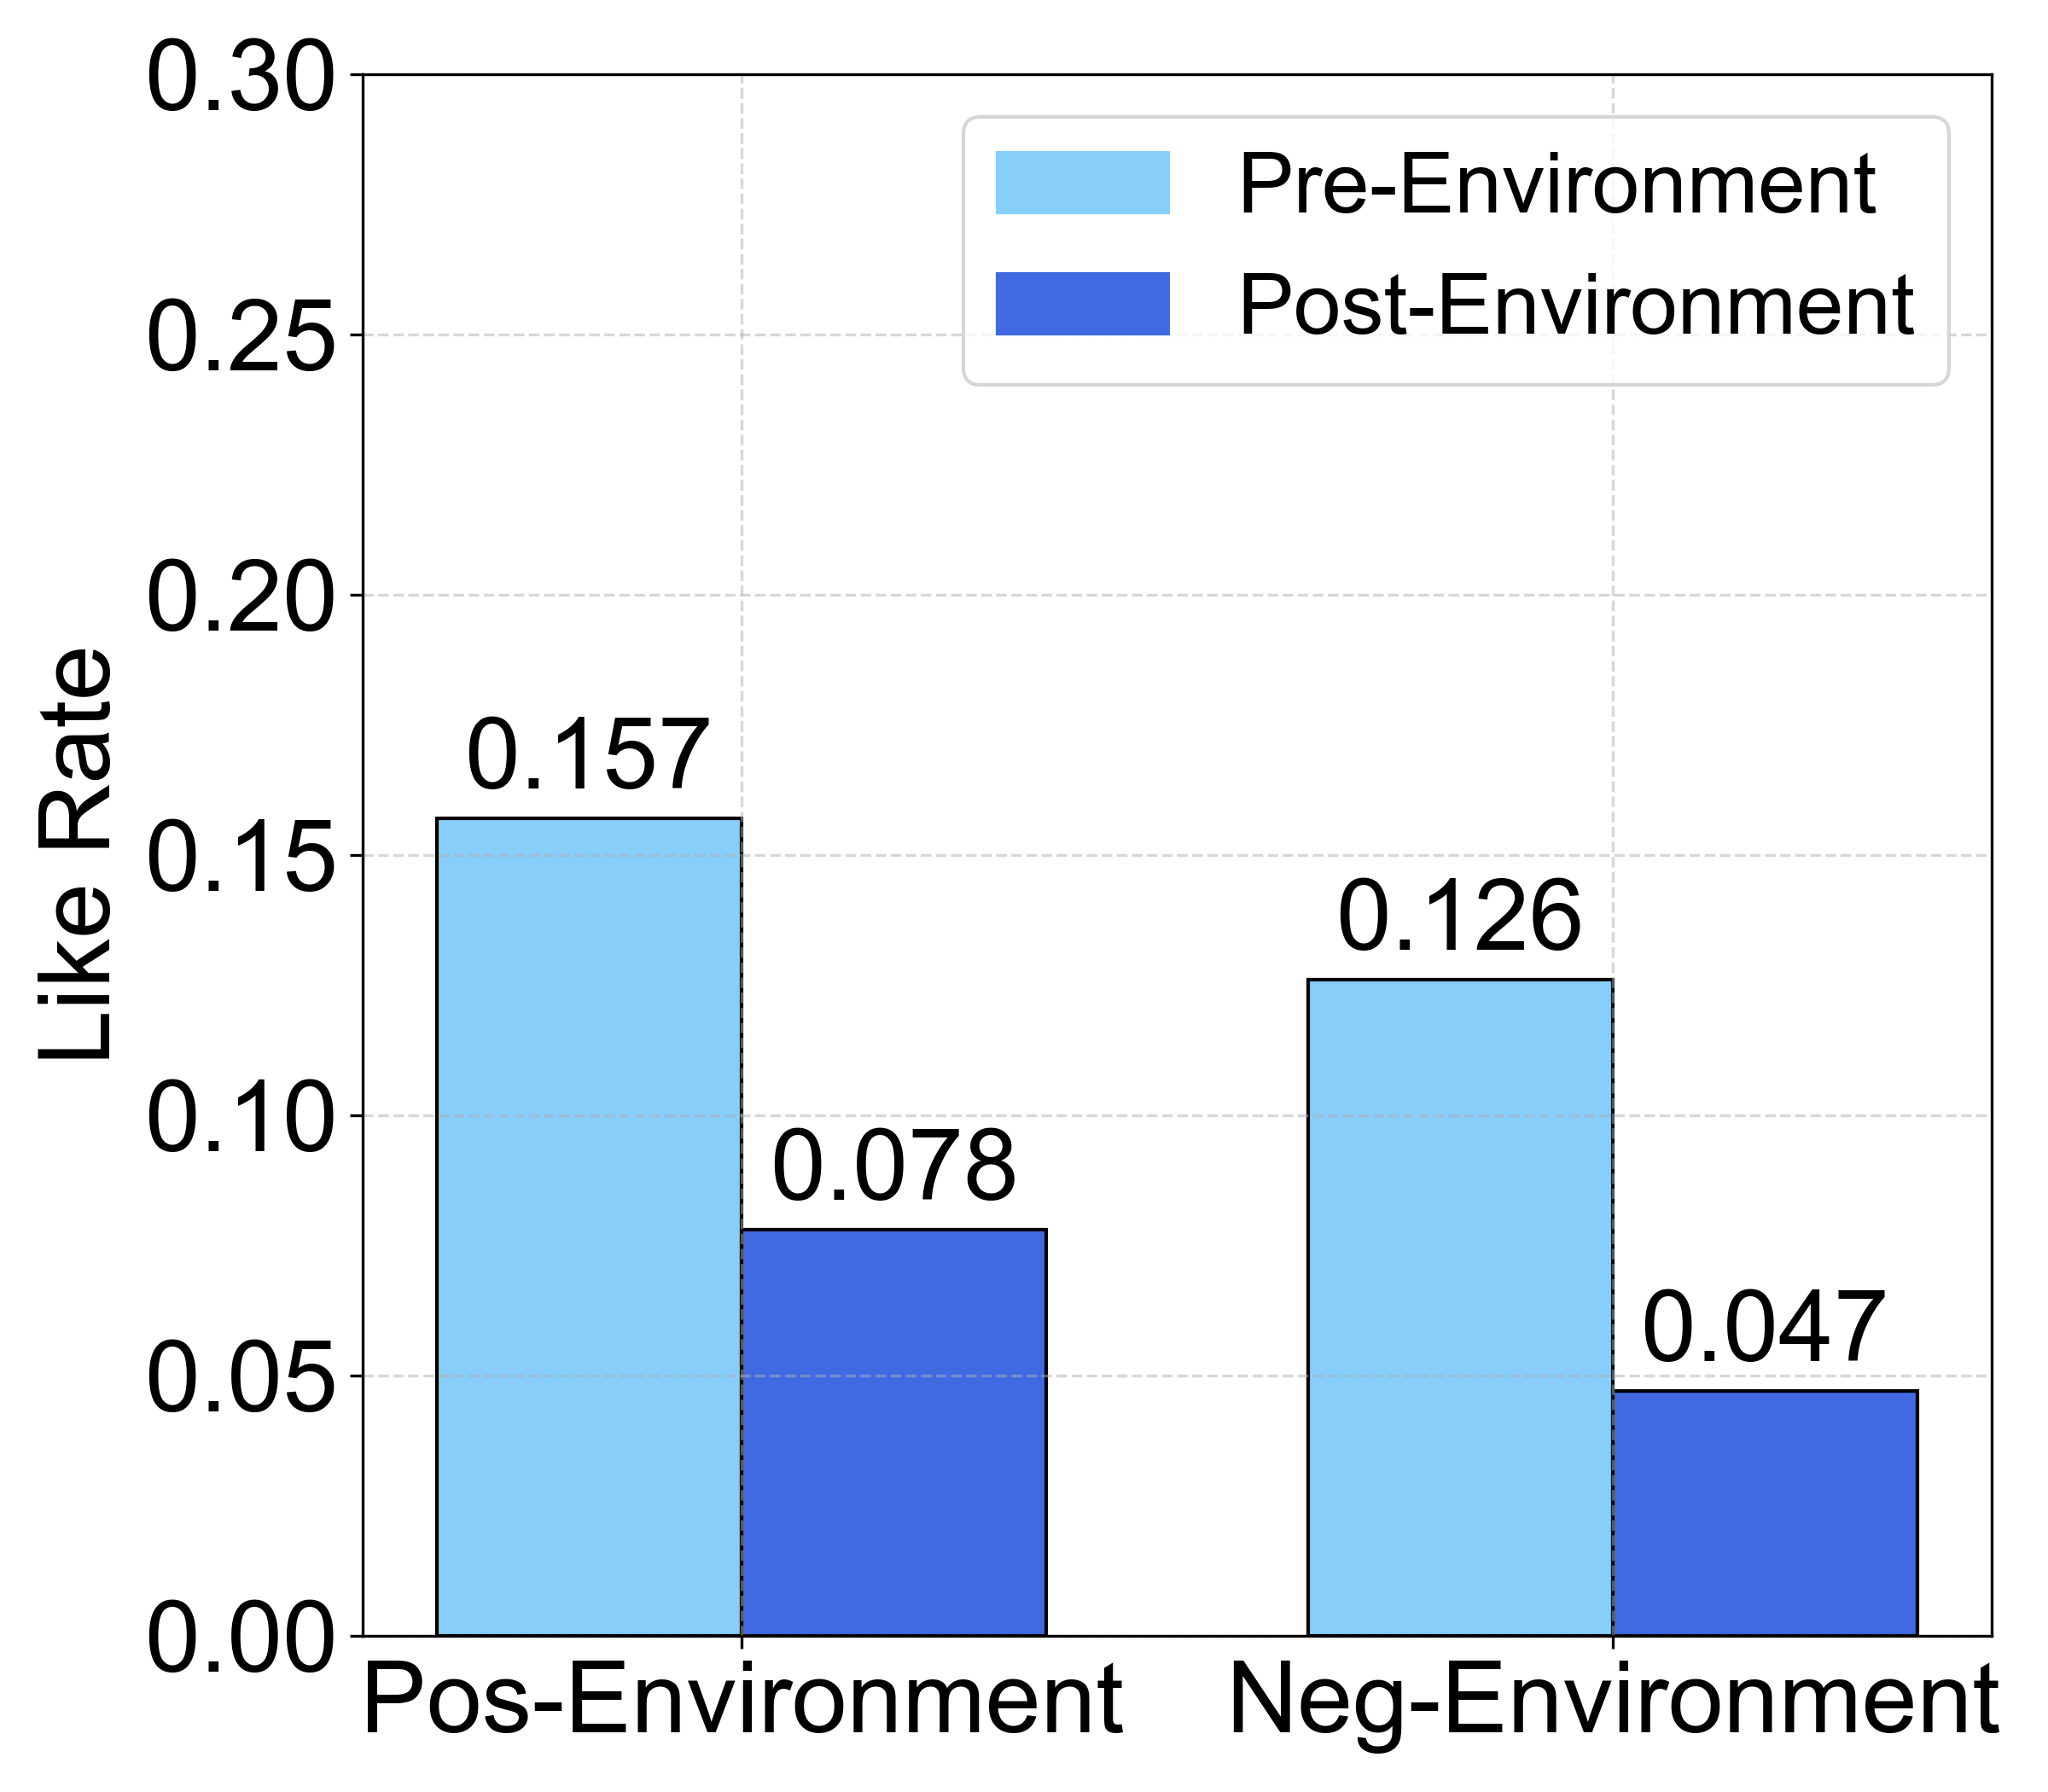
Figure 4 illustrates a significant decline in the like rate when users, following exposure to either positive or negative opinion environments, watch videos with both positive and negative opinions. This indicates a diminished user interest in monothematic videos. A comparison of the two polarized environments’ impacts revealed no significant difference in the like rates between positive and negative influences. This might suggest that like data, traditionally used as a behavioral metric, are less effective in probing OP’s impact on users

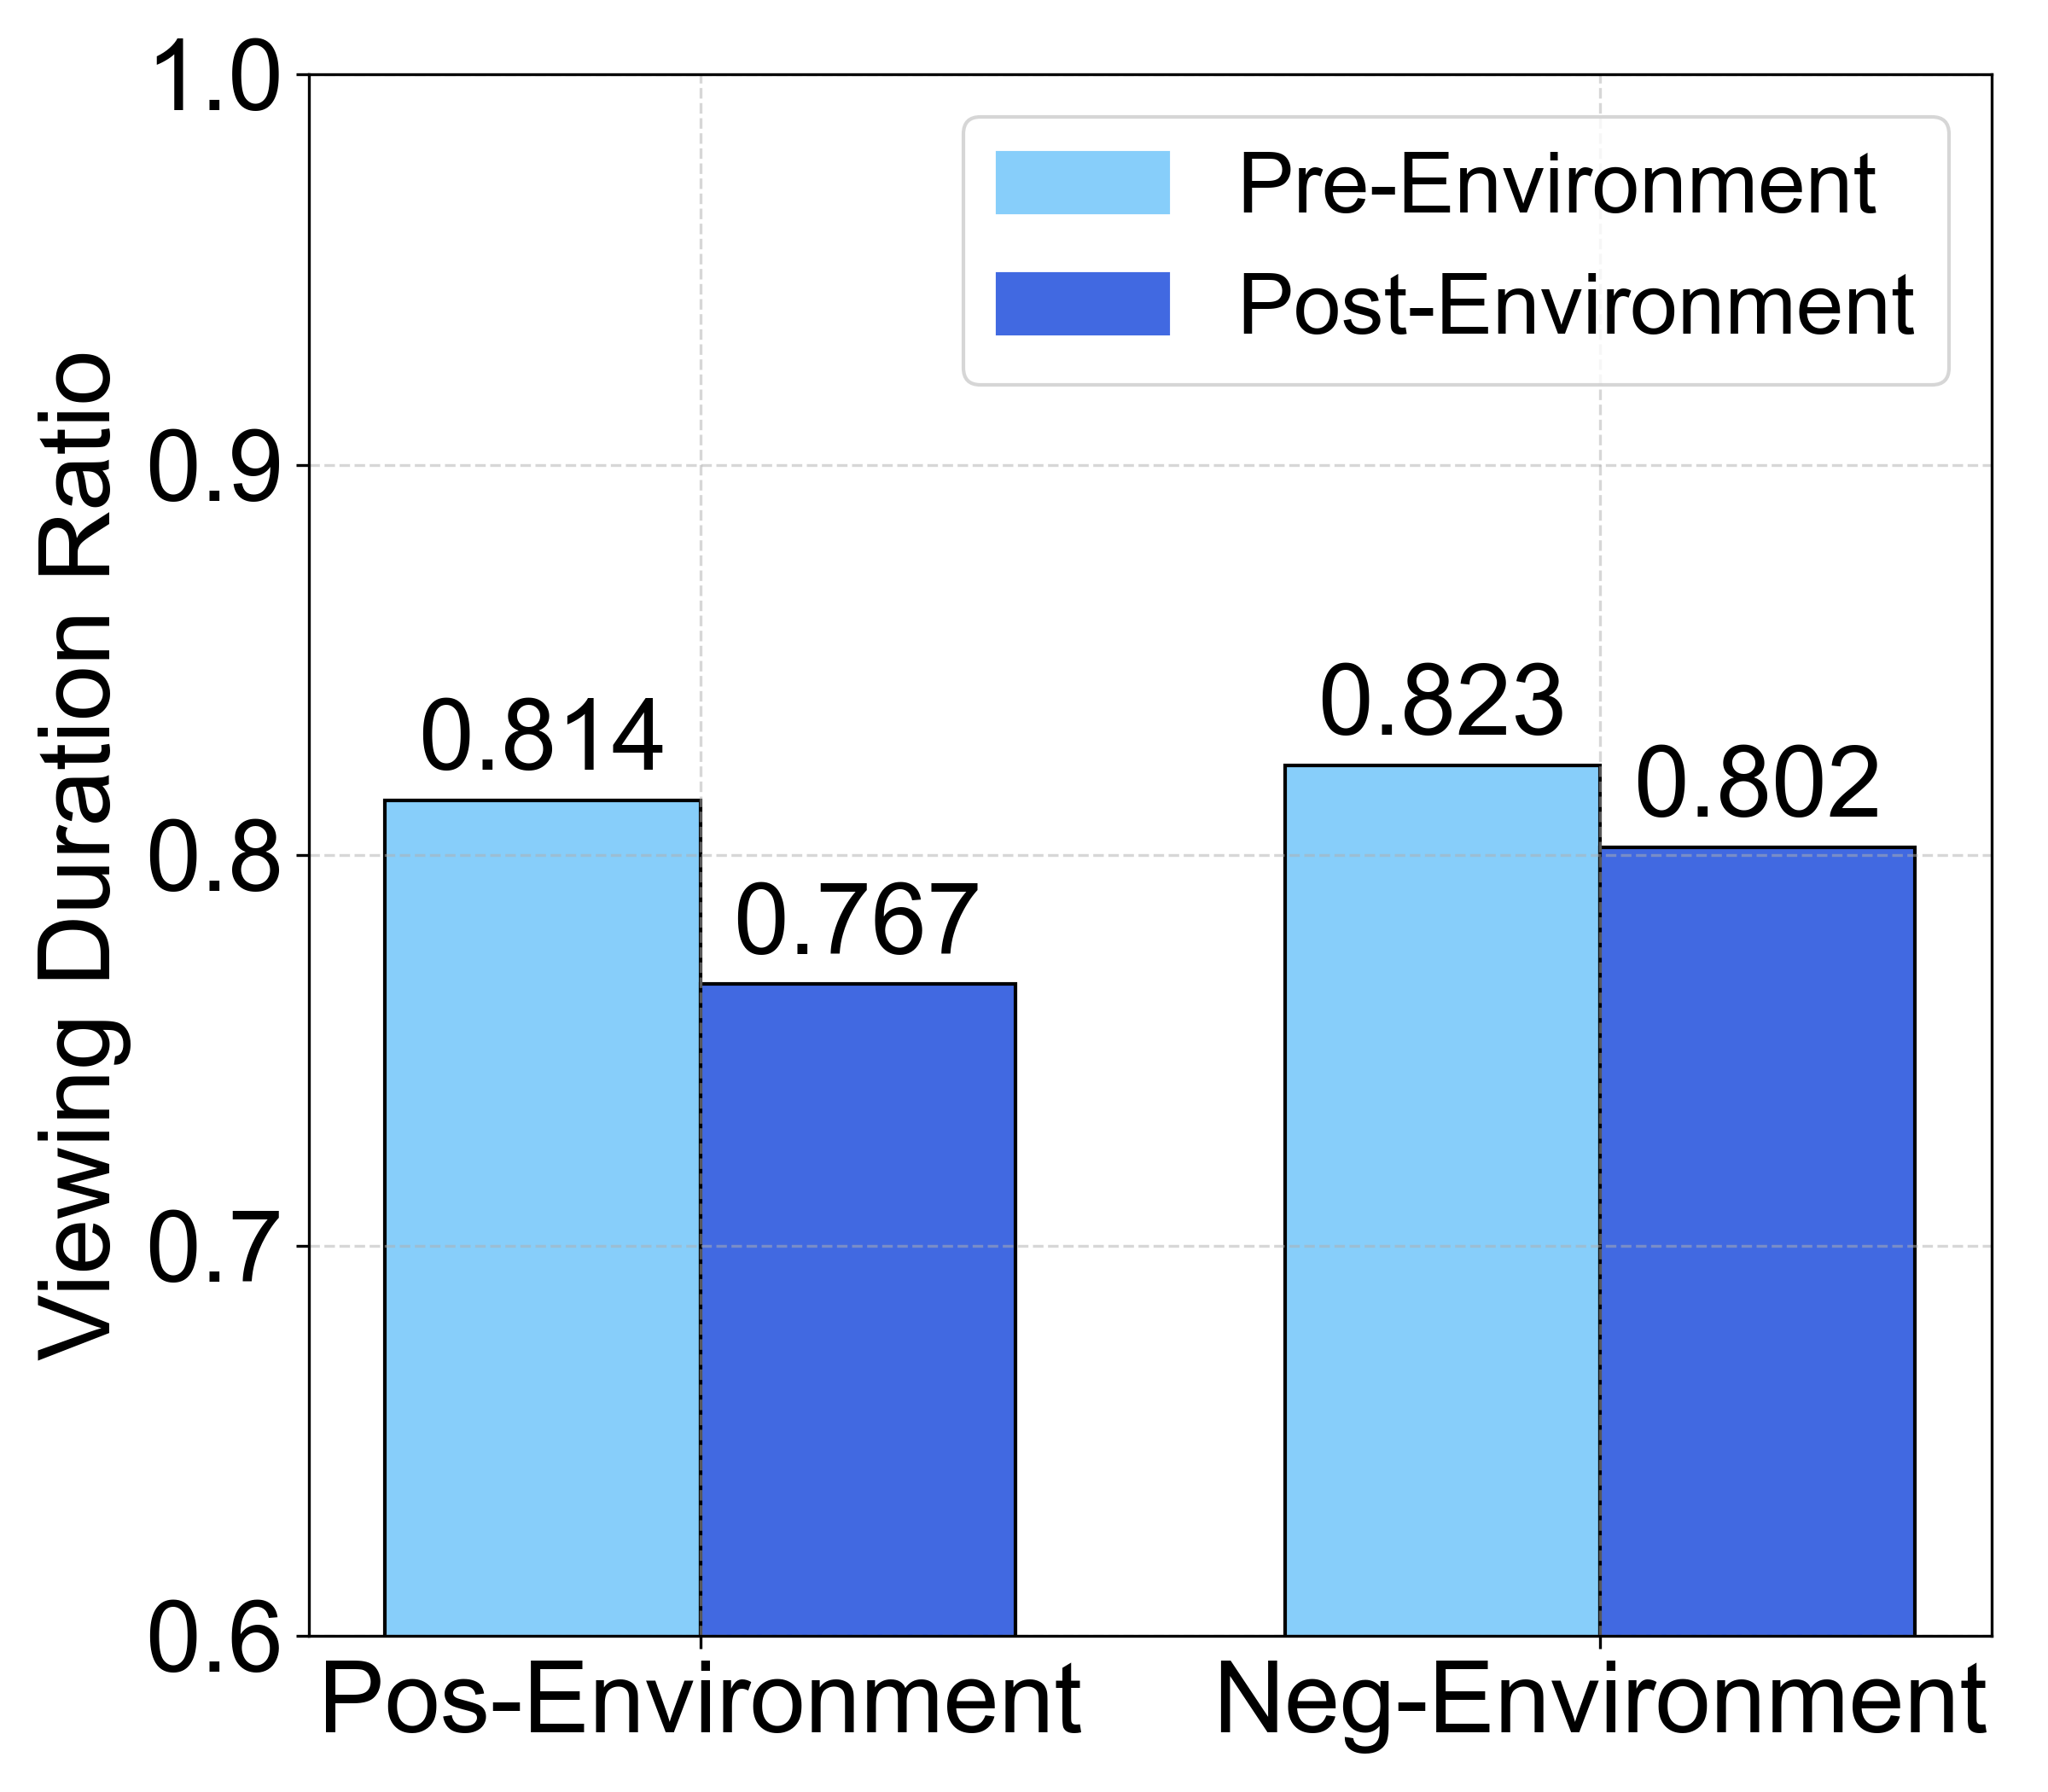
As shown in Figure 5, the viewing duration ratio, averaged for positive and negative polarity videos, ranges from 0.5 to 1.0 minute, as the users are allowed to skip a video after 0.5 minutes and the total duration of each video is 1 minute. From Figure 5, we observe that post-exposure to a positive opinion environment, the viewing duration ratio for both positive and negative opinion videos marginally decreased. In summary, relative to sentiment score graphs, the viewing duration ratio did not exhibit a notable difference in the influence of positive versus negative opinions on users.
Answer to RQ1:
Sentiment score analysis reveals that opinion polarization significantly influences user sentiments, making them more aligned with the prevailing opinions of the environment. On the other hand, the user behavior data (like and viewing duration) has a relatively smaller effect associated with polarized environments. This implies that sentiment scores potentially offer a more accurate reflection of the impact of OP than conventional behavioral metrics.
3.2. Brain Signals
3.2.1. Neural Correlates of Opinion Polarization in EEG
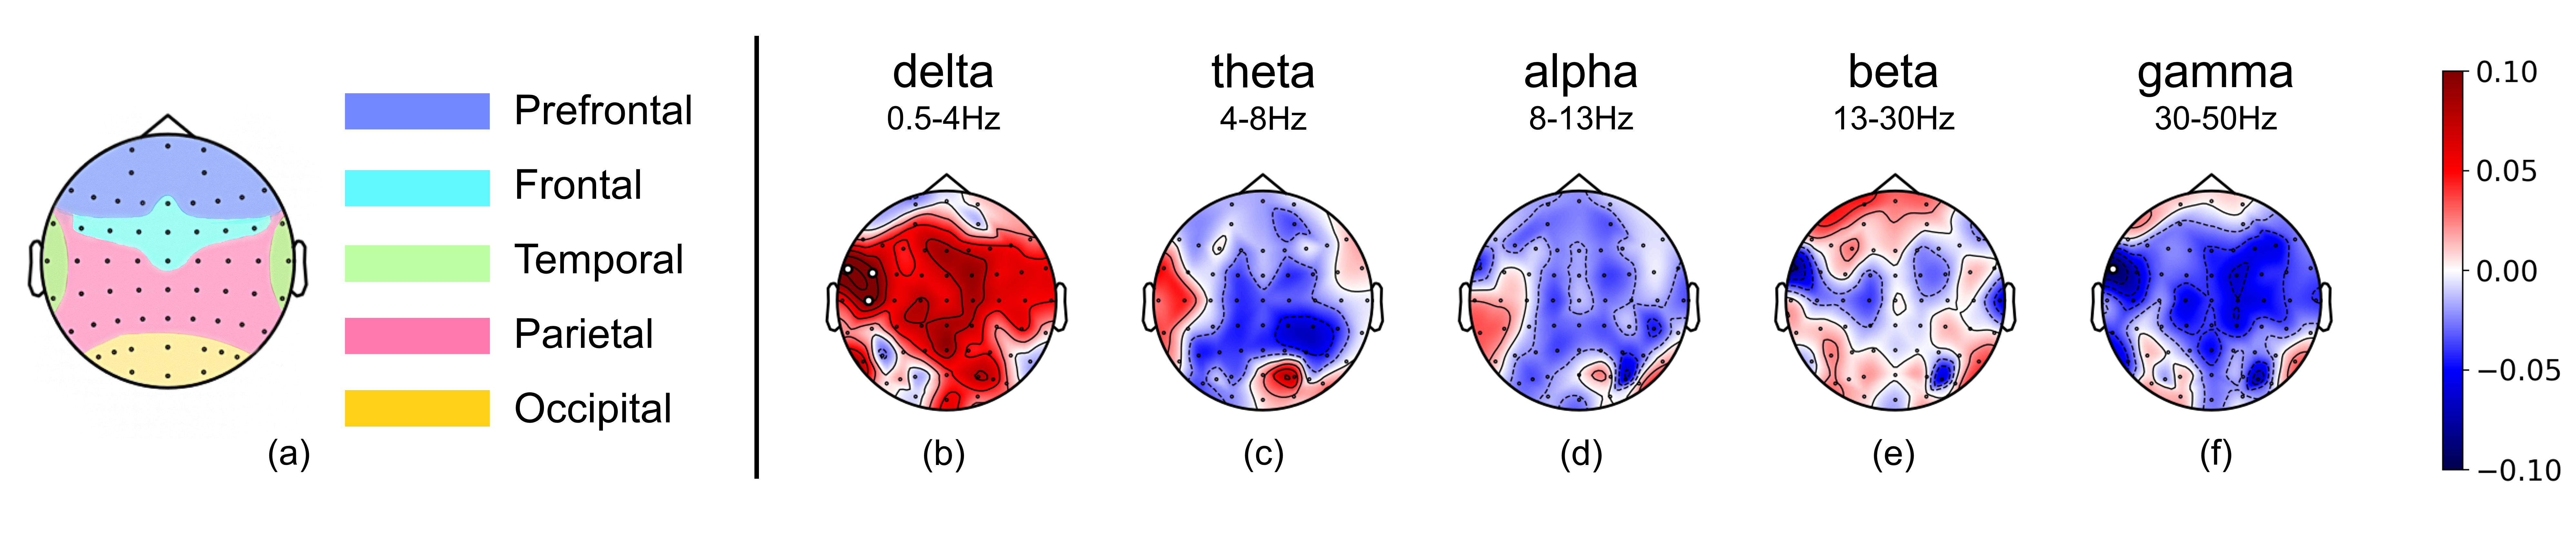
To investigate the relationship between EEG signals and opinion polarization, we calculated the Pearson correlation coefficients between the Differential Entropy (DE) feature of EEG and the OP for each user-video pair. Specifically, we assessed the correlation between OP environments (positive or negative) in the field study and the EEG signals collected during the post-study. For each user-video pair, we averaged the DE feature across all frequency bands and electrodes and then computed the Pearson correlation coefficients (He et al., 2023; Schober et al., 2018).
Figure 6 (b-f) presents the correlations between OP environments and DE. In the delta frequency band, a relatively strong positive correlation exists between positive OP environments and EEG signals, suggesting that positive environments may enhance low-level EEG activity in the Delta band. Conversely, negative OP environments are associated with a strong negative correlation in the Delta band with EEG signals. Existing research has highlighted an increase in delta wave activity in the frontal lobe during unconsciousness (Magnus and Van der Holst, 1987). This indicates that after experiencing positive OP environments, when users are exposed to videos of the same personage again, the unconscious part of their brain activity is relatively more engaged.
We observed that positive OP environments generally exhibit a strong negative correlation with EEG signals in the gamma band. The gamma band has been recognized as crucial for learning and memory processes (Headley and Weinberger, 2011) and has also been correlated with meditation (Kumar et al., 2021). This suggests that after exposure to negative OP environments, when users view videos on the same personage again, the emotional response activities may be more active than exposure to positive OP environments.
3.2.2. Neural Correlates of Opinion Polarization in EEG with behaviors
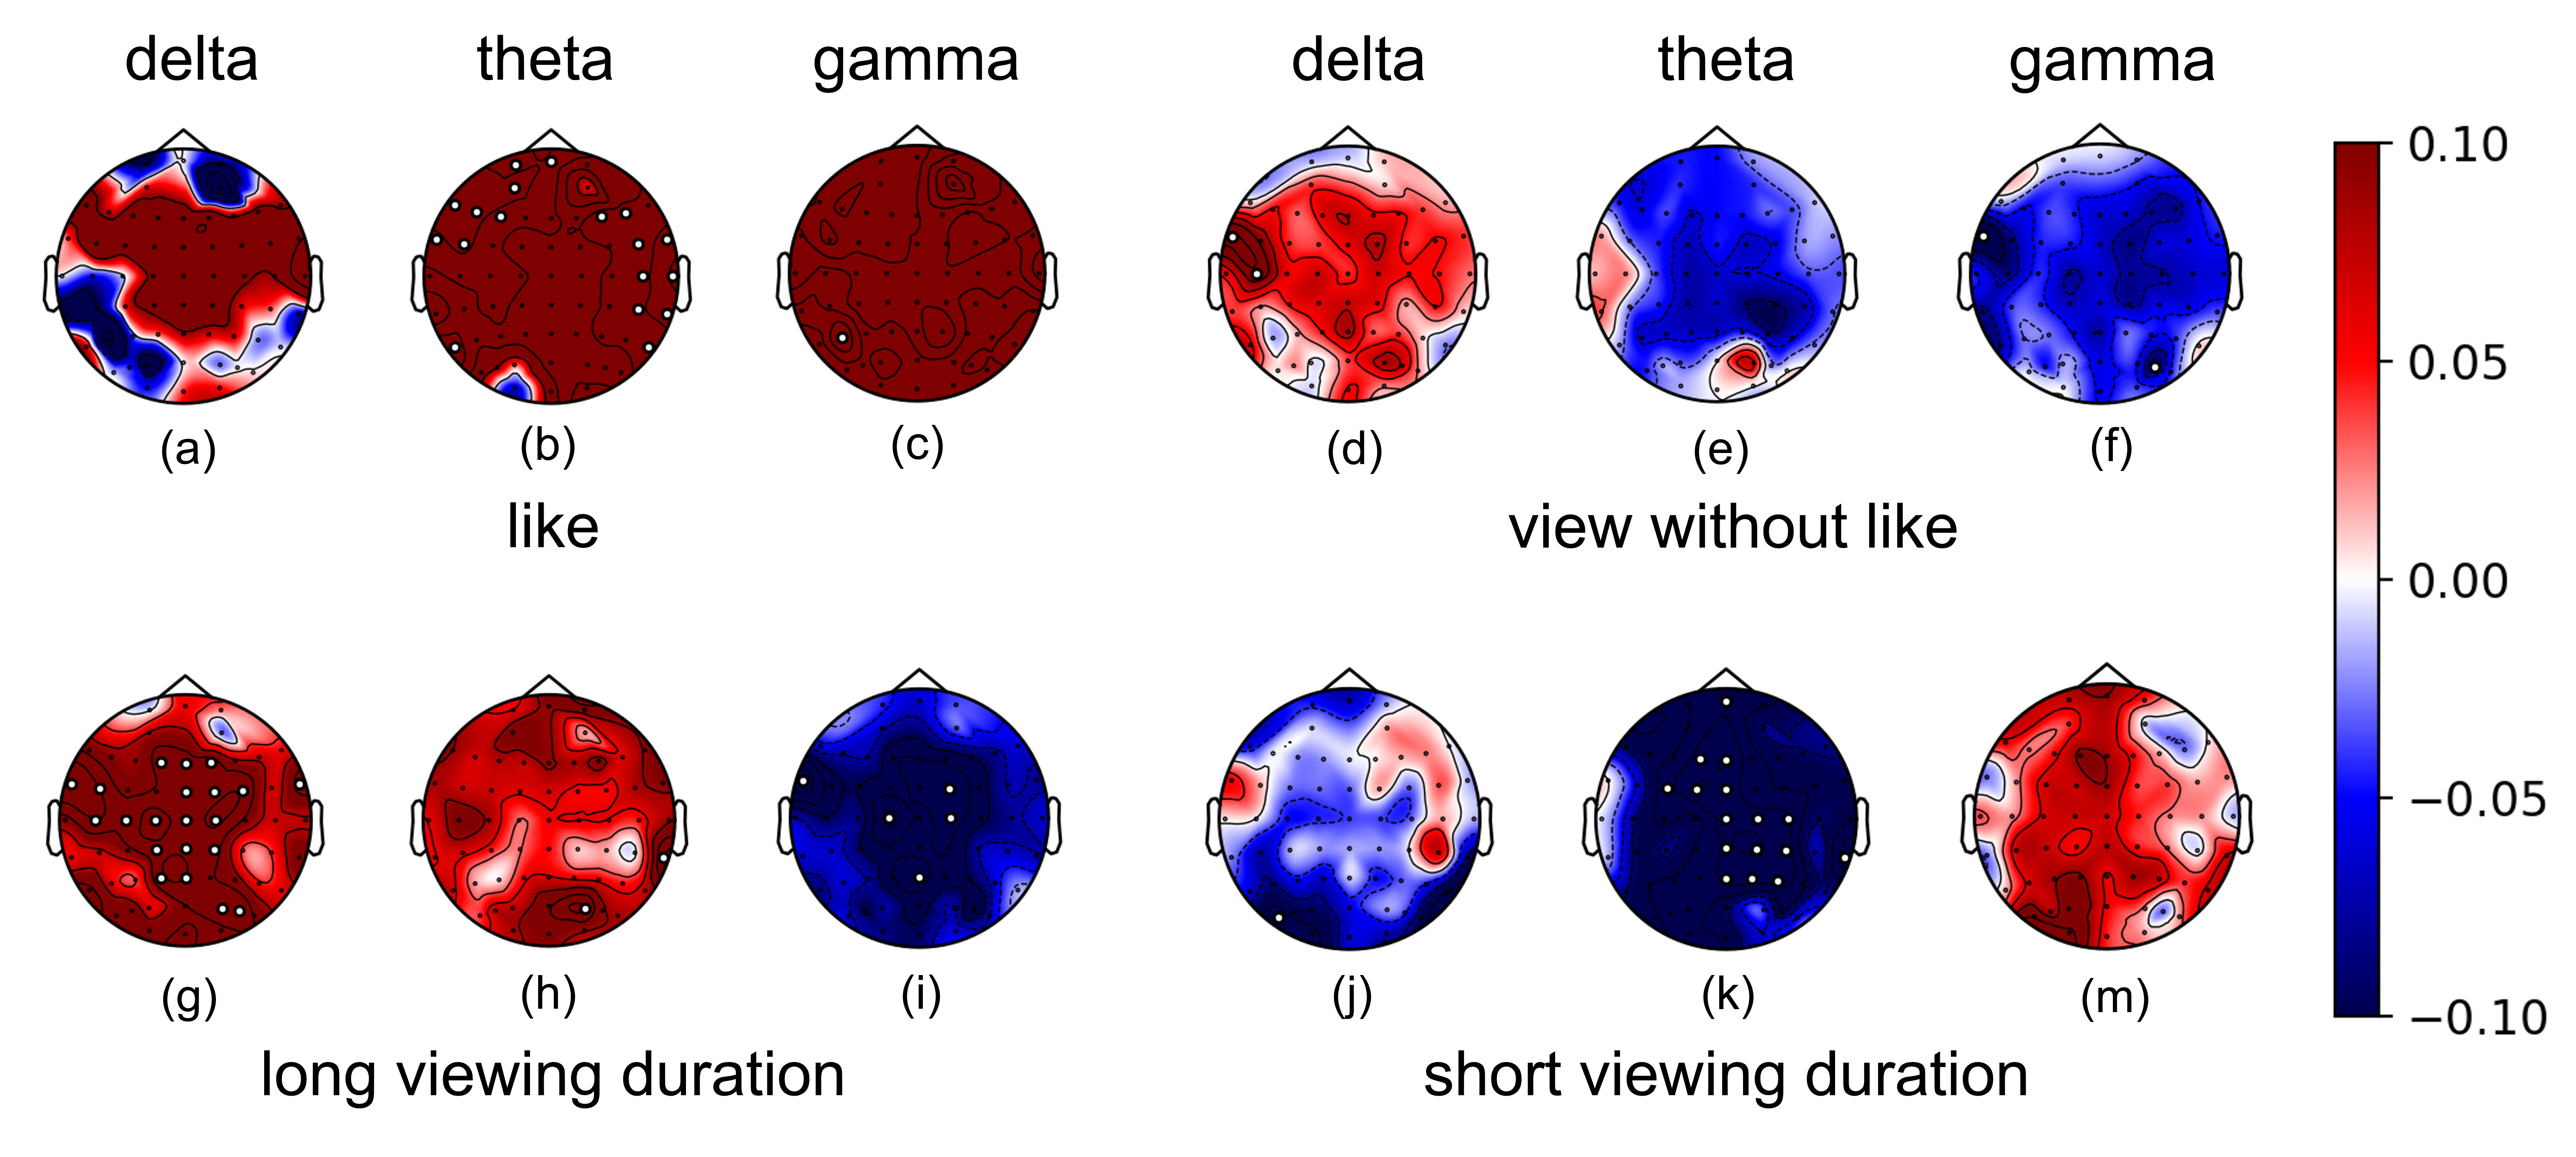
To explore the impact of behavioral data on the correlation between OP and EEG, brainwave signals were categorized based on ’likes’ received and viewing duration. Videos were classified into two categories: those with a viewing duration ratio above 0.9 as long viewing duration, and those below 0.9 as short viewing duration. This method yielded two balanced data sets, with an approximate ratio of low to high viewing duration sets being 10:9.
Analysis of Figure 7 (a-f) revealed a notable increase in the positive correlation between the different frequency bands of OP environments and EEG signals in the “like” group. This implies that for videos receiving likes in post-study, stronger EEG signals across multiple frequency bands are observed after positive OP environments. Significantly, correlations were found in the prefrontal and frontal lobe region of the theta band, an area linked to the generation and processing of emotions (Ertl et al., 2013).
As shown in Figure 7 (g-m), grouping the data by viewing duration yielded similarly significant results. In the long viewing duration group, a majority of electrodes in the delta band, mainly in frontal and temporal regions, showed a notable positive correlation, while the gamma band showed significant negative correlations. Long viewing durations suggest a higher willingness to watch (Merrill Jr and Rubenking, 2019). For short viewing durations, significant correlations were observed in the theta band, especially in the prefrontal and frontal regions.
Answer to RQ2:
Our study found that EEG signals and exposure to OP are intricately linked, with significant correlations in the Delta and Gamma frequency bands. Positive OP is associated with increased Delta band activity, suggesting enhanced unconscious brain activity. In contrast, negative polarization correlates with increased activity in the Gamma band, indicating more active recall and emotional responses. Furthermore, behavioral data (i.e., ‘likes’ and viewing duration) significantly influence these correlations. Videos receiving more likes or with longer viewing duration show stronger EEG correlations, indicating that user preferences and engagement levels play a crucial role in detecting the impact of OP.
4. Opinion polarization detection
Motivated by the observed correlation between OP and user signals, we further investigate to what extent OP can be detected with those signals and address RQ3. This section first elaborates on the task formalization and experiment setup of the proposed OP detection task, followed by studying the effect of various user signals, including sentiment judgment, behavior responses, and brain signals, in OP detection.
4.1. Task Formalization
To investigate ways to mitigate opinion polarization, especially in the context of specific topics or personages, it is essential to have a reliable method for determining the prevailing type of opinion polarization, be it positive or negative (Li and Zhao, 2021). Consequently, we formalize the detection of OP as a binary classification problem. We utilize various user signals, including sentiment judgment, behavior responses, and brain signals as input, aiming to predict whether users experience a positive or negative polarity (i.e., the direction of OP) regarding a particular topic.
In each participant and personage pair (e.g., participant A and personage Michael Corleone), we designed a setting to reflect positive opinion polarization. During the field study, participant A was consistently shown videos positively depicting Mike. For this specific pair, participant A’s EEG and behavioral responses were recorded while watching Mike-themed videos in both pre-study and post-study phases. Additionally, sentiment scores regarding Mike, collected at two different points in the sentiment collection phase, were incorporated. The assigned label for this data pair was “0”, indicative of positive opinion polarization.
4.2. Experimental Setup
4.2.1. Feature selection
We have implemented three input user signals and their combinations as distinct input features: (1) Behavior response Collected in our platform, including “liking” and “viewing duration ratio”. (2) EEG features in terms of Differential Entropy (DE) collected at every electrode across five passbands, following the method described in Appendix A.2. (3) Explicit response in terms of sentiment scores, on a five-point scale (1-5), collected from two questionnaires. In our predictive modeling, feature selection was essential due to the substantially larger dimensions of EEG features compared to others. For each user-personage pair, we included four EEG features. These features consist of EEG signals collected during four specific conditions: viewing a positive/negative video (denoted as pos-videos and neg-videos) in the pre-study/post-study. The dimensionality of each EEG feature was 30 * 62 * 5 (i.e., #time windows * #electrodes * #bands). To leverage the most effective EEG features, we selected the alpha frequency band, which is closely associated with emotions and cognitive functions (Klimesch, 1999). We utilized the “FPz” EEG feature, located at the foremost part of the frontal lobe. The frontal lobe is intricately linked with emotional regulation and higher cognitive functions (Dixon et al., 2017), making it more likely to reflect the impact of Opinion Polarization (OP). To represent user-personage level information, we averaged each feature over time (i.e., average (30,62,5) to (62,5)), followed by the selection of specific frequency bands and electrodes.
4.2.2. Classification Model
In our research, we explored various classical models before ultimately selecting the XGBoost model (Chen and Guestrin, 2016), recognized for its unique characteristics and benefits. XGBoost, an acronym for eXtreme Gradient Boosting, represents an advanced application of gradient boosting algorithms. It utilizes an ensemble method that sequentially constructs decision trees, each correcting the errors of its predecessor, thereby enhancing the model’s accuracy. This method’s flexibility is evident in its applicability to both regression and classification tasks.
Our decision to employ XGBoost was influenced by its consistently strong performance and stability across diverse datasets. Notably, XGBoost excels in efficiency and effectiveness, aligning seamlessly with the specific requirements of our study. The high cost and time constraints associated with EEG data collection resulted in a relatively limited set of features. Consequently, we refrained from employing more complex models. Future research could potentially expand the dataset and explore the application of more sophisticated models.
4.2.3. Data Splitting Protocol
In Section 4.1, we clearly defined the relationship between each feature type and user-personage pair and used these features to construct our dataset. This process yielded data for 230 user-personage pairs. We then aggregated these datasets and applied a five-fold cross-validation method to randomly split the data into training and test sets. Averaging the results from the test sets enhanced the reliability of our findings.
| Input Features | ACC | F1 | AUC |
| Like | 0.552 | 0.682 | 0.533 |
| Duration | 0.547 | 0.606 | 0.520 |
| Behavior (Like+Duration) | 0.497 | 0.553 | 0.505 |
| Sentiment | 0.592 | 0.608 | 0.662 |
| EEG | 0.641 | 0.682 | 0.672 |
| Sentiment+EEG | 0.622 | 0.657 | 0.677 |
| Like+EEG | 0.627 | 0.668 | 0.670 |
| Like+Sentiment | 0.607 | 0.656 | 0.630 |
| Like+Sentiment+EEG | 0.647 | 0.687 | 0.687 |
4.3. Results
The classification results are detailed in Table 1, evaluated using metrics such as the Area Under the Curve (AUC), F1 Score (F1), and Accuracy (ACC) (Huang and Ling, 2005).
First, when relying solely on individual behavioral metrics (i.e., like or viewing duration), the prediction performance was notably weak, with AUCs only reaching 0.533 (like) and 0.520 (duration). Combining likes and viewing duration features unexpectedly led to a decline in performance. This phenomenon might be explained by overfitting or the irrelevancy of combined features. Regardless, these AUC performances are marginally better than the 0.5 baseline which represents random chance, indicating that individual behavioral metrics have limited effectiveness in predicting the exposure to OP.
Second, using EEG signals as a standalone feature yielded superior predictive results compared to traditional behavioral features. AUC reached 0.672, F1 Score was 0.682, and ACC stood at 0.641, all indicating considerable improvements over behavioral-based predictions. This demonstrates EEG’s effectiveness in predicting users’ exposure to different types of polarized short videos. Furthermore, sentiment annotations independently used as features, showed enhanced performance compared with behaviors. As a form of explicit feedback, the AUC performance of sentiment annotations (0.662) is close to that of EEG (0.672), but its ACC (0.592) and F1 scores (0.608) are not as high as those of EEG.
Further, combining EEG and like features (we use like instead of the combination of the like and duration for better performance), surpassing the results obtained using only behavioral (i.e., like) features in ACC (from 0.552 to 0.627) and AUC (from 0.533 to 0.677). Combining EEG and sentiment features also showed better performance than using sentiment alone, with an ACC of 0.622, an F1 score of 0.657, and an AUC of 0.677. Moreover, the combination of like and sentiment produced better performance in ACC (0.607) than using like (0.552) or sentiment (0.592) alone.
Last, a combination of like, sentiment, and EEG features led to the best performance, with an ACC of 0.647, an F1 score of 0.687, and an AUC of 0.687. The high performance reflects a significant likelihood of accurately predicting the exposure to OP. Combined results demonstrate that EEG features substantially contribute to predicting exposure to OP.
Answer to RQ3:
The experimental findings in the polarity classification task indicate that EEG signals, along with explicit responses (i.e., sentiment annotations), can be effectively utilized to classify polarity. This method demonstrates superior performance compared to traditional behavioral information. Additionally, the integration of EEG and explicit responses with behavioral data can further enhance the performance of polarity classification.
5. related work
5.1. Opinion Polarization
Opinion Polarization refers to the increasing divergence in viewpoints among individuals or groups in society on specific issues, resulting in distinct clusters of opinions. This concept, explored in depth by McCoy et al., 2018 (McCoy et al., 2018), is often discussed in the context of ”Us” versus ”Them,” categorizing people into groups based on their opinions. This polarization includes not just varying opinions, but also how individuals align with opposing opinion groups, as explained by Koudenburg and Kashima, 2021 (Koudenburg et al., 2021), and Turner and Hogg, 1987 (Hogg and Turner, 1987). Theoretical and empirical studies, like those by Esteban and Ray, 1994 (Esteban and Ray, 1994), and Duclos et al., 2004 (Duclos et al., 2006), have focused on the psychological distances within opinion distributions and their impact on societal dynamics and conflicts.
In the short video scenario, X Cheng et al., 2007 (Cheng et al., 2007) found that videos have strong correlations with each other on YouTube555https://www.youtube.com/. YH Wang et al.,2017 (Wang et al., 2019) analyzed the characteristics and causes of the internet community of short video platforms. X Cheng et al., 2009 (Cheng and Liu, 2009) explored the clustering in social networks for short video sharing. Y Gao et al., 2023 (Gao et al., 2023) found that the gathering of users into homogeneous groups dominates online interactions on Douyin and Bilibili (two leading short video platforms in China). Xinyue Cao et al., 2021 (Cao et al., 2021) found that the narrative of short videos could promote brand attitude. However, there is a lack of research on the effects of polarized video environments, as measured by EEG signals.
5.2. User Signals in IR
In Information Retrieval (IR), user signals play an important role in enhancing the effectiveness and accuracy of IR systems via methods such as user intent modeling (Yang et al., 2023), relevance feedback (Ye et al., 2023; White et al., 2002), and click models (Chuklin et al., 2022). User signals in IR can be broadly categorized into two groups, explicit signals and implicit signals. Implicit signals are indirect indications of user preferences or behavior, inferred from their behaviors such as clicks (White et al., 2002), dwell time (Morita and Shinoda, 1994), eye-tracking (Akuma, 2022), etc. Explicit signals are direct and clear indications of user preferences or intentions, such as search queries entered into a search engine, likes or ratings to recommended items, etc.
Among the user signals in IR, EEG signals have recently demonstrated remarkable capabilities in understanding user interactions in IR systems across various settings. For example, detecting cognitive activities (Riedl et al., 2020; Minas et al., 2014), understanding information need (Moshfeghi et al., 2019, 2016), and predicting relevance judgment (Ye et al., 2023, 2022). Differently from traditional implicit signals and explicit signals, EEG signals are not easily categorized as either explicit or implicit signals, because they are collected implicitly but directly reflect the user’s mental activity. Existing research has shown its superiority over traditional implicit signals in terms of accuracy (Ye et al., 2022).
This paper explores the effectiveness of various user signals in the context of OP. Conventionally, behavior signals, especially clicks as implicit signals and likes as explicit signals are collected to measure and quantify OP. However, these signals, as merely external manifestations of OP, might fall short of providing evidence of the impacts of OP on a user’s cognitive perception of items on social platforms. This paper further explores OP utilizing explicit responses related to sentiment, along with feedback based on EEG responses.
6. Discussions and conclusions
Understanding the effect of opinion polarization in short video browsing is crucial for shaping public opinion (Yarchi et al., 2021), guiding content strategies, and promoting healthier online environments (Druckman et al., 2021). To our best knowledge, this is the first work to study the impact of OP in short video browsing with EEG and sentiment annotations. We carried out a three-stage user study aimed at gathering explicit and implicit feedback from users during short video browsing. These feedbacks included EEG data, sentiment annotations, and behavioral data (i.e., like and duration). Furthermore, we analyzed the data collected from this user study to address the three RQs.
The contribution of our paper can be summarized as follows: (1) We found that OP exposure significantly affected user sentiments toward specific personage in short video browsing scenarios. With so many popular video platforms nowadays, this may influence the broader societal perspective towards specific personages and, further, towards certain political issues or personages. (2) We identified correlations between EEG signals and the direction of OP. This suggests that EEG can serve as a novel method for detecting exposure to OP, revealing implicit impacts that users themselves might not be aware of. (3) We utilized EEG and sentiment features to predict the exposure to OP, with better performance than using behavior features. The performances are amazing with the small scale of the data and the relatively simple method. It indicates that the paradigm we established for collecting EEG, sentiment score, and behavioral data to detect exposure to OP is effective.
Several limitations guide exciting directions for future work: (1) The scale of participant involvement in our study was constrained. We recruited 24 participants for both field and laboratory studies, primarily due to the substantial costs associated with EEG data collection. Future work could employ a similar paradigm to collect larger-scale EEG and sentiment data, and we can expect improved performance. (2) There is a gap between users viewing the videos we provide and their everyday experiences. This persists despite our efforts to design a video browsing webpage tailored to users’ electronic devices and to incorporate distractor videos. (3) The methodology employed in this study for predicting the exposure to OP is relatively straightforward, employing more complex models could potentially enhance the performance.
References
- (1)
- Abebe et al. (2018) Rediet Abebe, Jon Kleinberg, David Parkes, and Charalampos E Tsourakakis. 2018. Opinion dynamics with varying susceptibility to persuasion. In Proceedings of the 24th ACM SIGKDD International Conference on Knowledge Discovery & Data Mining. 1089–1098.
- Akuma (2022) Stephen Akuma. 2022. Eye Gaze Relevance Feedback Indicators for Information Retrieval. International Journal of Intelligent Systems and Applications (IJISA) 14, 1 (2022), 57–65.
- Asker and Dinas (2019) David Asker and Elias Dinas. 2019. Thinking fast and furious: Emotional intensity and opinion polarization in online media. Public Opinion Quarterly 83, 3 (2019), 487–509.
- Cao et al. (2021) Xinyue Cao, Zhirui Qu, Yan Liu, and JiaJing Hu. 2021. How the destination short video affects the customers’ attitude: The role of narrative transportation. Journal of Retailing and Consumer Services 62 (2021), 102672.
- Chen (2021) Minmin Chen. 2021. Exploration in recommender systems. In Proceedings of the 15th ACM Conference on Recommender Systems. 551–553.
- Chen et al. (2021) Minmin Chen, Yuyan Wang, Can Xu, Ya Le, Mohit Sharma, Lee Richardson, Su-Lin Wu, and Ed Chi. 2021. Values of user exploration in recommender systems. In Proceedings of the 15th ACM Conference on Recommender Systems. 85–95.
- Chen et al. (2022) Sihua Chen, Han Qiu, Shifei Zhao, Yuyu Han, Wei He, Mikko Siponen, Jian Mou, and Hua Xiao. 2022. When more is less: The other side of artificial intelligence recommendation. Journal of Management Science and Engineering 7, 2 (2022), 213–232.
- Chen and Guestrin (2016) Tianqi Chen and Carlos Guestrin. 2016. Xgboost: A scalable tree boosting system. In Proceedings of the 22nd acm sigkdd international conference on knowledge discovery and data mining. 785–794.
- Cheng et al. (2007) Xu Cheng, Cameron Dale, and Jiangchuan Liu. 2007. Understanding the characteristics of internet short video sharing: YouTube as a case study. arXiv preprint arXiv:0707.3670 (2007).
- Cheng and Liu (2009) Xu Cheng and Jiangchuan Liu. 2009. Nettube: Exploring social networks for peer-to-peer short video sharing. In IEEE INFOCOM 2009. IEEE, 1152–1160.
- Chitra and Musco (2020) Uthsav Chitra and Christopher Musco. 2020. Analyzing the impact of filter bubbles on social network polarization. In Proceedings of the 13th International Conference on Web Search and Data Mining. 115–123.
- Chuklin et al. (2022) Aleksandr Chuklin, Ilya Markov, and Maarten De Rijke. 2022. Click models for web search. Springer Nature.
- Criss et al. (2021) Shaniece Criss, Eli K Michaels, Kamra Solomon, Amani M Allen, and Thu T Nguyen. 2021. Twitter fingers and echo chambers: Exploring expressions and experiences of online racism using twitter. Journal of Racial and Ethnic Health Disparities 8 (2021), 1322–1331.
- Dixon et al. (2017) Matthew L Dixon, Ravi Thiruchselvam, Rebecca Todd, and Kalina Christoff. 2017. Emotion and the prefrontal cortex: An integrative review. Psychological bulletin 143, 10 (2017), 1033.
- Druckman et al. (2021) James N Druckman, Samara Klar, Yanna Krupnikov, Matthew Levendusky, and John Barry Ryan. 2021. Affective polarization, local contexts and public opinion in America. Nature human behaviour 5, 1 (2021), 28–38.
- Duan et al. (2013) Ruo-Nan Duan, Jia-Yi Zhu, and Bao-Liang Lu. 2013. Differential entropy feature for EEG-based emotion classification. In 2013 6th International IEEE/EMBS Conference on Neural Engineering (NER). IEEE, 81–84.
- Duclos et al. (2006) Jean-Yves Duclos, Joan Esteban, and Debraj Ray. 2006. Polarization: concepts, measurement, estimation. In The Social Economics of Poverty. Routledge, 54–102.
- Einav et al. (2022) Gali Einav, Ofir Allen, Tamar Gur, Yossi Maaravi, and Daniel Ravner. 2022. Bursting filter bubbles in a digital age: Opening minds and reducing opinion polarization through digital platforms. Technology in Society 71 (2022), 102136.
- Ertl et al. (2013) Matthias Ertl, Maria Hildebrandt, Kristina Ourina, Gregor Leicht, and Christoph Mulert. 2013. Emotion regulation by cognitive reappraisal—the role of frontal theta oscillations. NeuroImage 81 (2013), 412–421.
- Esteban and Ray (1994) Joan-Maria Esteban and Debraj Ray. 1994. On the measurement of polarization. Econometrica: Journal of the Econometric Society (1994), 819–851.
- Gao et al. (2023) Yichang Gao, Fengming Liu, and Lei Gao. 2023. Echo chamber effects on short video platforms. Scientific Reports 13, 1 (2023), 6282.
- Groshek and Koc-Michalska (2017) Jacob Groshek and Karolina Koc-Michalska. 2017. Helping populism win? Social media use, filter bubbles, and support for populist presidential candidates in the 2016 US election campaign. Information, Communication & Society 20, 9 (2017), 1389–1407.
- He et al. (2023) Zhiyu He, Shaorun Zhang, Peijie Sun, Jiayu Li, Xiaohui Xie, Min Zhang, and Yiqun Liu. 2023. Understanding User Immersion in Online Short Video Interaction. In Proceedings of the 32nd ACM International Conference on Information and Knowledge Management. 731–740.
- Headley and Weinberger (2011) Drew B Headley and Norman M Weinberger. 2011. Gamma-band activation predicts both associative memory and cortical plasticity. Journal of Neuroscience 31, 36 (2011), 12748–12758.
- Hogg and Turner (1987) Michael A Hogg and John C Turner. 1987. Intergroup behaviour, self-stereotyping and the salience of social categories. British Journal of Social Psychology 26, 4 (1987), 325–340.
- Holone (2016) Harald Holone. 2016. The filter bubble and its effect on online personal health information. Croatian medical journal 57, 3 (2016), 298.
- Homan et al. (1987) Richard W Homan, John Herman, and Phillip Purdy. 1987. Cerebral location of international 10–20 system electrode placement. Electroencephalography and clinical neurophysiology 66, 4 (1987), 376–382.
- Hosanagar et al. (2014) Kartik Hosanagar, Daniel Fleder, Dokyun Lee, and Andreas Buja. 2014. Will the global village fracture into tribes? Recommender systems and their effects on consumer fragmentation. Management Science 60, 4 (2014), 805–823.
- Huang and Ling (2005) Jin Huang and Charles X Ling. 2005. Using AUC and accuracy in evaluating learning algorithms. IEEE Transactions on knowledge and Data Engineering 17, 3 (2005), 299–310.
- Huizenga et al. (2002) Hilde M Huizenga, Jan C De Munck, Lourens J Waldorp, and Raoul PPP Grasman. 2002. Spatiotemporal EEG/MEG source analysis based on a parametric noise covariance model. IEEE Transactions on Biomedical Engineering 49, 6 (2002), 533–539.
- Klimesch (1999) Wolfgang Klimesch. 1999. EEG alpha and theta oscillations reflect cognitive and memory performance: a review and analysis. Brain research reviews 29, 2-3 (1999), 169–195.
- Koudenburg et al. (2021) Namkje Koudenburg, Henk AL Kiers, and Yoshihisa Kashima. 2021. A new opinion polarization index developed by integrating expert judgments. Frontiers in psychology 12 (2021), 738258.
- Kumar et al. (2021) G Pradeep Kumar, Kanishka Sharma, AG Ramakrishnan, and A Adarsh. 2021. Increased entropy of gamma oscillations in the frontal region during meditation. In 2021 43rd Annual International Conference of the IEEE Engineering in Medicine & Biology Society (EMBC). IEEE, 787–790.
- Lee (2016) Francis LF Lee. 2016. Impact of social media on opinion polarization in varying times. Communication and the Public 1, 1 (2016), 56–71.
- Li and Zhao (2021) Yuejiang Li and Hong Zhao. 2021. Evaluation and control of opinion polarization and disagreement: a review. International Journal of Crowd Science 5, 2 (2021), 114–128.
- Magnus and Van der Holst (1987) Otto Magnus and Marian Van der Holst. 1987. Zeta waves: a special type of slow delta waves. Electroencephalography and clinical neurophysiology 67, 2 (1987), 140–146.
- Martinovic (2018) Mario Martinovic. 2018. Exploring the Effect of Search Engine Personalization on Politically Biased Search Results. B.S. thesis. University of Twente.
- Mäs and Flache (2013) Michael Mäs and Andreas Flache. 2013. Differentiation without distancing. Explaining bi-polarization of opinions without negative influence. PloS one 8, 11 (2013), e74516.
- McCoy et al. (2018) Jennifer McCoy, Tahmina Rahman, and Murat Somer. 2018. Polarization and the global crisis of democracy: Common patterns, dynamics, and pernicious consequences for democratic polities. American Behavioral Scientist 62, 1 (2018), 16–42.
- McCright and Dunlap (2011) Aaron M McCright and Riley E Dunlap. 2011. The politicization of climate change and polarization in the American public’s views of global warming, 2001–2010. The Sociological Quarterly 52, 2 (2011), 155–194.
- Merrill Jr and Rubenking (2019) Kelly Merrill Jr and Bridget Rubenking. 2019. Go long or go often: Influences on binge watching frequency and duration among college students. Social Sciences 8, 1 (2019), 10.
- Minas et al. (2014) Randall K Minas, Robert F Potter, Alan R Dennis, Valerie Bartelt, and Soyoung Bae. 2014. Putting on the thinking cap: using NeuroIS to understand information processing biases in virtual teams. Journal of Management Information Systems 30, 4 (2014), 49–82.
- Morita and Shinoda (1994) Masahiro Morita and Yoichi Shinoda. 1994. Information filtering based on user behavior analysis and best match text retrieval. In SIGIR’94: Proceedings of the Seventeenth Annual International ACM-SIGIR Conference on Research and Development in Information Retrieval, organised by Dublin City University. Springer, 272–281.
- Moshfeghi et al. (2013) Yashar Moshfeghi, Luisa R Pinto, Frank E Pollick, and Joemon M Jose. 2013. Understanding relevance: An fMRI study. In European conference on information retrieval. Springer, 14–25.
- Moshfeghi et al. (2019) Yashar Moshfeghi, Peter Triantafillou, and Frank Pollick. 2019. Towards predicting a realisation of an information need based on brain signals. In The World Wide Web Conference. 1300–1309.
- Moshfeghi et al. (2016) Yashar Moshfeghi, Peter Triantafillou, and Frank E Pollick. 2016. Understanding information need: An fMRI study. In Proceedings of the 39th International ACM SIGIR conference on Research and Development in Information Retrieval. 335–344.
- Pariser (2011) Eli Pariser. 2011. The filter bubble: What the Internet is hiding from you. penguin UK.
- Pinkosova et al. (2023) Zuzana Pinkosova, William J McGeown, and Yashar Moshfeghi. 2023. Moderating effects of self-perceived knowledge in a relevance assessment task: An EEG study. Computers in Human Behavior Reports 11 (2023), 100295.
- Riedl et al. (2020) René Riedl, Thomas Fischer, Pierre-Majorique Léger, and Fred D. Davis. 2020. A Decade of NeuroIS Research: Progress, Challenges, and Future Directions. SIGMIS Database 51, 3 (jul 2020), 13–54. https://doi.org/10.1145/3410977.3410980
- Schober et al. (2018) Patrick Schober, Christa Boer, and Lothar A Schwarte. 2018. Correlation coefficients: appropriate use and interpretation. Anesthesia & analgesia 126, 5 (2018), 1763–1768.
- Strandberg et al. (2019) Kim Strandberg, Staffan Himmelroos, and Kimmo Grönlund. 2019. Do discussions in like-minded groups necessarily lead to more extreme opinions? Deliberative democracy and group polarization. International Political Science Review 40, 1 (2019), 41–57.
- Wang et al. (2019) Yu-Huan Wang, Tian-Jun Gu, and Shyang-Yuh Wang. 2019. Causes and characteristics of short video platform internet community taking the TikTok short video application as an example. In 2019 IEEE International Conference on Consumer Electronics-Taiwan (ICCE-TW). IEEE, 1–2.
- Welch (1967) Peter Welch. 1967. The use of fast Fourier transform for the estimation of power spectra: a method based on time averaging over short, modified periodograms. IEEE Transactions on audio and electroacoustics 15, 2 (1967), 70–73.
- White et al. (2002) Ryen W White, Ian Ruthven, and Joemon M Jose. 2002. The use of implicit evidence for relevance feedback in web retrieval. In Advances in Information Retrieval: 24th BCS-IRSG European Colloquium on IR Research Glasgow, UK, March 25–27, 2002 Proceedings 24. Springer, 93–109.
- Yang et al. (2023) Yuhao Yang, Chao Huang, Lianghao Xia, Chunzhen Huang, Da Luo, and Kangyi Lin. 2023. Debiased Contrastive Learning for Sequential Recommendation. In Proceedings of the ACM Web Conference 2023. 1063–1073.
- Yarchi et al. (2021) Moran Yarchi, Christian Baden, and Neta Kligler-Vilenchik. 2021. Political polarization on the digital sphere: A cross-platform, over-time analysis of interactional, positional, and affective polarization on social media. Political Communication 38, 1-2 (2021), 98–139.
- Ye et al. (2023) Ziyi Ye, Xiaohui Xie, Qingyao Ai, Yiqun Liu, Zhihong Wang, Weihang Su, and Min Zhang. 2023. Relevance Feedback with Brain Signals. ACM Transactions on Information Systems (2023).
- Ye et al. (2022) Ziyi Ye, Xiaohui Xie, Yiqun Liu, Zhihong Wang, Xuancheng Li, Jiaji Li, Xuesong Chen, Min Zhang, and Shaoping Ma. 2022. Why Don’t You Click: Understanding Non-Click Results in Web Search with Brain Signals. In Proceedings of the 45th International ACM SIGIR Conference on Research and Development in Information Retrieval. 633–645.
- Zheng et al. (2018) Wei-Long Zheng, Wei Liu, Yifei Lu, Bao-Liang Lu, and Andrzej Cichocki. 2018. Emotionmeter: A multimodal framework for recognizing human emotions. IEEE transactions on cybernetics 49, 3 (2018), 1110–1122.
Appendix A SUPPLEMENTARY MATERIAL
A.1. Platform
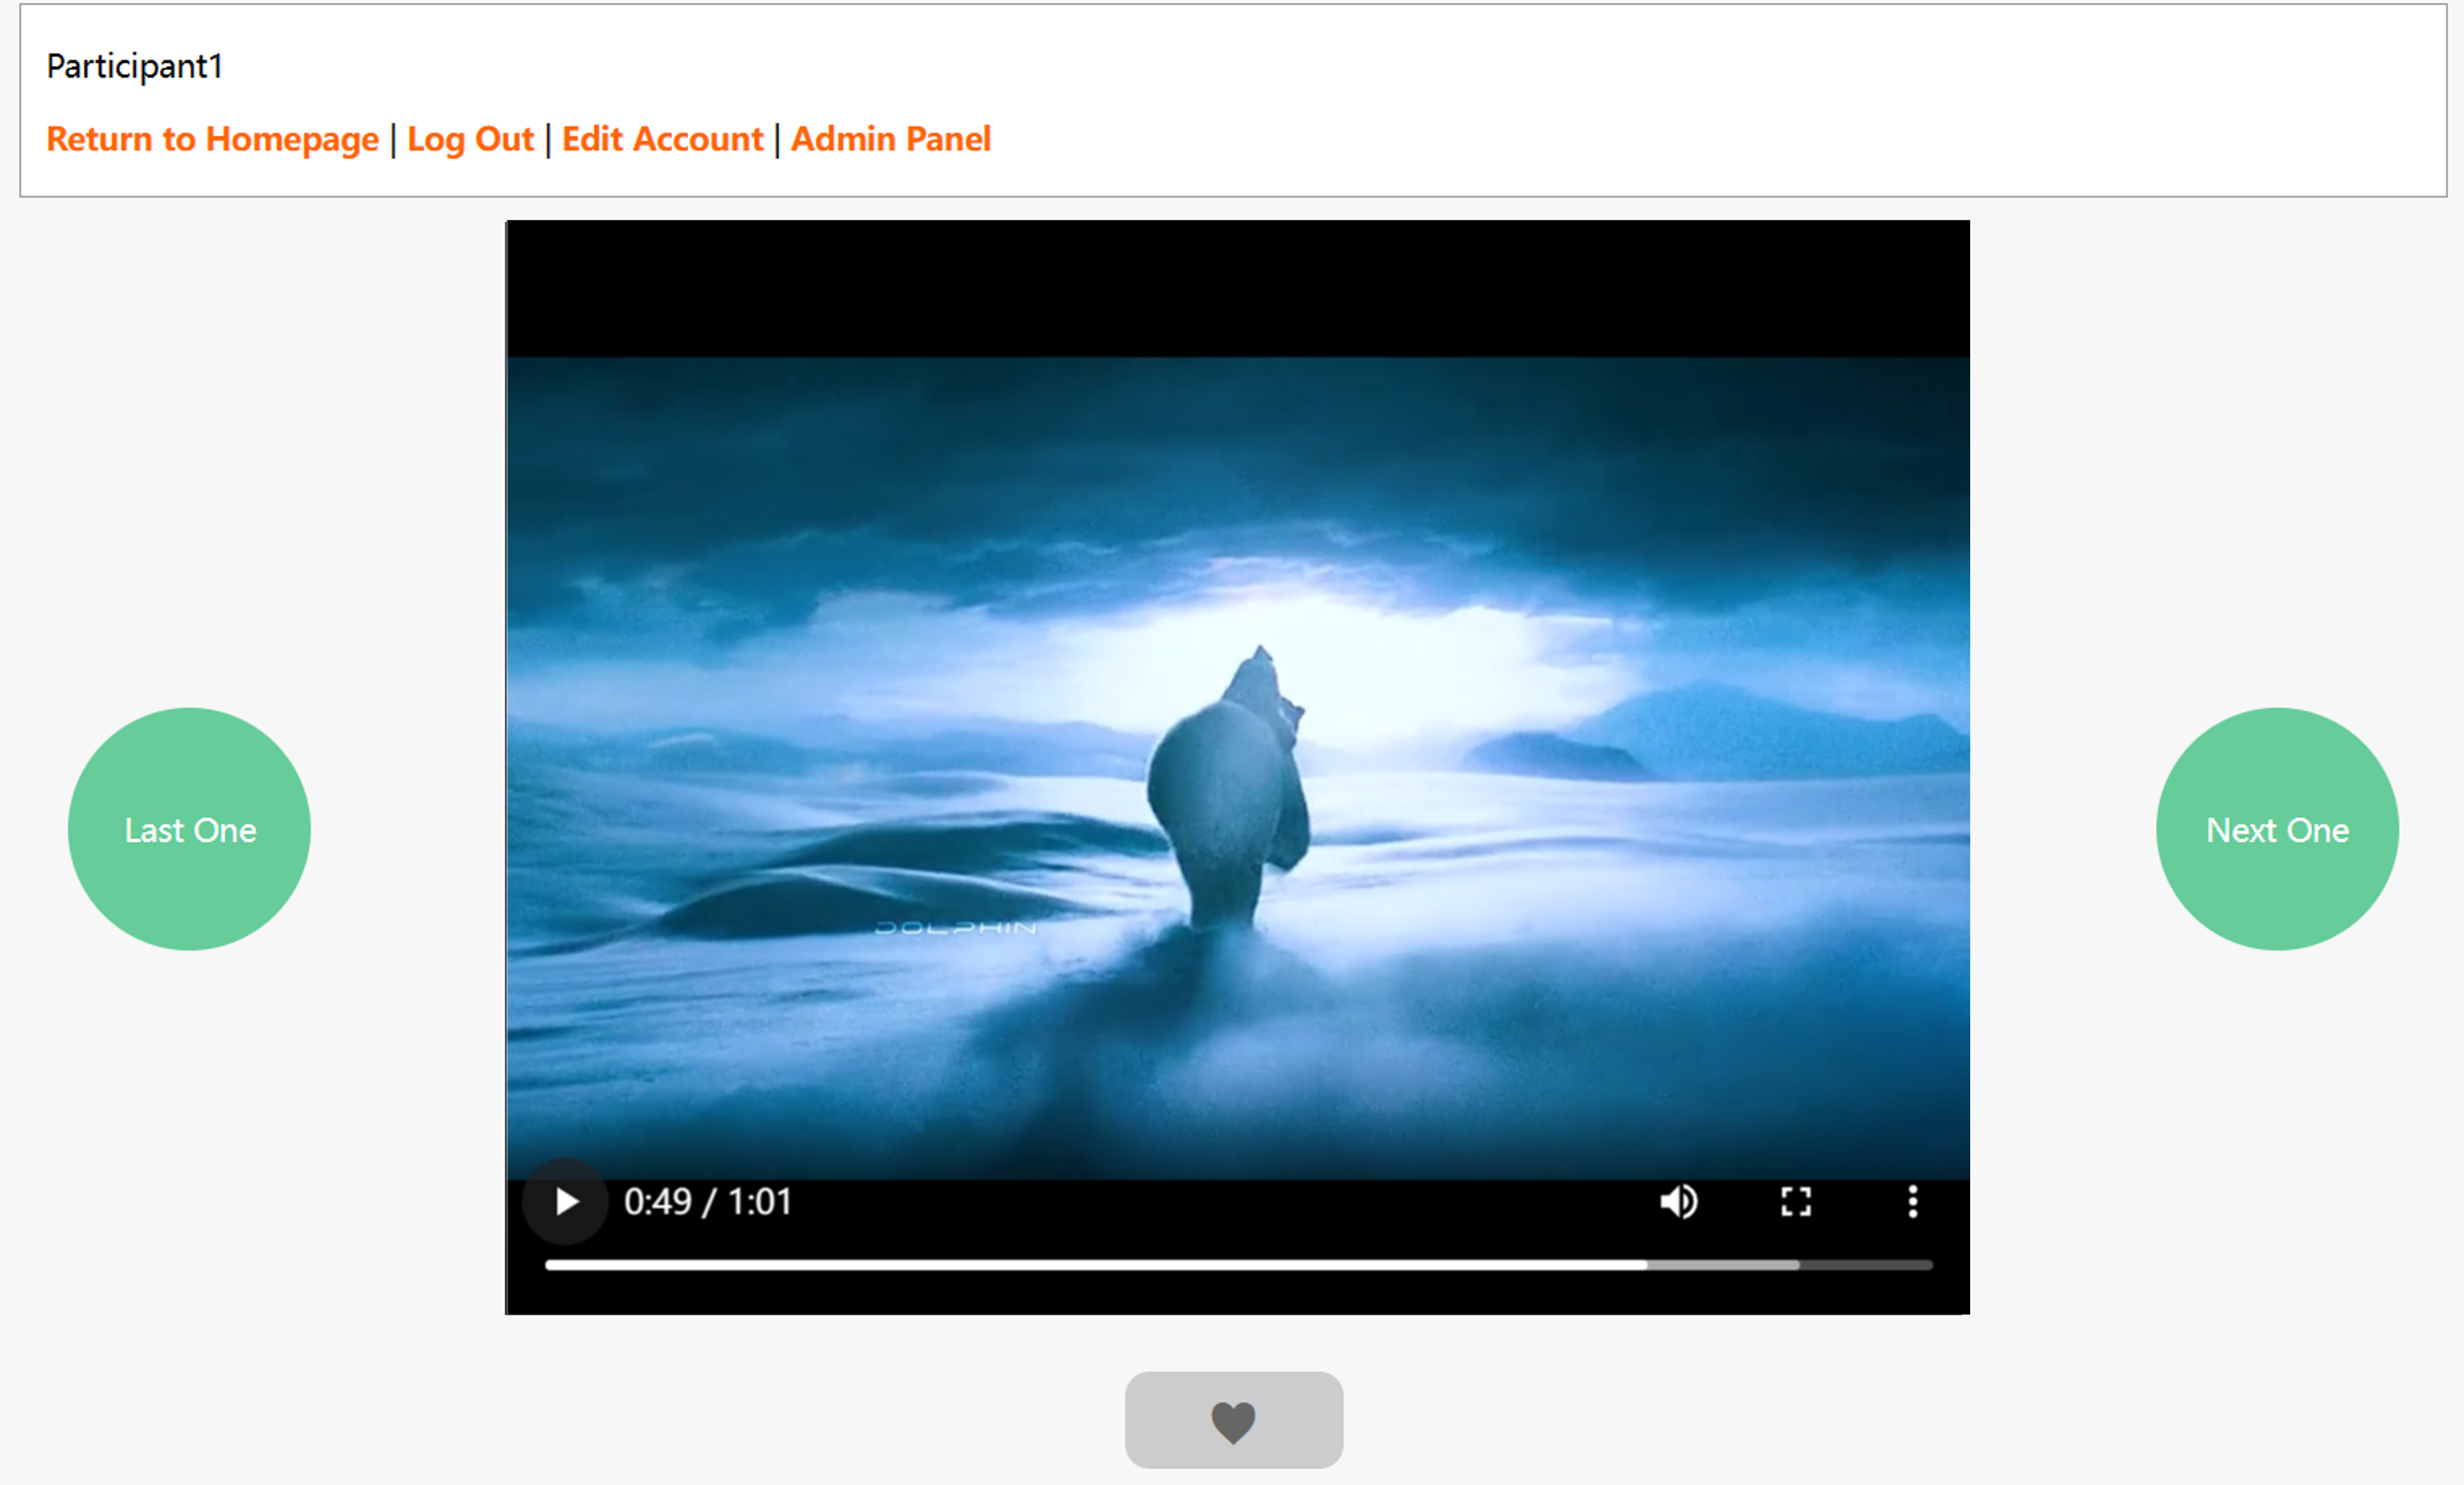
To approximate real-world conditions, the webpage is suitable for both mobile phones and laptops. The webpage is developed using PHP language, a widely used open-source, general-purpose scripting language that is particularly suited for web development. As shown in Figure 8, the webpage’s playback interface primarily features a video frame. To the right, there is a ”Next” button, and to the left, a ”Previous” button. Below, there is a button for ’liking’ the video. Each user logs into the webpage with their unique account, enabling them to watch videos customized for them.
A.2. Neuroscience analytics method
During the pre-study and post-study, continuous collection of Electroencephalogram (EEG) physiological signals was conducted on each participant. In this study, we utilized a 64-channel Quik-Cap (Compumedics NeuroScan) for EEG signal acquisition, with electrode placement following the International 10-20 system (Homan et al., 1987). The collected EEG data underwent preprocessing for further analysis, which included re-referencing to the average mastoid, baseline correction, low-pass filtering at 50 Hz, high-pass filtering at 0.5 Hz, and artifact removal (Huizenga et al., 2002).
To utilize EEG data as features for training our model, as required in the experiments of Chapter 4, we opted for Differential Entropy (DE) characteristics. Differential entropy (DE) is a crucial tool in assessing EEG signals (Duan et al., 2013). The computation of DE began with estimating the power spectral density (PSD), denoted as , where represents frequency. This estimation was conducted using Welch’s method (Welch, 1967), which employs a moving window technique. The length of this window was set to twice the inverse of the frequency band’s lower limit, with the system operating at a sampling rate of 1000 Hz. We calculated DE as follows:
| (3) |
A.3. Personage Introductions
We selected Thomas Alva Edison, Cao Cao, Christopher Columbus, Emperor Wu of Han, Catherine the Great, Walter White, Michael Corleone, Isaac Newton, Qin Shi Huang, and Xiang Yu as personages for the experiment. The introductions to these personages are shown in Table 2. The familiarity of the participants with these personages was investigated through a questionnaire in the pre-study and post-study. Before exposure to Opinion Polarization (OP), participants had a moderate level of familiarity, averaging a score of 2.8 on a scale from 1 to 5. Post-exposure, this average familiarity score increased to 3.2.
| Name | Introduction |
| Thomas Alva Edison | Prolific American inventor, credited with developing the light bulb, phonograph, and motion picture camera, significantly impacting modern life. |
| Cao Cao | A prominent warlord and statesman at the end of the Eastern Han dynasty in ancient China, known for his military and political acumen. |
| Christopher Columbus | An Italian explorer in the 15th century, credited with the discovery of the Americas while searching for a new route to Asia. |
| Emperor Wu of Han | The seventh emperor of the Han dynasty in China, known for his military conquests and the expansion of the Chinese empire. |
| Catherine the Great | Empress of Russia in the late 18th century, renowned for her expansion of the Russian empire and domestic reforms. |
| Walter White | A fictional character from the TV series ”Breaking Bad,” a high school chemistry teacher who turns to cooking methamphetamine. |
| Michael Corleone | A fictional character in ”The Godfather” movie series, transforms from a reluctant outsider to a ruthless mafia boss. |
| Isaac Newton | A key figure in the scientific revolution, an English mathematician, physicist, and astronomer, known for his laws of motion and gravity. |
| Qin Shi Huang | The founder of the Qin dynasty and the first emperor of a unified China, famous for the Terracotta Army and the Great Wall. |
| Xiang Yu | A prominent military leader and political figure in ancient China during the late Qin dynasty, known for his role in the Chu–Han Contention. |
A.4. Video Annotations and Consistency Scores
The annotation guideline: Please rate the character’s opinion in the video on a scale from 1 to 5, reflecting its polarity. A score of 1 corresponds to a pessimistic evaluation, while a score of 5 signifies an optimistic evaluation. Scores 2 and 4 represent moderately negative and positive evaluations, respectively, and a score of 3 denotes neutrality.
Fleiss’ Kappa is a statistical measure used to assess the reliability of agreement among a fixed number of raters when they assign categorical ratings to several items or classify items. Fleiss’ Kappa scores calculated for each personage are shown in Table 3:
| English Name | Fleiss’ Kappa |
| Thomas Alva Edison | 0.402 |
| Cao Cao | 0.570 |
| Christopher Columbus | 0.728 |
| Emperor Wu of Han | 0.251 |
| Catherine the Great | 0.553 |
| Walter White | 0.417 |
| Michael Corleone | 0.270 |
| Isaac Newton | 0.483 |
| Qin Shi Huang | 0.383 |
| Xiang Yu | 0.321 |