[1]\fnmYoung-June \surKim
1]\orgdivDepartment of Physics, \orgnameUniversity of Toronto, \cityToronto, \postcodeM5S 1A7, \stateOntario, \countryCanada
2]\orgdivNational Synchrotron Light Source II, \orgnameBrookhaven National Laboratory, \cityUpton, \postcode11973, \stateNY, \countryUSA
3]\orgdivCornell High Energy Synchrotron Source, \orgnameCornell University, \cityIthaca, \postcode14853, \stateNY, \countryUSA
Re-investigation of Moment Direction in a Kitaev Material -RuCl3
Abstract
We report X-ray diffraction and resonant elastic X-ray scattering (REXS) studies on two -RuCl3 crystals with distinct magnetic transition temperatures: TN=7.3K and 6.5K. We find that the sample with TN=6.5K exhibits a high degree of structural twinning at low temperature, whereas the TN=7.3K sample primarily comprises a single domain of R. Notwithstanding, both samples exhibit an identical zigzag magnetic structure, with magnetic moments pointing away from the honeycomb plane by . We argue that the identical ordered moment directions in these samples suggest that the intralayer magnetic Hamiltonian remains mostly unchanged regardless of TN.
1 Introduction
In recent years, -RuCl3 has been extensively investigated as a potential candidate for a Kitaev quantum spin liquid [1, 2, 3, 4, 5, 6, 7, 8, 9, 10, 11, 12]. The intriguing interplay of frustrating, bond-dependent interactions arising from spin-orbit coupling offers a promising platform for having a quantum spin liquid [13]. While the system exhibits magnetic ordering below T7K, it can be effectively suppressed by applying a moderate magnetic field parallel to the honeycomb plane [14, 15, 7, 10, 16]. This field-induced quantum phase has been the subject of many studies [17, 8, 18, 19, 20, 21, 22, 23, 24, 25, 26], including the observation of the half-quantized thermal Hall effect, which is regarded as a compelling piece of evidence of a potential quantum spin liquid phase [18]. However, this experimental observation remains contentious due to limited reproducibility [27, 28]. The thermal Hall effect displays a significant dependence on the sample quality and composition, and the quantization was only observed in select samples [18, 27, 28, 29, 30, 31, 32].
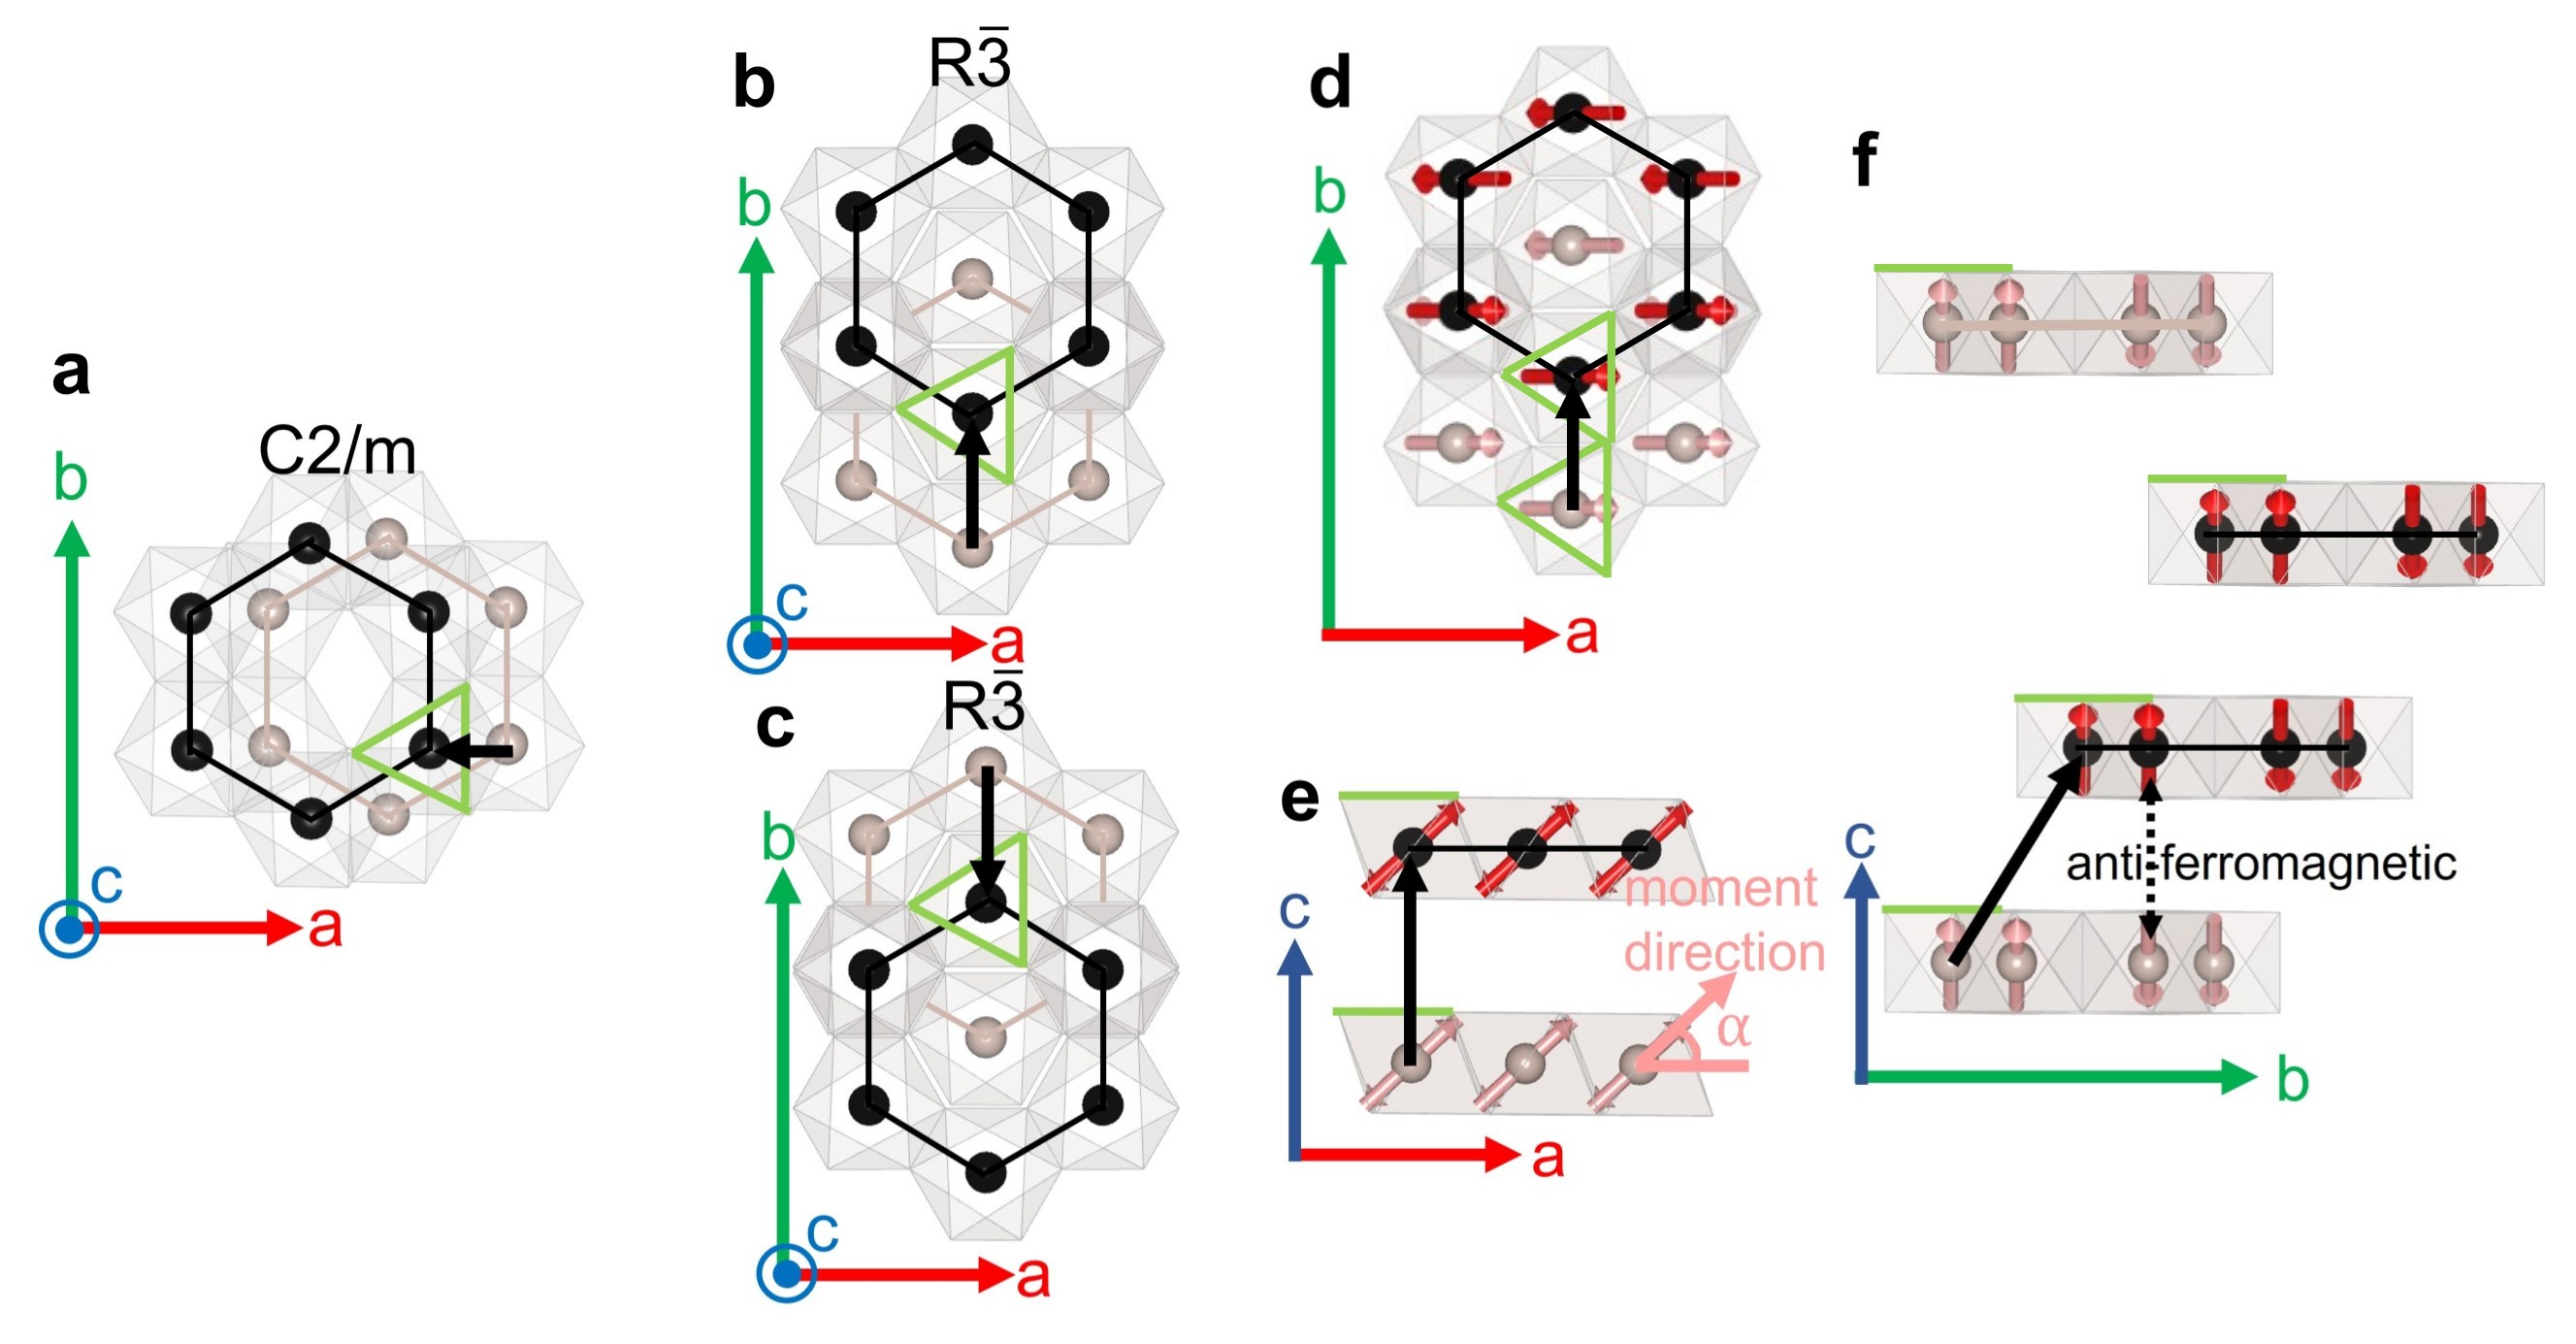
The quality of the crystals varies among samples based on the amount of defects present in the crystal structure. -RuCl3 features a honeycomb structure with weak coupling between its layers through van der Waals forces, making it susceptible to structural defects known as stacking faults (see Fig. 1). This inherent predisposition to stacking sequence disorder results in diverse structural arrangements among crystals, leading to the proposition of multiple crystal structures for this material [33, 7, 34, 31, 35]. Careful studies using high-quality -RuCl3 crystals indicate the crystal structure symmetry is C2/m at room temperature. However, this structure is disrupted below the structural phase transition around 150K. The exact identification of the low-temperature structure has been controversial, but recent studies converge on symmetry as the low-temperature structure (see Fig. 1a) [36, 37, 38, 39].
The magnetic structure of -RuCl3 is sample-dependent as well. Early neutron diffraction studies on a single crystal by Sears et al. observed magnetic Bragg peaks with three-layer periodicity [6]. In contrast, neutron diffraction studies on a powder sample by Johnson et al. observed magnetic Bragg peaks with two-layer periodicity instead [33]. Subsequently, Banerjee et al. showed that the three-layer and two-layer periodic magnetic structures have distinct magnetic transition temperatures, TN=7 K and TN=14 K, respectively [7]. The magnetic structure characterized by a two-layer periodicity is associated with samples with a substantial number of stacking faults. This correlation is emphasized by the presence of prominent diffuse scattering, notably observed in samples with TN=14 K [4]. This correlation is reinforced by the difficulty in reconciling a two-layer magnetic periodicity with the low-temperature R structure [34]. Johnson et al. explained this two-layer periodicity by invoking the high-temperature C2/m structure instead [15], suggesting that the C2/m structure persists down to low temperature in these samples with TN=14 K. On the other hand, the three-layer magnetic structure with TN=7 K is typically observed for samples without strong diffuse scattering [4], and it can be explained exclusively using the R structure (see Fig. 1) [10]. Therefore, it is generally accepted that crystals with a single magnetic transition around TN=7K are of high quality.
However, in addition to this large variation in TN, recent reports showed that a smaller variation in TN is found even among high-quality crystals, with values ranging from 6.5K to 7.5K [16, 9, 30, 40, 38]. While these studies suggest that samples with higher TN tend to be of better quality, the precise origin of this sample-dependent variation in TN remains unresolved [38]. It is this small variation that is the main subject of this paper. Specifically, we examine whether the magnetic structure and the ordered moment direction are different between these samples. We carried out a resonant elastic X-ray scattering (REXS) study of two samples with different magnetic transition temperatures of TN=6.5K and TN=7.3K. We confirm the zigzag antiferromagnetic arrangement with three-layer periodicity in both samples (See Fig. 1d-f). In particular, a study of the azimuthal angle dependence shows that the out-of-plane canting angle remains unchanged between the two samples (see Fig. 1e). In addition, the observed canting angle is consistent with that previously observed for a sample with TN=12K and two-layer-periodicity [41]. The fact that no discernible differences in the moment direction were observed across these samples suggests that the magnetic Hamiltonian remains unchanged regardless of the sample quality. The only distinction we find between the two samples we studied pertains to their structural domain populations. The sample exhibiting TN=7.3K is predominantly comprised of a single domain of the R structure, while the TN=6.5K sample showed highly twinned R structures.
2 Results
2.1 Overview of the Crystals
Minor variations in the transition temperature was confirmed between 5 -RuCl3 crystals, for which the TN values varied from 6.5K to 7.3K (see Supplementary Information). The specific heat and the magnetic susceptibility measurements suggest a distinction in the crystal quality between samples with TN=6.5(1) K and samples with TN=7.3(1) K. Here, we choose one sample from each group: S1 with TN=7.3K and S3 with TN=6.5K, and investigated their crystal and magnetic structures.
2.2 Structural Characterization
Both samples undergo a first-order structural transition from a monoclinic C2/m structure above the structural transition temperature, T150K, to a rhombohedral R structure below it, as depicted in Fig. 1. To describe the two structures using the same coordinate system, we adopt a pseudo-orthorhombic notation as shown in Fig. 1. The and vectors are identical to the monoclinic structure, and describe two unique high-symmetry directions within the honeycomb structure. The vector points perpendicular to the honeycomb plane and describes the separation vector between adjacent layers. Note that this is not a lattice vector for either the C2/m or the R structure. In the C2/m structure, each honeycomb layer is stacked on top of another with a shift by /3. On the other hand, the layers are shifted by /3 in the R structure. The primary distinction between these two structures lies in their stacking direction, and this can be differentiated using single crystal X-ray diffraction.
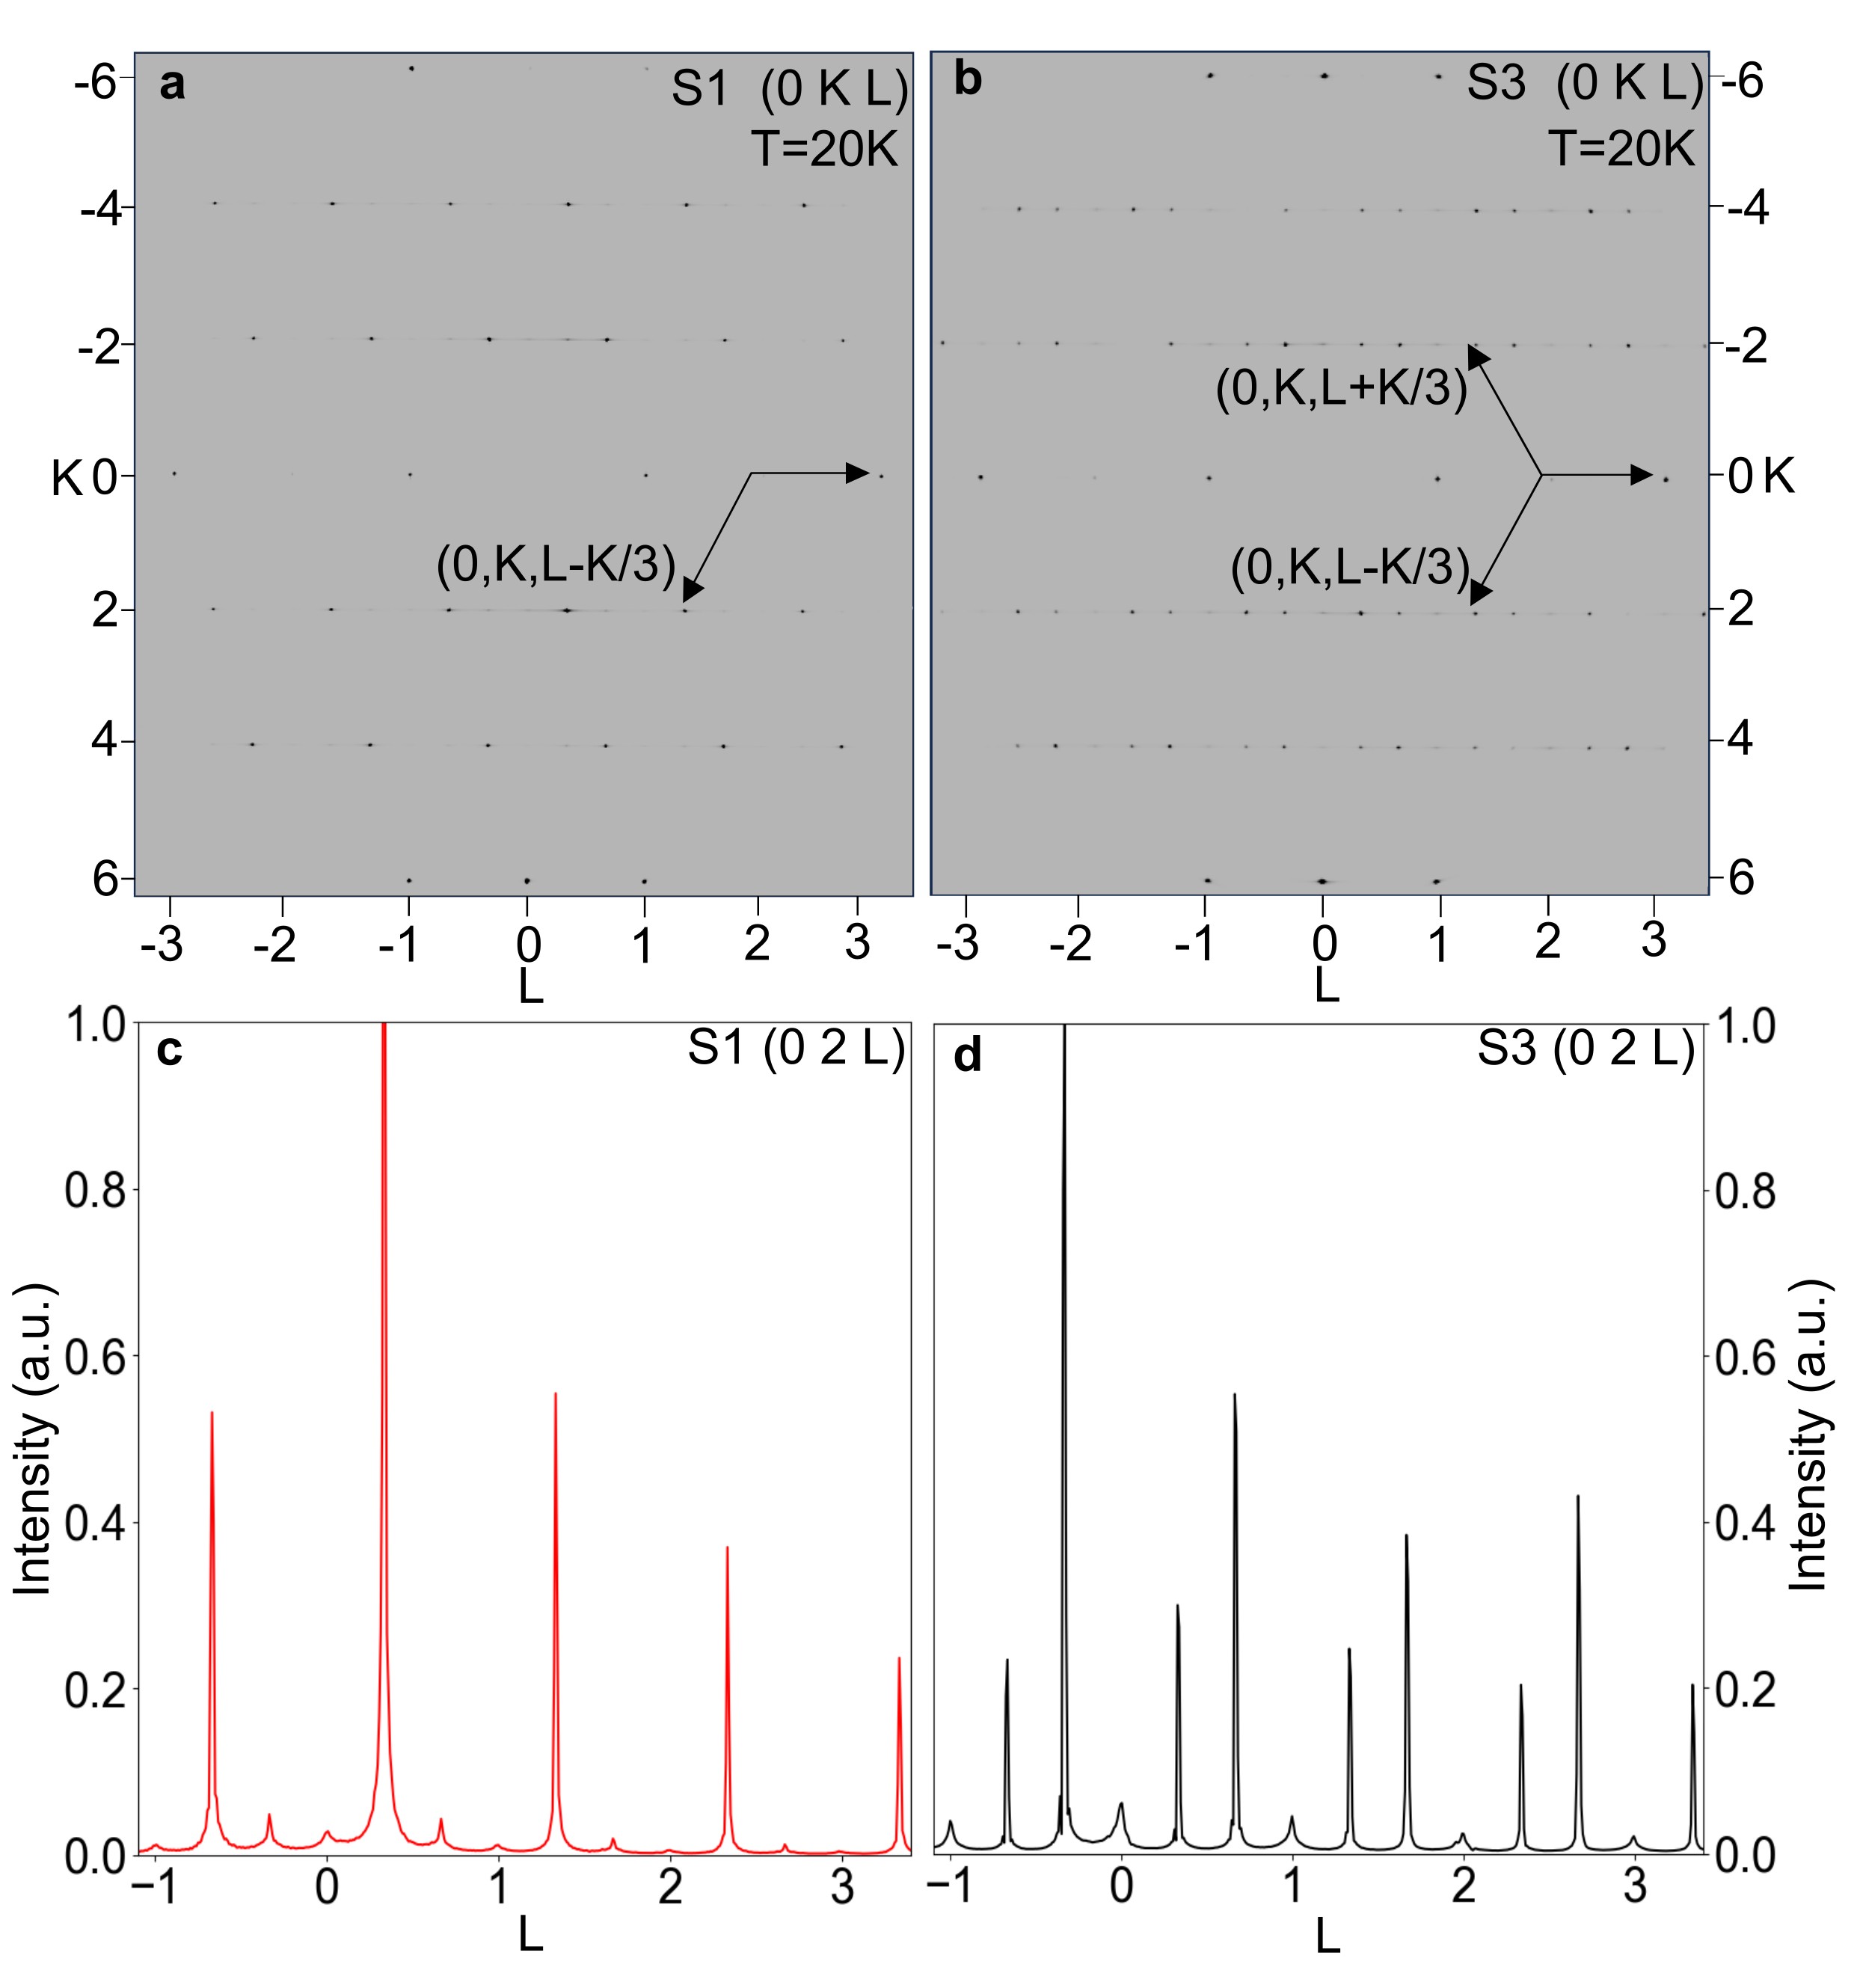
Fig. 2a-b show X-ray diffraction maps, comparing the reciprocal (0,K,L) plane diffraction patterns of S1 and S3 at 20K, well below the structural transition. In the case of S1, Bragg peaks are found at (0,K,L-K/3), where K is an even integer and L is an integer. However, for S3, additional Bragg peaks are also visible at (0,K,L+K/3), together with (0,K,L-K/3). Both (0,K,L-K/3) and (0,K,L+K/3) types of Bragg peaks arise from the R structure but they correspond to different structural twin domains, as shown in Fig. 1b-c. The translation vectors /3+ for each twin domain give rise to Bragg peaks at (0,K,LK/3), respectively. Therefore, we can conclude that S1 mainly comprises a single domain, while S3 has a significant mixture of twin domains. This distinction becomes clearer when examining L scans along (0,2,L), illustrated in Fig. 2c-d. In S1, intense peaks are found at (0,2,L-2/3), with much smaller peaks present at (0,2,L+2/3). However, in the case of S3, significant intensity is present at both (0,2,L2/3), indicative of substantial twinning at a ratio of about 2:1. Additionally, weak peaks at (0,2,L) are present (more pronounced when compared to S1). These peaks indicate that a small fraction of the sample remains in the high-temperature C2/m structure. The origin of this is unclear, but it may be related to an incomplete transition from the high-temperature phase. Alternatively, the C2/m phase may act as a domain wall between two twin domains. The widths of these Bragg peaks are much broader than that of the R counterparts in which the domain size is roughly 20 layers. The extensive twinning combined with the presence of the high-temperature structure in S3 results in a prominent diffuse rod of intensity along (see Fig. 2b) in comparison to S1. This observation agrees with Zhang et al. who reported that samples with lower TN exhibit larger diffuse scattering [38].
2.3 Magnetic Structure

The magnetic structures of S1 and S3 were studied using REXS. In both samples, the magnetic Bragg peaks were observed using the - polarization channel for which the incident beam is polarized perpendicular to the scattering plane () and the scattered beam is polarized parallel to the scattering plane (’), as illustrated in Fig. 3a. The magnetic Bragg peak intensities show resonant enhancement at the L3 edge of Ruthenium (2.837keV), as shown in Fig. 3b. In the case of S1, magnetic Bragg peaks were observed at and . Here, the primed notation indicates an equivalent Q-position in the other rhombohedral twin domain (see Fig. 1b and 1c), as discussed below. For S3, magnetic Bragg peaks were also observed at and , in addition to and . Note that and as well as and are equivalent under the three-fold rotational symmetry of the rhombohedral R structure (see Supplementary Information).
Fig. 3c-f presents the temperature-dependence of magnetic Bragg peaks. Specifically, Fig. 3c and d demonstrate the temperature dependence of the sample rocking curve scans for and in S1, respectively. The temperature dependence of the rocking curve scans at for S3 are shown in Fig. 3e. In each case, the magnetic Bragg peak intensity decreases with increasing temperature, confirming their magnetic origin. The temperature dependence of the integrated intensity is plotted in Fig. 3f, clearly illustrating the difference in the magnetic transition temperatures between the two samples. For S1, the magnetic Bragg peaks vanish around TN=7.3(1) K for both twin domains while in S3, the magnetic Bragg peak vanishes around TN=6.5(1) K. These transition temperatures agree well with the specific heat data. (see Supplementary Information) The magnetic Bragg peak intensity is proportional to the magnetic order parameter squared. The intensity data in Fig. 3f could be fitted to . The critical exponent could not be determined with high accuracy due to large error bars. However, describes the data fairly well, which indicates the two-dimensional nature of the phase transition.
We first focus on S1 to examine its lattice and magnetic structure more carefully. Fig. 4a compares the scans of structural Bragg peaks and , which are equivalent to (0,2,3.33) and (0,2,3.67), respectively. As discussed in the previous section, these peaks arise from different twin domains (corresponding to Fig. 1c and Fig. 1b, respectively), explaining large discrepancies in shape and intensity between them. In particular, the intensity differs by two orders of magnitudes, confirming that S1 comprises a predominantly single domain of R.
In Fig. 4b, we present L scans for the magnetic Bragg peaks and , compared with the structural Bragg peak (0,0,1). A noticeable width difference is observed between and . While the width of the peak is resolution-limited and equals that of the structural Bragg peak (0,0,1), the width of the peak is not resolution-limited, indicating a correlation length of about 250 layers. This difference in correlation lengths strongly suggests that they originate from different magnetic domains.
Furthermore, we can identify that these two magnetic peaks originate from the two structural twin domains. Fig. 4c and d show sample rocking curves along and , respectively, for the magnetic peak, compared with the structural peak. Similarly, Fig. 4e and f display rocking curves along and , respectively, for the magnetic peak, compared with the structural peak. Each pair of the magnetic and structural peaks agree well in their shape profiles which strongly suggest that they originate from the same domains. Since and correspond to different structural twin domains of , the observed and peaks correspond to magnetic domains originating from different structural domains. See Supplementary Information for these peak positions. Note that each pair follows the same selection rule (0,K,LK/3), respectively. The magnetic structure that best accounts for this observation is the three-layer periodic zigzag structure shown in Fig. 1. For S3, unravelling the magnetic structure proves challenging due to the presence of extensive twinning in both the structure and magnetic structure. Nonetheless, the intensity can still be well-explained using the magnetic structure provided in Fig. 1.
It is interesting to note that during the initial cool-down of S1, only the magnetic Bragg peak at was observed. However, subsequent cool-downs introduced an additional strong Bragg peak at (see Supplementary Information). This suggests the possibility of a change in the magnetic domain configuration after thermal cycling. However, the situation seems to be much more complicated than a simple history dependence if one considers the relatively weak intensity of the corresponding structural peak at . Note that the structural peaks are observed using photons with the 3rd harmonic of the primary X-ray beam energy (E=8.511keV), while the magnetic peaks are probed using photons with the primary energy (E=2.837keV). The penetration depths for these beams are 30 µm and 1 µm, respectively. We speculate that the thermal cycling might affect the near-surface region of the sample disproportionally, giving rise to a proliferation of twin domain walls, and the corresponding change in the magnetic Bragg peak intensity.

2.4 Magnetic Moment Direction
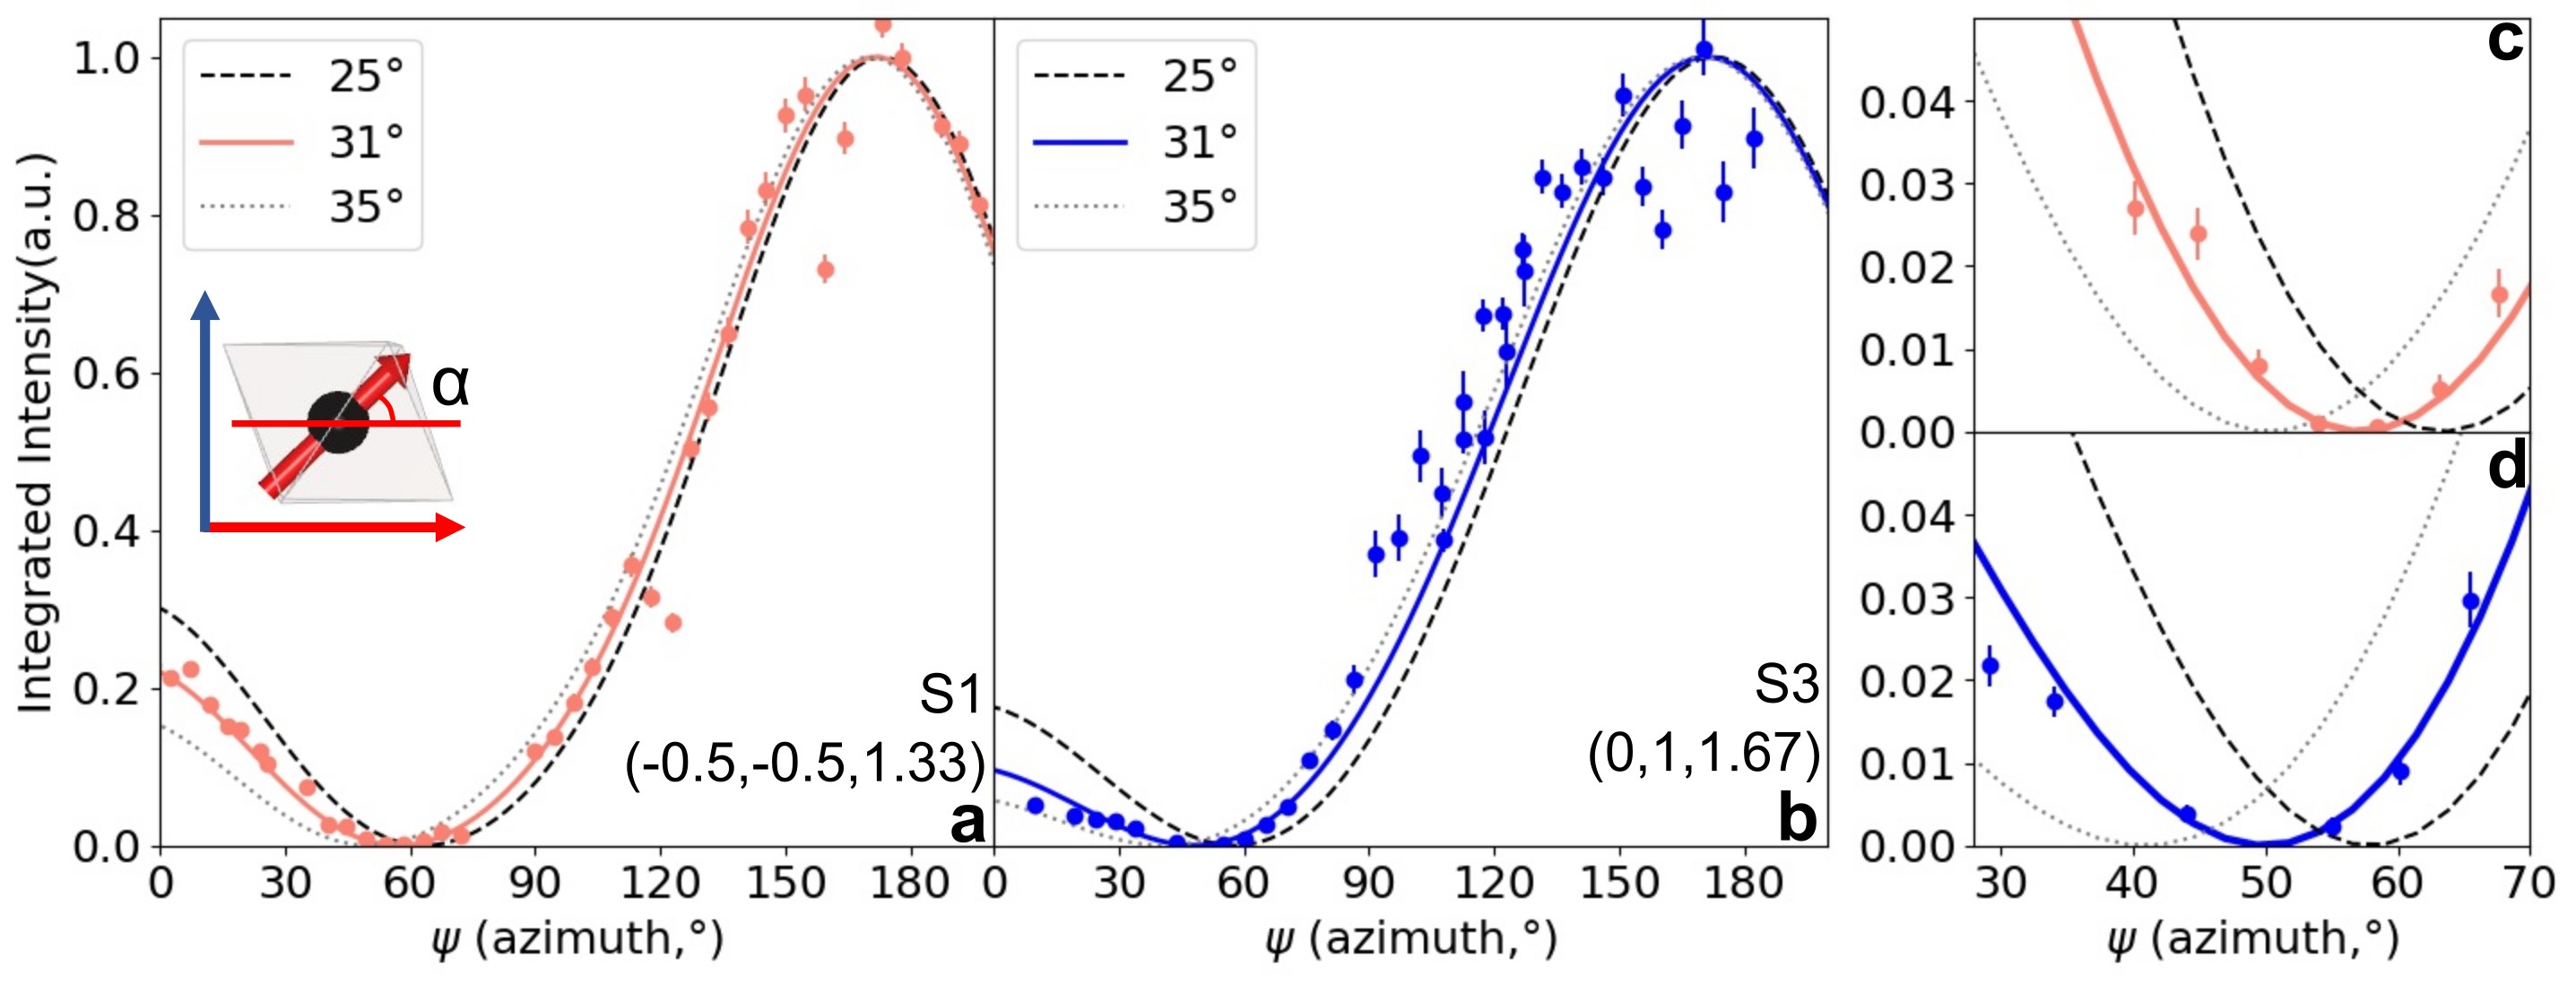
In the -’ polarization configuration, the magnetic scattering intensity is proportional to the square of the projection of the magnetic moment, , onto the scattered photon wavevector, : . By rotating the sample by the azimuthal angle (See Fig. 3a) with the scattering vector fixed, the projection undergoes modulation as a function of . By fitting the -dependence of the REXS intensity, the out-of-plane canting angle (see the inset in Fig. 5a) can be precisely determined.
To obtain the magnetic scattering intensity at each azimuthal angle, we integrated both rocking-curve scans of and . One of the difficulties we encountered during our azimuthal dependence study was the mismatch in the beam footprint and the sample shape as varied. To eliminate the magnetic scattering intensity modulation attributed to this beam footprint variation, the magnetic scattering intensity was further normalized with respect to the (0,0,1) structural Bragg peak intensity at each . The details of the normalization process are provided in the Supplementary Information.
Fig. 5a-b show the azimuthal dependence of the magnetic scattering intensities at for S1 and for S3, respectively. Both intensities show local maxima around =0∘ and =180∘, which suggests that magnetic moments are confined within the ac plane, perpendicular to the zigzag propagation direction, consistent with the previously proposed structure shown in Fig. 1 [10]. The global maximum at =180∘ implies that the moment is canted in the positive direction [41].
The value of canting angle can be determined by fitting the intensity data. Our best fit result yield =31(2)∘ for S1. However, for S3, determining the azimuthal angle was more challenging due to the weaker signal and the difficulty in normalization as described in Supplementary Information. In order to determine the canted angle in this case, another method was used to support the fitting result. Fig. 5c and d provide a zoomed-in view of -range where the magnetic intensity vanishes. The azimuthal angle for zero intensity, , corresponds to the condition that is perpendicular to and is very sensitive to the canted angle . For instance, if changes from 25∘ to 35∘, varies from 40∘ to 60∘ for (0,1,1.67), as illustrated in Fig. 5d. The could be determined with high precision without the need to normalize intensity between measurements. Both S1 and S3 data give which is consistent with the values obtained using the direct fitting method. Note that S1 and S3 data were obtained for different -vectors, which explains the difference in . For S1, the reference angle 0∘ is along the (1,-3,0) direction. For S3, the reference angle 0∘ is along the (-1,0,0) direction (see Supplementary Information).
3 Discussion and Conclusions
We want to point out that the observed canted moment angle of in the current study closely mirrors the result found by Sears et. al.[41]. This is important since the crystal studied in Ref. [41] has a magnetic transition temperature TN=12 K, substantially different from the samples studied here. In addition, the magnetic stacking structure of that sample is also different. In Ref. [41], the magnetic Bragg peak was found at (0,1,3/2), indicative of a magnetic structure characterized by a two-layer periodicity, which is a clear departure from the three-layer periodicity found in our study and several other recent neutron scattering studies [6, 7, 8, 10]. The observed robustness of the moment direction , independent of the sample details, is the main result of our study. However, this raises a question as to the origin of the difference in TN.
Variations in interlayer couplings could presumably explain the observed sample dependence of TN. The variations can naturally arise from stacking sequence differences. However, the interlayer interactions have been mostly ignored because the magnetic ordering can be well-explained using only the intralayer interactions, and the interlayer interactions are orders of magnitude weaker than their intralayer counterparts [42, 43, 44, 45]. It is interesting to note that stacking structure changes seem to have a dramatic effect on the magnetism of another honeycomb lattice material CrI3 [46, 47, 48, 49]. This material also goes through a structural transition from high-temperature C2/m structure to low-temperature R [50]. For this material, each layer orders ferromagnetically with the moment direction pointing perpendicular to the honeycomb planes. However, depending on how the layers are stacked, the system can order antiferromagnetically or ferromagnetically between layers [47, 48, 49]. It was found that antiferromagnetic order is preferred in the C2/m structure while ferromagnetic order is preferred in the R structure [47]. A recent muon-spin-rotation investigation reported that the magnetic ordering temperature is sensitive to the volume fraction of monoclinic and rhombohedral phases in crystals with coexisting C2/m and R phases [51]. The coexistence of C2/m and R is also frequently observed in -RuCl3, especially in thin crystals [4], and a similar investigation could be useful to elucidate the origin of the TN variation.
However, the variation in -RuCl3 may have a complicated origin, due to the complexity of the in-plane physics in this material. The nearest neighbour J-K- model is widely used to describe the magnetism in -RuCl3:
| (1) |
where describes the three distinct bonds between nearest neighbour spins and , with mutually exclusive . The model consists of an isotropic Heisenberg term (J), a bond-dependent anisotropic Kitaev term (K), and a symmetric off-diagonal () term. The presence of relatively large K and was found in many works [42, 43, 44, 52, 53, 54, 41, 55, 56, 57, 58, 59, 60, 61, 62, 63, 59, 64, 65]. The current result again corroborates these earlier studies and confirms the presence of a large term. One consequence of large is the large magnetic anisotropy between in-plane and out-of-plane susceptibilities [54, 1, 41]. However, this anisotropy ratio varies from 5 to 8 depending on the sample, strongly suggesting that sample dependence might be present for [66, 14, 67, 68, 54, 69]. While the moment canting angle is sensitive to the ratio , this sensitivity is diminished in the limit of a large interaction. According to the classical model [44], a wide range of between 1.0 and 1.6 agree within the observed range of . Therefore, the variation of in this range would be still compatible with our observation of robustness of .
To summarize, we investigated the sample dependence of the magnetic structure of two -RuCl3 samples S1 and S3, characterized by TN=7.3 K and TN=6.5 K, respectively. Two samples are distinguished clearly in their structures by the domain population. While S1 consists primarily of a single domain of the R structure, S3 has a significant mixing between two twin domains of R. However, the magnetic structure of these two samples is consistent with previously determined magnetic structure with three-layer-periodicity [10]. Despite the clear difference in and domain distribution, we find the canting angle of the ordered moment, , remains unchanged in both samples.
4 Methods
All batches of -RuCl3 crystals were grown using the chemical vapor transport method described in previous studies [4]. S1, S2, and S3 were from the same batch while S4 and S5 were grown in separate batches. Two samples, designated as sample 1 (S1) and sample 3 (S3), were selected for single crystal X-ray diffraction measurements performed at the QM2 beamline at Cornell High Energy Synchrotron Source (CHESS). A photon energy of 20keV was employed for studying the samples in transmission geometry. During the data collection, the samples underwent a 360∘ rotation in 0.1∘ steps, and a Pilatus 6M area detector was used to capture the intensity. The temperature was controlled by a helium cryostream onto the -RuCl3 crystals, enabling reciprocal maps to be obtained at T=200K and 20K, above and below the structural transition, respectively.
The same two samples (S1 and S3) were also subjected to resonant elastic X-ray scattering study at the 4-ID beamline at National Synchrotron Light Source II (NSLS II) at Brookhaven National Lab. The incident photon energy was tuned to the ruthenium L3 edge (2.837keV). A graphite analyzer (002) was utilized for analyzing the scattered photons, allowing those with polarization parallel to the scattering plane ( polarization) to be selected. The samples were cooled using a closed-cycle cryostat, enabling cooling down to T=5K, below the magnetic transition temperature.
Data Availability The data that support the findings of this study are available from the corresponding author upon reasonable request.
Code Availability The custom codes for analyzing the data and implementing the calculation in this study are available from the corresponding author upon reasonable request.
Acknowledgments We thank Jiefu Cen and Hae Young Kee for insightful discussions. Work at the University of Toronto was supported by the Natural Science and Engineering Research Council (NSERC) of Canada, Canadian Foundation for Innovation, and Ontario Research Fund. Resonant elastic x-ray scattering experiment was conducted at 4-ID beamline of the National Synchrotron Light Source II, a U.S. Department of Energy (DOE) Office of Science User Facility operated for the DOE Office of Science by Brookhaven National Laboratory under Contract No. DE-SC0012704. Single crystal X-ray diffraction work is based on research conducted at the Center for High-Energy X-ray Sciences (CHEXS), which is supported by the National Science Foundation (BIO, ENG and MPS Directorates) under award DMR-1829070.
Supplementary Information The supplementary material is available at …
Author Contributions The samples were grown by S.K. and prepared together with E.H. for the experiment. The resonant elastic experiments were carried out by S.K. and E.H. with the help of C.N. and the X-ray diffraction experiments were carried out by S.K. and E.H. with the help of J.R. The data was analyzed by S.K.. The idea was conceived by Y.K. and the work was supervised by Y.K. All authors contributed to the writing and preparation of the manuscript.
Competing Interests The authors declare no competing interests.
References
- \bibcommenthead
- [1] Winter, S. M. et al. Breakdown of magnons in a strongly spin-orbital coupled magnet. Nature Communications 8, 1152 (2017).
- [2] Takagi, H., Takayama, T., Jackeli, G., Khaliullin, G. & Nagler, S. E. Concept and realization of Kitaev quantum spin liquids. Nat. Rev. Phys. 1, 264–280 (2019).
- [3] Motome, Y., Sano, R., Jang, S., Sugita, Y. & Kato, Y. Materials design of Kitaev spin liquids beyond the Jackeli–Khaliullin mechanism. Journal of Physics: Condensed Matter 32, 404001 (2020).
- [4] Kim, S., Yuan, B. & Kim, Y.-J. -RuCl3 and other Kitaev materials. APL Materials 10 (2022). 080903.
- [5] Plumb, K. W. et al. -RuCl3: A spin-orbit assisted Mott insulator on a honeycomb lattice. Phys. Rev. B 90, 041112 (2014).
- [6] Sears, J. A. et al. Magnetic order in -RuCl3: A honeycomb-lattice quantum magnet with strong spin-orbit coupling. Phys. Rev. B 91, 144420 (2015).
- [7] Banerjee, A. et al. Proximate Kitaev quantum spin liquid behaviour in a honeycomb magnet. Nat. Mater. 15, 733–740 (2016). Article.
- [8] Banerjee, A. et al. Excitations in the field-induced quantum spin liquid state of -RuCl3. npj Quantum Materials 3, 8 (2018).
- [9] Do, S.-H. et al. Majorana fermions in the Kitaev quantum spin system -RuCl3. Nature Physics 13, 1079–1084 (2017).
- [10] Balz, C. et al. Field-induced intermediate ordered phase and anisotropic interlayer interactions in -RuCl3. Phys. Rev. B 103, 174417 (2021).
- [11] Sandilands, L. J., Tian, Y., Plumb, K. W., Kim, Y.-J. & Burch, K. S. Scattering continuum and possible fractionalized excitations in -RuCl3. Phys. Rev. Lett. 114, 147201 (2015).
- [12] Zheng, J. et al. Gapless spin excitations in the field-induced quantum spin liquid phase of -RuCl3. Phys. Rev. Lett. 119, 227208 (2017).
- [13] Jackeli, G. & Khaliullin, G. Mott insulators in the strong spin-orbit coupling limit: From Heisenberg to a quantum compass and Kitaev models. Phys. Rev. Lett. 102, 017205 (2009).
- [14] Sears, J. A. et al. Magnetic order in -RuCl3: A honeycomb-lattice quantum magnet with strong spin-orbit coupling. Phys. Rev. B 91, 144420 (2015).
- [15] Johnson, R. D. et al. Monoclinic crystal structure of -RuCl3 and the zigzag antiferromagnetic ground state. Phys. Rev. B 92, 235119 (2015).
- [16] Sears, J. A., Zhao, Y., Xu, Z., Lynn, J. W. & Kim, Y.-J. Phase diagram of -RuCl3 in an in-plane magnetic field. Phys. Rev. B 95, 180411 (2017).
- [17] Baek, S.-H. et al. Evidence for a field-induced quantum spin liquid in -RuCl3. Phys. Rev. Lett. 119, 037201 (2017).
- [18] Kasahara, Y. et al. Majorana quantization and half-integer thermal quantum Hall effect in a Kitaev spin liquid. Nature 559, 227–231 (2018).
- [19] Ponomaryov, A. N. et al. Nature of magnetic excitations in the high-field phase of -RuCl3. Phys. Rev. Lett. 125, 037202 (2020).
- [20] Leahy, I. A. et al. Anomalous thermal conductivity and magnetic torque response in the honeycomb magnet -RuCl3. Phys. Rev. Lett. 118, 187203 (2017).
- [21] Modic, K. A. et al. Scale-invariant magnetic anisotropy in -RuCl3 at high magnetic fields. Nature Physics 17, 240–244 (2021).
- [22] Kasahara, Y. et al. Unusual thermal Hall effect in a Kitaev spin liquid candidate -RuCl3. Phys. Rev. Lett. 120, 217205 (2018).
- [23] Yokoi, T. et al. Half-integer quantized anomalous thermal Hall effect in the Kitaev material candidate -RuCl3. Science 373, 568–572 (2021).
- [24] Yamashita, M., Gouchi, J., Uwatoko, Y., Kurita, N. & Tanaka, H. Sample dependence of half-integer quantized thermal Hall effect in the Kitaev spin-liquid candidate -RuCl3. Phys. Rev. B 102, 220404 (2020).
- [25] Li, H., Li, W. & Su, G. High-field quantum spin liquid transitions and angle-field phase diagram of the Kitaev magnet -RuCl3. Phys. Rev. B 107, 115124 (2023).
- [26] Gass, S. et al. Field-induced transitions in the Kitaev material -RuCl3 probed by thermal expansion and magnetostriction. Phys. Rev. B 101, 245158 (2020).
- [27] Czajka, P. et al. Oscillations of the thermal conductivity in the spin-liquid state of -RuCl3. Nat. Phys. 17, 915–919 (2021).
- [28] Lefrançois, E. et al. Evidence of a phonon Hall effect in the Kitaev spin liquid candidate -RuCl3. Phys. Rev. X 12, 021025 (2022).
- [29] Tanaka, O. et al. Thermodynamic evidence for a field-angle-dependent Majorana gap in a Kitaev spin liquid. Nat. Phys. 18, 429–435 (2022).
- [30] Kasahara, Y. et al. Quantized and unquantized thermal Hall conductance of Kitaev spin-liquid candidate -RuCl3 (2022).
- [31] Bruin, J. A. N. et al. Robustness of the thermal Hall effect close to half-quantization in -RuCl3. Nat. Phys. 18, 401–405 (2022).
- [32] Yamashita, M., Gouchi, J., Uwatoko, Y., Kurita, N. & Tanaka, H. Sample dependence of half-integer quantized thermal Hall effect in the Kitaev spin-liquid candidate -RuCl3. Phys. Rev. B 102, 220404 (2020).
- [33] Johnson, R. D. et al. Monoclinic crystal structure of -RuCl3 and the zigzag antiferromagnetic ground state. Phys. Rev. B 92, 235119 (2015).
- [34] Cao, H. B. et al. Low-temperature crystal and magnetic structure of -RuCl3. Phys. Rev. B 93, 134423 (2016).
- [35] Stahl, Q. et al. Pressure-tuning of -RuCl3 towards the ideal Kitaev-limit (2022).
- [36] Park, S.-Y. et al. Emergence of the Isotropic Kitaev Honeycomb Lattice with Two-dimensional Ising Universality in -RuCl3. ArXiv e-prints (2016).
- [37] Mu, S. et al. Role of the third dimension in searching for majorana fermions in -RuCl3 via phonons. Phys. Rev. Res. 4, 013067 (2022).
- [38] Zhang, H. et al. Stacking disorder and thermal transport properties of -RuCl3. ArXiv e-prints (2023).
- [39] Kim, S., Horsley, E., Ruff, J. P. C., Moreno, B. D. & Kim, Y.-J. Structural transition and magnetic anisotropy in -RuCl3 (2023).
- [40] Bruin, J. A. N. et al. Origin of oscillatory structures in the magnetothermal conductivity of the putative Kitaev magnet -RuCl3. APL Materials 10, 090703 (2022).
- [41] Sears, J. A. et al. Ferromagnetic Kitaev interaction and the origin of large magnetic anisotropy in -RuCl3. Nature Physics 16, 837–840 (2020).
- [42] Rau, J. G., Lee, E. K.-H. & Kee, H.-Y. Generic spin model for the honeycomb iridates beyond the Kitaev limit. Phys. Rev. Lett. 112, 077204 (2014).
- [43] Winter, S. M., Li, Y., Jeschke, H. O. & Valentí, R. Challenges in design of Kitaev materials: Magnetic interactions from competing energy scales. Phys. Rev. B 93, 214431 (2016).
- [44] Chaloupka, J. & Khaliullin, G. Magnetic anisotropy in the Kitaev model systems and . Phys. Rev. B 94, 064435 (2016).
- [45] Maksimov, P. A. & Chernyshev, A. L. Rethinking -RuCl3. Phys. Rev. Res. 2, 033011 (2020).
- [46] Huang, B. et al. Layer-dependent ferromagnetism in a van der Waals crystal down to the monolayer limit. Nature 546, 270–273 (2017).
- [47] Sivadas, N., Okamoto, S., Xu, X., Fennie, C. J. & Xiao, D. Stacking-dependent magnetism in bilayer CrI3. Nano Letters 18, 7658–7664 (2018).
- [48] Jiang, P. et al. Stacking tunable interlayer magnetism in bilayer . Phys. Rev. B 99, 144401 (2019).
- [49] Kong, X., Yoon, H., Han, M. J. & Liang, L. Switching interlayer magnetic order in bilayer CrI3 by stacking reversal. Nanoscale 13, 16172–16181 (2021).
- [50] McGuire, M. A., Dixit, H., Cooper, V. R. & Sales, B. C. Coupling of crystal structure and magnetism in the layered, ferromagnetic insulator CrI3. Chemistry of Materials 27, 612–620 (2015).
- [51] Meseguer-Sánchez, J. et al. Coexistence of structural and magnetic phases in van der waals magnet CrI3. Nature Communications 12, 6265 (2021).
- [52] Chaloupka, J. c. v. & Khaliullin, G. Hidden symmetries of the extended Kitaev-Heisenberg model: Implications for the honeycomb-lattice iridates . Phys. Rev. B 92, 024413 (2015).
- [53] Rusnačko, J., Gotfryd, D. & Chaloupka, J. c. v. Kitaev-like honeycomb magnets: Global phase behavior and emergent effective models. Phys. Rev. B 99, 064425 (2019).
- [54] Lampen-Kelley, P. et al. Anisotropic susceptibilities in the honeycomb Kitaev system -RuCl3. Phys. Rev. B 98, 100403 (2018).
- [55] Suzuki, H. et al. Proximate ferromagnetic state in the Kitaev model material -RuCl3. Nature Communications 12, 4512 (2021).
- [56] Little, A. et al. Antiferromagnetic resonance and terahertz continuum in -RuCl3. Phys. Rev. Lett. 119, 227201 (2017).
- [57] Ozel, I. O. et al. Magnetic field-dependent low-energy magnon dynamics in -RuCl3. Phys. Rev. B 100, 085108 (2019).
- [58] Wu, L. et al. Field evolution of magnons in -RuCl3 by high-resolution polarized terahertz spectroscopy. Phys. Rev. B 98, 094425 (2018).
- [59] Eichstaedt, C. et al. Deriving models for the Kitaev spin-liquid candidate material -RuCl3 from first principles. Phys. Rev. B 100, 075110 (2019).
- [60] Kim, H.-S. & Kee, H.-Y. Crystal structure and magnetism in -RuCl3: An ab initio study. Phys. Rev. B 93, 155143 (2016).
- [61] Yadav, R. et al. Kitaev exchange and field-induced quantum spin-liquid states in honeycomb -RuCl3. Scientific Reports 6, 37925 (2016).
- [62] Hou, Y. S., Xiang, H. J. & Gong, X. G. Unveiling magnetic interactions of ruthenium trichloride via constraining direction of orbital moments: Potential routes to realize a quantum spin liquid. Phys. Rev. B 96, 054410 (2017).
- [63] Wang, W., Dong, Z.-Y., Yu, S.-L. & Li, J.-X. Theoretical investigation of magnetic dynamics in -RuCl3. Phys. Rev. B 96, 115103 (2017).
- [64] Suzuki, T. & Suga, S.-i. Effective model with strong Kitaev interactions for -RuCl3. Phys. Rev. B 97, 134424 (2018).
- [65] Cookmeyer, T. & Moore, J. E. Spin-wave analysis of the low-temperature thermal Hall effect in the candidate Kitaev spin liquid -RuCl3. Phys. Rev. B 98, 060412 (2018).
- [66] Kubota, Y., Tanaka, H., Ono, T., Narumi, Y. & Kindo, K. Successive magnetic phase transitions in -RuCl3: Xy-like frustrated magnet on the honeycomb lattice. Phys. Rev. B 91, 094422 (2015).
- [67] Weber, D. et al. Magnetic Properties of Restacked 2D Spin 1/2 honeycomb -RuCl3 Nanosheets. Nano Lett. 16, 3578–3584 (2016).
- [68] Banerjee, A. et al. Neutron scattering in the proximate quantum spin liquid -rucl3. Science 356, 1055–1059 (2017).
- [69] Breitner, F. A., Jesche, A., Tsurkan, V. & Gegenwart, P. Thermal decomposition of the Kitaev material -RuCl3 and its influence on low-temperature behavior. Phys. Rev. B 108, 045103 (2023).