Direct Imaging Discovery of a Substellar Companion Orbiting the Accelerating Variable Star, HIP 39017
Abstract
We present the direct imaging discovery of a substellar companion (a massive planet or low-mass brown dwarf) to the young, Doradus-type variable star, HIP 39017 (HD 65526). The companion’s SCExAO/CHARIS JHK (m) spectrum and Keck/NIRC2 L′ photometry indicate that it is an L/T transition object. A comparison of the JHKL′ spectrum to several atmospheric model grids finds a significantly better fit to cloudy models than cloudless models. Orbit modeling with relative astrometry and precision stellar astrometry from Hipparcos and Gaia yields a semi-major axis of au, a dynamical companion mass of MJ, and a mass ratio of 1.9%, properties most consistent with low-mass brown dwarfs. However, its mass estimated from luminosity models is a lower 13.8 due to an estimated young age ( 115 Myr); using a weighted posterior distribution informed by conservative mass constraints from luminosity evolutionary models yields a lower dynamical mass of MJ and a mass ratio of 1.4%. Analysis of the host star’s multi-frequency Dor-type pulsations, astrometric monitoring of HIP 39017 b, and Gaia DR4 astrometry of the star will clarify the system age and better constrain the mass and orbit of the companion. This discovery further reinforces the improved efficiency of targeted direct imaging campaigns informed by long-baseline, precision stellar astrometry.
1 Introduction
Large, ground-based telescopes assisted by facility – and, now, specialized extreme – adaptive optics (AO) systems have allowed the imaging of substellar and self-luminous Jovian companions to nearby stars (e.g. Marois et al. 2008; Lagrange et al. 2010; Macintosh et al. 2015; Chauvin et al. 2018; Currie et al. 2023b). Direct imaging is uniquely poised to probe models of planet formation; not only is it sensitive to wide separation companions in young systems, it also allows both spectral and dynamical orbital analysis for any detected companion. However, large scale, “blind” (or unbiased) surveys have found that planetary and brown dwarf companions that can be imaged with these modern, ground-based systems are rare, with only about a few percent of targeted systems yielding companion detections (Nielsen et al., 2019; Vigan et al., 2021; Currie et al., 2023a).
To account for this shortcoming, recent direct imaging surveys have turned toward targeted searches, focusing on stars showing dynamical evidence for a companion. In particular, the 25-year precision astrometry Hipparcos-Gaia Catalog of Accelerations (HGCA; Brandt 2018, 2021) identifies stars displaying acceleration inconsistent with a single-body solution. Such an acceleration could indicate a massive unseen companion, making young, nearby accelerating systems prime targets for imaging. Surveys of accelerating stars have yielded a significantly higher detection rate (Currie et al., 2021; Bonavita et al., 2022) for low mass stellar (Steiger et al., 2021; Chilcote et al., 2021), brown dwarf (Currie et al., 2020a; Bonavita et al., 2022; Kuzuhara et al., 2022; Franson et al., 2023a; Li et al., 2023), and even planetary companions of young stars (e.g. HIP 99770 b and AF Lep b; Currie et al., 2023b; De Rosa et al., 2023; Mesa et al., 2023; Franson et al., 2023b).
Given the youth of the substellar and planetary companions accessible with direct imaging, they can serve as laboratories for testing and constraining models of their formation and atmospheres (Spiegel & Burrows, 2012). Dynamical mass measurements of imaged companions can provide an independent point of comparison for spectral models. However, due to the large orbits of companions accessible with imaging, the precision of the dynamical masses derived from relative astrometry is often severely limited by small orbital coverage. Selecting imaging targets with existing long-baseline precision astrometric measurements from the HGCA offers the additional benefit of extending orbital coverage for one of the components of the system (e.g. Brandt et al. 2021a).
Age is another crucial factor in constraining the fidelity of atmospheric models for young substellar and planetary companions. These bodies cool with time, with brown dwarfs manifesting this as an apparent evolution to later spectral types. Uncertainties in system ages can have a significant impact on masses retrieved from atmospheric and evolutionary models (e.g. Moro-Martín et al. 2010). However, if the system is not a member of a coeval stellar association, obtaining precise and reliable independent age constraints can be difficult. While a number of methods to constrain stellar ages from models and empirical relations exist, they may not be applicable to every system (e.g. Dantona & Mazzitelli 1984; Mamajek & Hillenbrand 2008).
In this work, we report the direct imaging discovery of a massive planet/very-low mass brown dwarf companion 22 au from the Doradus-type variable accelerating star, HIP 39017, with spectrum resembling that of an L/T transition object. An overview of the host star is provided in Section 2.1. Observations and companion detection are described in Sections 2.2 and 2.3. Our spectral and astrometric analyses are presented in Sections 3 and 4, respectively. In Section 4.2.3, we revisit the astrometric analysis with posteriors informed by evolutionary models and the HIP 39017 system’s likely age. Finally, further discussion is included in section 5.
2 System Properties, Observations, and Data
2.1 HIP 39017
HIP 39017 (HD 65526, V769 Mon) is a A9/F0 star (Henry et al., 2011) located at a distance of 65.9 pc (Gaia Collaboration, 2022). Its spectral type and color-magnitude diagram position suggest a mass similar to those of HR 8799 and 51 Eri, M(Dupuy et al., 2022; Sepulveda & Bowler, 2022). Stassun et al. (2019) derive a photometric mass of M.
HIP 39017 is also a Doradus-type variable (Handler, 1999; Handler & Shobbrook, 2002; Henry et al., 2011), with three identified variability frequencies with periods ranging from days (Henry et al., 2011). Its variability was originally ascribed to the presence of an eclipsing binary (Perryman et al., 1997; Kazarovets et al., 1999). However, further analysis, including the identification of multiple variability cycles, resulted in its reclassification as a Doradus variable (Handler, 1999; Handler & Shobbrook, 2002; Henry et al., 2011). Thus, HIP 39017 appears to be a single star. As a Dor variable, HIP 39017 shares properties with planet-hosting stars HR 8799 and 51 Eri (Marois et al., 2010; Moya et al., 2010; Macintosh et al., 2015; Sepulveda et al., 2022).
While Tetzlaff et al. (2011) estimate an extremely young age of Myr through comparison to several stellar evolutionary models, they assume an A3 spectral type, which is in conflict with the Henry et al. results. A comparison with the Banyan- tool (Gagné et al., 2018) does not identify HIP 39017 as a member of any moving group or young association. There is currently no evidence that HIP 39017 harbors a luminous debris disk from WISE, Spitzer, or Herschel results, which are common for early-type stars at such young ages (e.g. Rieke et al., 2005), although available data for HIP 39017 are scarce.
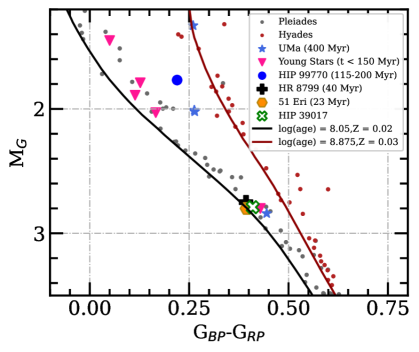
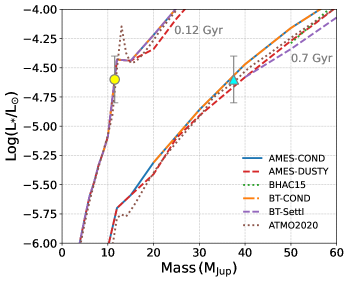
On the other hand, the star’s Gaia color-magnitude diagram position – = 2.79, = 0.42 – is nearly identical to that of the planet-hosting stars HR 8799 (40 Myr) and 51 Eri (23 Myr) (Marois et al., 2008; Macintosh et al., 2015) and consistent with or slightly below the Pleiades sequence, providing evidence of youth (Figure 1). HIP 39017’s position is slightly blueward of one Ursa Majoris member (blue star) with an interferometrically-estimated age of 440 Myr (Jones, 2016) and thus, by implication, younger. It is significantly bluer than the entire Hyades (750 Myr) locus. Given its CMD position with respect to the Pleiades sequence, an age Myr or lower for HIP 39017 is favored. While HIP 39017 is slightly lower metallicity (; Bruntt et al. 2008) than the Pleiades and Hyades, this difference in metallicity is not sufficient to shift an object of Hyades age or older to the position of HIP 39017 on the CMD. Therefore, we adopt Myr as an approximate age of the system, with a conservative upper limit of Myr for analysis that will later depend on these values (see Section 4.2.3).111In principle, HIP 39017’s Dor status could open the door to an asteroseismic age derivation for the star. However, the path towards deriving an age this way may not apply for all Dor variables. While HR 8799 was identified as displaying Dor-type pulsations (Moya et al., 2010), subsequent analysis found only a single, independent pulsation frequency (Sódor et al., 2014), limiting the application of asteroseismology in deriving the system’s age. On the other hand, 51 Eri displays multiple Dor-type pulsation modes (Sepulveda et al., 2022), which could allow an asteroseismological age.
Despite the star’s youth and proximity to the Sun, it was not targeted as a part of major, recent high-contrast imaging surveys conducted with the Spectro-Polarimetric High-contrast Exoplanet REsearch or Gemini Planet Imager instruments (Beuzit et al., 2019; Macintosh et al., 2014) and has not been observed with any other adaptive optics instrument on any 8-10 m telescope nor with the Hubble Space Telescope. However, the eDR3 version of the Hipparcos-Gaia Catalog of Accelerations (Brandt, 2021) reveals that HIP 39017 has a statistically significant astrometric acceleration () plausibly due to an unseen substellar companion. HIP 39017 is bright enough ( mag; Monet et al. 2002) to achieve high performance of ground-based extreme-AO. Thus, we targeted it as a part of the SCExAO high-contrast imaging survey of nearby, young accelerating stars (Currie et al., 2021, 2023b).
| UT Date | Instrument | Bandpass | Bandpass Wavelength | PA | ||||
|---|---|---|---|---|---|---|---|---|
| (″) | () | (s) | () | |||||
| 2022-02-21 | SCExAO/CHARIS | 0.60–0.80 | Broadband/JHK | 1.16–2.37 | 60.48 | 113 | 66.2 | |
| 2022-03-21 | Keck/PyWFS+NIRC2 | 0.83-1.33 | 3.78 | 27.0 | 100 | 43.6 | ||
| 2022-03-25 | SCExAO/CHARIS$\dagger$$\dagger$footnotemark: | 0.7–0.9 | Broadband/JHK | 18 | 5.3 | 5 | 4.1 | |
| 2022-12-31 | SCExAO/CHARIS | 0.60?$\ddagger$$\ddagger$footnotemark: | Broadband/JHK | 1.16–2.37 | 30.98 | 137 | 55.3 | |
| 2023-02-04 | Keck/NIRC2 | 0.76-1.10 | 1.63 | 20 | 5 | 0.4 |
Note. — represents the characteristic seeing measurements from the Canada France Hawaii Telescope seeing monitor. The integration time of each exposure, the number of exposures used in our analysis, and the total variation of parallactic angle in each sequence are represented by , , and , respectively.
2.2 High-Contrast Imaging Observations
We conducted adaptive optics-assisted (AO), high-contrast imaging observations of HIP 39017 using the Subaru and Keck II telescopes on Maunakea on five nights between February 2022 and March 2023 (Table 1). For the Subaru observations, the facility AO system, AO188 (Hayano et al., 2008), provided a first stage correction of atmospheric turbulence, and SCExAO then delivered a higher order correction of residual wavefront errors (Jovanovic et al., 2015b; Currie et al., 2020b); Keck II observations used either the near-IR Pyramid wavefront sensor (PyWFS Bond et al., 2020) (March 2022) or the facility Shack-Hartmann wavefront sensor (other data sets). The Subaru and Keck observations utilized a Lyot or vector vortex coronagraph, respectively, to suppress residual stellar halo light. For Subaru, sharped starlight was then sent to the CHARIS integral field spectrograph (IFS) (Groff et al., 2016), while the NIRC2 camera recorded Keck images.
All data were obtained in pupil tracking/angular differential imaging (ADI) mode (Marois et al., 2006). CHARIS data were obtained in low resolving power ( 18) spectroscopic mode to obtain wide wavelength coverage (1.1–2.4 ), while NIRC2 data were taken in the -band broadband filter. Satellite spots produced by a modulation of SCExAO’s deformable mirror provided spectrophotometric calibration for our CHARIS data and were used to register the star to a common center (Jovanovic et al., 2015a; Sahoo et al., 2020). For NIRC2, we calibrated the photometric measurements by obtaining unsaturated images of the central star before and after the main coronagraphic sequence. For the March 2022 CHARIS data, we offsetted the star from the image plane center by 05 to follow up a wide-separation candidate companion seen in the first Keck/NIRC2 epoch that is outside the nominal CHARIS field of view and was shown to be a background star (see Appendix).
We used data cubes extracted from the raw CHARIS data by the Automated Data Extraction, Processing, and Tracking System for CHARIS (ADEPTS; Tobin et al. 2020, 2022), which utilizes the CHARIS Data Reduction Pipeline (DRP; Brandt et al. 2017). We performed subsequent processing steps on the extracted CHARIS cubes – sky subtraction, image registration, spectrophotometric calibration, point-spread function subtraction, and spectral extraction – using the CHARIS Data Processing Pipeline (Currie et al., 2020b). For spectrophotometric calibration, we assumed an F0V model atmosphere from the Kurucz library (Castelli & Kurucz, 2003) with the star’s 2MASS photometry (Skrutskie et al., 2006, 2019). For the February 2022 and December 2022 data, we subtracted the PSF using A-LOCI (Currie et al., 2012, 2015) in combination with ADI only. For the shallower March 2022 data focused on an outer candidate, we simply subtracted the radial intensity profile of each slice of each cube before rotating all cubes to the north and median-combining.
We processed the NIRC2 images with the VIP package from Gomez Gonzalez et al. (2017) and the -band data using the general-use pipeline from Currie et al. (2011, 2014). For pre-processing, we correct for pixel sensitivity variations through flat-fielding and dark subtraction in our science images. Cosmic ray artifacts are removed using the lacosmic Python package (van Dokkum, 2001), and geometric distortion is addressed combining solutions from Service et al. (2016) and the script from Yelda et al. (2010) for the NIRC2 camera’s narrow-field mode. The post-alignment data cube has a centering stability of less than 0.5 mas, which we also take into account in our final astrometry. For -band data post-processing, we applied the annular PCA algorithm in VIP with six principle components to subtract stellar PSF, following the methods outlined in Li et al. (2023). For the -band data, we applied a radial profile subtraction to each image before combining north-rotated images.
2.3 Detection of HIP 39017 b
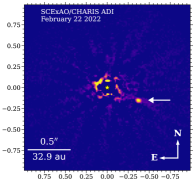
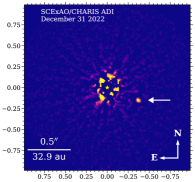
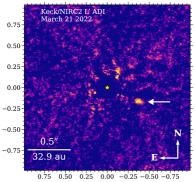
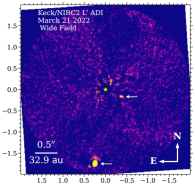
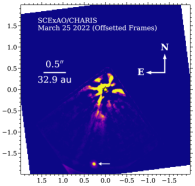
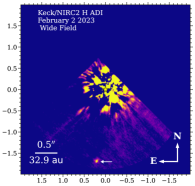
Figure 2 shows the HIP 39017 images obtained from two CHARIS data sets (February 2022 and December 2022) and one NIRC2 data set (March 2022). Each data set reveals a faint companion about 04 southwest from the star. The companion, hereafter HIP 39017 b, is detected with signal-to-noise ratios (SNRs) of 6–24 222The SNRs were calculated following the approach in Currie et al. (2011), considering the finite-element correction of Mawet et al. (2014).. The December 2022 CHARIS detection is the highest fidelity one, as HIP 39017 b is visible in each channel. The signal-to-noise and relative astrometry for the companion in each epoch are listed in Table 2.
To correct our HIP 39017 b SCExAO/CHARIS spectrophotometry and astrometry for biasing due to processing, we carried out forward modeling as in Currie et al. (2018). HIP 39017 b’s throughput ranged from 27% to 80%, depending on the data set and channel. Our forward-modeling analysis indicates minimal astrometric biasing ( 0.05 pixels in both x and y). To estimate astrometric errors, we imputed the planet forward-model at the same approximate angular separation but 1000 different azimuthal angles, compared the imputed and recovered astrometry, and computed the scatter in these values (e.g. Kuzuhara et al., 2022). Based on these analyses, we estimate an intrinsic centroiding uncertainty of 0.1 pixels in both coordinates, which we add in quadrature with an assumed stellar centroiding uncertainty of 0.25 pixels and converted to values in polar coordinates.
For Keck/NIRC2 data, we opted for a simpler method of inserting negative copies of HIP 39017 b over a range of separations and with a range of brightnesses until the companion’s signal is fully nulled. While the SCExAO/CHARIS detections have a higher SNR, the instrument’s centroiding uncertainty coupled with the larger north position angle offset result in an uncertainty comparable to NIRC2’s in the companion’s position angle.
| UT Date | Instrument$\ddagger$$\ddagger$footnotemark: | Bandpass | S/N | PA | |
|---|---|---|---|---|---|
| (mas) | (°) | ||||
| 2022-02-21 | SCExAO/CHARIS | Broadband/ | 19.3 | 404.1 4.3 | 247.351 0.616 |
| 2022-03-21 | Keck/PyWFS+NIRC2 | 6.1 | 401.1 16.0 | 247.556 0.650 | |
| 2022-12-31 | SCExAO/CHARIS | Broadband/ | 24.4 | 400.4 4.3 | 247.698 0.622 |
Note. — S/N represents the object’s signal-to-noise ratio, represents the companion.
3 Infrared Spectrum and Photometry
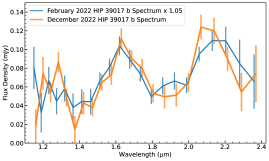
Figure 3 shows the CHARIS spectrum for HIP 39017 b extracted from both epochs. The February 2022 spectrum is much noisier in J band due to greater residual speckle noise contamination. However, the spectra agree within errors in 18 of the 22 channels, including all but one channel in the H and K passbands: the February data appear to have a systematic offset of 5-10%, consistent with slight variations in the absolute spectrophotometric calibration. We estimate HIP 39017 b’s broadband photometry in the major Mauna Kea Observatories passbands from December 2022 CHARIS data to be = 18.31 0.20, = 17.75 0.13, and = 17.02 0.14, consistent with a substellar object at the L/T transition (e.g. Dupuy & Liu, 2012; Currie et al., 2023b)333Photometry derived from the February 2022 data formally agrees within errors: = 18.91 0.41, = 17.81 0.13, and = 17.12 0.13..
We derive a companion-to-host contrast of magnitudes for the NIRC2 band data. Using the intrinsic colors for main sequence stars from Kenyon & Hartmann (1995) and Pecaut & Mamajek (2013), we adopt a primary star brightness of mag, the same as its W1 magnitude (Cutri et al., 2012), as the two are equivalent in the Rayleigh-Jeans tail of A stars. HIP 39017 b’s brightness in is then mag.
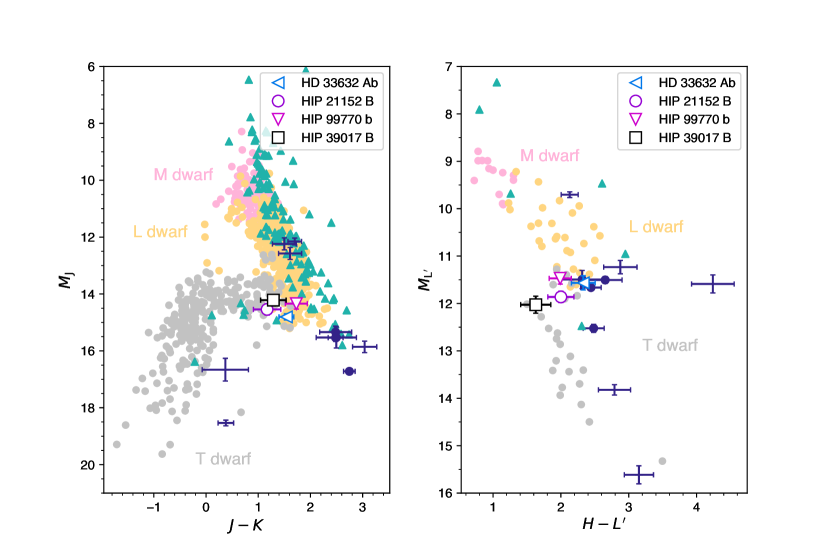
Figure 4 compares HIP 39017 b’s broadband photometry to measurements for directly-imaged planets, and directly-imaged very low-mass brown dwarfs, and field brown dwarfs. The companion’s position in both /- and /- color-magnitude diagrams overlaps with objects at the L/T transition (Saumon & Marley, 2008). HIP 39017 b’s colors also show a strong resemblance to those for directly-imaged companions around accelerating stars HIP 99770 b, HD 33632 Ab, and especially HIP 21152 B.
3.1 Comparison to Empirical Spectra
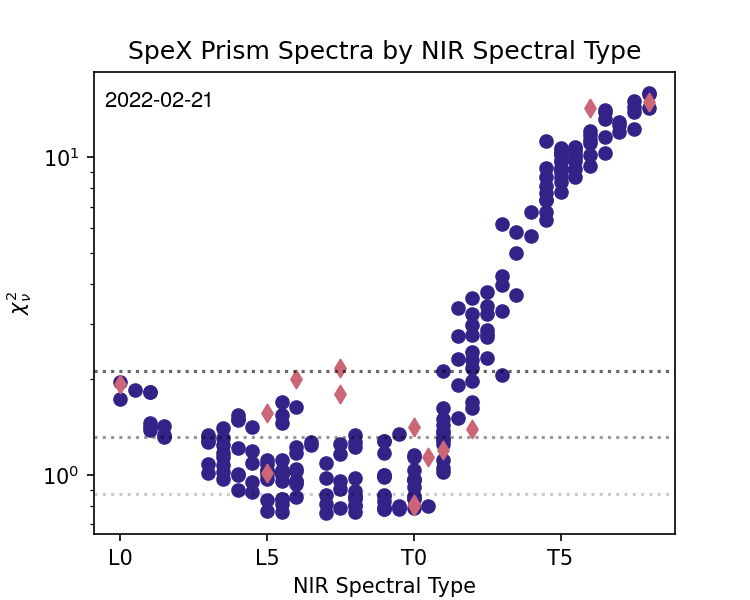
Next, we compared the CHARIS spectrum from the December 2022 data set to the archive of published L and T Dwarfs from the SpeX Prism Spectral Libraries (Burgasser, 2014).
The template spectra were first resampled to linearly-spaced bins using the FluxConservingResampler in Astropy’s specutils package (Astropy-Specutils Development Team, 2019; Carnall, 2017), before being smoothed and resampled down to the same as the CHARIS spectrum. Each template spectrum was then fit by minimizing
| (1) |
where and are the flux of the template and target spectra, respectively, in the bin, and is the scaling factor. The covariance matrix, , includes the uncertainties from both the template and target spectra. The covariance for the target SCExAO/CHARIS spectrum is derived and parameterized following Greco & Brandt (2016), with the December spectrum best fit by , , , , and . In each fitting iteration, the uncertainty of the template spectrum, scaled by the amplitude for that iteration, is added in quadrature to the diagonal of the covariance matrix for the target (Currie et al., 2018).
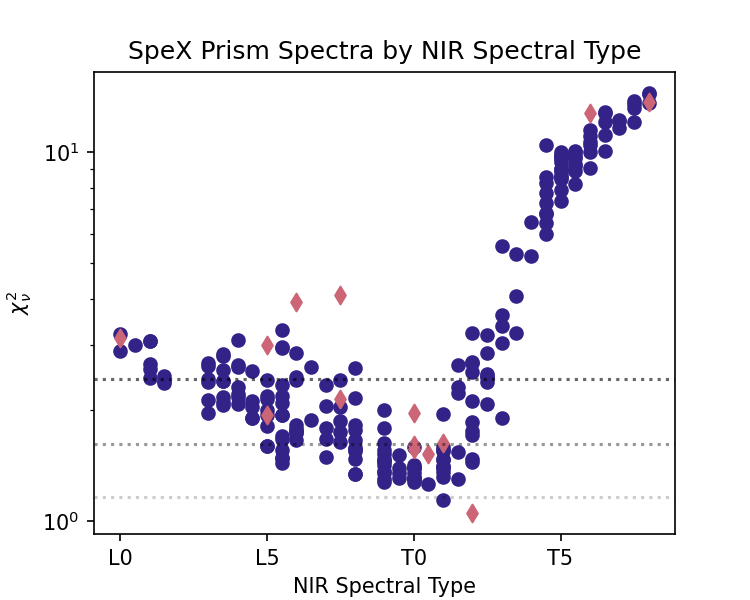
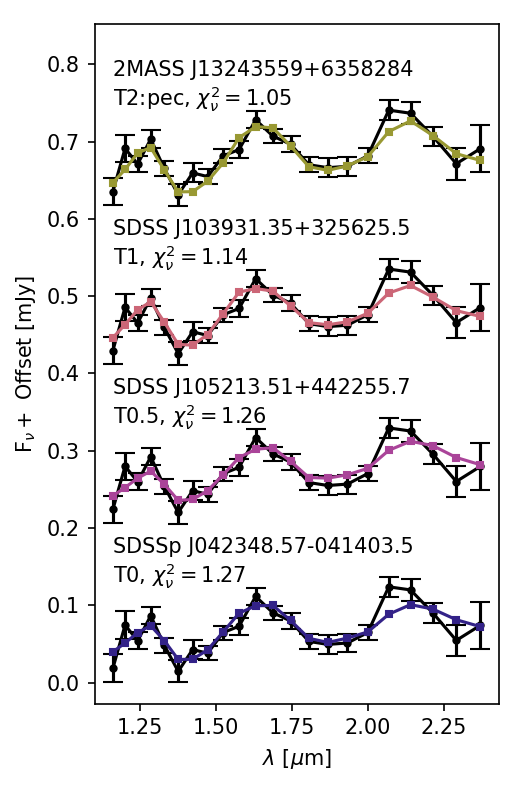
Figure 5 shows the reduced- achieved for each fitted spectrum as a function of its NIR spectral type, and Figure 6 shows the four best-fit spectra compared to that of HIP 39017b. Within , the SpeX Prism sources that best fit the HIP 39017b spectrum indicate that it is T1-2, though a closer look at those best-fit sources may be more accurately described as a peculiar T dwarf.
The best-fit source to the HIP 39017 b SCExAO/CHARIS spectrum is 2MASS J13243553+6358281 (Looper et al., 2007). Classified at the time as a peculiar T2 dwarf, spectral matching analyses postulated that its unusually red colors (Metchev et al., 2008) could be a result of an unresolved binary (Looper et al., 2007; Burgasser et al., 2010), though a more recent identification of this source as a member of the Myr old AB Doradus group suggests that its redness may instead be ascribed to its young age (Gagné et al., 2018). HIP 39017’s young age is certainly consistent with the appearance of a redder spectrum for HIP 39017b, like that seen in 2MASS J13243553+6358281.
The only other SpeX Prism library source with a fit within is SDSS J103931.35+325625.5 (2MASS J10393137+3256263; Burgasser et al. 2010). While its NIR spectrum was closest to that of a T1 dwarf, it was also classified as a possible unresolved binary (Burgasser et al., 2010).
Although photometry was not included in this fit, we briefly compare the measured or estimated color of the four best-fit SpeX library sources in Figure 6 to that of HIP 39017b, . Of the four sources, only SDSSp J042348.57-041403.5 has measured MKO photometry (Leggett et al., 2002). For the remaining three, we use the photometric transformation relation from Leggett et al. (2019) to estimate their from Spitzer and m photometry (Kirkpatrick et al., 2021; Spitzer Science Center & Infrared Science Archive (IRSA)(2021), SSC; Leggett et al., 2007), combined with measured MKO -band photometry (Zhang et al., 2021; Chiu et al., 2006). We find that the measured and derived colors of these four sources are somewhat redder than HIP 39017b, with values between mag. However, a comparison of the absolute magnitudes is complicated by the unknown binarity of most of these library sources. In fact, SDSSp J042348.57-041403.5 has been resolved into a close LT binary (Dupuy & Liu, 2017).
| Model Grid | C/O | [M/H] | clouds | CH4aaWhether or not reduced CH4 abundances were reduced by a factor of 10. Grids with reduced CH4 only available for the Lacy/Burrows 99770 models. | ||||
|---|---|---|---|---|---|---|---|---|
| (K) | (RJ) | |||||||
| SONORA BOBCAT | 1700 | 4.0 | 1.0 | 0.0bbOnly value of this parameter available in the model grid. | ncbbOnly value of this parameter available in the model grid. | nobbOnly value of this parameter available in the model grid. | 2.82 | 0.51 |
| SONORA DIAMONDBACK | 1300 | 4.0 | 1.0bbOnly value of this parameter available in the model grid. | 0.0 | f3 | nobbOnly value of this parameter available in the model grid. | 1.10 | 0.87 |
| LACY/BURROWS 99770 | 1500 | 4.5 | 1.0bbOnly value of this parameter available in the model grid. | 0.0bbOnly value of this parameter available in the model grid. | AEE100 | no | 1.59 | 0.69 |
Note. — Companion radius, , is derived from the fitted model flux using the Gaia DR3 system distance ( pc; Gaia Collaboration 2022).
3.2 Comparison to Atmospheric Model Spectra
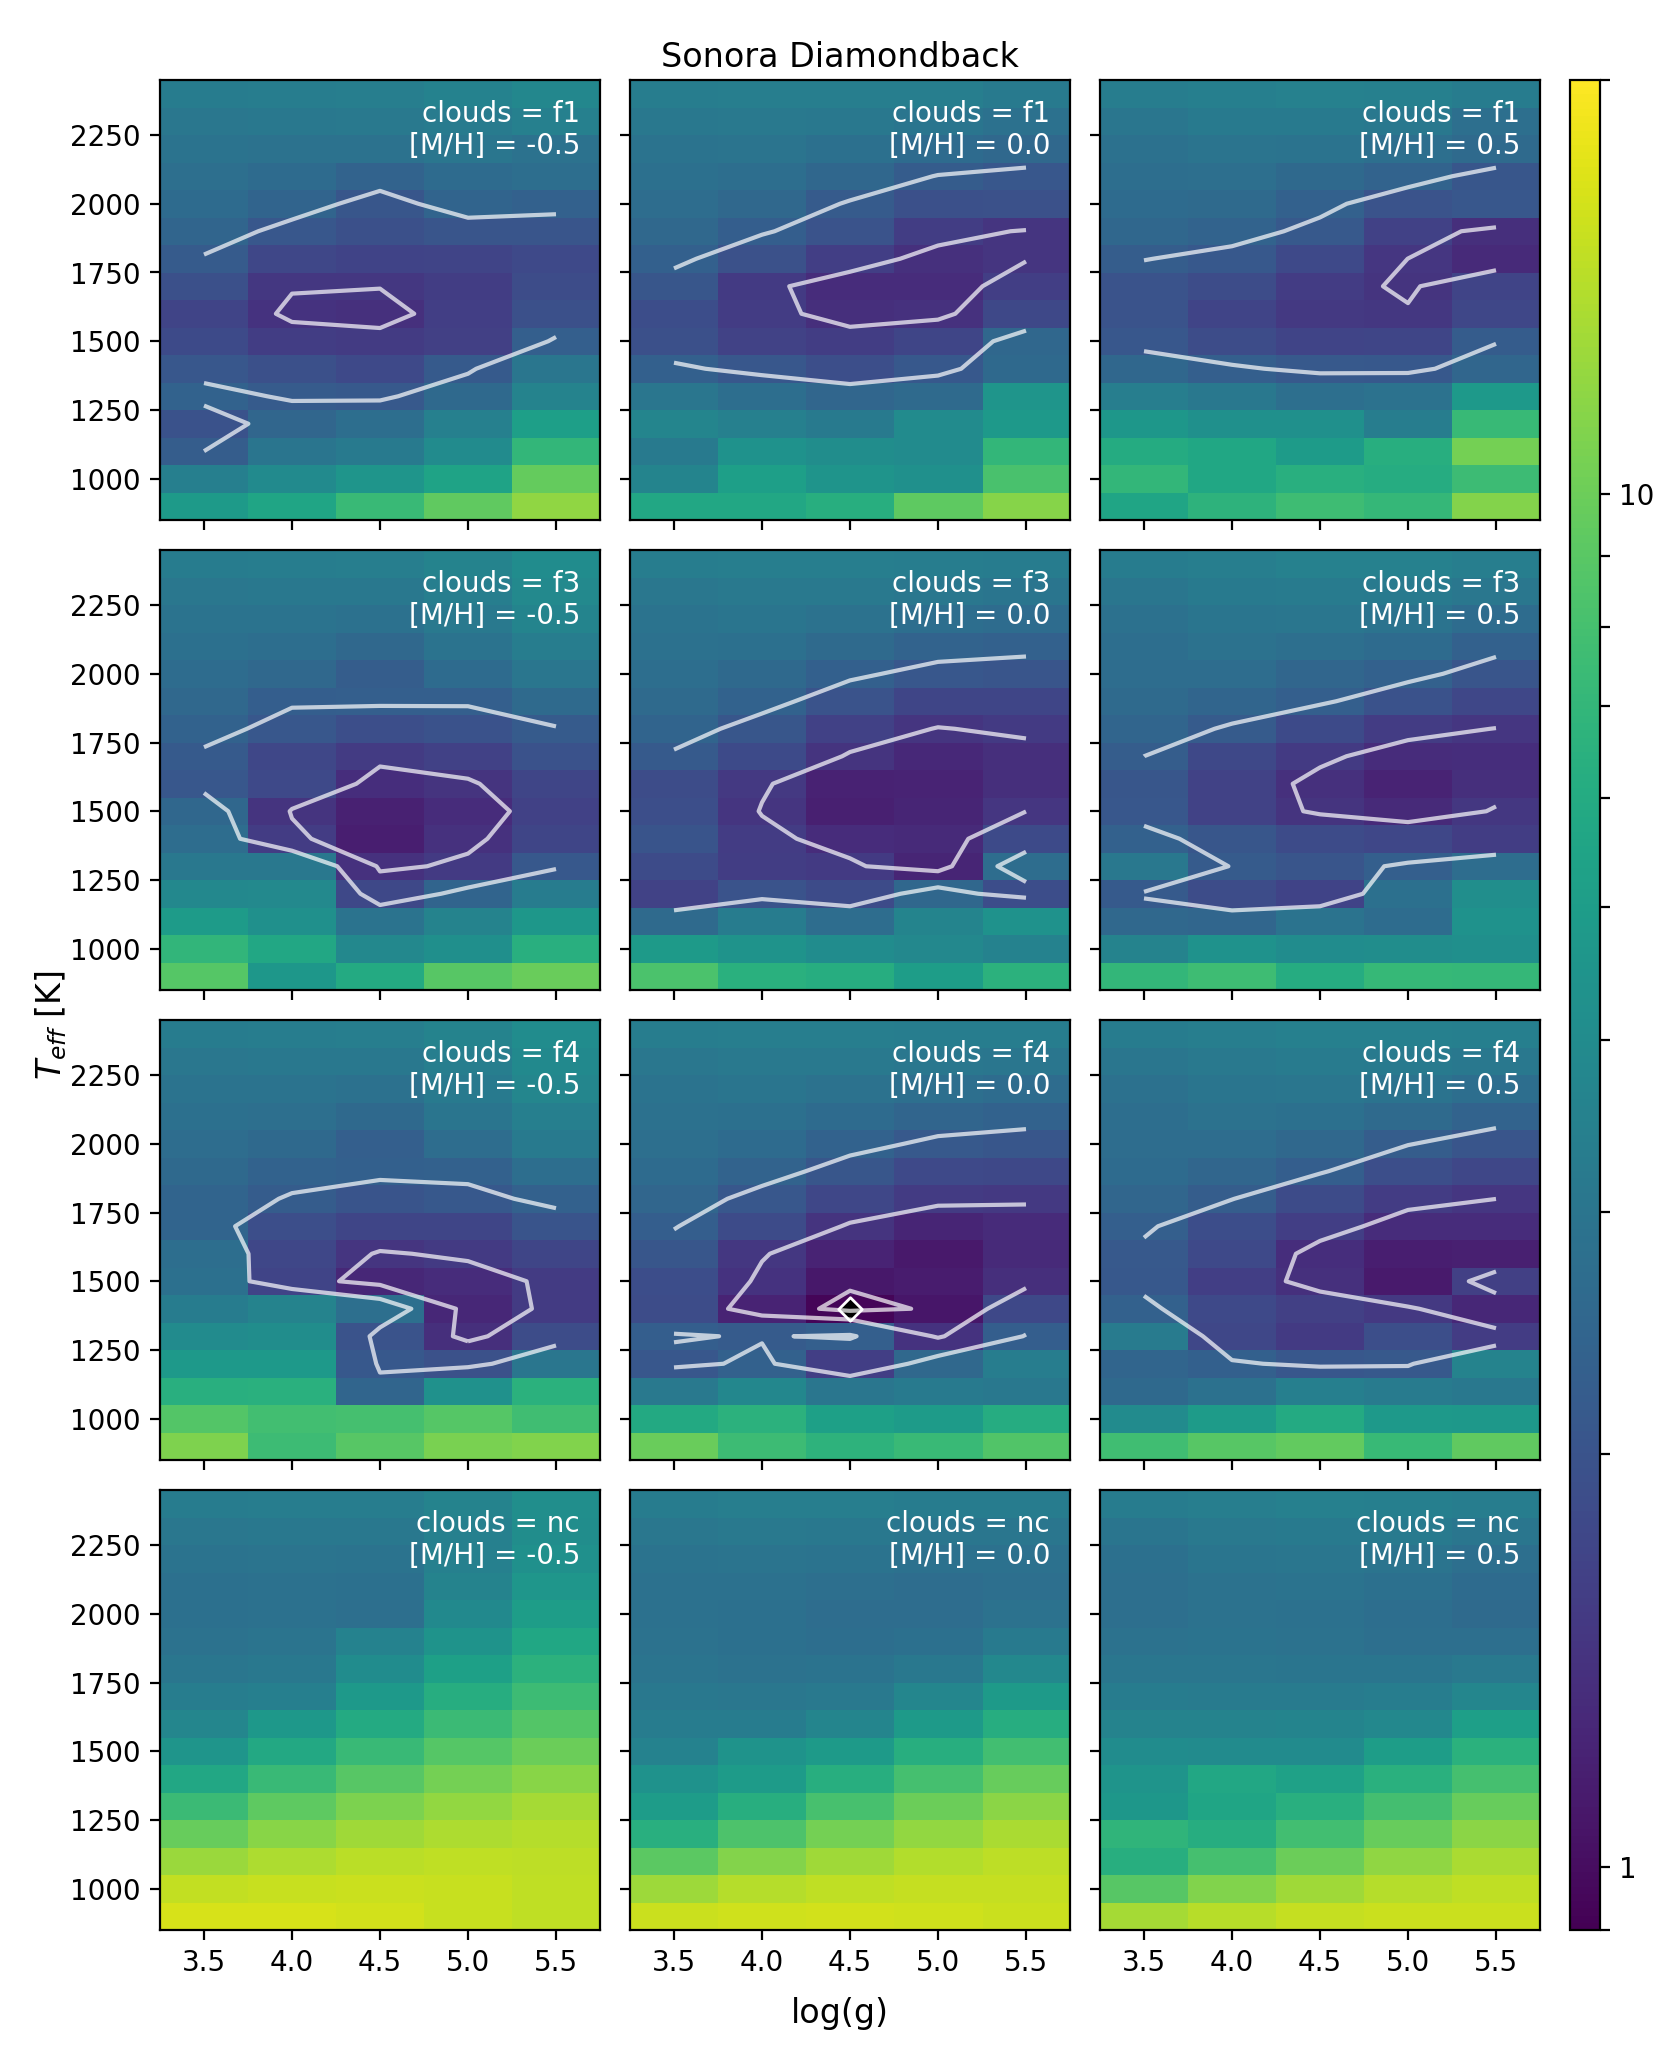
We compare the HIP 39017b spectrum from the December 2022 CHARIS observations along with the Keck/NIRC2 photometry to three model atmosphere grids: the Sonora Bobcat models (Marley et al., 2021), the Sonora Diamondback models (Morley et al., in prep), and the Lacy-Burrows models generated for the analysis of HIP 99770b (Currie et al., 2023b).
Fitting followed a similar procedure as the empirical spectral fits described in Section 3.1, with a few caveats. Due to the lack of uncertainty arising from the model spectral points, the covariance matrix, , used when calculating the fit is just that of the measured CHARIS spectrum. The calculation of from Equation 1 also includes the additional photometric term, . Each model spectrum is fit to the observed spectrum by varying the scaling parameter for the entire model spectrum, . Additional parameters for each model spectrum are as defined in the pre-generated model grid. A summary of the best fit model parameters and their for each model grid is given in Table 3.
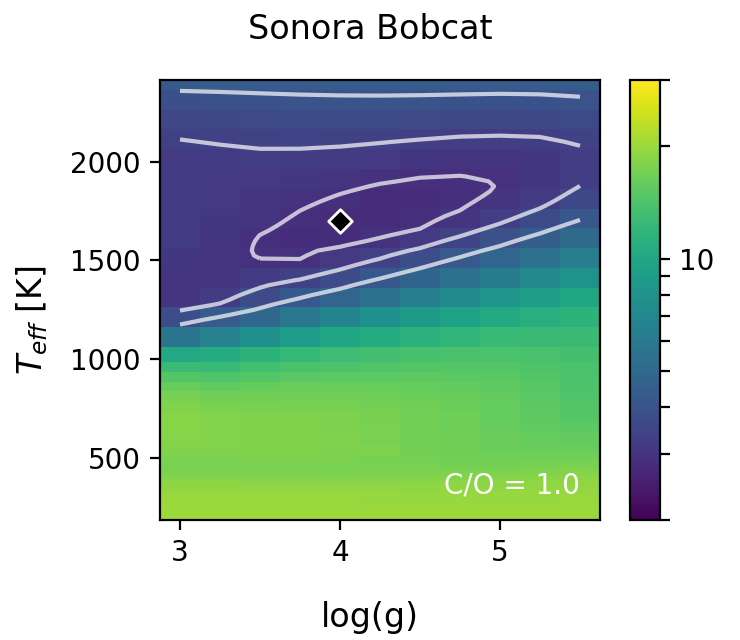
The Sonora models are a family of self-consistent atmospheric models for L, T, and Y dwarfs and self-luminous, young planets (Marley et al., 2021; Karalidi et al., 2021). Bobcat, the first of the Sonora models released, invokes equilibrium chemistry and cloudless atmospheres (Marley et al., 2021). The released spectral grid (Marley et al., 2021) spans K and for solar metallicity ([M/H]) and C/O, with extensions of this grid for C/O values of 0.5 and 1.5 available for .
The upcoming Sonora Diamondback models (Morley et al., in prep) include clouds. The spectral grid (C. Morley 2023, priv. comm.) covers K, , and [M/H] for six different realizations of clouds: and no clouds (), where is the sedimentation efficiency (Ackerman & Marley 2001; labeled therein as ). Clouds with more efficient sedimentation (higher ) are able to condense more effectively, leading to a lower optical depth (Ackerman & Marley, 2001).
To investigate an alternative cloud parameterization, we also compared the HIP 39017b spectrum to the Lacy/Burrows model grid derived for comparison to HIP 99770b (Currie et al., 2023b). The Lacy/Burrows models expand on those of Burrows et al. (2006) with updated molecular line lists and absorption cross sections, as well as non-equilibrium carbon chemistry (Currie et al., 2023b). While less expansive in their coverage of the (K) and (4.0, 4.5, 5.0) parameter space, they do include the (, ) that provided the best fit in the cloudy Sonora Diamondback models. Further, cloud parameterization is differentiated into the modal size of the atmospheric dust particles, in microns, (Currie et al., 2023b) and cloud structure:AE, AEE, and E, in order of increasing sharpness of the cutoff at the top of the clouds (Madhusudhan et al., 2011). As these cloud models have the same interior profile, a more gradual cutoff with height means the presence of more cloud material and therefore a higher total optical depth (Madhusudhan et al., 2011).
The Lacy/Burrows model spectra from Currie et al. (2023b) contain grids of AE- and AEE-type clouds with a modal dust size of m with default methane abundances, as well as grids of AEE-type, m clouds and E-type, m clouds with CH4 abundance reduced by a factor of 10.
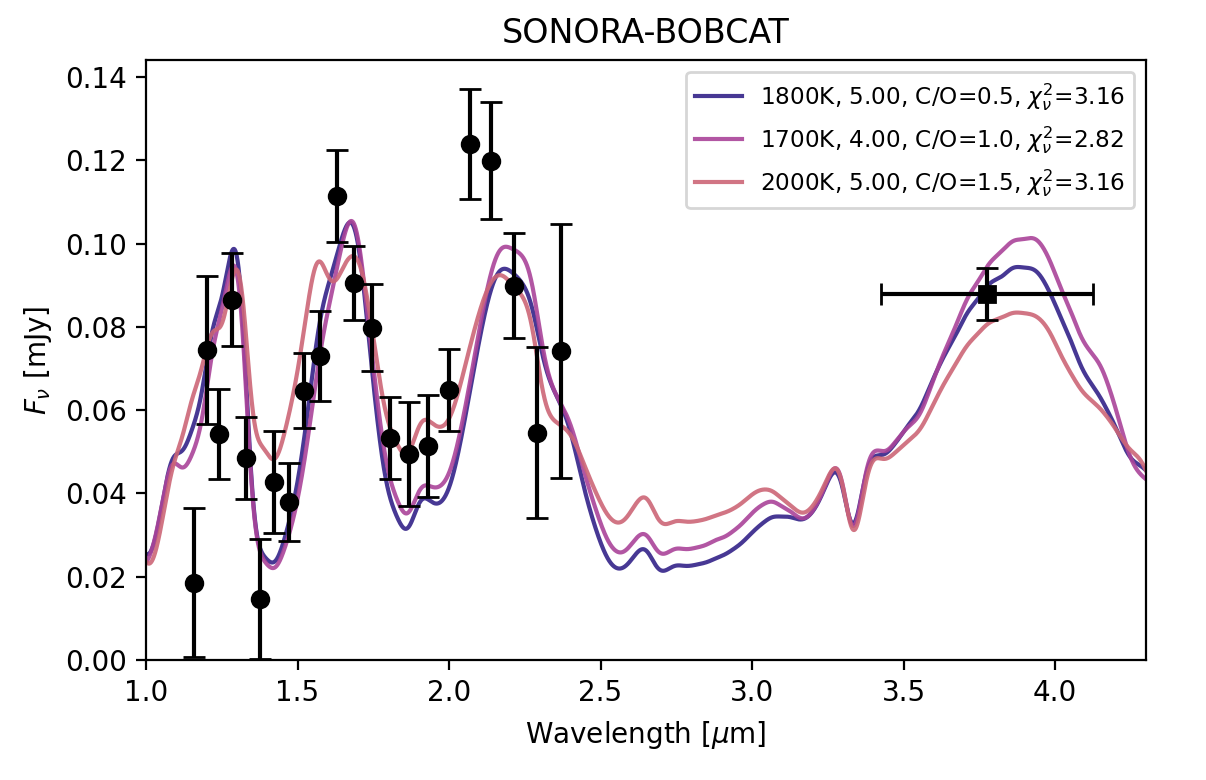
The Sonora Bobcat model that best fits the HIP 39017b spectrum has K, , and C/O, albeit with a significantly higher (2.82) than is achieved by either of the other models. Notably, the best fit Bobcat models all fall short of the high peak flux observed around m in the HIP 39017b spectrum (see Appendix B).
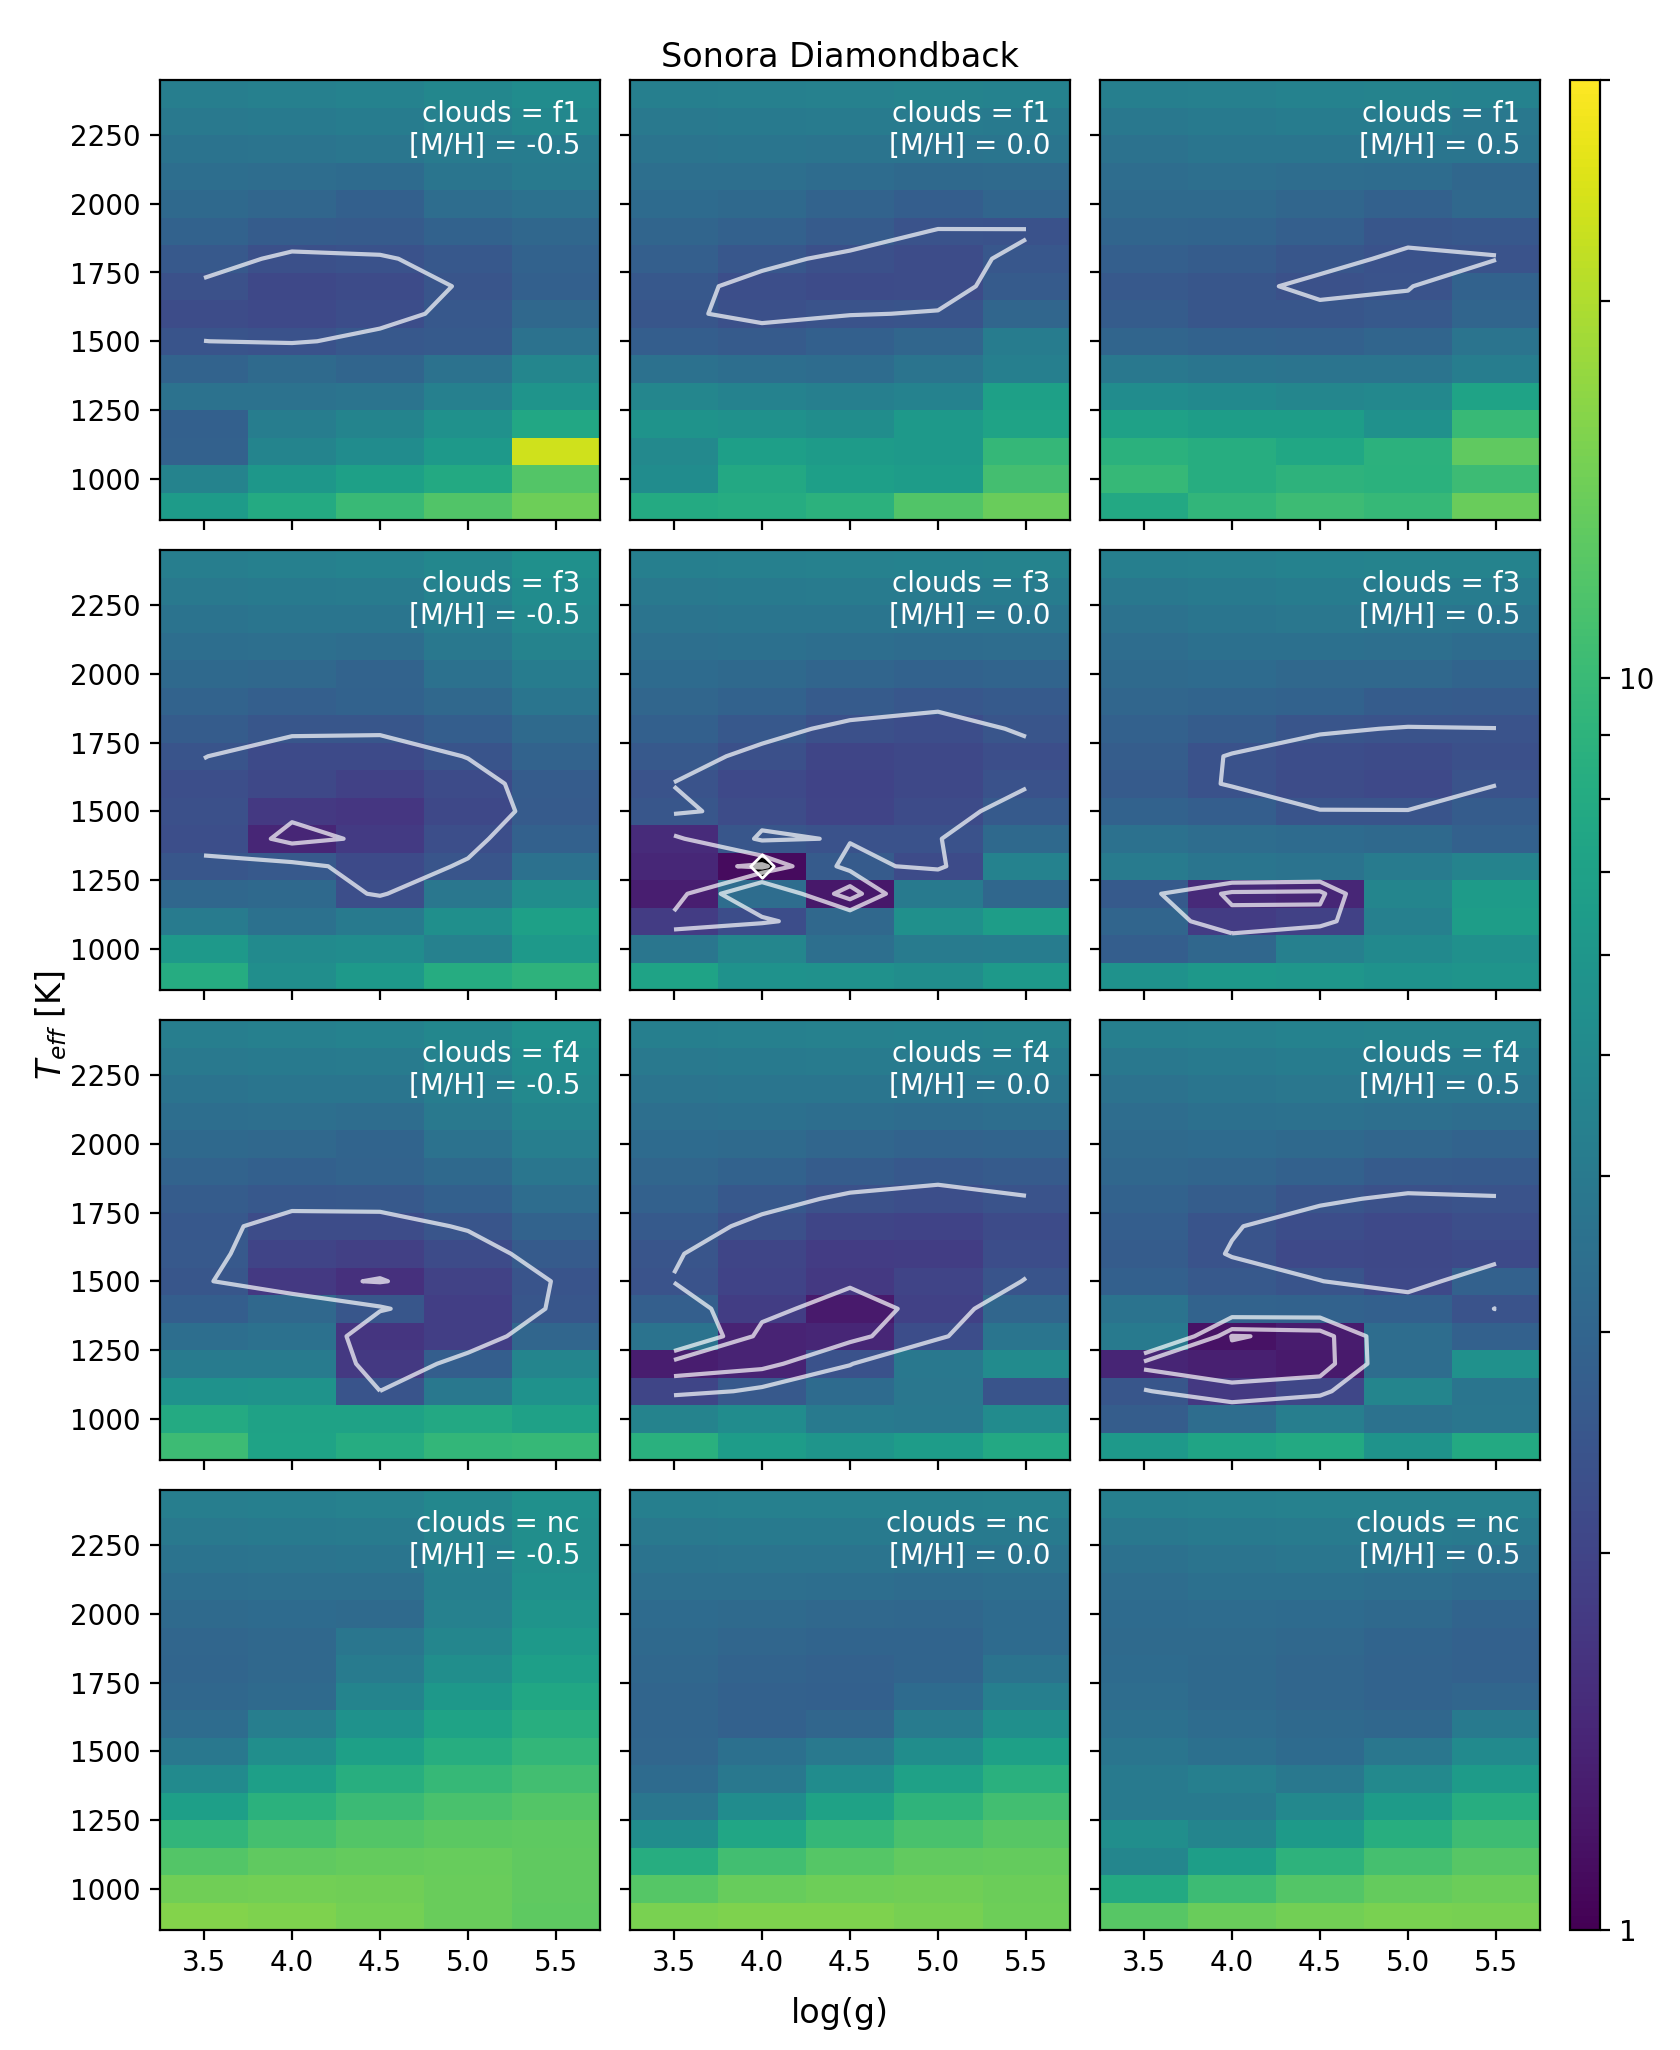
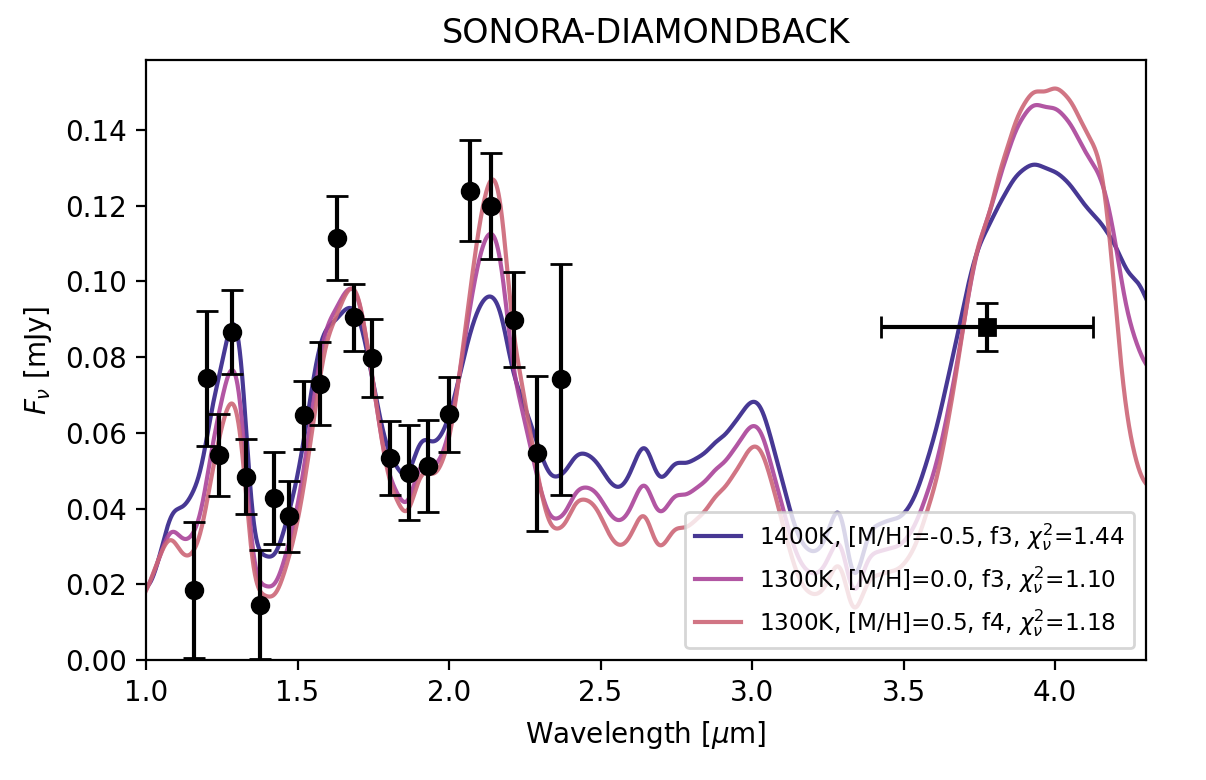
The results of the Sonora Diamondback fits are shown in Figures 7 and 8. The addition of clouds with the Sonora Diamondback models provide a smaller . The HIP 39017b spectrum is best fit by the 1300 K, , [M/H] model with (). The only other model spectrum that falls within of this minimum has the same and , but [M/H] and .
A comparison of these two model spectra (as well as the best fit model spectrum with [M/H]) can be seen in the first panel of Figure 8. These two best fit models both show a much more accurate fit to the peak flux observed at m than the cloudless models, as well as a much higher peak m.
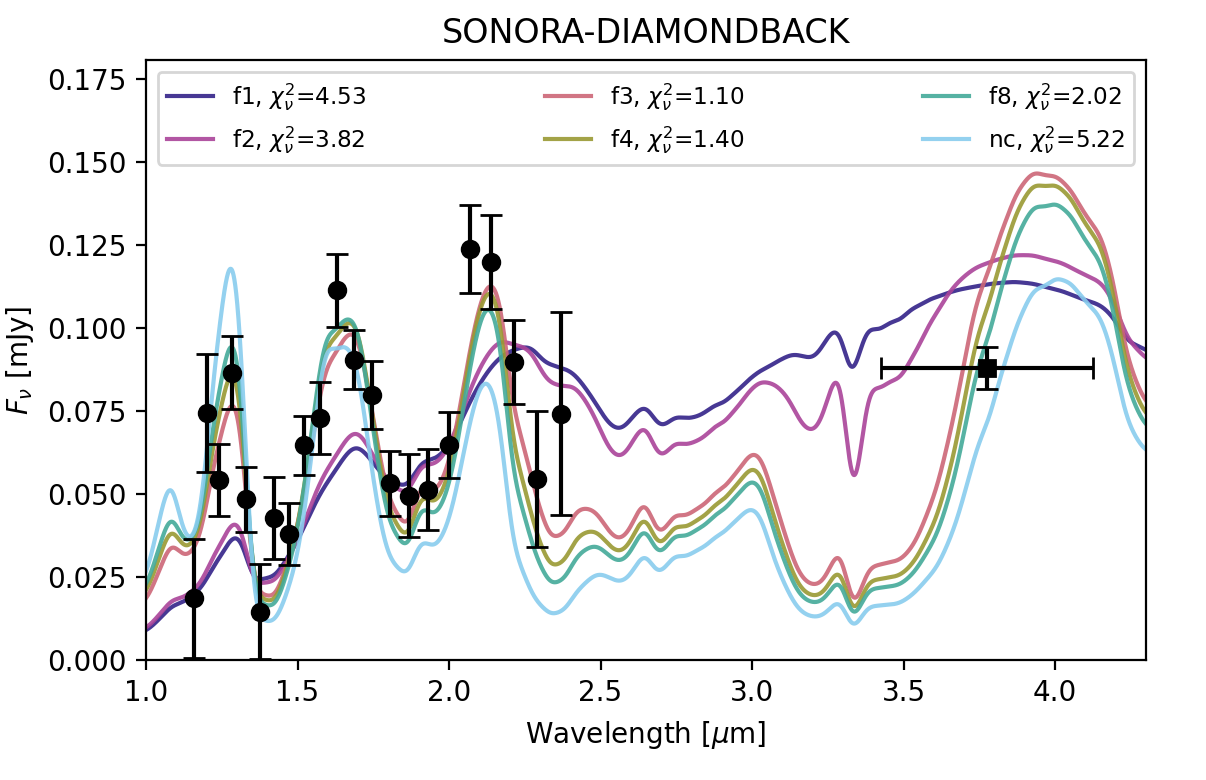
The second panel of Figure 8 shows how different model spectra with the same (1300 K), (4.0), and [M/H] (0.0) as the best fit model compare to the observations when the cloud varies. As can be seen in the figure, clouds with are necessary to achieve the heightened -band peak and slightly damped -band peak detected in the HIP 39017b CHARIS spectrum from 2022 December under the Diamondback model. Clouds with , on the other hand, induce too much reddening of the spectrum compared to our observations of HIP 39017b, flattening the peaks significantly.
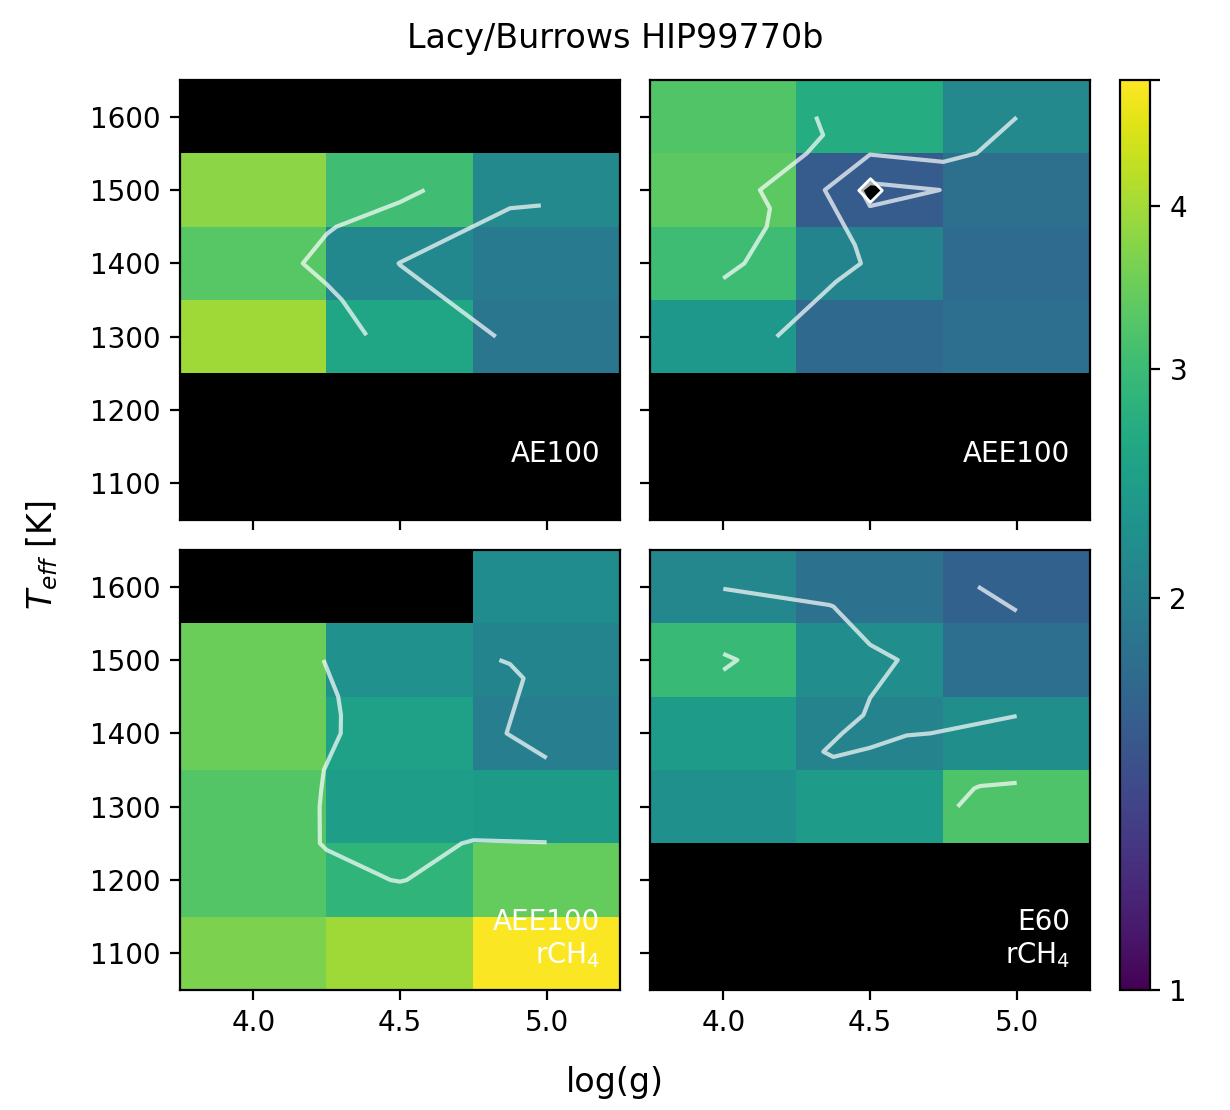
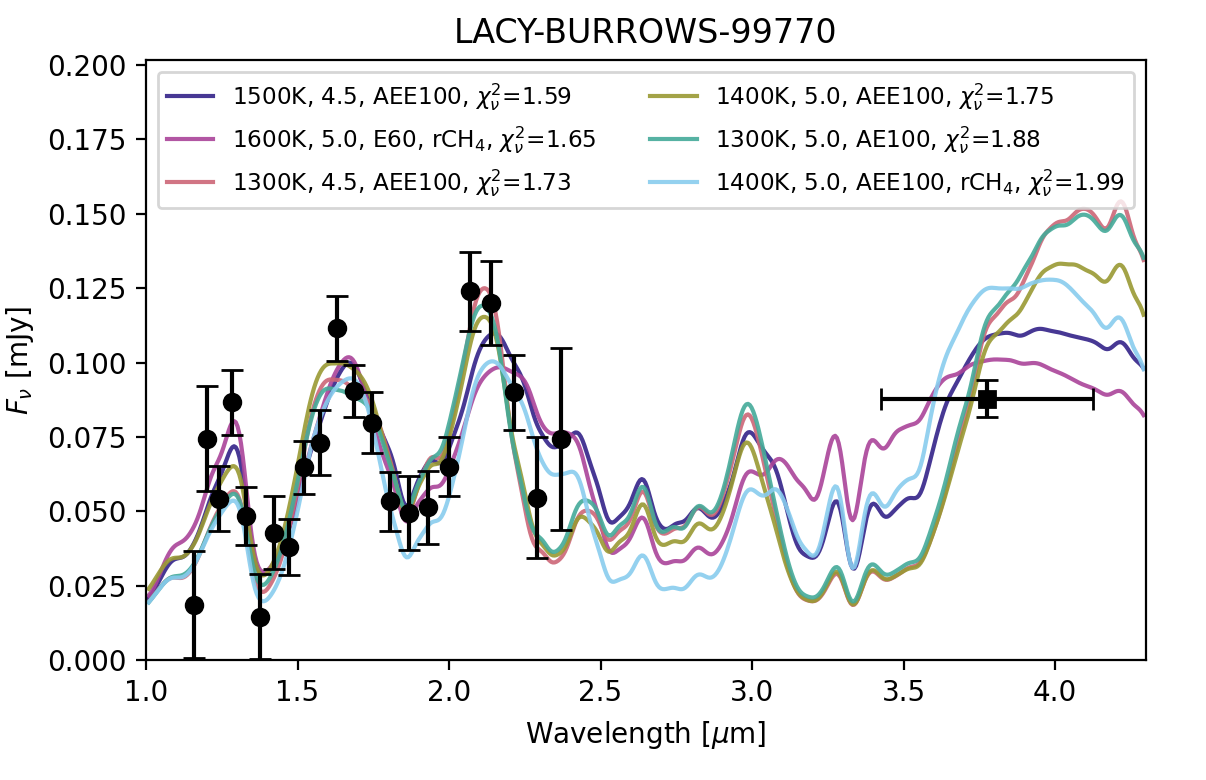
The results of our fit to the Lacy/Burrows models are shown in Figure 9. The best-fit Lacy/Burrows model from the HIP 99770b model grid for HIP 39017b is 1500 K, with solar CH4 and AEE-type clouds with m dust. Compared to the Sonora Diamondback model fits above, this represents a slightly warmer and higher gravity minimum than found for the extensive Diamondback grids (1300 K, , ). While no significant minimum is seen at 1300 K and in the Lacy/Burrows grid, this point is at the boundary of the parameter space covered for all but one of the cloud grids.
However, as can be seen from the fine coverage of the Diamondback grids, it’s not unusual for the location of the minimum to vary with cloud strength; in fact, local minima at higher K and can be seen in several of the Diamondback grids in Figure 7 (e.g. and [M/H]). Therefore, the difference in parameters at which the best fit is achieved may be due in part to a difference in parameter space coverage.
The substantial improvement in the best-fit between the cloudless Sonora Bobcat models and the cloudy Sonora Diamondback and Lacy/Burrows models implies that clouds are not only present on HIP 39017b, but also having a significant impact on its NIR spectrum. While the best-fit models in all three grids analyzed here have similar , [M/H], and C/O, the of the best-fit model is lower for the cloudy models than the cloudless grid. Among the Sonora grids, the inclusion of clouds causes the best fit to shift from 1700 K in Bobcat to 1300 K in Diamondback, the latter of which is perhaps more consistent with its apparent position near the L/T transition in Section 3.1 (Kirkpatrick, 2005).
In addition, the radius implied for the best-fit spectrum in each suite of model grids is shown in Table 3, as derived from the scaled model flux and the Gaia DR3 distance for the system ( pc; Gaia Collaboration 2022). In calculating , we include an estimated 7% systematic uncertainty in the amplitude of the measured flux. This combines a uncertainty from the intrinsic variability of brown dwarf spectra (Cruz et al., 2018) and a calibration uncertainty in the flux of the CHARIS spectral points due to variability in the satellite spot flux ratios (Wang et al., 2022).
Scaled model spectrum flux often yield unphysically small radii for brown dwarfs (e.g. Zalesky et al. 2019; Gonzales et al. 2020; Hood et al. 2023; Zhang et al. 2023), which is generally attributed to uncertainty or absent physical mechanisms in the models (Kitzmann et al., 2020; Lueber et al., 2022). Indeed, for the three model spectrum grids analyzed here, ranges from RJ. For comparison, () for a MJ object would correspond to a radius of RJ (RJ), while even a MJ object would correspond to a radius of RJ (RJ). The two cloudy models do seem to underestimate the radius (or equivalently, overestimate the flux) less than the cloudless Bobcat model, as expected with the improved of their spectral fits.
4 Astrometric Analysis
4.1 HIP 39017 b Is Not A Background Star
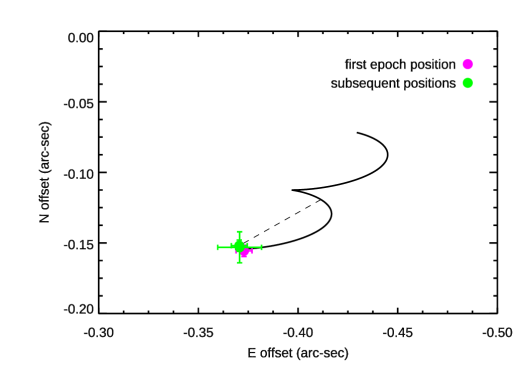
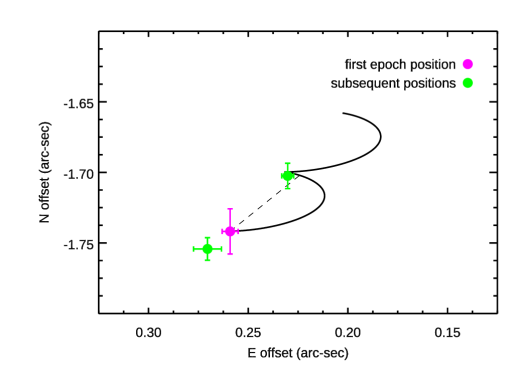
Figure 10 (top panel) compares HIP 39017 b’s astrometry to the motion expected for a background star. We rule out a stationary background star at a 12- level. In comparison, a background object seen at 17 in some data sets follows the expected background object track (see Appendix A).
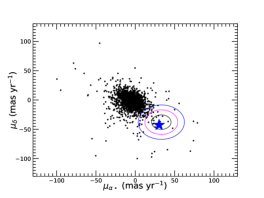
Following Nielsen et al. (2017) and Currie et al. (2023a), we compute the relative probability of HIP 39017 b being a background star () with a non-zero common proper motion versus a comoving companion . We adopt a Besancon model, modeling the background star distribution over a square-degree area with distances ranging from 0 kpc to 1 kpc ( 1 mas). Our model considers 3,085 stars as faint as 20.6, or 210-6 times the brightness of the primary (roughly our contrast limit at HIP 39017 b’s separation).
About 55 stars match HIP 39017 b’s kinematics to within the 5- level (Figure 10, bottom panel) for = 55/3085. For a 2- range over our entire set of observations of 0385–0417 and assuming we would detect HIP 39017 b between 025 and 11 from the star, we find 1.910-5 for a combined background probability of 3.410-7. For a frequency of 0.8% for 13 –80 companions and mass and semimajor axis distributions of and , we derive a planet/brown dwarf probability of 8.610-5. Thus, the relative probability of a background star versus a planet/brown dwarf is 0.004: a bound companion is more probable at the 3- level.
As found in Currie et al. (2023a), the true probability of a background star is lower if HIP 39017 b’s spectral type is considered. For a flat detection limit of 210-6 from 025 to 11 and absolute -band magnitudes from Pecaut & Mamajek (2013), a T0 dwarf must be closer than 250 . Adopting the space density of late L/early T dwarfs of 210-3 pc-3, we estimate a contamination rate of 10-6 on the CHARIS field and 510-5 for our entire survey (60 stars) to date.
4.2 Dynamical Modeling
Using the relative astrometry derived in section 2.3 along with proper motion measurements of the stellar host from Gaia DR3 (+30.22 mas/yr in right ascension, and -42.53 mas/yr in declination), we have verified a common proper motion between the host star HIP 39017 A and HIP 39017 b. Our observations also revealed a wider separation candidate companion near the edge of the field of view in all datasets. Through detailed analysis of our direct imaging observations and relative astrometry, this peripheral object has been conclusively classified as a background star demonstrating proper motions of the same magnitudes but directly contrary to the movement of the HIP 39017 Ab system (see Appendix A for a detailed explanation).
The absolute astrometry from Hipparcos-Gaia (eDR3) Catalog of Accelerations (HGCA; Brandt (2021)) complements the newly acquired relative astrometry in facilitating the orbital retrieval of HIP 39017 A. HIP 39017 A is a Doradus variable known to exhibit large stellar pulsations with flux variations of 0.6-6 or RV variations in the range of 2-4 km/s. The only four epochs of existing radial velocity (RV) data (De Cat et al., 2006; Henry et al., 2011) show significant fluctuations within the range of 2-4 km/s, rendering these RV data not useful for orbit analysis. In the absence of RV data, we conduct orbital analysis solely based on relative astrometry of HIP 39017 b from high-contrast imaging and absolute astrometry of HIP 39017 A from the HGCA.
4.2.1 Methodology
We use the open-source Bayesian orbit modeling code orvara (Brandt et al., 2021b) to infer the orbital parameters of HIP 39017 b within an MCMC framework. orvara utilizes the emcee (Foreman-Mackey et al., 2013) ensemble sampler for parallel tempering MCMC (PT-MCMC). This technique involves multiple parallel chains with varying temperatures, facilitating efficient sampling near the minimum . Chains at different temperatures swap positions periodically to enhance information sharing and sampling efficiency. Typically, the coldest chain in PT-MCMC efficiently explores the parameter space and finds the global optimum likelihood. The parameter space orvara samples is nine-dimensional, including semi-major axis, eccentricity, reference epoch longitude (), inclination, argument of periastron (), and longitude of ascending node ()), system masses ( and ), and an RV jitter term. The code enhances computational efficiency by analytically marginalizing auxiliary model parameters such as RV zero-points, parallax, and barycentric proper motion.
We analyze the orbital properties and mass of HIP 39017 b in several steps as follows. First, we perform a simple joint orvara fit to the full datasets of relative and absolute astrometry to derive posterior distributions for orbital parameters, the primary mass, and companion mass. Over the course of one year, HIP 39017 b moves little between subsequent CHARIS and NIRC2 data sets, in contrast to the behavior for other recently imaged companions like HIP 99770 b and HIP 21152 B (Currie et al., 2023b; Kuzuhara et al., 2022). Thus, we expect that constraints on at least some HIP 39017 b parameters may be poorer. Therefore, we then compare HIP 39017 b’s luminosity and estimated age ( 115 Myr) to predictions for hot-start luminosity evolution models. These models give another assessment of the plausible mass range for HIP 39017 b and may identify acceptable dynamical solutions that are strongly disfavored. We down-sample the orvara results with informative posteriors, removing solutions whose companion masses are inconsistent with luminosity evolution analyses.
4.2.2 Dynamical Modeling Results: Full Posterior Distribution
We employ a broad informative Gaussian prior for the primary mass, a log-normal prior for mass and semimajor axis, and uninformative priors for other parameters (Table 4). The mass we adopt for HIP 39017 A is chosen to be to appropriately encompass reported literature values and its color-magnitude diagram position as discussed in Section 2. Our PT-MCMC process uses 100 walkers and 30 temperatures across steps. The convergence diagnostic of our MCMC simulations is based on the auto-correlation time-based criterion, where we evaluate the ratio of the total number of samples to the integrated auto-correlation time (N/), with a threshold value of 50 (ac=50) (Hogg & Foreman-Mackey, 2018). We discard 40 of the coldest chain as burn-in so that the remaining chain converges adequately for posterior orbital parameter inference.
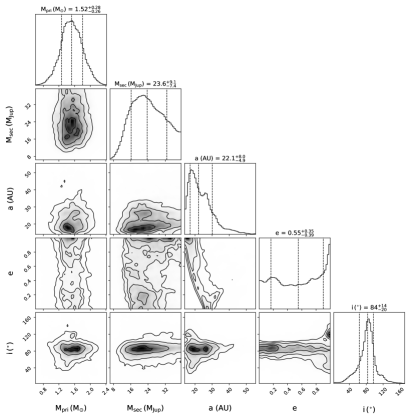
The posterior distributions of selected parameters from our simple joint fit to absolute and relative astrometry are shown by a corner plot in Figure 11. HIP 39017 b’s orbit has a semimajor axis of au and is likely within 20o of being edge on ( degrees). The dynamical mass for HIP 39017 b retrieved from this raw fit is poorly constrained, with a wide 68% confidence interval of = , as is the eccentricity (). The implied mass ratio ( ).
The companion’s mass, mass ratio, and eccentricity from this modeling are highly uncertain because HIP 39017 b was evidently observed during a period when the orbital motion is slow, resulting in the three epochs of relative astrometry being closely spaced and the orbital phase being sparsely sampled. Consequently, the other parameters we derive from the maximum likelihood orbit given in Figure 11 are also subject to biases.
| Parameter | Prior | Posterior | Weighted Posterior $\ddagger$$\ddagger$footnotemark: |
|---|---|---|---|
| Modeled Parameters | |||
| () | N(1.54,0.27) | ||
| ) | 1/ | ||
| a (AU) | 1/a | ||
| U(-1,1) | |||
| U(-1,1) | |||
| sini | |||
| U(-180,180) | |||
| U(-180,180) | |||
| Derived Parameters | |||
| parallax (mas) | – | ||
| period (yrs) | – | ||
| argument of periastron (deg) | – | ||
| eccentricity | – | ||
| semi-major axis (mas) | – | ||
| (JD) | – | ||
| mass ratio | – |
4.2.3 Dynamical Modeling Results: Informed Posteriors
To further constrain the orbital mass of the companion, we first investigate the use of information from evolutionary models to downsample the original orbital posteriors derived above. Given age and bolometric luminosity, substellar evolutionary models predict the mass based on cooling physics. We use bi-linear interpolation to form a grid of mass predictions as a function of age and luminosity. The primary source of uncertainty in evolutionary model-predicted mass estimates is due to the uncertainty in age. We place a conservative upper age limit of Myr (see Section 2.1) while we obtain the bolometric luminosity from both NIRC2’s single-band photometry and the entire broadband spectrum, by comparing them to observed L and T dwarf spectra.
We consider two derivations of HIP 39017 b’s luminosity. First, we convert the or W1 band magnitude, mag, to an absolute magnitude in W1 using the relation in (Franson et al., 2023a) and subsequently to a bolometric luminosity following the same approach as Li et al. (2023) using a comparative sample of L and T dwarfs from Filippazzo et al. (2015). The bolometric luminosity obtained using this method is dex for HIP 39017 b.
Second, we consider an atmospheric modeling-derived estimate the bolometric luminosity from the best fit Sonora Diamondback (Morley et al., in prep) and Lacy/Burrows models for HIP 99770b (Currie et al., 2023b) described above in Section 3.2. The flux of each best fit model is scaled by the fitted amplitude and integrated over the full extent of wavelengths available for each model ( m for Sonora Diamondback, m for Lacy/Burrows 99770). The luminosity is then calculated using the flux radius, , in Table 3. This results in a dex for the best fit Sonora Diamondback model, and dex for the best fit Lacy/Burrows 99770 model. These estimates are subject to model uncertainties, and could be slightly lower than the true bolometric luminosity due to unmeasured contribution from wavelengths outside of the spectral range of the models. However, they are consistent with the empirically-determined bolometric luminosity of HIP 39017 b determined above.
Considering both empirical and model-derived estimates, we derive a luminosity of for HIP 39017 b. We compare the measured luminosity to several evolutionary tracks – ATMO2020 (Phillips et al., 2020), AMES-COND (Allard et al., 2001), AMES-DUSTY (Allard et al., 2001), BHAC15 (Baraffe et al., 2015), and BT-Settl (Allard et al., 2012, 2013). Using both the provisional age of 115 Myr and the upper limit age of 700 Myr, we determine the mass inferred from each of these models given HIP 39017 b’s luminosity and its associated uncertainty (see Figure 12). The median of these comparisons yields a model-implied mass of at 115 Myr or at 700 Myr. The corresponding model-inferred parameters are , dex, and if assuming an age of 115 Myr. Alternatively, an age of 700 Myr yields parameters of , dex, and .
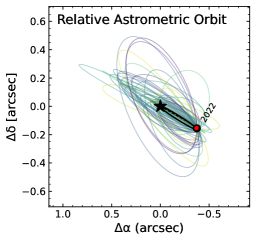
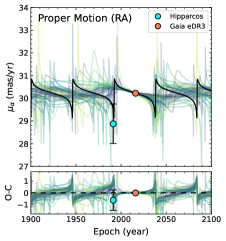
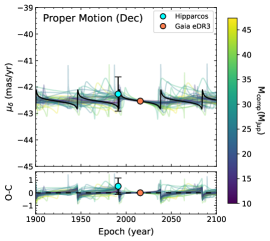
The evolutionary-model inferred masses are then used to truncate the posterior orbital parameter distributions for HIP 39017 b by down-sampling orbits within a range between 0 and the conservative upper mass limit of 46 . Figure 13 shows the joint fit to the relative astrometry and absolute astrometry data points after resampling the original fit to the full datasets. The period of the companion is comparable to the 25-year temporal baseline between Hipparcos and Gaia, which limits our ability to characterize the orbital shape (or eccentricity) and dynamical mass. Posterior distributions of relevant model parameters after down-sampling are shown in Figure 14. A summary of the modeled and derived parameters before and after sampling are given in Table 4.
Compared to the previous fits, the mode of the mass distribution remains unchanged but the long tail of higher masses in conflict with luminosity evolution estimates is truncated. Thus, while most parameter distributions are consistent with results from the full posterior distribution fit, the dynamical mass is reduced from to after down-sampling over the range of masses allowed by evolutionary track predictions. The derived mass ratio drops to . In contrast to the full posterior fit, the mass and mass ratio median and 68% confidence intervals lie below empirically-motivated thresholds – 25 and 0.025 – to identify massive planets and distinguish them from low-mass brown dwarfs (Currie et al., 2023b, a).
5 Discussion
We report the discovery of a substellar companion orbiting the young accelerating Doradus-type variable star, HIP 39017. Empirical comparisons to HIP 39017 b’s photometry and spectrum indicate that it lies at the L/T transition with a best-estimated spectral type of T0.5–T2. Atmospheric modeling with the Sonara Diamondback grid achieves a good fit and indicates that HIP 39017 b is a cloudy object with a best-estimated temperature, gravity, and radius of = 1300 K, log(g) = 4.0, and R = 0.87 . Best fit values from the Lacy/Burrows cloudy atmosphere models are similar.
Modeling astrometric data for HIP 39017 b and the primary constrain the companion’s semimajor axis to be 23 au and its orbit to be near edge on but otherwise yield poor constraints on system properties. The full posterior distribution for HIP 39017 b’s dynamical mass and mass ratio have a wide range of MJ and , respectively, implying a brown dwarf interpretation. However, given HIP 39017 b’s best-estimated age ( 115 Myr), luminosity evolution models favor a lower mass of 13.8 . Adopting the highly-conservative assumption that HIP 39017 age is simply “younger than the Hyades”, we estimate an upper mass limit of 38 . Informed by the latter results – i.e. removing solutions from the posterior distribution with masses incompatible with luminosity evolution estimates – the revised posterior distributions for HIP 39017 b yield a lower mass of and a lower mass ratio of . These combined values place this companion in a region of the parameter space populated by massive planets detected by RV and direct imaging, favoring a planetary interpretation as described in Currie et al. (2023b, a).
Current CHARIS and NIRC2 data for HIP 39017 b suggest that our images capture a part of its orbit where it undergoes little astrometric motion. Continued astrometric monitoring of HIP 39017 b over a long time baseline will substantially improve constraints on its orbit and, potentially, its dynamical mass. The Gaia DR4 data release will yield more precise astrometric data for the star, which will further improve mass estimates and thus clarify its nature (i.e. whether it shares more of its properties with low-mass brown dwarfs or planets).
A more precise age for the system are needed for comparison to evolutionary models. Our estimate of Myr implies a lower mass of from comparison with several hot-start evolutionary models (Figure 12), placing HIP 39017b closer to the deuterium burning limit. Its host star’s multi-frequency, Dor-type variability opens the door to deriving independent age constraints for the system through asteroseismology. Further observations with higher spectral resolution would allow the derivation of stronger constraints on its spectral properties (eg. , , metallicity, C/O ratio) via atmospheric retrieval.
The discovery of HIP 39017b reinforces the improved efficiency of targeted direct imaging campaigns informed by long-baseline, precision stellar astrometry instead of so-called blind or unbiased surveys. Between the system’s youth and potential for independent dynamical mass constraints, HIP 39017b provides a new testing ground for substellar evolutionary and atmospheric models. HIP 39017 b joins recently-discovered planetary companions HIP 99770 b and AF Lep b and brown dwarfs HIP 21152 B and HD 33632 Ab as companions with spectra that can constrain their atmospheres and direct dynamical mass measurements. With improved age constraints for all companions, new targeted surveys will establish a sample of companions that will help map how the atmospheres of planets and brown dwarfs of a given mass evolve with time.
References
- Ackerman & Marley (2001) Ackerman, A. S., & Marley, M. S. 2001, ApJ, 556, 872, doi: 10.1086/321540
- Allard et al. (2001) Allard, F., Hauschildt, P. H., Alexander, D. R., Tamanai, A., & Schweitzer, A. 2001, ApJ, 556, 357, doi: 10.1086/321547
- Allard et al. (2012) Allard, F., Homeier, D., & Freytag, B. 2012, Philosophical Transactions of the Royal Society of London Series A, 370, 2765, doi: 10.1098/rsta.2011.0269
- Allard et al. (2013) Allard, F., Homeier, D., Freytag, B., Schaffenberger, W., & Rajpurohit, A. S. 2013, Memorie della Societa Astronomica Italiana Supplementi, 24, 128, doi: 10.48550/arXiv.1302.6559
- Astropy Collaboration et al. (2013) Astropy Collaboration, Robitaille, T. P., Tollerud, E. J., et al. 2013, A&A, 558, A33, doi: 10.1051/0004-6361/201322068
- Astropy Collaboration et al. (2018) Astropy Collaboration, Price-Whelan, A. M., Sipőcz, B. M., et al. 2018, AJ, 156, 123, doi: 10.3847/1538-3881/aabc4f
- Astropy-Specutils Development Team (2019) Astropy-Specutils Development Team. 2019, Specutils: Spectroscopic analysis and reduction, Astrophysics Source Code Library, record ascl:1902.012. http://ascl.net/1902.012
- Bailer-Jones et al. (2021) Bailer-Jones, C. A. L., Rybizki, J., Fouesneau, M., Demleitner, M., & Andrae, R. 2021, AJ, 161, 147, doi: 10.3847/1538-3881/abd806
- Baraffe et al. (2015) Baraffe, I., Homeier, D., Allard, F., & Chabrier, G. 2015, A&A, 577, A42, doi: 10.1051/0004-6361/201425481
- Best et al. (2020) Best, W. M. J., Dupuy, T. J., Liu, M. C., Siverd, R. J., & Zhang, Z. 2020, The UltracoolSheet: Photometry, Astrometry, Spectroscopy, and Multiplicity for 3000+ Ultracool Dwarfs and Imaged Exoplanets, 1.0.0, Zenodo, doi: 10.5281/zenodo.4169085
- Beuzit et al. (2019) Beuzit, J. L., Vigan, A., Mouillet, D., et al. 2019, A&A, 631, A155, doi: 10.1051/0004-6361/201935251
- Bonavita et al. (2022) Bonavita, M., Fontanive, C., Gratton, R., et al. 2022, MNRAS, 513, 5588, doi: 10.1093/mnras/stac1250
- Bond et al. (2020) Bond, C. Z., Cetre, S., Lilley, S., et al. 2020, Journal of Astronomical Telescopes, Instruments, and Systems, 6, 039003, doi: 10.1117/1.JATIS.6.3.039003
- Brandt et al. (2021a) Brandt, G. M., Dupuy, T. J., Li, Y., et al. 2021a, AJ, 162, 301, doi: 10.3847/1538-3881/ac273e
- Brandt (2018) Brandt, T. D. 2018, ApJS, 239, 31, doi: 10.3847/1538-4365/aaec06
- Brandt (2021) —. 2021, ApJS, 254, 42, doi: 10.3847/1538-4365/abf93c
- Brandt et al. (2021b) Brandt, T. D., Dupuy, T. J., Li, Y., et al. 2021b, AJ, 162, 186, doi: 10.3847/1538-3881/ac042e
- Brandt et al. (2017) Brandt, T. D., Rizzo, M., Groff, T., et al. 2017, Journal of Astronomical Telescopes, Instruments, and Systems, 3, 048002, doi: 10.1117/1.JATIS.3.4.048002
- Bressan et al. (2012) Bressan, A., Marigo, P., Girardi, L., et al. 2012, MNRAS, 427, 127, doi: 10.1111/j.1365-2966.2012.21948.x
- Bruntt et al. (2008) Bruntt, H., De Cat, P., & Aerts, C. 2008, A&A, 478, 487, doi: 10.1051/0004-6361:20078523
- Burgasser (2014) Burgasser, A. J. 2014, in Astronomical Society of India Conference Series, Vol. 11, Astronomical Society of India Conference Series, 7–16, doi: 10.48550/arXiv.1406.4887
- Burgasser et al. (2010) Burgasser, A. J., Cruz, K. L., Cushing, M., et al. 2010, ApJ, 710, 1142, doi: 10.1088/0004-637X/710/2/1142
- Burgasser et al. (2008) Burgasser, A. J., Liu, M. C., Ireland, M. J., Cruz, K. L., & Dupuy, T. J. 2008, ApJ, 681, 579, doi: 10.1086/588379
- Burgasser et al. (2004) Burgasser, A. J., McElwain, M. W., Kirkpatrick, J. D., et al. 2004, AJ, 127, 2856, doi: 10.1086/383549
- Burgasser & Splat Development Team (2017) Burgasser, A. J., & Splat Development Team. 2017, in Astronomical Society of India Conference Series, Vol. 14, Astronomical Society of India Conference Series, 7–12, doi: 10.48550/arXiv.1707.00062
- Burrows et al. (2006) Burrows, A., Sudarsky, D., & Hubeny, I. 2006, ApJ, 640, 1063, doi: 10.1086/500293
- Carnall (2017) Carnall, A. C. 2017, arXiv e-prints, arXiv:1705.05165, doi: 10.48550/arXiv.1705.05165
- Castelli & Kurucz (2003) Castelli, F., & Kurucz, R. L. 2003, in IAU Symposium, Vol. 210, Modelling of Stellar Atmospheres, ed. N. Piskunov, W. W. Weiss, & D. F. Gray, A20. https://arxiv.org/abs/astro-ph/0405087
- Caswell et al. (2021) Caswell, T. A., Droettboom, M., Lee, A., et al. 2021, matplotlib/matplotlib: REL: v3.4.3, v3.4.3, Zenodo, Zenodo, doi: 10.5281/zenodo.5194481
- Chauvin et al. (2018) Chauvin, G., Gratton, R., Bonnefoy, M., et al. 2018, A&A, 617, A76, doi: 10.1051/0004-6361/201732077
- Chilcote et al. (2021) Chilcote, J., Tobin, T., Currie, T., et al. 2021, AJ, 162, 251, doi: 10.3847/1538-3881/ac29ba
- Chiu et al. (2006) Chiu, K., Fan, X., Leggett, S. K., et al. 2006, AJ, 131, 2722, doi: 10.1086/501431
- Cruz et al. (2018) Cruz, K. L., Núñez, A., Burgasser, A. J., et al. 2018, AJ, 155, 34, doi: 10.3847/1538-3881/aa9d8a
- Currie et al. (2023a) Currie, T., Biller, B., Lagrange, A., et al. 2023a, in Astronomical Society of the Pacific Conference Series, Vol. 534, Protostars and Planets VII, ed. S. Inutsuka, Y. Aikawa, T. Muto, K. Tomida, & M. Tamura, 799, doi: 10.48550/arXiv.2205.05696
- Currie et al. (2015) Currie, T., Cloutier, R., Brittain, S., et al. 2015, ApJ, 814, L27, doi: 10.1088/2041-8205/814/2/L27
- Currie et al. (2011) Currie, T., Burrows, A., Itoh, Y., et al. 2011, ApJ, 729, 128, doi: 10.1088/0004-637X/729/2/128
- Currie et al. (2012) Currie, T., Debes, J., Rodigas, T. J., et al. 2012, ApJ, 760, L32, doi: 10.1088/2041-8205/760/2/L32
- Currie et al. (2014) Currie, T., Burrows, A., Girard, J. H., et al. 2014, ApJ, 795, 133, doi: 10.1088/0004-637X/795/2/133
- Currie et al. (2018) Currie, T., Brandt, T. D., Uyama, T., et al. 2018, AJ, 156, 291, doi: 10.3847/1538-3881/aae9ea
- Currie et al. (2020a) Currie, T., Brandt, T. D., Kuzuhara, M., et al. 2020a, ApJ, 904, L25, doi: 10.3847/2041-8213/abc631
- Currie et al. (2020b) Currie, T., Guyon, O., Lozi, J., et al. 2020b, arXiv e-prints, arXiv:2012.05241. https://arxiv.org/abs/2012.05241
- Currie et al. (2021) Currie, T., Brandt, T. D., Kuzuhara, M., et al. 2021, in Society of Photo-Optical Instrumentation Engineers (SPIE) Conference Series, Vol. 11823, Society of Photo-Optical Instrumentation Engineers (SPIE) Conference Series, 1182304, doi: 10.1117/12.2595001
- Currie et al. (2023b) Currie, T., Brandt, G. M., Brandt, T. D., et al. 2023b, Science, 380, 198, doi: 10.1126/science.abo6192
- Cutri et al. (2012) Cutri, R. M., Wright, E. L., Conrow, T., et al. 2012, VizieR Online Data Catalog, II/311
- Dantona & Mazzitelli (1984) Dantona, F., & Mazzitelli, I. 1984, A&A, 138, 431
- De Cat et al. (2006) De Cat, P., Eyer, L., Cuypers, J., et al. 2006, A&A, 449, 281, doi: 10.1051/0004-6361:20053655
- De Rosa et al. (2023) De Rosa, R. J., Nielsen, E. L., Wahhaj, Z., et al. 2023, A&A, 672, A94, doi: 10.1051/0004-6361/202345877
- De Rosa et al. (2016) De Rosa, R. J., Rameau, J., Patience, J., et al. 2016, ApJ, 824, 121, doi: 10.3847/0004-637X/824/2/121
- Dupuy et al. (2022) Dupuy, T. J., Brandt, G. M., & Brandt, T. D. 2022, MNRAS, 509, 4411, doi: 10.1093/mnras/stab3148
- Dupuy & Liu (2012) Dupuy, T. J., & Liu, M. C. 2012, ApJS, 201, 19, doi: 10.1088/0067-0049/201/2/19
- Dupuy & Liu (2017) —. 2017, ApJS, 231, 15, doi: 10.3847/1538-4365/aa5e4c
- Filippazzo et al. (2015) Filippazzo, J. C., Rice, E. L., Faherty, J., et al. 2015, ApJ, 810, 158, doi: 10.1088/0004-637X/810/2/158
- Foreman-Mackey et al. (2013) Foreman-Mackey, D., Hogg, D. W., Lang, D., & Goodman, J. 2013, PASP, 125, 306, doi: 10.1086/670067
- Franson et al. (2023a) Franson, K., Bowler, B. P., Bonavita, M., et al. 2023a, AJ, 165, 39, doi: 10.3847/1538-3881/aca408
- Franson et al. (2023b) Franson, K., Bowler, B. P., Zhou, Y., et al. 2023b, ApJ, 950, L19, doi: 10.3847/2041-8213/acd6f6
- Gagné et al. (2018) Gagné, J., Allers, K. N., Theissen, C. A., et al. 2018, ApJ, 854, L27, doi: 10.3847/2041-8213/aaacfd
- Gaia Collaboration (2022) Gaia Collaboration. 2022, VizieR Online Data Catalog, I/355
- Gomez Gonzalez et al. (2017) Gomez Gonzalez, C. A., Wertz, O., Absil, O., et al. 2017, AJ, 154, 7, doi: 10.3847/1538-3881/aa73d7
- Gonzales et al. (2020) Gonzales, E. C., Burningham, B., Faherty, J. K., et al. 2020, ApJ, 905, 46, doi: 10.3847/1538-4357/abbee2
- Greco & Brandt (2016) Greco, J. P., & Brandt, T. D. 2016, ApJ, 833, 134, doi: 10.3847/1538-4357/833/2/134
- Groff et al. (2016) Groff, T. D., Chilcote, J., Kasdin, N. J., et al. 2016, in Society of Photo-Optical Instrumentation Engineers (SPIE) Conference Series, Vol. 9908, Ground-based and Airborne Instrumentation for Astronomy VI, 99080O, doi: 10.1117/12.2233447
- Haëck (2021) Haëck, C. 2021, tol-colors, v1.2.1, GitHub. https://github.com/Descanonge/tol_colors
- Handler (1999) Handler, G. 1999, MNRAS, 309, L19, doi: 10.1046/j.1365-8711.1999.03005.x
- Handler & Shobbrook (2002) Handler, G., & Shobbrook, R. R. 2002, MNRAS, 333, 251, doi: 10.1046/j.1365-8711.2002.05401.x
- Harris et al. (2020) Harris, C. R., Millman, K. J., van der Walt, S. J., et al. 2020, Nature, 585, 357, doi: 10.1038/s41586-020-2649-2
- Hayano et al. (2008) Hayano, Y., Takami, H., Guyon, O., et al. 2008, in Society of Photo-Optical Instrumentation Engineers (SPIE) Conference Series, Vol. 7015, Adaptive Optics Systems, ed. N. Hubin, C. E. Max, & P. L. Wizinowich, 701510, doi: 10.1117/12.789992
- Henry et al. (2011) Henry, G. W., Fekel, F. C., & Henry, S. M. 2011, AJ, 142, 39, doi: 10.1088/0004-6256/142/2/39
- Hogg & Foreman-Mackey (2018) Hogg, D. W., & Foreman-Mackey, D. 2018, ApJS, 236, 11, doi: 10.3847/1538-4365/aab76e
- Hood et al. (2023) Hood, C. E., Fortney, J. J., Line, M. R., & Faherty, J. K. 2023, ApJ, 953, 170, doi: 10.3847/1538-4357/ace32e
- Hunter (2007) Hunter, J. D. 2007, Computing in Science and Engineering, 9, 90, doi: 10.1109/MCSE.2007.55
- Janson et al. (2013) Janson, M., Brandt, T. D., Kuzuhara, M., et al. 2013, ApJ, 778, L4, doi: 10.1088/2041-8205/778/1/L4
- Jones (2016) Jones, J. W. 2016, PhD thesis, Georgia State University
- Jovanovic et al. (2015a) Jovanovic, N., Guyon, O., Martinache, F., et al. 2015a, ApJ, 813, L24, doi: 10.1088/2041-8205/813/2/L24
- Jovanovic et al. (2015b) Jovanovic, N., Martinache, F., Guyon, O., et al. 2015b, PASP, 127, 890, doi: 10.1086/682989
- Karalidi et al. (2021) Karalidi, T., Marley, M., Fortney, J. J., et al. 2021, ApJ, 923, 269, doi: 10.3847/1538-4357/ac3140
- Kazarovets et al. (1999) Kazarovets, E. V., Samus, N. N., Durlevich, O. V., et al. 1999, Information Bulletin on Variable Stars, 4659, 1
- Kenyon & Hartmann (1995) Kenyon, S. J., & Hartmann, L. 1995, ApJS, 101, 117, doi: 10.1086/192235
- Kirkpatrick (2005) Kirkpatrick, J. D. 2005, ARA&A, 43, 195, doi: 10.1146/annurev.astro.42.053102.134017
- Kirkpatrick et al. (2021) Kirkpatrick, J. D., Gelino, C. R., Faherty, J. K., et al. 2021, ApJS, 253, 7, doi: 10.3847/1538-4365/abd107
- Kitzmann et al. (2020) Kitzmann, D., Heng, K., Oreshenko, M., et al. 2020, ApJ, 890, 174, doi: 10.3847/1538-4357/ab6d71
- Kuzuhara et al. (2013) Kuzuhara, M., Tamura, M., Kudo, T., et al. 2013, ApJ, 774, 11, doi: 10.1088/0004-637X/774/1/11
- Kuzuhara et al. (2022) Kuzuhara, M., Currie, T., Takarada, T., et al. 2022, ApJ, 934, L18, doi: 10.3847/2041-8213/ac772f
- Lagrange et al. (2010) Lagrange, A. M., Bonnefoy, M., Chauvin, G., et al. 2010, Science, 329, 57, doi: 10.1126/science.1187187
- Leggett et al. (2007) Leggett, S. K., Saumon, D., Marley, M. S., et al. 2007, ApJ, 655, 1079, doi: 10.1086/510014
- Leggett et al. (2002) Leggett, S. K., Golimowski, D. A., Fan, X., et al. 2002, ApJ, 564, 452, doi: 10.1086/324037
- Leggett et al. (2010) Leggett, S. K., Burningham, B., Saumon, D., et al. 2010, ApJ, 710, 1627, doi: 10.1088/0004-637X/710/2/1627
- Leggett et al. (2019) Leggett, S. K., Dupuy, T. J., Morley, C. V., et al. 2019, ApJ, 882, 117, doi: 10.3847/1538-4357/ab3393
- Li et al. (2023) Li, Y., Brandt, T. D., Brandt, G. M., et al. 2023, arXiv e-prints, arXiv:2301.10420, doi: 10.48550/arXiv.2301.10420
- Looper et al. (2007) Looper, D. L., Kirkpatrick, J. D., & Burgasser, A. J. 2007, AJ, 134, 1162, doi: 10.1086/520645
- Lueber et al. (2022) Lueber, A., Kitzmann, D., Bowler, B. P., Burgasser, A. J., & Heng, K. 2022, ApJ, 930, 136, doi: 10.3847/1538-4357/ac63b9
- Macintosh et al. (2014) Macintosh, B., Graham, J. R., Ingraham, P., et al. 2014, Proceedings of the National Academy of Science, 111, 12661, doi: 10.1073/pnas.1304215111
- Macintosh et al. (2015) Macintosh, B., Graham, J. R., Barman, T., et al. 2015, Science, 350, 64, doi: 10.1126/science.aac5891
- Madhusudhan et al. (2011) Madhusudhan, N., Burrows, A., & Currie, T. 2011, ApJ, 737, 34, doi: 10.1088/0004-637X/737/1/34
- Mamajek & Hillenbrand (2008) Mamajek, E. E., & Hillenbrand, L. A. 2008, ApJ, 687, 1264, doi: 10.1086/591785
- Marley et al. (2021) Marley, M., Saumon, D., Morley, C., et al. 2021, Sonora Bobcat: cloud-free, substellar atmosphere models, spectra, photometry, evolution, and chemistry, Sonora Bobcat, Zenodo, doi: 10.5281/zenodo.5063476
- Marley et al. (2021) Marley, M. S., Saumon, D., Visscher, C., et al. 2021, ApJ, 920, 85, doi: 10.3847/1538-4357/ac141d
- Marois et al. (2006) Marois, C., Lafrenière, D., Doyon, R., Macintosh, B., & Nadeau, D. 2006, ApJ, 641, 556, doi: 10.1086/500401
- Marois et al. (2008) Marois, C., Macintosh, B., Barman, T., et al. 2008, Science, 322, 1348, doi: 10.1126/science.1166585
- Marois et al. (2010) Marois, C., Zuckerman, B., Konopacky, Q. M., Macintosh, B., & Barman, T. 2010, Nature, 468, 1080, doi: 10.1038/nature09684
- Mawet et al. (2014) Mawet, D., Milli, J., Wahhaj, Z., et al. 2014, ApJ, 792, 97, doi: 10.1088/0004-637X/792/2/97
- Mesa et al. (2023) Mesa, D., Gratton, R., Kervella, P., et al. 2023, A&A, 672, A93, doi: 10.1051/0004-6361/202345865
- Metchev et al. (2009) Metchev, S., Marois, C., & Zuckerman, B. 2009, ApJ, 705, L204, doi: 10.1088/0004-637X/705/2/L204
- Metchev et al. (2008) Metchev, S. A., Kirkpatrick, J. D., Berriman, G. B., & Looper, D. 2008, ApJ, 676, 1281, doi: 10.1086/524721
- Monet et al. (2002) Monet, D. G., Levine, S. E., Casian, B., & et al. 2002, VizieR Online Data Catalog, I/284
- Moro-Martín et al. (2010) Moro-Martín, A., Rieke, G. H., & Su, K. Y. L. 2010, ApJ, 721, L199, doi: 10.1088/2041-8205/721/2/L199
- Moya et al. (2010) Moya, A., Amado, P. J., Barrado, D., et al. 2010, MNRAS, 405, L81, doi: 10.1111/j.1745-3933.2010.00863.x
- Nielsen et al. (2017) Nielsen, E. L., Rosa, R. J. D., Rameau, J., et al. 2017, AJ, 154, 218, doi: 10.3847/1538-3881/aa8a69
- Nielsen et al. (2019) Nielsen, E. L., De Rosa, R. J., Macintosh, B., et al. 2019, AJ, 158, 13, doi: 10.3847/1538-3881/ab16e9
- Ochsenbein et al. (2000) Ochsenbein, F., Bauer, P., & Marcout, J. 2000, A&AS, 143, 23, doi: 10.1051/aas:2000169
- Pecaut & Mamajek (2013) Pecaut, M. J., & Mamajek, E. E. 2013, ApJS, 208, 9, doi: 10.1088/0067-0049/208/1/9
- Perryman et al. (1997) Perryman, M. A. C., Lindegren, L., Kovalevsky, J., et al. 1997, A&A, 323, L49
- Phillips et al. (2020) Phillips, M. W., Tremblin, P., Baraffe, I., et al. 2020, A&A, 637, A38, doi: 10.1051/0004-6361/201937381
- Rajan et al. (2017) Rajan, A., Rameau, J., De Rosa, R. J., et al. 2017, AJ, 154, 10, doi: 10.3847/1538-3881/aa74db
- Rieke et al. (2005) Rieke, G. H., Su, K. Y. L., Stansberry, J. A., et al. 2005, ApJ, 620, 1010, doi: 10.1086/426937
- Sahoo et al. (2020) Sahoo, A., Guyon, O., Lozi, J., et al. 2020, AJ, 159, 250, doi: 10.3847/1538-3881/ab88cd
- Saumon & Marley (2008) Saumon, D., & Marley, M. S. 2008, ApJ, 689, 1327, doi: 10.1086/592734
- Sepulveda & Bowler (2022) Sepulveda, A. G., & Bowler, B. P. 2022, AJ, 163, 52, doi: 10.3847/1538-3881/ac3bb5
- Sepulveda et al. (2022) Sepulveda, A. G., Huber, D., Zhang, Z., et al. 2022, ApJ, 938, 49, doi: 10.3847/1538-4357/ac9229
- Service et al. (2016) Service, M., Lu, J. R., Campbell, R., et al. 2016, PASP, 128, 095004, doi: 10.1088/1538-3873/128/967/095004
- Skemer et al. (2014) Skemer, A. J., Marley, M. S., Hinz, P. M., et al. 2014, ApJ, 792, 17, doi: 10.1088/0004-637X/792/1/17
- Skrutskie et al. (2019) Skrutskie, M. F., Cutri, R. M., Stiening, R., et al. 2019, 2MASS All-Sky Point Source Catalog, IPAC, doi: 10.26131/IRSA2
- Skrutskie et al. (2006) —. 2006, AJ, 131, 1163, doi: 10.1086/498708
- Sódor et al. (2014) Sódor, Á., Chené, A. N., De Cat, P., et al. 2014, A&A, 568, A106, doi: 10.1051/0004-6361/201423976
- Spiegel & Burrows (2012) Spiegel, D. S., & Burrows, A. 2012, ApJ, 745, 174, doi: 10.1088/0004-637X/745/2/174
- Spitzer Science Center & Infrared Science Archive (IRSA)(2021) (SSC) Spitzer Science Center (SSC), & Infrared Science Archive (IRSA). 2021, VizieR Online Data Catalog, II/368
- Stassun et al. (2019) Stassun, K. G., Oelkers, R. J., Paegert, M., et al. 2019, AJ, 158, 138, doi: 10.3847/1538-3881/ab3467
- Steiger et al. (2021) Steiger, S., Currie, T., Brandt, T. D., et al. 2021, AJ, 162, 44, doi: 10.3847/1538-3881/ac02cc
- Tetzlaff et al. (2011) Tetzlaff, N., Neuhäuser, R., & Hohle, M. M. 2011, MNRAS, 410, 190, doi: 10.1111/j.1365-2966.2010.17434.x
- Tobin et al. (2020) Tobin, T. L., Chilcote, J., Brandt, T., et al. 2020, in Society of Photo-Optical Instrumentation Engineers (SPIE) Conference Series, Vol. 11452, Software and Cyberinfrastructure for Astronomy VI, ed. J. C. Guzman & J. Ibsen, 114521D, doi: 10.1117/12.2576255
- Tobin et al. (2022) Tobin, T. L., Pal, J., Chilcote, J., et al. 2022, in Society of Photo-Optical Instrumentation Engineers (SPIE) Conference Series, Vol. 12189, Society of Photo-Optical Instrumentation Engineers (SPIE) Conference Series, 121892C, doi: 10.1117/12.2630368
- Tol (2012) Tol, P. 2012, Colour Schemes., SRON Technical Note, Doc. no. SRON/EPS/TN/09-002. https://personal.sron.nl/~pault/colourschemes.pdf
- van Dokkum (2001) van Dokkum, P. G. 2001, PASP, 113, 1420, doi: 10.1086/323894
- Vigan et al. (2021) Vigan, A., Fontanive, C., Meyer, M., et al. 2021, A&A, 651, A72, doi: 10.1051/0004-6361/202038107
- Virtanen et al. (2020) Virtanen, P., Gommers, R., Oliphant, T. E., et al. 2020, Nature Methods, 17, 261, doi: 10.1038/s41592-019-0686-2
- Wang et al. (2022) Wang, J. J., Gao, P., Chilcote, J., et al. 2022, AJ, 164, 143, doi: 10.3847/1538-3881/ac8984
- Wenger et al. (2000) Wenger, M., Ochsenbein, F., Egret, D., et al. 2000, A&AS, 143, 9, doi: 10.1051/aas:2000332
- Yelda et al. (2010) Yelda, S., Lu, J. R., Ghez, A. M., et al. 2010, ApJ, 725, 331, doi: 10.1088/0004-637X/725/1/331
- Zalesky et al. (2019) Zalesky, J. A., Line, M. R., Schneider, A. C., & Patience, J. 2019, ApJ, 877, 24, doi: 10.3847/1538-4357/ab16db
- Zhang et al. (2021) Zhang, Z., Liu, M. C., Best, W. M. J., Dupuy, T. J., & Siverd, R. J. 2021, ApJ, 911, 7, doi: 10.3847/1538-4357/abe3fa
- Zhang et al. (2023) Zhang, Z., Mollière, P., Hawkins, K., et al. 2023, AJ, 166, 198, doi: 10.3847/1538-3881/acf768
- Zurlo et al. (2016) Zurlo, A., Vigan, A., Galicher, R., et al. 2016, A&A, 587, A57, doi: 10.1051/0004-6361/201526835
Appendix A Characterization of a Wide-Separation Background Star Detected Around HIP 39017
The 2022 NIRC2 data identify a second point source in the northwest at a wider separation ( 175), which is recovered in the March 2022 CHARIS epoch and 2023 NIRC2 epoch (Figure 15). If a bound companion at a projected physical separation of 115 au, this object would contribute to the HIP 39017 primary’s astrometric acceleration and thus substantially the orbital solutions for HIP 39017 b. However, our analysis below shows that this object is an unrelated background object whose colors are consistent with an unreddened K star.
Table 5 lists astrometric measurements for this object. While basic processing for each data set listed follows methods described in Section 2.2, we did not apply PSF subtraction techniques to detect the wider-separation object in the March 2022 CHARIS and March 2023 NIRC2 data. For these data sets, we extract an object spectrum and/or measure its astrometry directly. The detection signifances are sufficiently high (SNR 47-222) that systematics in the plate scale and north position angle calibration for CHARIS and NIRC2 dominate our astrometric error budget.
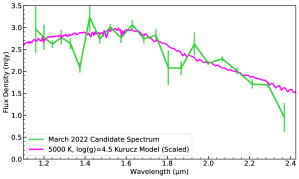
The wider-separation object 16 shows a spectrum that is smooth and featureless except for channels with substantial telluric contamination (1.3–1.4 ; 1.8–1.9 ). We measure its broadband photometry to be = 14.38 0.08, = 13.89 0.04, and = 13.81 0.04. At , we measure a brightness of 13.83 0.04 magnitudes. The resulting - color is 0.57 0.09, roughly consistent with a background K2–K3 star (Pecaut & Mamajek, 2013) at a distance of 850 . Aside from channels with significant telluric contamination, the 5000 K, log(g) = 4.5 Kurucz atmosphere model overplotted on Figure 16 matches this object’s spectrum. Similarly, a proper motion analysis shows that this object’s motion relative to HIP 39017 A is consistent with a background star
| UT Date | Instrument$\ddagger$$\ddagger$footnotemark: | Bandpass | S/N | PA | |
|---|---|---|---|---|---|
| (mas) | (°) | ||||
| 2022-03-21 | Keck/PyWFS+NIRC2 | 81 | 1761 3.0 | 171.540 0.520 | |
| 2022-03-25 | SCExAO/CHARIS | Broadband/ | 222 | 1774 7.0 | 171.232 0.270 |
| 2023-02-04 | Keck/NIRC2 | 47 | 1718 3.0 | 172.300 0.300 |
Note. — S/N represents the object’s signal-to-noise ratio, represents the companion.
Appendix B Spectral Analysis: Comparison to Cloudless Sonora Bobcat Grid
As discussed in Section 3.2, the results of fitting the December 2022 SCExAO/CHARIS data set and Keck/NIRC2 L photometry to the Sonora Bobcat model grid are shown in Figure 17.
Appendix C Spectral Analysis of the February 2022 SCExAO/CHARIS Spectrum
For comparison, the fits to the SpeX Prism L/T dwarf library and the Sonora Diamondback model grid discussed in Sections 3.1 and 3.2, respectively, were also performed using the February 2022 SCExAO/CHARIS spectrum. As seen in Figure 3, the shape of the m peak in the February 2022 spectrum more closely resembles that of, for example, the empirical SpeX spectra in Figure 6 than the December 2022 spectrum did. However, the weaker J-band peak in the December spectrum is obscured in the February spectrum. In general, we find that the parameters derived using the February spectrum are more poorly constrained and the data is somewhat overfit. Therefore, we defer to the parameters derived from the December spectrum. However, for completeness, we briefly discuss the analysis of the February spectrum here.
Consistent with the increased spectral noise of this data set (Section 3), the NIR Spectral Type implied by the SpeX Prism library spectra is more poorly constrained for the February 2022 data than for the December 2022 data. As can be seen in Figure 18, it is consistent with spectral types from L5-T1 within , or from L2-T2 within . Further, the higher uncertainty on this spectrum results in the observations being overfit by the single parameter fit to the library spectra, with many having .
The February CHARIS spectrum, in combination with the Keck/NIRC2 photometry, is also slightly overfit by the Sonora Diamondback grid, but to a much lesser extent, with the minimum . The Diamondback model that best fits the February 2022 spectrum and photometry is K, , [M/H], with clouds. This is adjacent to the best fit Diamondback model using the December spectrum, but slightly higher temperature and .