Two distinct molecular cloud populations detected in massive galaxies
Abstract
We present new ALMA observations of CO, CN, CS, HCN and HCO+ absorption seen against the bright and compact radio continuum sources of eight massive galaxies. Combined with archival observations, they reveal two distinct populations of molecular clouds, which we identify by combining CO emission and absorption profiles to unambiguously reveal each cloud’s direction of motion and likely location. In galaxy disks, we see clouds with low velocity dispersions, low line of sight velocities and a lack of any systemic inflow or outflow. In galactic cores, we find high velocity dispersion clouds inflowing at up to 550 km/s. This provides observational evidence in favour of cold accretion onto galactic centres, which likely contributes to the fuelling of active galactic nuclei. We also see a wide range in the CO(2-1)/CO(1-0) ratios of the absorption lines. This is likely the combined effect of hierarchical substructure within the molecular clouds and continuum sources which vary in size with frequency.
keywords:
galaxies: active – galaxies: clusters: general – radio continuum: galaxies – radio lines: ISM1 Introduction
| Source | Ang. res. | FOV | Int. Time | Obs. date | Line(s) | Cont. Flux Density | Project code |
|---|---|---|---|---|---|---|---|
| (") | (") | (s) | (yyyy-mm-dd) | (mJy, GHz) | |||
| NGC 6868 | 0.81 | 58.8 | 5100 | 2018-01-25 | CO(1-0) | 41, 107 | 2017.1.00629 |
| NGC 6868 | 0.11 | 25 | 1400 | 2021-11-20 | CO(2-1), CN(2-1) | 33, 234 | 2021.1.00766 |
| NGC 6868 | 0.16 | 34.4 | 2800 | 2021-11-19 | HCO+(2-1), HCN(2-1) | 36, 169 | 2021.1.00766 |
| Abell S555 | 0.63 | 56 | 2800 | 2018-01-23 | CO(1-0) | 32, 103 | 2017.1.00629 |
| Abell S555 | 0.14 | 25.8 | 3700 | 2022-07-20 | CO(2-1), CN(2-1) | 23, 226 | 2021.1.00766 |
| Abell S555 | 0.26 | 33.2 | 1800 | 2022-07-05 | HCO+(2-1), HCN(2-1) | 25, 175 | 2021.1.00766 |
| Hydra-A | 2.07 | 57 | 2700 | 2018-07-18 | CO(1-0) | 99, 103 | 2017.1.00629 |
| Hydra-A | 0.26 | 26 | 5700 | 2018-10-30 | CO(2-1), CN(2-1) | 60, 223 | 2018.1.01471 |
| Hydra-A | 0.34 | 33.5 | 5100 | 2018-11-16 | HCO+(2-1), HCN(2-1) | 95, 168 | 2018.1.01471 |
| Abell 2390 | 0.40 | 59.0 | 8000 | 2018-01-07 | CO(1-0) | 22, 98 | 2017.1.00629 |
| Abell 2390 | 0.58 | 30.4 | 4800 | 2022-05-20 | CO(2-1) | 11, 192 | 2021.1.00766 |
| Abell 2390 | 0.21 | 42.1 | 900 | 2021-11-22 | HCO+(2-1), HCN(2-1) | 14, 138 | 2021.1.00766 |
| RXCJ0439.0+0520 | 0.18 | 29.8 | 2600 | 2022-07-22 | CO(2-1), CN(2-1) | 72, 195 | 2021.1.00766 |
| RXCJ0439.0+0520 | 0.30 | 41.4 | 1300 | 2021-12-04 | HCO+(2-1), HCN(2-1) | 85 ,141 | 2021.1.00766 |
| Abell 1644 | 1.74 | 57 | 2800 | 2018-08-21 | CO(1-0) | 67, 103 | 2017.1.00629 |
| Abell 1644 | 0.47 | 25.9 | 1300 | 2022-06-08 | CO(2-1), CN(2-1) | 38, 225 | 2021.1.00766 |
| Abell 1644 | 0.19 | 33.3 | 1700 | 2022-07-22 | HCO+(2-1), HCN(2-1) | 39, 175 | 2021.1.00766 |
| Circinus | 0.027 | 16.7 | 5600 | 2019-07-14 | CO(3-2), HCO+(4-3), HCN(4-3) | 37, 259 | 2018.1.00581 |
| Circinus | 0.020 | 22.5 | 5400 | 2019-06-07 | HCO+(3-2) | 29, 350 | 2018.1.00581 |
| IC 4296 | 0.40 | 25 | 1700 | 2014-07-23 | CO(2-1) | 190, 226 | 2013.1.00229 |
| Abell 2597 | 0.43 | 26 | 10900 | 2013-11-17 | CO(2-1) | 15, 213 | 2012.1.00988 |
| Abell 2597 | 0.17 | 34.2 | 2700 | 2021-11-25 | HCO+(2-1), HCN(2-1) | 14, 170 | 2021.1.00766 |
| NGC 5044 | 0.74 | 54 | 2400 | 2018-09-20 | CO(1-0) | 32, 107 | 2017.1.00629 |
| NGC 5044 | 1.89 | 25 | 1400 | 2012-01-13 | CO(2-1) | 45, 228 | 2011.0.00735 |
| NGC 5044 | 0.18 | 34.4 | 2600 | 2022-07-22 | HCO+(2-1), HCN(2-1) | 38, 170 | 2021.1.00766 |
| NGC 1052 | 0.48 | 54.0 | 1200 | 2016-05-26 | CO(1-0) | 794, 108 | 2015.1.00591 |
| NGC 1052 | 0.03 | 26.2 | 600 | 2015-10-23 | CO(2-1) | 443, 223 | 2015.1.01290 |
| NGC 1052 | 0.13 | 16.8 | 4300 | 2015-08-16 | CO(3-2) | 333, 344 | 2013.1.01225 |
| NGC 1052 | 0.26 | 62.8 | 700 | 2017-07-28 | HCN(1-0) | 1020, 88 | 2016.1.00375 |
| NGC 4261 | 0.26 | 24.7 | 1900 | 2018-01-19 | CO(2-1) | 253, 236 | 2017.1.00301 |
| NGC 4261 | 0.18 | 16.8 | 2300 | 2018-01-21 | CO(3-2), HCO+(4-3), HCN(4-3) | 223, 348 | 2017.1.01638 |
Our understanding of the molecular gas in massive galaxies has been built upon theory, simulations, and observations (examples include O’Dea et al., 1994; Pizzolato & Soker, 2005; Gaspari et al., 2011; McNamara et al., 2016; Gaspari et al., 2018; Olivares et al., 2019; Rose et al., 2019b; Fabian et al., 2022). Although theories and simulations can be readily used to study molecular gas on a wide range of spatial scales, observations are more limited. In extragalactic sources, molecular gas is most readily observed in emission, but this typically limits us to scales of or more. They are therefore orders of magnitude away from resolving cold gas into individual clouds – the scales on which key processes such as star formation and AGN accretion occur.
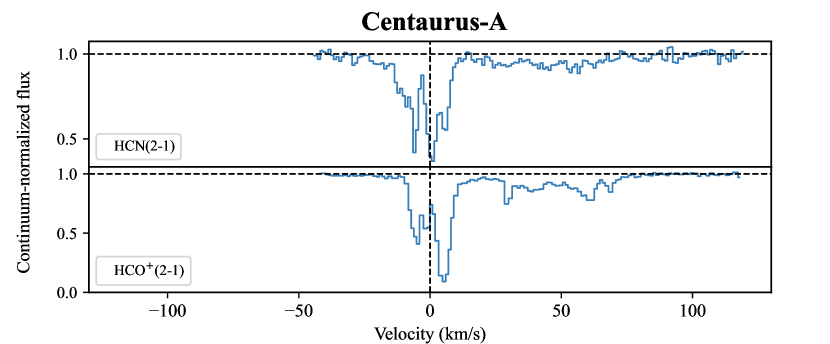
An alternative technique to study molecular gas is via absorption lines against a bright and compact background continuum source. This technique is advantageous because its sensitivity is many orders or magnitude higher than emission. As a result, the molecular gas can be studied on much smaller scales. The iconic radio galaxy Centaurus-A was the first system to be studied in this way (Israel et al., 1990). Of particular advantage is that this system’s radio continuum emission and absorbing clouds lie within the same galaxy, meaning that any redshifted absorption unambiguously indicates movement towards the galaxy centre along the line of sight. This is in contrast to both emission lines and extrinsic absorption lines (i.e. absorption found due to the chance alignment of a background quasar and an intervening galaxy, e.g. Wiklind & Combes, 1996, 1997b). In these cases, there is ambiguity as to whether the observed gas lies in front of or behind the core of the galaxy, so its direction of motion is unclear.
Unfortunately, finding molecular absorption like that in Centaurus-A requires an extremely bright and compact radio continuum source, so a lack of similar observations followed over the next two decades. However, with the much improved angular resolution and sensitivity offered by the Atacama Large Millimeter/submillimeter Array (ALMA), the last decade or so has been more fruitful and many more intrinsic absorption line systems have now been found, mostly in group and cluster environments (e.g. David et al., 2014; Tremblay et al., 2016; Rose et al., 2019a; Rose et al., 2019b; Ruffa et al., 2019; Rose et al., 2020; Kameno et al., 2020). With these advancements, individual cases of molecular and atomic absorption have now been suggested as being due to clouds within the circumnuclear disk and/or accreting onto the central supermassive black hole (e.g. Tremblay et al., 2016; Rose et al., 2019b; Morganti et al., 2023; Izumi et al., 2023; Oosterloo et al., 2023).
Rose et al. (2019b) presented the first multi-target study of intrinsic molecular absorption with ALMA observations of CO(1-0) and CN(1-0). Added to Centaurus-A, NGC 5044 and Abell 2597, this raised the total number of intrinsic molecular absorption line systems to eight. Initial results from this survey appeared to show that molecular absorption in such galaxies is surprisingly common, with a detection rate of around 40 per cent. Additionally, although most of the absorbing gas clouds had no significant line of sight velocity towards or away from their galaxy centre, a slight bias for clouds to be moving towards their galaxy’s centre appeared to be present.
Subsequent observations of the edge-on elliptical brightest cluster galaxy Hydra-A have shown that higher order transitions and a wider mix of molecular tracers can be particularly effective at detecting intrinsic molecular absorption (Rose et al., 2020). As such, in this paper we present new ALMA observations of eight massive galaxies covering CO(2-1), CN(2-1), HCO and HCN(2-1) in many systems with molecular absorption already detected via other lines. These new observations offer a significant improvement – detecting many more molecular absorption regions and with a higher sensitivity. Combined with CO(2-1) observations, we can therefore study the bulk motions of the absorbing clouds in the context of each galaxy’s molecular emission. We try to be exhaustive in studying all known intrinsically absorbing systems. Although a handful of additional intrinsic molecular absorption systems are known, they are without high resolution observations of the molecular emission. These include Allison et al. (2019), Combes & Gupta (2024) and Emonts et al. (2024).
The rest of this paper is laid out as follows. In section 2 we give details on our sample, and present moments maps and spectra. We also detail our data reduction methods. In section 3 we calculate excitation temperatures and column densities for the absorbing gas in each system, as well as molecular masses from the emission. In section 4, we discuss our findings and the potential implications. Section 5 summarises our findings. We assume cold dark matter cosmology with and , and a Hubble constant of H km/s/Mpc.
2 Data
| Source | RA, Dec (J2000) | Redshift reference | ||||
|---|---|---|---|---|---|---|
| NGC 6868 | 20:09:54.1, -48:22:46.3 | 0.00950.0001 (FORS) | Rose et al. (2019b) | 283030 | -60 | |
| Abell S555 | 05:57:12.5, -37:28:36.5 | 0.04460.0001 (MUSE) | Rose et al. (2019b) | 1336430 | -190 | |
| Hydra-A | 09:18:05.7, -12:05:44.0 | 0.05440.0001 (MUSE) | Rose et al. (2019b) | 1629430 | 120 | |
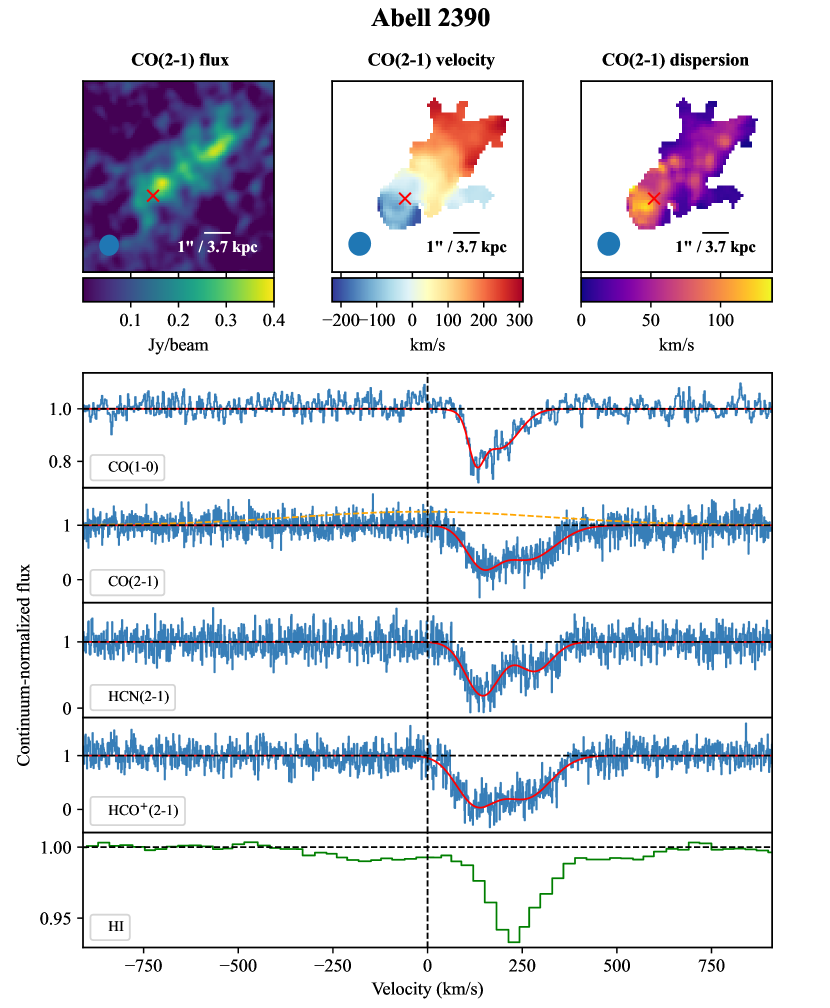
| Abell 2390 | 21:53:36.8, +17:41:43.7 | 0.23040.0001 (VIMOS) | Hamer et al. (2016) | 6907430 | 170 | |
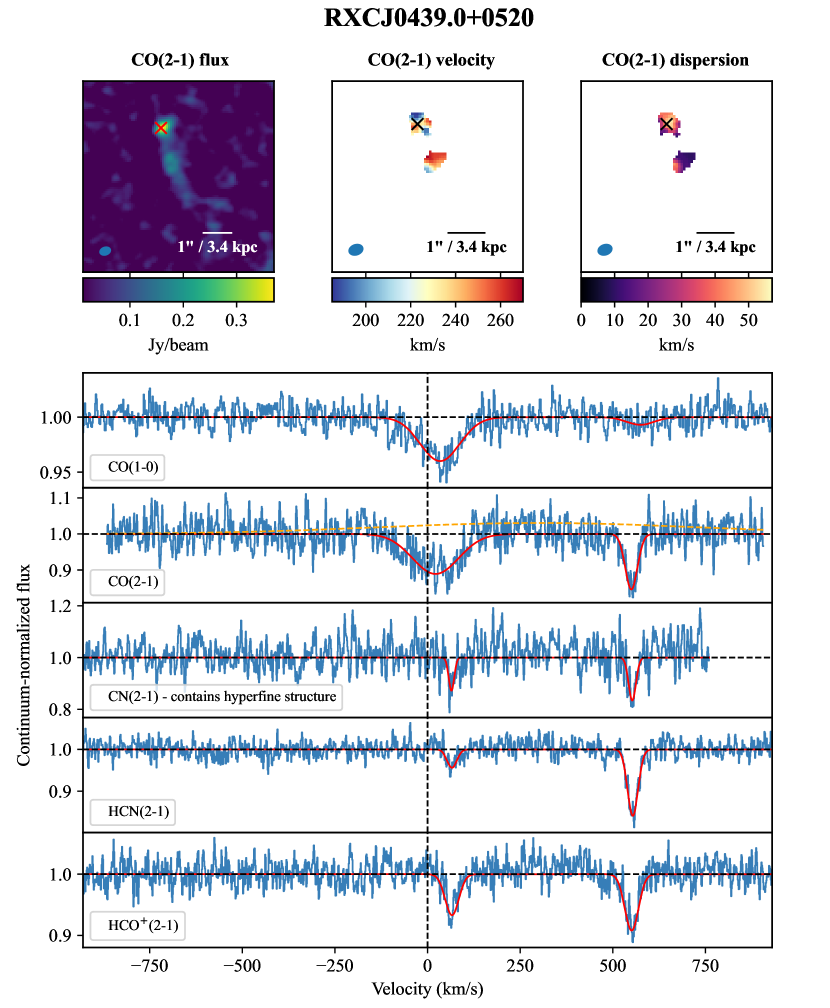
| RXCJ0439.0+0520 | 04:39:02.3, +05:20:43.7 | 0.20760.0001 (VIMOS) | Hamer et al. (2016) | 62237 | 210 | |
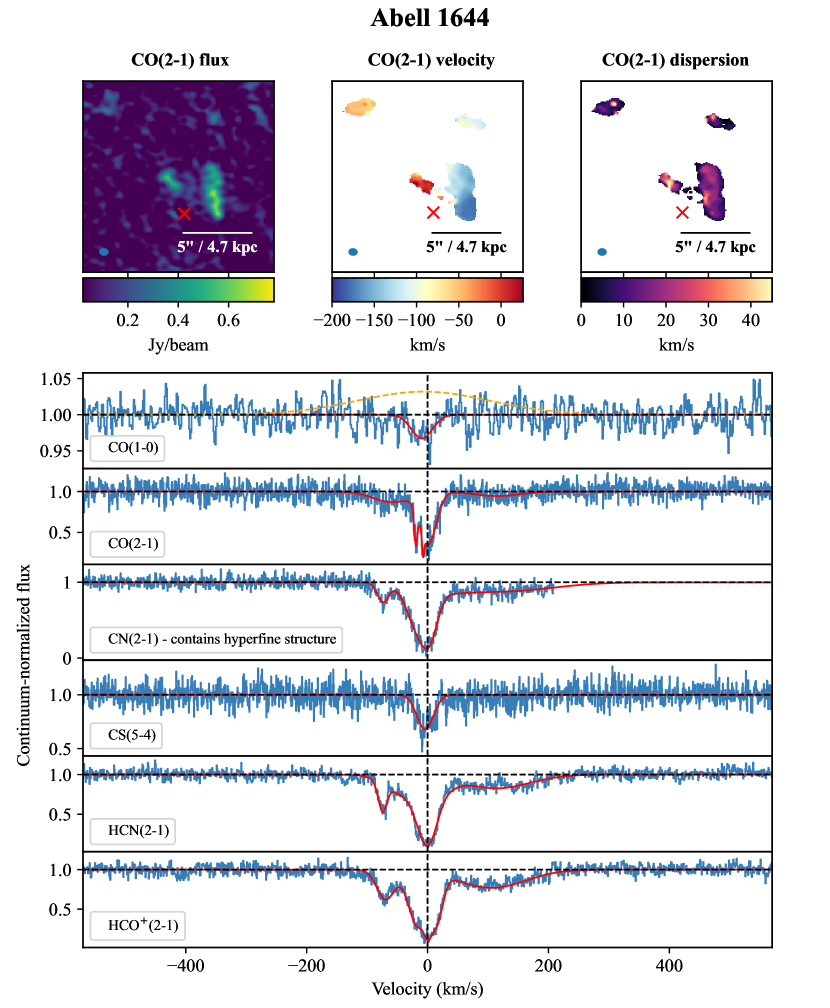
| Abell 1644 | 12:57:11.6, -17:24:34.1 | 0.04730.0001 (MUSE) | Rose et al. (2019b) | 1419130 | -60 | |
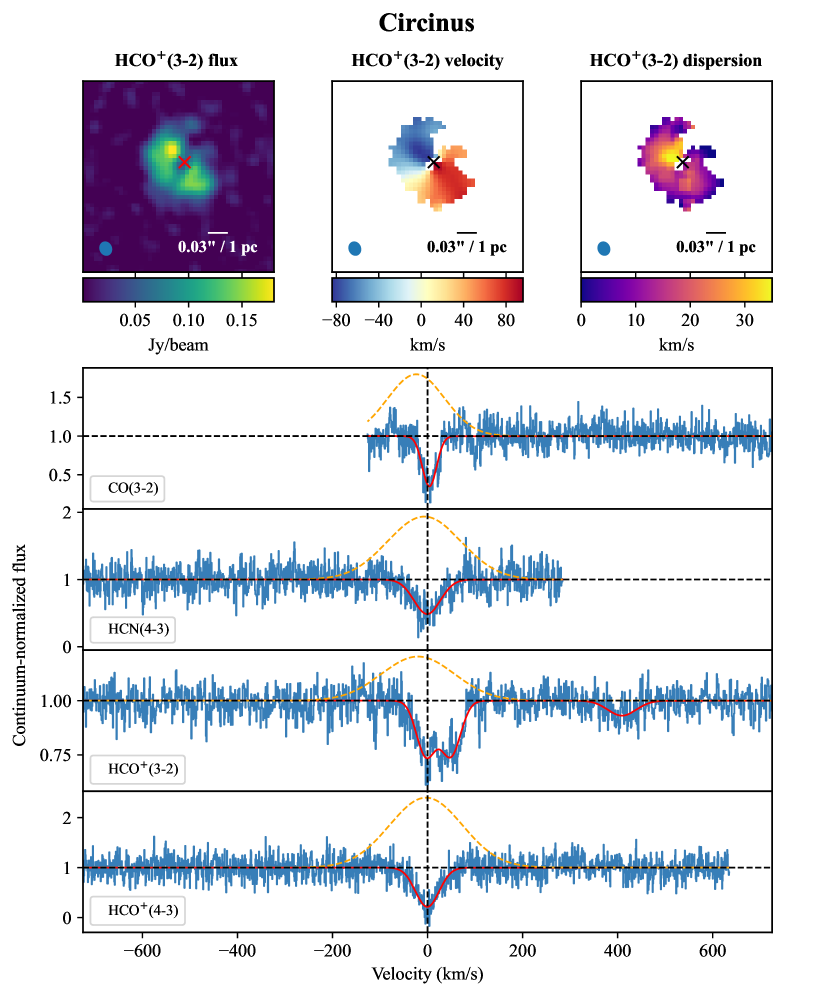
| Circinus | 14:13:09.9, -65:20:21.0 | 0.001450.00001 (NED) | Ursini et al. (2023) | - | ||
| IC 4296 | 13:36:39.1, -33:57:57.3 | 0.012470.00003 (NED) | Ruffa et al. (2019) | 373810 | -60 | |
| Abell 2597 | 23:25:19.7 , -12:07:27.7 | 0.08210.0001 (MUSE) | Tremblay et al. (2018) | 2461330 | 20 | |
| NGC 5044 | 13:15:24.0, -16:23:07.6 | 0.00920.0001 (MUSE) | Rose et al. (2019b) | 276130 | 30 | |
| NGC 1052 | 02:41:04.8, -08:15:20.8 | 0.004980.00002 (RC3) | de Vaucouleurs et al. (1991) | - | ||
| NGC 4261 | 12:19:23.2, +05:49:29.7 | 0.00730.0001 (OHP) | Matsumoto et al. (2001) | 220030 | -10 | |
| Centaurus-A | 13:25:27.6, -43:01:09.0 | (NED) | Crook et al. (2007) | 5475 | - |
| Source | Galaxy Type | Inclination / ∘ | Molecular Morphology | Molecular Mass / M⊙ |
|---|---|---|---|---|
| NGC 6868 | Elliptical | 41 | 0.5 kpc wide disk inclined at | 1.3 |
| Abell S555 | Unknown | - | Plume of 2.5 kpc as measured along l.o.s. | 5.6 |
| Hydra-A | Elliptical-S0 | 79 | 5 kpc molecular disc inclined at | 3.1 |
| Abell 2390 | Irregular | - | Plume of 15 kpc as measured along l.o.s. | 2.2 |
| RXCJ0439.0+0520 | Irregular | - | Plume of 9 kpc as measured along l.o.s. | 1.3 |
| Abell 1644 | Irregular | - | Clumps distributed along an arc | 1.6 |
| Circinus | Sb spiral | 64 | Spiral arms inclined at (Izumi et al., 2018) | - |
| IC 4296 | Elliptical | 90 | 0.5 kpc wide disk inclined at | 2.3 |
| Abell 2597 | Elliptical | 68 | Irregular central 7 kpc, faint emission to 30 kpc | 4.6 |
| NGC 5044 | Elliptical | 43 | One or two weak clumps 200-500 pc from AGN | 2.4 |
| NGC 1052 | Elliptical | 70 | Gas poor with CND (Kameno et al., 2020) | - |
| NGC 4261 | Elliptical | 56 | 200 pc wide disk inclined at | 2.1 |
| Centaurus-A | S0 | 45 | Dense gas along dust lane (Wild et al., 1997) |
∗The molecular mass of Centaurus-A is taken from Parkin et al. (2012).
2.1 Sample
We present ALMA observations of molecular gas in 12 galaxies. Details of these observations are given in Table 1. Further information on the location and redshift of each source is given in Table 2, while Table 3 gives each galaxy’s classification and summarises its molecular emission properties. More details on each source’s properties are given in Appendix A.
The largest set of data we use is from ALMA project 2021.1.00766.S (P.I. Tom Rose), which aimed to detect CO(2-1), CN(2-1), HCO+(2-1) and HCN(2-1) in several galaxies known to have molecular absorption from other lines. This project followed on from a survey of 23 X-ray selected brightest cluster galaxies (2017.1.00629.S, P.I. Alastair Edge) which aimed to detect CO(1-0) absorption against the galaxies’ radio cores (see Rose et al., 2019b, in which more details on the sample selection can be found). In brief, by selecting the host cluster from its diffuse X-ray emission, this survey was not biased to central galaxies with any particular orientation of their AGN.
In this paper we aim to provide analysis of the bulk motions of all known intrinsic molecular absorption lines which have complementary high resolution molecular emission line observations, so data from a number of other projects is also presented. In Table 1, we show the project from which each observation originated. We do not include NGC 1275, which has low significance absorption reported by Nagai et al. (2019). Subsequent IRAM (Institut de Radioastronomie Millimétrique) observations with NOEMA (NOrthern Extended Millimeter Array) at higher sensitivity do not find molecular absorption in this system.
2.2 Moments maps and spectra
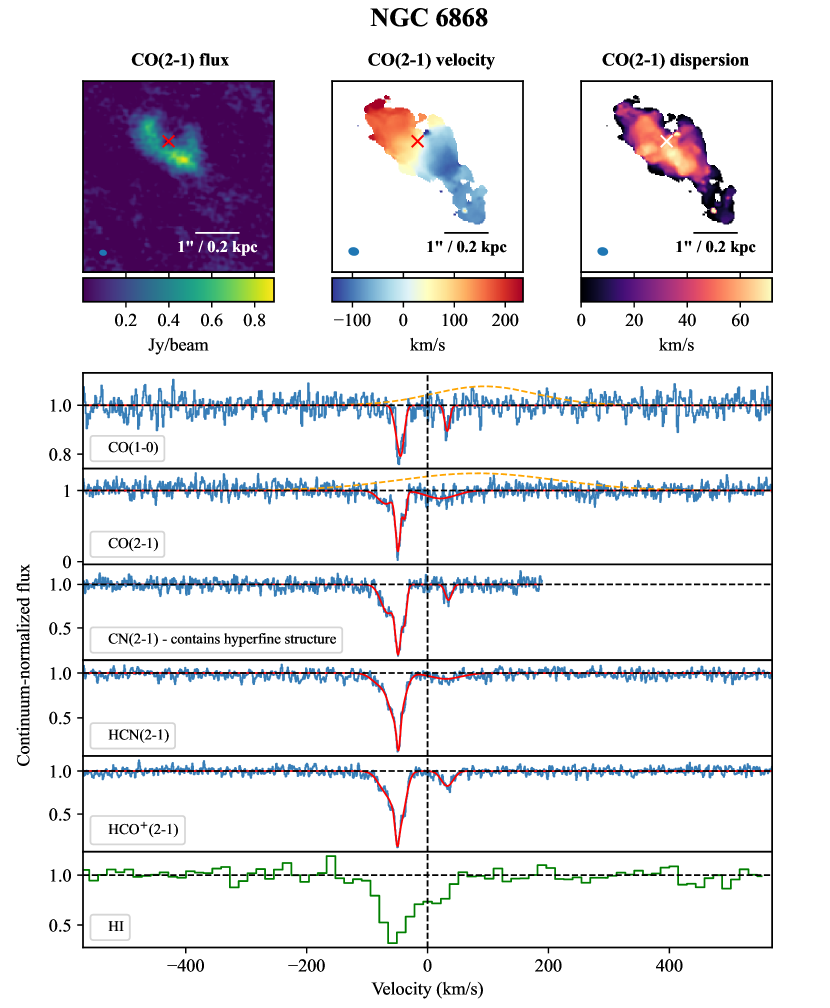
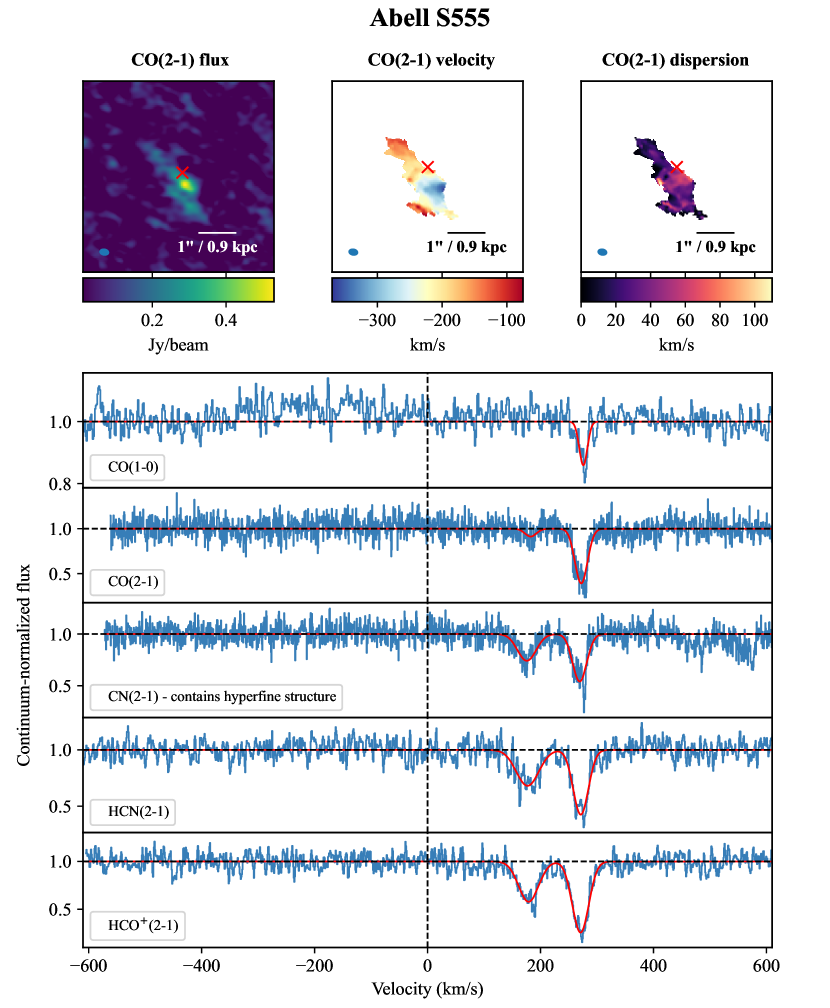
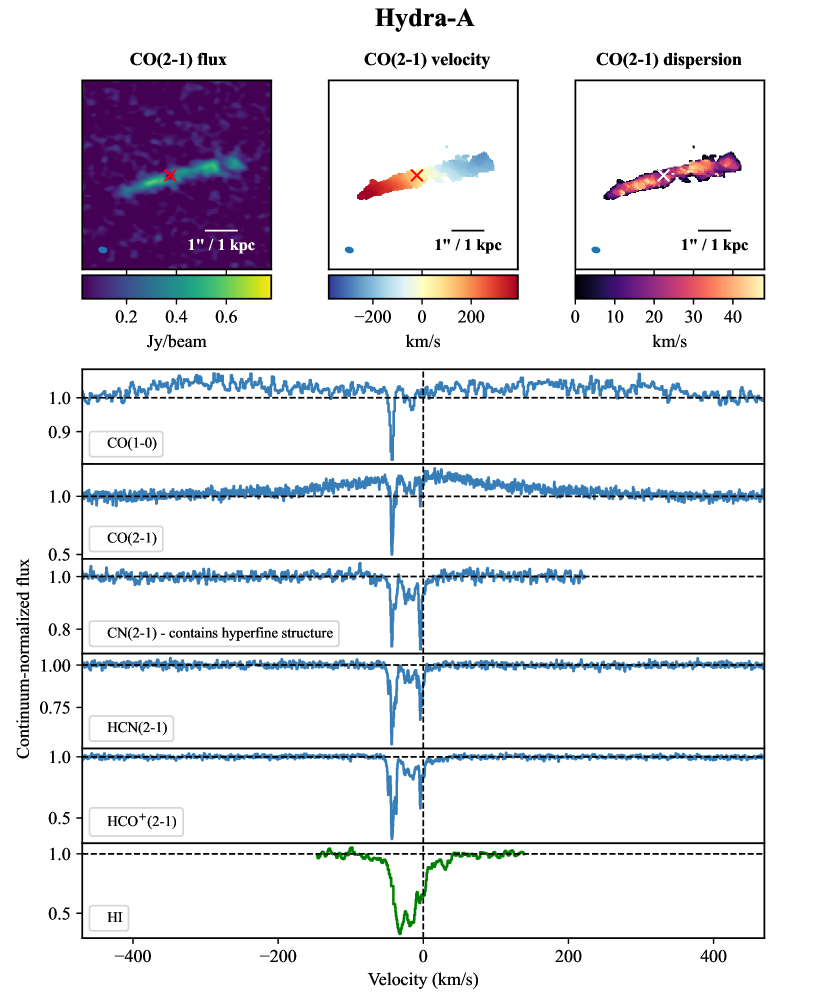
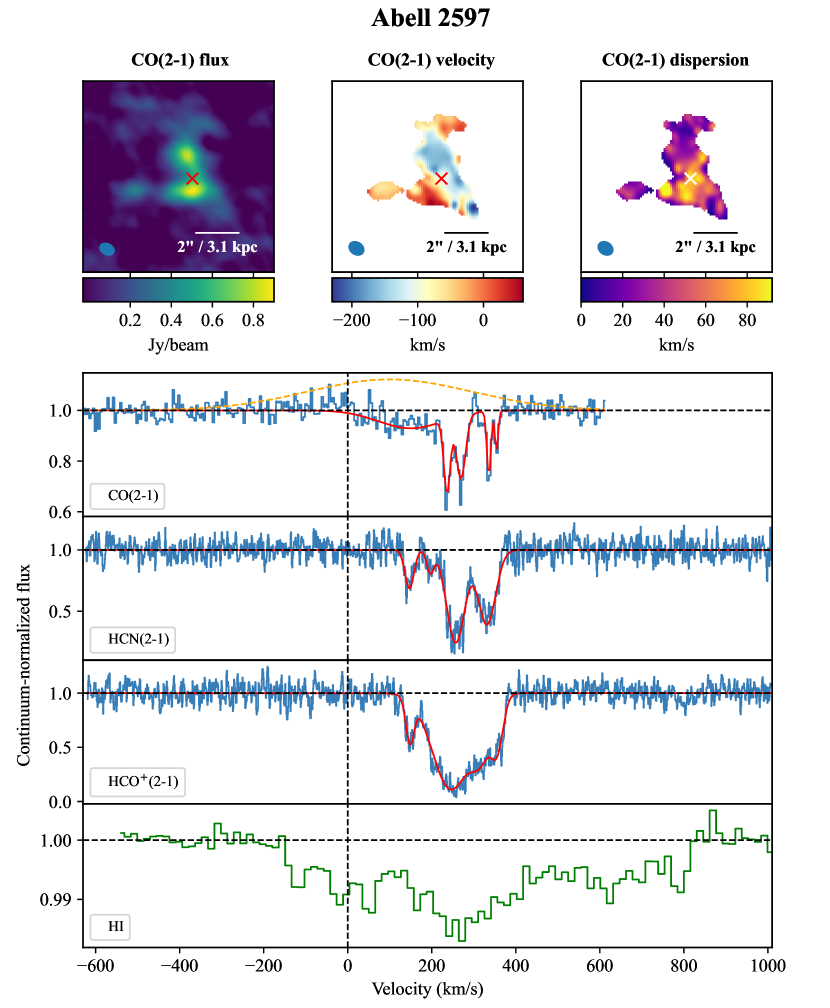
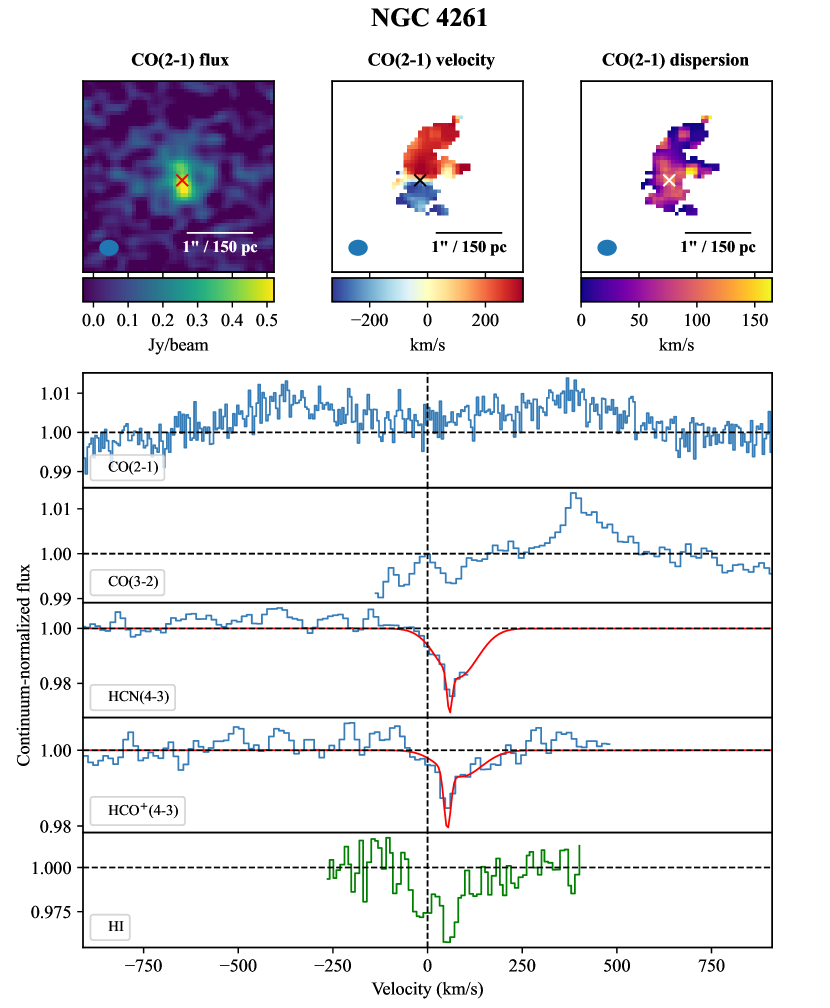
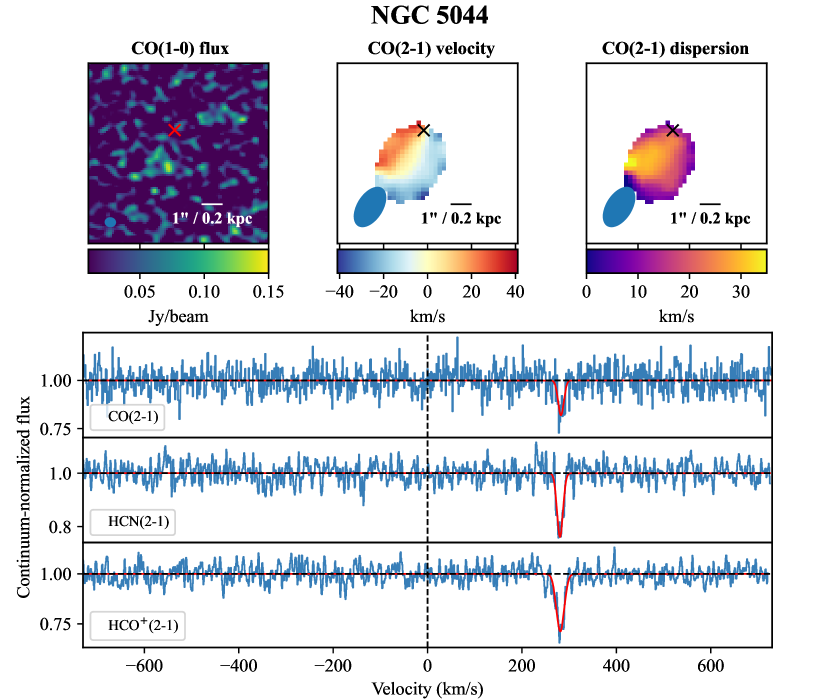
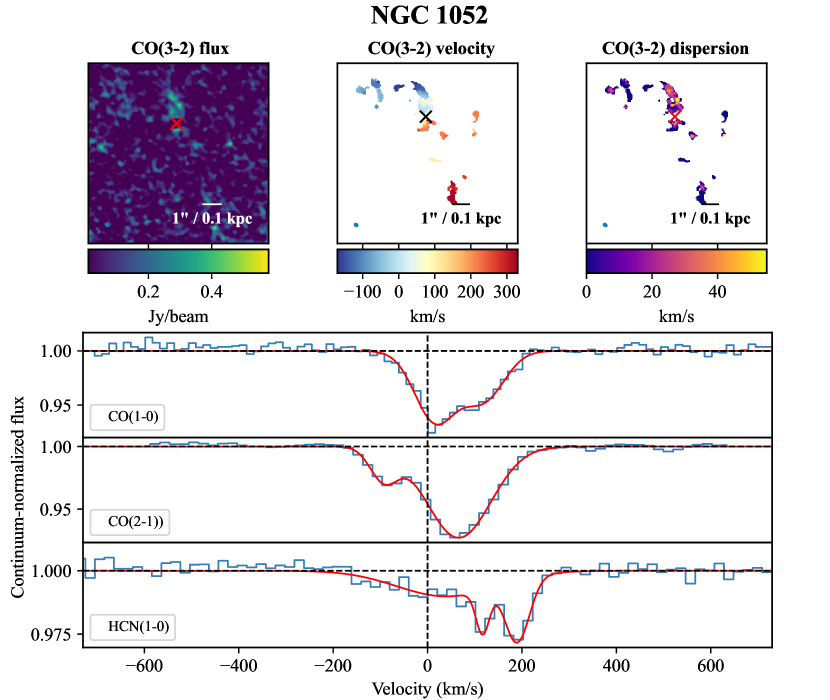
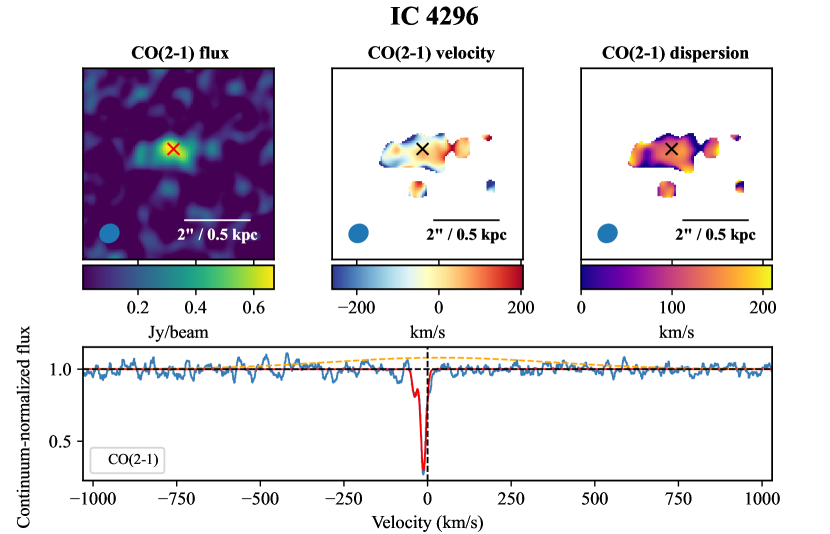
In Figures 1 – 12, we show intensity, velocity, and velocity dispersion maps made with each galaxy’s molecular emission. We indicate the location of each galaxy’s compact and unresolved radio continuum source with a cross, against which we extract the spectra of CO(1-0), CO(2-1), CN(2-1), HCO+(2-1) and HCN(2-1). Typically, the ALMA observations span velocities from around -1500 to +1500 km/s, though we see no absorption or emission features outside the range shown in the spectra. Sometimes, absorption from other lines is also present. Abell 1644 has CS(5-4) absorption. Hydra-A has several more molecules detected in absorption than we show, including HCO+(1-0) HCN(1-0), H2C(3-2) and 13CO(2-1). These can be seen in (Rose et al., 2020), along with the best fits. NGC 1052 has several more lines shown in Kameno et al. (2020). Finally, NGC 6868, Abell 2597, Abell 2390, Hydra-A and NGC 4261 have HI absorption. We clearly distinguish these HI spectra by showing them in green. In Figure 13, we also show HCO+(2-1) and HCN(2-1) spectra seen against the central radio source of the iconic radio galaxy Centaurus-A, from Wiklind & Combes (1997a).
2.3 Data reduction
We produce data cubes from the ALMA observations using measurement sets available from the National Radio Astronomy Observatory (NRAO) Archive. We processed the data with CASA version 6.6.3.22, a software package produced and maintained by NRAO (McMullin et al., 2007). From the measurement sets provided, we made continuum subtracted images using the CASA tasks tclean and uvcontsub. In tclean, we have used a hogbom deconvolver and produced images with the narrowest possible channel width. For our moments maps, we use a data cube made with natural weighting to minimise noise. In most cases, we extract our spectra from data cubes made with uniform weighting, which optimises the angular resolution of the data. This limits contamination from spatially extended molecular emission in the spectra. However, where no detectable emission is present close to the radio core, we extract spectra using a cube made with natural weighting.
The moments maps we show are produced from the CO(2-1) observations of each galaxy, except for Circinus and NGC 5044. In Circinus, we use very high angular resolution HCO+(3-2) emission which traces the inner few parsecs of the galaxy. In NGC 5044, the CO(2-1) observation has a clear detection of emission, but is of very poor angular resolution. On the other hand, the CO(1-0) observation is less strong, but is of higher angular resolution. We therefore show an intensity map made from the CO(1-0) data, but velocity and velocity dispersion maps made from CO(2-1) data.
We produce our maps using the CASA task immoments. Normally moment 0 maps are made using all channel values in each spaxel. However, for sources with a large beam and overlapping emission and absorption, we use ‘includepix = [0,100]’, i.e. all pixel values from 0 to an arbitrarily large value. This prevents the negative absorption fluxes wiping out positive emission at other velocities. After producing these maps, we therefore estimate the summed value of the remaining positive noise in an emission free region, and subtract it from the whole image. This may bias the overall intensity map to be lower than reality because negative noise will effectively be subtracted from higher significance emission twice. However, this method more accurately displays the emission seen against the radio core. Additionally, this method only affects the moment 0 maps.
Our moments 1 and 2 maps are made with emission, which we find to give the best appearance. To reduce noise in the data cubes, these maps have sometimes been made using a slightly smoothed image. The effect this has on the effective image resolution is indicated by the beam size on each image. This smoothing means we can capture the velocity and velocity dispersion of more extended emission.
2.4 Line Fitting Procedure
To determine the optimal fit for each spectrum, we first identify the minimum number of components required by incrementally adding Gaussian lines. We do this until no channel contains emission and the RMS value of the fitting region is less than 1.5 times that of the remainder of the spectrum. This threshold provides a good fit while not introducing unnecessary or unwarranted complexity.
We then perform an initial fit using Python’s SciPy library. Specifically, we use the curve fit minimization algorithm. Our fitting procedure is similar for both emission and absorption lines. However, when a spectrum contains overlapping emission and absorption features, the absorption must be masked while we first fit to the emission. This fit to the emission is then subtracted from the spectrum before fitting to the absorption. We do this masking by eye, which we find to be effective. Additionally, we find that using a reasonable range of masking boundaries results in minimal changes to the ultimate fits.
After making a best fit to a spectrum, we find the noise level. We take this to be the root mean square (RMS) of the continuum emission, excluding regions exhibiting emission or absorption features. Then, 10,000 simulated spectra are generated based upon the observed spectrum and the initial best fit. At each velocity channel, a pseudo random value is drawn from a Gaussian distribution centred at 0 and with a dispersion equal to the RMS noise. This value, which may be positive or negative, is then added to the original spectrum’s best fit value for that velocity channel.
After repeating this for all velocity channels, a new simulated spectrum is produced. For each simulated spectrum, we then find a best fit in the same way as for the original spectrum. The 1 upper and lower error bounds are then defined by the values that delineate the 15.865 per cent highest and lowest results among the 10,000 fits. This ensures that 68.27 per cent of the fitted parameters fall within the 1 range.
Where the emission and absorption overlap, we do not account for errors from fitting to the emission propagating through to the absorption fits. This is because the former are generally much smaller.
Best fit parameters for each spectrum will be made available online as supplementary material.
| (K) | ||
|---|---|---|
| NGC 6868 | 7.1 | -15 |
| S555 | 9.5 | -10.0 |
| Hydra-A | 3.3 | 111.1 |
| Abell 2390 | 10.7 | -8.9 |
| RXCJ0439.0+0520 | 3.4, 10.6 | 48, -9.2 |
| Abell 1644 | 37 | -4.1 |
| Abell 2597 | >5 | - |
| NGC 5044 | >2 | - |
| NGC 1052 | 1.2 | 5.9 |
| Absorption Column Density / cm-2 | |||||||
| CO | CO | CN | HCN | HCO+ | HCN | HCO+ | |
| Source | (1-0) | (2-1) | (2-1) | (2-1) | (2-1) | (4-3) | (4-3) |
| NGC 6868 | - | - | |||||
| Abell S555 (absorption at 180 km/s) | - | - | - | ||||
| Abell S555 (absorption at 270 km/s) | - | - | |||||
| Hydra-A | - | - | |||||
| Abell 2597 | - | - | - | - | |||
| Abell 2390 | - | - | - | ||||
| RXCJ0439.0+0520 (absorption at 40 km/s) | - | - | |||||
| RXCJ0439.0+0520 (absorption at 550 km/s) | - | - | |||||
| Abell 1664 | - | - | - | ||||
| Circinus∗ | - | - | - | - | - | ||
| NGC 4261 | - | - | - | - | - | ||
| NGC 5044 | - | - | - | - | |||
| NGC 1052 | - | - | - | - | - | ||
| IC 4296 | - | - | - | - | - | - | |
| ∗Circinus also has a CO(3-2) column density of / cm-2. | |||||||
3 Molecular gas properties
3.1 Excitation temperatures
The excitation temperature, , of a two level system is defined in terms of the number of particles in the upper state, and lower state, :
| (1) |
where is the statistical weight of each state. The excitation temperature should not be confused with the more familiar thermal temperature. Rather, it is the temperature that would be expected to produce the ratio of particles in the different energy levels when local thermodynamic equilibrium applies.
For optically thin gas in local thermodynamic equilibrium, the CO(1-0) and CO(2-1) velocity integrated optical depths are related by
| (2) |
where and are the Planck and Boltzmann constants, and are the rest frequencies of the CO(1-0) and CO(2-1) lines and is the excitation temperature (Bolatto et al., 2003; Godard et al., 2010; Mangum & Shirley, 2015). According to Equation 2, the ratio of CO(2-1)/CO(1-0) velocity integrated optical depths can be in the range of 0 to 4. These respectively correspond to the extreme cases where T and T.
For each galaxy where we have CO(1-0) and CO(2-1) absorption, we estimate the ratios of the velocity integrated optical depths and the implied excitation temperatures. These are shown in Table 4. We generally estimate a single excitation temperature for each system’s absorption, even though in many cases separate components are clearly present. This is because these components overlap significantly and are heavily degenerate. RXCJ0439.0+0520 is the exception, where the two components of absorption are separated by 500 km/s. We therefore calculate two excitation temperatures.
Many of the CO(2-1)/CO(1-0) ratios in Table 4 fall outside the feasible range of 0 – 4 and therefore give a negative excitation temperature. The excitation temperature may be negative when , which is possible if there is pumping by a maser. However, this effect is not possible in CO. Therefore, one or more of the assumptions made in our calculations is incorrect.
One possibility is that the gas is not in local thermodynamic equilibrium, i.e. the excitation temperature may vary between the different rotational levels. If the CO(1-0) excitation temperature is 20 K and the CO(2-1) excitation temperature is 5 K, then a ratio in the velocity integrated optical depths of 5.6 is expected. This temperature difference is at the more extreme end of what could be expected, but is still far from explaining the ratios of over 10 which we see in the absorption lines of some systems.
A second assumption implicit in our calculations is that the size of the continuum source does not change between the frequencies of the CO(1-0) and CO(2-1) lines. This can alter the line of sight at different frequencies, changing how the clouds intercept the continuum. We explore this possibility in more detail in our discussion. In the mean time however, we proceed to estimate molecular column densities by assuming the ground state excitation temperature of the molecular gas is 5 K for all of the molecular lines.
3.2 Absorption column density estimates
The line of sight column density, , of an optically thin molecular absorption region is:
| (3) |
where () is the partition function, is the speed of light, is the Einstein coefficient of the observed transition and the level degeneracy, with the subscripts and representing the upper and lower levels (Godard et al., 2010; Mangum & Shirley, 2015).
The assumption of optically thin absorption in Equation 3 is inappropriate for some of our data. To account for this, a correction factor from Mangum & Shirley (2015) can be applied to give the following more accurate column density:
| (4) |
This gives the column density of the absorbing molecule as a number density per square cm.
Table 5 shows the column densities estimated using each object’s molecular absorption lines. By far the most dominant error in our calculations of the column densities is the gas excitation temperature, . We therefore use only the central estimate of the velocity integrated optical depth in our calculations.
3.3 Molecular mass estimates
The molecular mass associated with CO emission can be estimated using the following relation from Bolatto et al. (2013):
| (5) |
where is the mass of molecular hydrogen, is a CO-to-H2 conversion factor, is the source’s redshift, is the emission integral and is the luminosity distance in Mpc. is an approximate conversion factor for the expected flux density ratios of the CO(1-0) and CO(2-1) lines, where and represent the upper and lower levels. For CO(1-0), and for CO(2-1), .
To ensure our mass estimates are comparable with similar studies, we use the standard Milky Way CO-to-H2 conversion factor of cm-2 (K km s-1)-1 in our calculations. However, this is a considerable source of uncertainty. In the brightest cluster galaxy RXJ0821+0752 for example, Vantyghem et al. (2017) use 13CO emission to constrain the conversion factor and find it to be roughly half of the Galactic value.
The molecular mass we find for each source is given in Table 3. In NGC 4261, we find a mass of M⊙. This is higher than the M⊙ found by Boizelle et al. (2021). Using the ‘product’ data (a preliminary image delivered with all ALMA data) we also find this value. However, this image appears to have had its continuum over-subtracted, so we have calculated the mass after performing our own continuum subtraction.
4 Discussion
4.1 Velocity distribution of molecular absorption lines – evidence of cold gas inflow
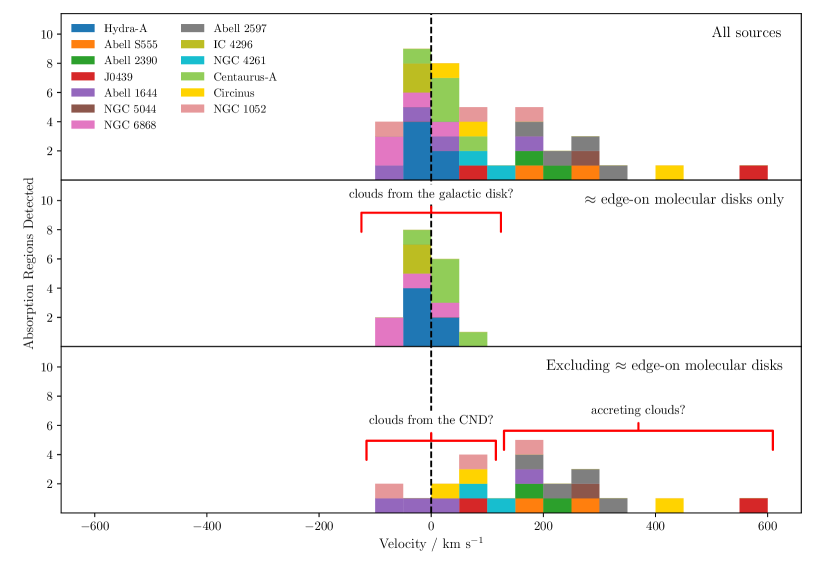
In Figure 14, we show histograms of the absorption line velocities for the galaxies shown in Figures 1 – 13. The top panel shows all intrinsically absorbing systems known to us with complementary high resolution molecular emission line observations. In the middle panel, we show the absorption regions found in galaxies possessing a molecular disk with an inclination angle of (where equates to an edge-on disk). In the lower panel, we show those which have no such disk. When making these histograms, we use the molecular species in which each source’s absorption lines are best resolved. This is typically HCO+, but is sometimes another species111For each galaxy, we use: NGC6868 – HCO+(2-1), Abell S555 – HCO+(2-1), Hydra-A – HCO+(2-1), Abell 2597 – HCO+(2-1), Abell 2390 – HCO+(2-1), RXCJ0439.0+0520 – HCO+(2-1), Abell 1644 – HCO+(2-1), Circinus – HCO+(3-2), NGC 4261 – HCO+(4-3), NGC 5044 – HCO+(2-1), NGC 1052 – HCN(1-0), IC 4296 – CO(2-1), Centaurus-A – HCN(2-1). We also limit the velocity resolution to 5 km/s to ensure the spectra of different sources are comparable.
In the top panel, around two-thirds of the absorption regions detected are evenly distributed within 100 km/s of the zero velocity point. The remaining third are spread across a redshifted wing between 100 and 550 km/s. The distribution of velocities is asymmetric, with the equally blueshifted side lacking any absorption regions. For edge-on or close to edge-on molecular disks, the absorption regions are spread symmetrically about 0 km/s. When excluding sources with an edge-on or close to edge-on molecular disk, the bias for redshifted absorption is particularly strong.
Due to the way absorption lines are formed, each gas cloud’s direction of motion with respect to the nucleus is known without ambiguity. Since an absorbing cloud must lie between the observer and the continuum, redshift (i.e. a positive velocity) indicates movement towards the galaxy centre. The only exception to this is when the relative velocity is near zero and comparable to the velocity error, typically 10-30 km/s.
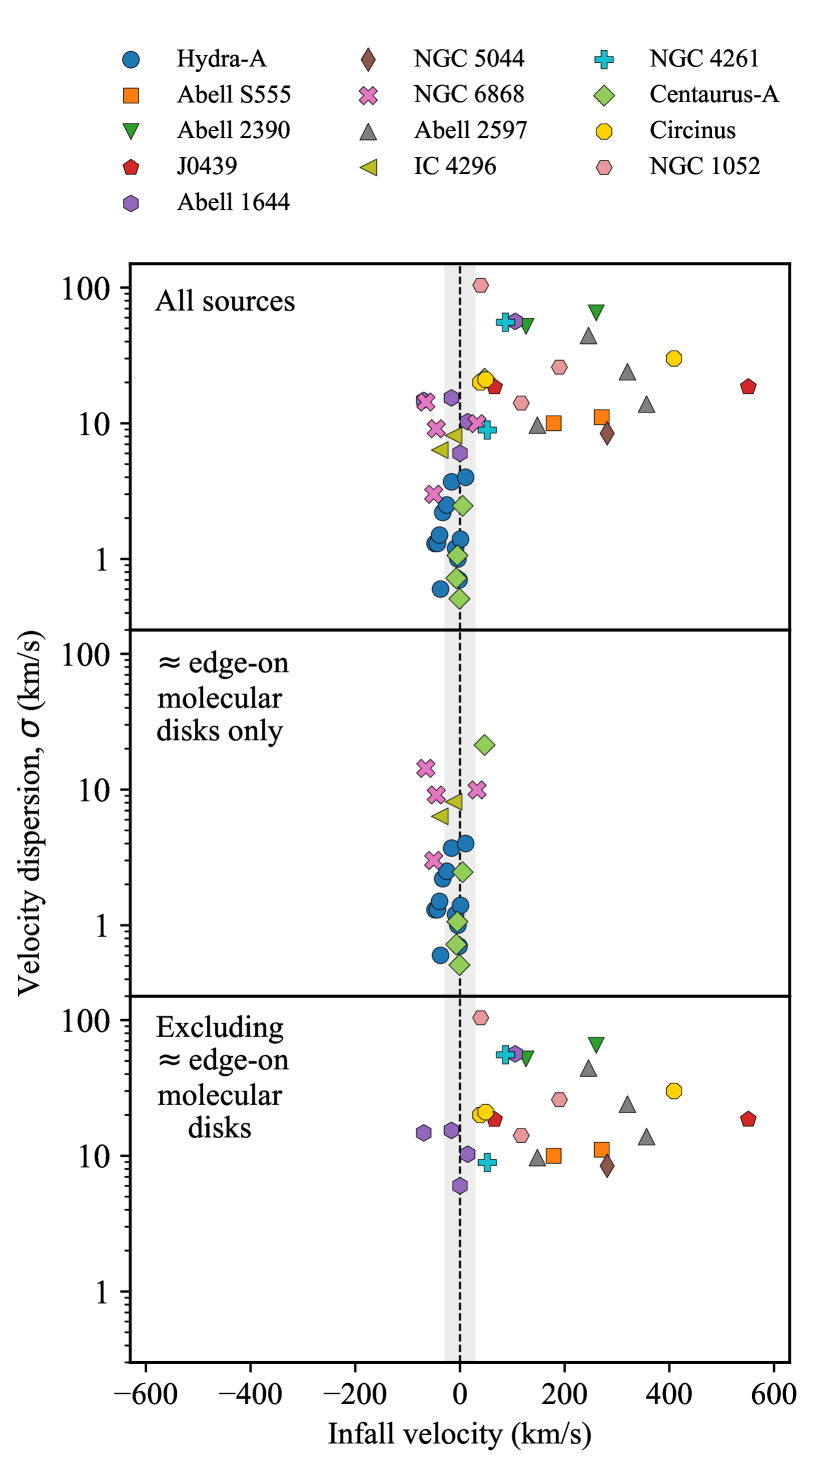
The high degree of asymmetry in Figure 14 therefore provides strong evidence of molecular gas migrating towards galaxy centres in significant quantities, particularly when excluding edge-on and close to edge-on disks. In Figure 15, we also show the infall velocity of the absorption regions versus their velocity dispersion. This shows two distinct populations of molecular clouds. In disks, we see narrow absorption features with no net movement towards the galaxy centre. Where our line of sight does not pass through a disk, the absorption is caused by high velocity dispersion clouds. Most of these are moving towards the galactic centre along the line of sight at hundreds of km/s.
4.2 The location of absorbing molecular clouds
With the velocity distribution shown in Figure 14, it is interesting to consider the different regions and environments within a galaxy where absorbing molecular clouds may lie, and how this would affect their properties. This is particularly important given that we lack information regarding their proximity to their galaxy’s centre, even if we know their RA, Dec and line of sight velocity with certainty.
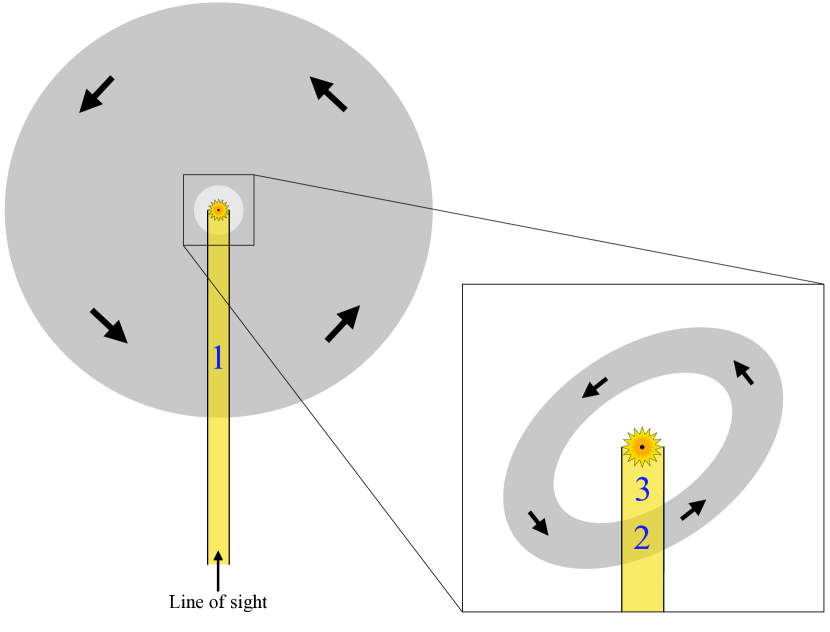
In Figure 16 we show a simplified bird’s eye view of our line of sight to a galaxy with an edge-on disk of molecular gas. Perhaps the most obvious region in which clouds may lie is within the large, typically kpc scale distribution of molecular gas (which will not necessarily be a disk). We label this as region 1.
These large scale gas distributions are normally studied in ensemble via emission. However, in the Milky Way it is possible to study molecular clouds via emission on smaller mass scales due to their proximity. In the Galaxy, cold gas tends to be clumpy and assembled into clouds of 10s to 1000s of solar masses (Gong et al., 2016; Roman-Duval et al., 2010). There is also no known net flow of gas towards or away from the galaxy centre, and any orbital velocities will be perpendicular to our line of sight. These properties, combined with their relatively stable environment, give the clouds low line of sight velocities and velocity dispersions of a few km/s or less. Therefore, if the clouds we detect via absorption are from similar kpc scale distributions of molecular gas, they are likely to produce narrow absorption features with low line of sight velocities.
For a large scale distribution of gas, the probability of its constituent clouds aligning with the continuum is heavily dependent on our line of sight. The probability will be maximised for an edge on disk e.g. Hydra-A. In this case, any change in inclination will reduce the line of sight column density of molecular gas and thus reduce the chance of a cloud-continuum alignment. Therefore, when we show the absorption regions detected in edge-on or close to edge-on disks in the central panels of Figures 14 and 15, the probability that the absorption has arisen from gas within each galaxy’s disk is maximised.
Molecular absorption may also originate from the circumnuclear disk, labelled ‘2’ in Figure 16. Although this region is of much lower mass than the galaxy-wide distribution of molecular gas, its proximity to the continuum source means an individual cloud’s chance of aligning with the continuum is higher.
The circumnuclear disk is a highly energetic region which surrounds an AGN, and is composed of molecular and atomic gas. In the Milky Way for example, the circumnuclear disk has an inner radius of 1.5 pc and extends out to around 7 pc, comparable to the supermassive black hole’s sphere of influence (Oka et al., 2011). Due to the highly energetic nature of this region, its molecular clouds would likely have a high velocity dispersion, which would be imprinted onto their molecular absorption lines.
A galaxy’s circumnuclear disk is also typically composed of gas on elliptical orbits (Solanki et al., 2023; Izumi et al., 2023). If these are aligned such that neither the semi-major or semi-minor axes are parallel to the line of sight, an apparent line of sight velocity can arise. In this way, elliptical orbits may induce a line of sight velocity of up to 200 km/s (Rose et al., 2024). However, the orientation of the orbit will rarely maximise the apparent line of sight velocity. Additionally, an inclination of the elliptical orbit will reduce it further by a factor of . Therefore, the red and blueshifted velocities induced by this effect will typically be 100 km/s or less. Importantly, the apparent line of sight velocities from this effect have an equal probability of being red or blueshifted, since the sign of the velocity simply depends on observed direction of rotation. Therefore, the symmetric cluster of absorption regions in the lower panels of Figure 14 and 15, which have a roughly symmetric distribution of velocities between -100 and 100 km/s, are likely to be from this region.
Numerical simulations suggest that the vast reservoirs of molecular gas in massive galaxies exist, at least in part, as a population of relatively small clouds within radii of a few tens to hundred of parsecs (Pizzolato & Soker, 2005; Gaspari et al., 2015, 2018). These clouds are expected to undergo inelastic collisions, leading to angular momentum loss and their funnelling towards the central supermassive black hole, eventually providing it with fuel (Vollmer et al., 2004). For regions with a high velocity dispersion like the circumnuclear disk, these cloud-cloud collisions are particularly likely. Therefore, regions 2 and 3 of Figure 16 may be composed of clouds originating from the circumnuclear disk, which have undergone collisions and are migrating towards the supermassive black hole. As such, absorption from this region may be expected to be have a wide velocity dispersion, as well as being redshifted. To estimate the possible speeds these clouds may attain, we can consider them to be in freefall. If all the lost gravitational potential energy is converted to kinetic energy, then:
| (6) |
where is the cloud velocity after falling from stationary at a height to towards a mass .
The exact radii at which clouds will begin to fall is uncertain. However, we can make estimates based on the size of the circumnuclear disk detected in Circinus. At the centre of the galaxy, Izumi et al. (2023) infer the presence of a supermassive black hole (plus a molecular mass one order of magnitude lower). If freefalling from 2 pc to 1 pc, a velocity of 90 km/s is reached. At 0.5 pc, the velocity reaches 150 km/s. A velocity matching that of the 420 km/s HCO+(3-2) absorption feature would be reached at a radius of 0.09 pc ( AU).
The clusters in our sample with the more massive central galaxies e.g. Abell 2390 and Abell 2597 have black hole masses around three orders of magnitude higher than Circinus. Depending on the size of the circumnuclear disks, infall may therefore be considerably faster.
4.3 The fate of infalling molecular clouds
Figures 14 and 15 represent convincing evidence of cold molecular gas flowing into galactic centres at hundreds of km/s. However, the infall of these clouds may not be modelled well by freefall. Instead, with some initial angular momentum, they are likely to enter stable elliptical orbits rather than falling directly onto the supermassive black hole and providing the active galactic nucleus with fuel. The radii of these stable orbits is likely extremely low, and probably sub-parsec. At this proximity to the galaxy centre, the molecular gas is likely to rapidly change into an atomic and/or ionised phase. The wide velocity dispersion of the HI gas in Abell 2597 and Abell 2390 (Figures 4 and 5) may be a manifestation of this effect, with the outer layers of the infalling clouds being evaporated and their velocity dispersion increasing. Ultimately, a fraction of the gas we see migrating towards the galactic centres may contribute to the fuelling of the active galactic nucleus, with the rest likely to be ejected by radio jets and lobes in what are often seen as ionised outflows (e.g. Harrison et al., 2018; Choi et al., 2020; Laha et al., 2021; Singha et al., 2021).
4.4 Cloud structure
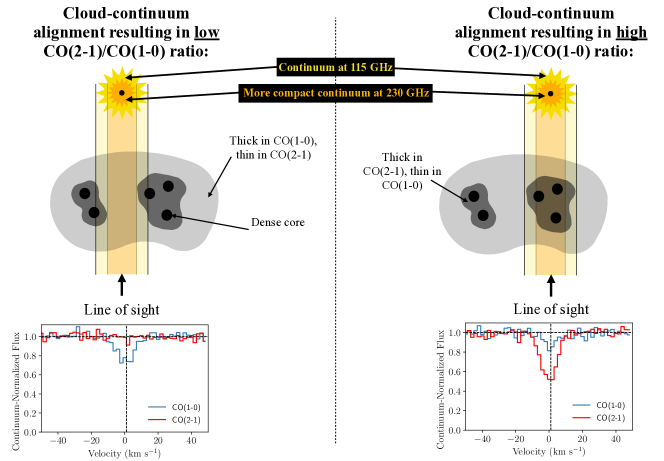
The breakdown in our excitation temperature calculations of section 3.1 and the resulting negative temperatures imply a false premise in our assumptions of thermodynamic equilibrium, homogeneous clouds and a continuum source which does not change in size with frequency. However, we ruled out a lack of non-local thermodynamic equilibrium as the cause because its effect is too small. Instead, a continuum that changes in size with frequency, combined with the hierarchical structure of the molecular clouds, could explain the otherwise impossible CO(2-1)/CO(1-0) molecular line ratios.
Molecular gas concentrations in massive galaxies are predicted to have a hierarchical structure. This consists of dense, star forming cores up to 0.1 pc in diameter, pc wide filaments, pc wide clumps and pc sized clouds (Bergin & Tafalla, 2007). In Figure 17, we show a simplified version of molecular clouds consisting of three layers: a dense core, a medium density layer and a lower density outer layer. In the lowest density layer, there are few collisions between H2 and CO molecules. This leaves almost all CO molecules in the ground state. Therefore, only (1-0) absorption can be produced via the promotion of molecules to the first excited state. Few molecules will be in other states, so absorption from higher order lines is not produced. The medium density layer will have more collisional excitation occurring between H2 and CO molecules, making CO(2-1) the dominant absorption line.
Additionally, due to the 115 GHz interval in the CO(1-0) and CO(2-1) frequencies, different parts of the core may dominate at different frequencies due to spectral index variations or synchrotron opacity effects. This would produce a continuum which is smaller at higher frequencies.
On the left side of Figure 17, we show a 230 GHz continuum which passes through only the most diffuse parts of the obscuring cloud. Since all the molecules are in the ground state, no CO(2-1) absorption is produced. The slightly larger 115 GHz continuum passes through a large volume of low density gas, leading to strong CO(1-0) absorption. The resulting CO(2-1)/CO(1-0) ratio is very small.
On the right side of Figure 17, we show a 230 GHz continuum which passes through a large volume of CO(2-1) thick gas. On the other hand, the volume of CO(1-0) thick gas passed through by the 115 GHz continuum is significantly lower than in the first arrangement. Thus, there is a much larger velocity integrated optical depth ratio than the limit of 4 predicted by equation 2.
The combined effect of the molecular cloud structure and the varying size of the continuum source can therefore produce a wider range of CO(2-1)/CO(1-0) ratios than would be possible for homogeneous clouds which obscure a continuum whose size does not vary with frequency. It can also lead to apparently negative excitation temperatures.
5 Conclusions
We present analysis of intrinsic molecular absorption lines – those where the background radio continuum and the gas which absorbs it are within the same system. Our data includes many new CO, CN, HCN and HCO+ absorption lines, as well as CO(2-1) emission. In these objects, the line’s redshift unambiguously reveals the speed and direction of motion of the absorbing gas, allowing us to study its bulk motions. Our main conclusions are as follows:
-
•
In galaxies where our line of sight passes through an edge-on or close to edge-on disk of molecular gas, we find low velocity dispersion clouds (typically <9 km/s) with no net inflow our outflow (Figures 14 and 15). In these respects, the clouds are similar those seen throughout of the Milky Way. This is to be expected, given that an edge-on alignment maximises our effective line of sight through the galaxy’s disk. Therefore, the chance of the disk’s molecular clouds aligning with the continuum is maximised.
-
•
When excluding disks, we find that absorption regions have significantly different properties. They have wide velocity dispersions (typically >9 km/s), and in terms of their line of sight velocities, appear to split into two groups. One has red and blueshifted line of sight velocities between -100 and 100 km/s. We argue that these clouds are likely within the circumnuclear disk surrounding the AGN and that their small line of sight velocities are a result of elliptical orbits about the galaxy centre (Figure 16). A second group has line of sight velocities of 150-550 km/s, with no blueshifted counterpart. These exclusively positive velocities imply the bulk movement of molecular gas towards the galaxy centre. We interpret this as evidence of cold accretion onto the galactic centres, which is likely to contribute to AGN fuelling.
-
•
We find a wide range in the CO(2-1)/CO(1-0) ratios of the absorption regions. In around half of cases, the ratio implies a non-physical negative excitation temperature. We show that the high CO(2-1)/CO(1-0) ratios can be explained by variation in the structure of the continuum source with frequency, combined with substructure in the molecular clouds.
Acknowledgements
We thank Tom Oosterloo for providing the HI spectrum of NGC 6868 and Seiji Kameno for helpful discussions when analysing the ALMA data of NGC 1052. We also thank Jeff Mangum for helpful discussions on column densities. T.R. thanks the Waterloo Centre for Astrophysics and generous funding to B.R.M. from the Canadian Space Agency and the National Science and Engineering Research Council of Canada. A.C.E. acknowledges support from STFC grant ST/T000244/1. HRR acknowledges support from an STFC Ernest Rutherford Fellowship and an Anne McLaren Fellowship. P.S. acknowledges support by the ANR grant LYRICS (ANR-16-CE31-0011).
This paper makes use of the following ALMA data: 2017.1.00629.S, 2021.1.00766.S, 2018.1.01471, 2018.1.00581, 2013.1.00229, 2012.1.00988, 2011.0.00735, 2015.1.00591, 2015.1.01290, 2013.1.01225, 2016.1.00375, 2017.1.00301 and 2017.1.01638. ALMA is a partnership of ESO (representing its member states), NSF (USA) and NINS (Japan), together with NRC (Canada), MOST and ASIAA (Taiwan), and KASI (Republic of Korea), in cooperation with the Republic of Chile. The Joint ALMA Observatory is operated by ESO, AUI/NRAO and NAOJ. The National Radio Astronomy Observatory is a facility of the National Science Foundation operated under cooperative agreement by Associated Universities, Inc.
This research made use of Astropy (The Astropy Collaboration et al., 2013, 2018), Matplotlib (Hunter, 2007), numpy (van der Walt et al., 2011; Harris et al., 2020), Python (Van Rossum & Drake, 2009), Scipy (Jones et al., 2011; Virtanen et al., 2020) and Aplpy (Robitaille & Bressert, 2012). We thank their developers for maintaining them and making them freely available.
Data Availability
All ALMA data presented in this paper is publicly available from the NRAO’s archive.
References
- Alcorn et al. (2023) Alcorn L. Y., et al., 2023, MNRAS,
- Allen et al. (2001) Allen S., Ettori S., Fabian A., 2001, MNRAS, 324, 877
- Allison et al. (2019) Allison J. R., et al., 2019, MNRAS, 482, 2934
- Augusto et al. (2006) Augusto P., Edge A. C., Chandler C. J., 2006, MNRAS, 367, 366
- Baek et al. (2022) Baek J., Chung A., Edge A., Rose T., Kim J.-W., Jung T., 2022, ApJ, 932, 64
- Baidoo et al. (2023) Baidoo L., Perley R. A., Eilek J., Smirnov O., Vacca V., Enßlin T., 2023, ApJ, 955, 16
- Benedetti et al. (2023) Benedetti J. P. V., et al., 2023, MNRAS, 522, 2570
- Bergin & Tafalla (2007) Bergin E. A., Tafalla M., 2007, ARA&A, 45, 339
- Bianchi et al. (2002) Bianchi S., Matt G., Fiore F., Fabian A. C., Iwasawa K., Nicastro F., 2002, A&A, 396, 793
- Böhringer et al. (2004) Böhringer H., et al., 2004, A&A, 425, 367
- Boizelle et al. (2021) Boizelle B. D., et al., 2021, ApJ, 908, 19
- Bolatto et al. (2003) Bolatto A. D., Leroy A., Israel F. P., Jackson J. M., 2003, ApJ, 595, 167
- Bolatto et al. (2013) Bolatto A. D., Wolfire M., Leroy A. K., 2013, ARA&A, 51, 207
- Buote et al. (2004) Buote D. A., Brighenti F., Mathews W. G., 2004, ApJ, 607, L91
- Burke-Spolaor et al. (2009) Burke-Spolaor S., Ekers R. D., Massardi M., Murphy T., Partridge B., Ricci R., Sadler E. M., 2009, MNRAS, 395, 504
- Choi et al. (2020) Choi H., Leighly K. M., Terndrup D. M., Gallagher S. C., Richards G. T., 2020, ApJ, 891, 53
- Combes & Gupta (2024) Combes F., Gupta N., 2024, A&A, 683, A20
- Crook et al. (2007) Crook A. C., Huchra J. P., Martimbeau N., Masters K. L., Jarrett T., Macri L. M., 2007, ApJ, 655, 790
- David et al. (2011) David L. P., et al., 2011, ApJ, 728, 162
- David et al. (2014) David L. P., et al., 2014, ApJ, 792, 94
- Edge et al. (1999) Edge A. C., Ivison R. J., Smail I., Blain A. W., Kneib J.-P., 1999, MNRAS, 306, 599
- Elmouttie et al. (1998) Elmouttie M., Krause M., Haynes R. F., Jones K. L., 1998, MNRAS, 300, 1119
- Emonts et al. (2024) Emonts B. H. C., et al., 2024, ApJ, 962, 187
- Esquej et al. (2014) Esquej P., et al., 2014, ApJ, 780, 86
- Fabian et al. (2022) Fabian A. C., Ferland G. J., Sanders J. S., McNamara B. R., Pinto C., Walker S. A., 2022, MNRAS, 515, 3336
- Ferrarese et al. (1996) Ferrarese L., Ford H. C., Jaffe W., 1996, ApJ, 470, 444
- Gaspari et al. (2011) Gaspari M., Melioli C., Brighenti F., D’Ercole A., 2011, MNRAS, 411, 349
- Gaspari et al. (2015) Gaspari M., Brighenti F., Temi P., 2015, A&A, 579, A62
- Gaspari et al. (2018) Gaspari M., et al., 2018, Astrophys. J., 854, 167
- Gastaldello et al. (2013) Gastaldello F., et al., 2013, Astrophys. J., 770, 56
- Gavazzi et al. (2004) Gavazzi G., Zaccardo A., Sanvito G., Boselli A., Bonfanti C., 2004, A&A, 417, 499
- Godard et al. (2010) Godard B., Falgarone E., Gerin M., Hily-Blant P., de Luca M., 2010, A&A, 520, A20
- Gong et al. (2016) Gong Y., et al., 2016, A&A, 588, A104
- Hamer et al. (2014) Hamer S. L., et al., 2014, MNRAS, 437, 862
- Hamer et al. (2016) Hamer S. L., et al., 2016, MNRAS, 460, 1758
- Harris et al. (2020) Harris C. R., et al., 2020, Nature, 585, 357
- Harrison et al. (2018) Harrison C. M., Costa T., Tadhunter C. N., Flütsch A., Kakkad D., Perna M., Vietri G., 2018, Nature Astronomy, 2, 198
- Hernández et al. (2008) Hernández H., Ghosh T., Salter C. J., Momjian E., 2008, in Minchin R., Momjian E., eds, American Institute of Physics Conference Series Vol. 1035, The Evolution of Galaxies Through the Neutral Hydrogen Window. pp 214–217, doi:10.1063/1.2973584
- Hogan (2014) Hogan M., 2014, http://etheses.dur.ac.uk/11008/1/hogan_thesis.pdf?DDD25+
- Hogan et al. (2015a) Hogan M. T., et al., 2015a, MNRAS, 453, 1201
- Hogan et al. (2015b) Hogan M. T., et al., 2015b, MNRAS, 453, 1223
- Hunter (2007) Hunter J. D., 2007, Comput. Sci. Eng., 9, 90
- Israel et al. (1990) Israel F. P., van Dishoeck E. F., Baas F., Koornneef J., Black J. H., de Graauw T., 1990, A&A, 227, 342
- Izumi et al. (2018) Izumi T., Wada K., Fukushige R., Hamamura S., Kohno K., 2018, ApJ, 867, 48
- Izumi et al. (2023) Izumi T., et al., 2023, Science, 382, 554
- Jaffe & McNamara (1994) Jaffe W., McNamara B. R., 1994, ApJ, 434, 110
- Johnson et al. (2010) Johnson R. E., Markevitch M., Wegner G. A., Jones C., Forman W. R., 2010, ApJ, 710, 1776
- Jones et al. (2011) Jones E., Oliphant T., Peterson P., 2011, SciPy Open Source Scientific Tools for Python, www.scipy.org
- Kameno et al. (2020) Kameno S., et al., 2020, ApJ, 895, 73
- Kameno et al. (2024) Kameno S., Harikane Y., Sawada-Satoh S., Sawada T., Saito T., Nakanishi K., Humphreys E., Impellizzeri C. M. V., 2024, arXiv e-prints, p. arXiv:2402.06166
- Laha et al. (2021) Laha S., Reynolds C. S., Reeves J., Kriss G., Guainazzi M., Smith R., Veilleux S., Proga D., 2021, Nature Astronomy, 5, 13
- Lane et al. (2004) Lane W. M., Clarke T. E., Taylor G. B., Perley R. A., Kassim N. E., 2004, AJ, 127, 48
- Lauer et al. (2005) Lauer T. R., et al., 2005, AJ, 129, 2138
- Mangum & Shirley (2015) Mangum J. G., Shirley Y. L., 2015, PASP, 127, 266
- Matsumoto et al. (2001) Matsumoto Y., Fukazawa Y., Nakazawa K., Iyomoto N., Makishima K., 2001, PASJ, 53, 475
- McMullin et al. (2007) McMullin J. P., Waters B., Schiebel D., Young W., Golap K., 2007, in Shaw R. A., Hill F., Bell D. J., eds, Astronomical Society of the Pacific Conference Series Vol. 376, Astronomical Data Analysis Software and Systems XVI. p. 127
- McNamara et al. (2000) McNamara B. R., et al., 2000, ApJ, 534, L135
- McNamara et al. (2001) McNamara B. R., et al., 2001, The Astrophysical Journal, 562, L149
- McNamara et al. (2016) McNamara B. R., Russell H. R., Nulsen P. E. J., Hogan M. T., Fabian A. C., Pulido F., Edge A. C., 2016, ApJ, 830, 79
- Morganti et al. (2023) Morganti R., et al., 2023, A&A, 678, A42
- Müller Sánchez et al. (2006) Müller Sánchez F., Davies R. I., Eisenhauer F., Tacconi L. J., Genzel R., Sternberg A., 2006, A&A, 454, 481
- Nagai et al. (2019) Nagai H., et al., 2019, ApJ, 883, 193
- Nakahara et al. (2020) Nakahara S., Doi A., Murata Y., Nakamura M., Hada K., Asada K., Sawada-Satoh S., Kameno S., 2020, AJ, 159, 14
- O’Dea et al. (1994) O’Dea C. P., Baum S. A., Maloney P. R., Tacconi L. J., Sparks W. B., 1994, ApJ, 422, 467
- Oka et al. (2011) Oka T., Nagai M., Kamegai K., Tanaka K., 2011, ApJ, 732, 120
- Olivares et al. (2019) Olivares V., et al., 2019, arXiv e-prints,
- Oosterloo et al. (2023) Oosterloo T., Morganti R., Murthy S., 2023, Nature Astronomy,
- Parikh et al. (2024) Parikh T., Saglia R., Thomas J., Mehrgan K., Bender R., Maraston C., 2024, arXiv e-prints, p. arXiv:2402.06628
- Parkin et al. (2012) Parkin T. J., et al., 2012, MNRAS, 422, 2291
- Pizzolato & Soker (2005) Pizzolato F., Soker N., 2005, ApJ, 632, 821
- Rickes et al. (2008) Rickes M. G., Pastoriza M. G., Bonatto C., 2008, MNRAS, 384, 1427
- Robitaille & Bressert (2012) Robitaille T., Bressert E., 2012, APLpy: Astronomical Plotting Library in Python, Astrophysics Source Code Library (ascl:1208.017)
- Roman-Duval et al. (2010) Roman-Duval J., Jackson J. M., Heyer M., Rathborne J., Simon R., 2010, ApJ, 723, 492
- Rose et al. (2019a) Rose T., et al., 2019a, MNRAS, 485, 229
- Rose et al. (2019b) Rose T., et al., 2019b, MNRAS, 489, 349
- Rose et al. (2020) Rose T., et al., 2020, MNRAS, 496, 364
- Rose et al. (2022) Rose T., et al., 2022, MNRAS, 509, 2869
- Rose et al. (2023) Rose T., et al., 2023, MNRAS, 518, 878
- Rose et al. (2024) Rose T., et al., 2024, MNRAS, 528, 3441
- Ruffa et al. (2019) Ruffa I., et al., 2019, MNRAS, 484, 4239
- Ruffa et al. (2023) Ruffa I., et al., 2023, MNRAS, 522, 6170
- Savini et al. (2019) Savini F., et al., 2019, A&A, 622, A24
- Sawada-Satoh et al. (2022) Sawada-Satoh S., Kameno S., Trippe S., 2022, A&A, 664, L11
- Schellenberger et al. (2020) Schellenberger G., et al., 2020, ApJ, 894, 72
- Singha et al. (2021) Singha M., O’Dea C. P., Gordon Y. A., Lawlor-Forsyth C., Baum S. A., 2021, ApJ, 918, 65
- Solanki et al. (2023) Solanki S., Ressler S. M., Murchikova L., Stone J. M., Morris M. R., 2023, ApJ, 953, 22
- Taylor (1996) Taylor G. B., 1996, ApJ, 470, 394
- Taylor et al. (1990) Taylor G. B., Perley R. A., Inoue M., Kato T., Tabara H., Aizu K., 1990, ApJ, 360, 41
- Temi et al. (2018) Temi P., Amblard A., Gitti M., Brighenti F., Gaspari M., Mathews W. G., David L., 2018, ApJ, 858, 17
- The Astropy Collaboration et al. (2013) The Astropy Collaboration et al., 2013, A&A, 558, A33
- The Astropy Collaboration et al. (2018) The Astropy Collaboration et al., 2018, AJ, 156, 123
- Tremblay et al. (2012) Tremblay G. R., et al., 2012, MNRAS, 424, 1042
- Tremblay et al. (2016) Tremblay G. R., et al., 2016, Nature, 534, 218
- Tremblay et al. (2018) Tremblay G. R., et al., 2018, ApJ, 865, 13
- Tully et al. (1998) Tully R. B., Pierce M. J., Huang J.-S., Saunders W., Verheijen M. A. W., Witchalls P. L., 1998, AJ, 115, 2264
- Tully et al. (2009) Tully R. B., Rizzi L., Shaya E. J., Courtois H. M., Makarov D. I., Jacobs B. A., 2009, AJ, 138, 323
- Ursini et al. (2023) Ursini F., et al., 2023, MNRAS, 519, 50
- Van Rossum & Drake (2009) Van Rossum G., Drake F. L., 2009, Python 3 Reference Manual. CreateSpace, Scotts Valley, CA
- Vantyghem et al. (2017) Vantyghem A. N., et al., 2017, ApJ, 848, 101
- Veilleux & Bland-Hawthorn (1997) Veilleux S., Bland-Hawthorn J., 1997, ApJ, 479, L105
- Virtanen et al. (2020) Virtanen P., et al., 2020, Nature Methods, 17, 261
- Vollmer et al. (2004) Vollmer B., Beckert T., Duschl W. J., 2004, A&A, 413, 949
- Wiklind & Combes (1996) Wiklind T., Combes F., 1996, Nature, 379, 139
- Wiklind & Combes (1997a) Wiklind T., Combes F., 1997a, A&A, 324, 51
- Wiklind & Combes (1997b) Wiklind T., Combes F., 1997b, A&A, 328, 48
- Wild et al. (1997) Wild W., Eckart A., Wiklind T., 1997, A&A, 322, 419
- Wise et al. (2007) Wise M. W., McNamara B. R., Nulsen P. E. J., Houck J. C., David L. P., 2007, Astrophys. J., 659, 1153
- Woo & Urry (2002) Woo J.-H., Urry C. M., 2002, ApJ, 579, 530
- de Vaucouleurs et al. (1991) de Vaucouleurs G., de Vaucouleurs A., Corwin Herold G. J., Buta R. J., Paturel G., Fouque P., 1991, Third Reference Catalogue of Bright Galaxies
- van Langevelde et al. (2000) van Langevelde H. J., Pihlström Y. M., Conway J. E., Jaffe W., Schilizzi R. T., 2000, A&A, 354, L45
- van der Walt et al. (2011) van der Walt S., Colbert S. C., Varoquaux G., 2011, Comput. Sci. Eng., 13, 22
Appendix A Individual source properties
Below we summarize some of the already known properties of our sample and discuss the molecular emission and absorption in the context of these properties. In many cases we reference molecular masses calculated in section 3.3.
A.1 NGC6868
A.1.1 Galaxy and environment
NGC6868 is a nearby elliptical and the brightest cluster galaxy of Abell S851. The central radio source has a flat spectrum with a core flux density of 105 mJy at 5 GHz (Hogan et al., 2015a). Rickes et al. (2008) find LINER emission from the galaxy centre due a combination of photoionization, a low-luminosity AGN, and shocks. Recently, Benedetti et al. (2023) have mapped the galaxy’s stellar populations using Gemini GMOS IFU. They find it to be dominated by old metal-rich stars, and suggest a historic merger as an explanation for spatially varying metallicity gradients. However, measurements by Parikh et al. (2024) suggest similar abundance gradients may be common and are not necessarily due to mergers.
A.1.2 Molecular emission
We find that NGC 6868 has of molecular gas, predominantly contained in a 0.5 kpc wide and slightly inclined disky structure. There is a very smooth velocity gradient, with the gas at one edge blueshifted to km/s and the other edge redshifted to km/s. The velocity dispersion is low at the extremes of the emission but is fairly high closer to the centre, reaching 70 km/s. There is also a wide tail of molecular emission on the blueshifted wing of the disk – roughly half as wide as the disky emission. This is of relatively low mass, but is nevertheless clearly detected. Energetic explanations for its origin such as a jet seem unlikely due to the very low velocity dispersion. The merger, suggested by (Benedetti et al., 2023) based on the galaxy’s spatially varying metallicity gradients, may be a more plausible explanation. If this is indeed the case, the close velocity match between the tail and disky structure suggests the gas has settled. Therefore, this purported merger likely occurred a significant time in the past.
A.1.3 Molecular and atomic absorption
CO(1-0) absorption was first detected against the radio core of NGC 6868 by Rose et al. (2019b). In CO(2-1), CN(2-1), HCN(2-1) and HCO+(2-1) we can now see the same absorption regions with higher sensitivity. The two groups of absorption features detected are close to the systemic velocity and appear to be fairly narrow. However, they are also composed of a set of several even narrower lines. The newly detected absorption profiles also have a very high peak optical depth, with the continuum being almost completely absorbed.
A.2 Abell S555
A.2.1 Galaxy and environment
The brightest cluster galaxy of Abell S555 lies at the centre of a poorly studied low X-ray luminosity cluster (Böhringer et al., 2004). Its strong central radio source is core dominated, and has a significant gamma-ray flux density. Powerful recent activity has been inferred in the galaxy centre due to its radio spectral energy distribution (Hogan et al., 2015a).
A.2.2 Molecular emission
We find that Abell S555 contains of molecular gas, distributed along a line of sight length of around 2.5 kpc, with a maximum width of around 0.7 kpc. It has a smooth velocity structure, with the extremes being blueshifted relative to the radio core by -100 km/s and -370 km/s. The emission is highly asymmetric and on the most blueshifted side is many times stronger. Interestingly, the more blueshifted side also has a low mass clump of emission at one edge, with a velocity matching that of the least blueshifted emission from the opposite side. Overall, the molecular emission has a bulk velocity -190 km/s offset from the stellar lines of the radio core, as measured by MUSE. Much of this emission is visible in the CO(1-0) spectrum of Figure 2. This is due to its relatively poor angular resolution, which only marginally resolves the emission. In CO(2-1), which has almost five times higher angular resolution, we can see that the continuum source is not spatially coincident with any of the molecular gas. The continuum source and supermassive black hole are therefore offset from the molecular gas in terms of both location and velocity. This indicates a past gravitational disturbance which has led to ram pressure forces stripping the AGN of its surrounding molecular gas.
A.2.3 Molecular and atomic absorption
H I absorption has been searched for against the radio core of Abell S555, providing an upper limit of (Hogan, 2014). A single CO(1-0) absorption feature was first detected in Abell S555 by Rose et al. (2019b). With our new observations we are able to re-detect this absorption, plus one new and slightly less redshifted feature at +190 km/s. Compared with the absorption detected in other systems, these lines are moderately wide. They are also km/s offset from any of the molecular emission, as well as being spatially offset. This suggests the absorbing clouds cannot be a part of the same population which are visible via the molecular emission.
A.3 Hydra-A
A.3.1 Galaxy and environment
Hydra-A is a giant elliptical galaxy with an edge-on disk of dust and molecular gas which lies at the centre of an X-ray bright cluster (Hamer et al., 2014). At 200 GHz, powerful radio lobes propagate 40 kpc to the north and south from the centre (Taylor et al., 1990), but at 1 GHz these extend to over 500 kpc in the north and 250 kpc in the south (Lane et al., 2004; Baidoo et al., 2023). The radio lobes are surrounded by cavities in the X-ray emitting gas of the intracluster medium created by repeated AGN outbursts (McNamara et al., 2000; Wise et al., 2007).
A.3.2 Molecular emission
Hydra-A has a edge-on molecular disk with a very smooth velocity gradient and a central velocity matching that of of the stellar absorption lines of the radio core (Rose et al., 2019a). Most of the disk has a velocity dispersion in the range of 30-50 km/s, and the two extreme edges are rotating at close to -400 and +400 km/s.
A.3.3 Molecular and atomic absorption
Hydra-A has by far the best studied intrinsic absorption detected in a brightest cluster galaxy. A total of 12 molecular clouds or groups of clouds with velocity dispersions as low as 0.7 km/s have been detected via 11 different molecular species (Rose et al., 2020). H I absorption has also been detected against the core of the galaxy with a peak optical depth of = 0.0015 (Taylor, 1996). Five of the tracers in which absorption has been detected are illustrated in Figure 3, and the rest can be seen in Rose et al. (2020). Interestingly, the velocities at which the absorption is found match those of the clouds observed through molecular emission. The absorption lines may therefore represent a subsample of the clouds visible in the disk’s emission (Rose et al., 2020).
A.4 Abell 2597
A.4.1 Galaxy and environment
The brightest cluster galaxy of Abell 2597 is a giant elliptical at the centre of a cool core. It is hosted by dense halo of hot and bright X-ray emitting plasma of megaparsec scales, within which are buoyantly rising cavities inflated by the radio jets and lobes of the central galaxy (McNamara et al., 2001). The gas cooling towards the central galaxy is fueling active star formation at a rate of year (Tremblay et al., 2012).
A.4.2 Molecular emission
A.4.3 Molecular and atomic absorption
Three CO(2-1) absorption lines have been detected against the bright and unresolved radio core (Tremblay et al., 2016). These have optical depths of and velocities of km/s, with their positive sign implying movement towards the galaxy centre along the line of sight. In HCN(2-1) and HCO+(2-1), we also detect some weaker absorption at velocities of around 120-200 km/s. In CO(2-1), all of the absorption features are fairly wide. However, in HCN(2-1) and HCO+(2-1), they become progressively wider and are blended together. In HI, they are much wider still and form into a single absorption feature almost 1000 km/s wide. Tremblay et al. (2018), suggest that the CO(2-1) emission and absorption do not overlap in terms of their velocity. However, the additional absorption we have found at 120-200 km/s does appear to match the more extreme redshifted edges of the emission. We also find some additional CO(2-1) absorption which overlaps with the emission.
A.5 Abell 2390
A.5.1 Galaxy and environment
The brightest cluster galaxy in Abell 2390 lies in an X-ray luminous galaxy cluster with a cooling rate of (Allen et al., 2001). The central continuum source has a flat light curve dating back to at least 2013, but recent activity is indicated by high angular resolution observations (Augusto et al., 2006; Rose et al., 2020). These show young, compact and self-absorbed jets, with half the flux coming from synchrotron emission and half from dust at 850 m (Edge et al., 1999; Augusto et al., 2006). Significantly older radio activity is indicated by X-ray cavities in the cluster’s hot atmosphere, as well as kpc wide radio lobes (Savini et al., 2019).
A.5.2 Molecular emission
Abell 2390 has a highly asymmetric plume of multiphase gas, which extends out to 15 kpc in CO and 25 kpc in H (Alcorn et al., 2023; Rose et al., 2024). This plume may have been driven by a jet and aided by jet inflated X-ray bubbles, or be a trail of gas stripped from the galaxy following a gravitational disturbance (Rose et al., 2024).
A.5.3 Molecular and atomic absorption
H I absorption has been detected against the radio core with (Hernández et al., 2008; Hogan, 2014). CO(1-0) absorption was first detected by (Rose et al., 2019b), to which we now add CO(2-1), HCN(2-1) and HCO+(2-1) absorption. Across all molecules, the absorption profile is extremely broad and contains two overlapping components. There are no hints of any narrow sub-features, as in e.g. Centaurus-A and Hydra-A. As well as being broad, the absorption is at or close to saturation in HCN(2-1) and HCO+(2-1). Although the absorption is entirely redshifted, we also see CO(2-1) emission with matching velocities along the line of sight to the radio core. However, this may be due to the observation’s wide beam encapsulating emission from far beyond the radio core.
A.6 RXCJ0439.0+0520
A.6.1 Galaxy and environment
The brightest cluster galaxy of RXCJ0439.0+0520 is not as well studied as most of this sample, but is known to have a high H luminosity of erg s-1 detected by the VIsible Multi Object Spectrograph (VIMOS) of the Very Large Telescope (VLT) (Hamer et al., 2016). The central continuum source’s light curve has also shown significant variability in the past, but has been relatively constant between 2010 and 2022 (Hogan et al., 2015b; Rose et al., 2022).
A.6.2 Molecular emission
In RXCJ0439.0+0520 we find of molecular gas, the bulk of which is in a marginally resolved clump centred on the radio core. The remaining gas lies along a 2 kpc wide and 10 kpc long plume. Much of this plume is only weakly detected and it is hard to constrain its velocity. However, a central bright region in the plume appears to have a very similar velocity to the gas centred on the continuum source. This implies the elongation of the plume is almost perpendicular to our line of sight. Without GHz frequency radio observations, it is not possible to determine whether or not previous radio activity may have been responsible for the plume. However, the low velocity dispersion suggests this explanation is unlikely. As in Abell 2390, ram pressure forces due to a past gravitational disturbance are the most plausible alternative explanation.
A.6.3 Molecular and atomic absorption
CO(1-0) and CN(1-0) absorption has previously been detected against the continuum by Rose et al. (2019b), but H I absorption has not been found (with an upper limit of Hogan, 2014). The molecular absorption previously detected is wide and very close the the systemic velocity. However, with CO(2-1), CN(2-1), HCN(2-1) and HCO+(2-1), we now detect a second absorption feature. This is similarly wide, but is redshifted to 550 km/s. Interestingly, this is more strongly detected than the 0 km/s feature in all of these molecules, despite its absence from the CO(1-0) spectrum. The emission coincident with the radio core is only weakly detected, but has a large velocity width. This overlaps with the 0 km/s feature, but due to the noise of the spectrum it is difficult to be certain whether or not it overlaps with the 550 km/s feature.
A.7 Abell 1644
A.7.1 Galaxy and environment
The brightest cluster galaxy of Abell 1644 is a complex system at the centre of the brighter of two X-ray peaks in its gravitationally disturbed host cluster (Johnson et al., 2010). In recent years the central radio source has been highly variable, with its 15 GHz flux increasing from around 160 mJy in early 2018 to around 240 mJy in early 2021 (Rose et al., 2022).
A.7.2 Molecular emission
Abell 1644’s molecular emission has previously been detected in CO(1-0), but in CO(2-1) we are now able to see it with much higher angular resolution and sensitivity. Based on CO(1-0) emission, Baek et al. (2022) identify clumps of molecular gas in an arc along the sloshing patterns detected in X-ray emission. With our CO(2-1) observations, we are able to re-detect all but the farthest of these clumps at higher angular resolution. As such we now deconvolve what appeared to be a single, rotating structure centred close to the continuum source. The CO(2-1) maps in Figure 7 now reveal a dearth of molecular gas coincident with the continuum. Instead, the gas is separated into multiple components 1 – 2 kpc from the continuum. One component is compact, has a comparatively high velocity dispersion and is marginally redshifted relative to the stellar absorption lines of the core. Another is disky, approximately 4 kpc long, has a central velocity of -140 km/s and a velocity change of 100 km/s. The velocities of these two central components are more extreme than the red and blueshifted clumps which lie several kpc further from the radio continuum source. They are also separated by a third, weaker region of molecular emission.
A.7.3 Molecular absorption
CO(1-0) and CN(1-0) absorption has been detected against the central radio continuum source (Rose et al., 2019b; Baek et al., 2022). Our new observations of CO(2-1), CN(2-1), CS(5-4), HCN(2-1) and HCO+(2-1) detect the absorption to much higher significance and show multiple new features. Some of these are sub-components of the absorption previously detected, while others are at neighbouring velocities. Generally these absorption components are of moderate width and centred at the systemic velocity. However, we also find a weak but very wide absorption feature centred at 150 km/s. Our high sensitivity and high angular resolution CO(2-1) observations show that there is little or no molecular gas along the line of sight to the continuum source. We can therefore be confident that the clouds responsible for the absorption in Abell 1644 are not a subsample of those which we see in emission elsewhere in the galaxy.
A.8 Circinus
A.8.1 Galaxy and environment
Circinus is one of the closest known active galaxies, at a distance of Mpc and a redshift of 0.0015 (Tully et al., 2009). In the X-ray, it is the brightest known Compton-thick Seyfert 2 galaxy (Bianchi et al., 2002). On one side, Circinus has kiloparsec scale outflowing gas seen in H and [O III] emission lines (Veilleux & Bland-Hawthorn, 1997; Müller Sánchez et al., 2006). In the central 100 pc, Esquej et al. (2014) find a star formation rate of approximately 0.1 M⊙/yr, with the total for the galaxy estimated at a few M⊙/yr (Elmouttie et al., 1998).
A.8.2 Molecular emission
Izumi et al. (2023) have presented HCN(3-2) emission which reveals a roughly 3 pc wide circumnuclear disk. On a larger scale and width CO(3-2), Circinus is found to contain spiral arms rich in molecular gas which are inclined at an angle of , but they do not pass through our line of sight to the continuum. Absorption is therefore unlikely to arise from this large scale distribution of gas.
A.8.3 Molecular absorption
Circinus contains CO(3-2), HCN(4-3), HCO+(3-2) and HCO+(4-3) absorption (Izumi et al., 2023). Although the HCO+(4-3) absorption is near saturated, the HCO+(3-2) spectrum is the most sensitive. Here, two absorption features are present at 5 and 60 km/s. We also identify a third, weaker absorption feature at 420 km/s. Each of the molecular species in Figure 8 also contains strong emission, suggesting the gas of the circumnuclear disk is very dense. Excluding the 420 km/s feature, the velocity of the absorbing gas is at or close to the peak of the emission of the wider circumnuclear disk in each species.
A.9 NGC 4261
A.9.1 Galaxy and environment
NGC 4261 is an elliptical in the Virgo cluster with among the brightest radio fluxes of low redshift (z, Gavazzi et al., 2004) FR I radio galaxies ( 19 Jy at 1.4 GHz, 205 mJy at 300 GHz). The axis of its radio jets is closely aligned with a 200 pc wide disky structure of dust and molecular gas traced with CO, HCN and HCO+ (Jaffe & McNamara, 1994; Boizelle et al., 2021; Sawada-Satoh et al., 2022; Ruffa et al., 2023). In the innermost regions, H2O megamaser emission is reported by Sawada-Satoh et al. (2022). Ruffa et al. (2023) determine the presence of a supermassive black hole.
A.9.2 Molecular emission
From CO(2-1) emission, we estimate a molecular mass of . Accurate dimensions of NGC 4261’s molecular disk are harder to determine than for the dust disk (Ferrarese et al., 1996), so its inclination is uncertain. In the CO(2-1) flux map (Figure 9), the disc is roughly circular, implying it is close to face-on. However, with emission (see its velocity map), the disk appears more elongated. Nevertheless, its width of only 150 pc means it cannot be considered a galaxy scale disk
A.9.3 Molecular and atomic absorption
Absorption features redshifted by 60 km/s have been seen against the central continuum in CO(1-0) and HI Jaffe & McNamara (1994); van Langevelde et al. (2000). From archival observations, we also find serendipitous detections of HCN(4-3) and HCO+(4-3) absorption. The spectra are noisy, but appear to contain two slightly redshifted and overlapping absorption features.
A.10 NGC 5044
A.10.1 Galaxy and environment
NGC 5044 is an elliptical brightest group galaxy at the centre of a moderate cooling flow, and hosts a substantial mass of multiphase gas (David et al., 2011). Surrounding the galaxy are numerous cavities and X-ray filaments which have been inflated by the AGN (Buote et al., 2004; David et al., 2011; Gastaldello et al., 2013). Among galaxy groups, NGC 5044’s has the brightest known H[NII] filaments (David et al., 2014).
A.10.2 Molecular emission
CO(2-1) observations imply a molecular gas mass of , off-centre from the continuum source (Temi et al., 2018; Schellenberger et al., 2020). Much higher angular resolution CO(1-0) observations presented by Rose et al. (2023) appear to show a lack of molecular gas along the line of sight to the radio core. Instead, the gas appears to be within one or two clumps approximately 0.5 kpc away.
A.10.3 Molecular absorption
CO(2-1) absorption in NGC 5044 was first reported by David et al. (2014). We are able to re-detect the same absorption feature in HCN(2-1) and HCO+(2-1). The absorption is much wider than is detected in many of the disky sources such as Centaurus-A and Hydra-A, but is also narrower than in some systems such as Abell 2390 and Abell 2597. None of the galaxy’s molecular emission is spatially coincident with the absorption, suggesting they are not caused by the same cloud population.
A.11 NGC 1052
A.11.1 Galaxy and environment
NGC1052 contains a low-luminosity AGN with faint X-ray emission (Woo & Urry, 2002). Despite the AGN’s low luminosity, it has produced radio jets on pc to kpc scales which suggest recent and historic accretion (Nakahara et al., 2020). Kameno et al. (2024) have reported sub-pc scale observations of 321 GHz H2O emission, indicating water masers incredibly close to the supermassive black hole’s event horizon, but with remarkably similar dynamics to the molecular absorption.
A.11.2 Molecular emission
High angular resolution ALMA observations presented by Kameno et al. (2020) show CO emission from a rotating ring-like circumnuclear disk with a molecular mass of .
A.11.3 Molecular absorption
Kameno et al. (2020) also show a rich set of absorption features detected against the radio continuum source, including CO, HCN, HCO+, SO, SO2, CS and CN. Wide absorption lines are present from approximately -200 to 200 km/s, with the redshifted absorption being stronger.
A.12 IC 4296
A.12.1 Galaxy and environment
IC 4296 is an elliptical galaxy and the brightest cluster galaxy of Abell 3565. It hosts the FRI radio source PKS 1333-33, contains a nuclear dust disk and has a large-scale, double-sided jet that extends up to 77 kpc from the nucleus (Lauer et al., 2005; Burke-Spolaor et al., 2009). The inner jet is unresolved at 230 GHz but faint emission is detected at a distance of 950 pc North-West of the nucleus (Ruffa et al., 2019).
A.12.2 Molecular emission
IC 4296 has disky CO(2-1) emission with a mass of 2.3. The velocity field shows an s-shaped zero-velocity contour, suggesting the presence of a warp in the disk (Ruffa et al., 2019).
A.12.3 Molecular absorption
Against the radio core there is a narrow CO(2-1) absorption feature with a velocity closely matching that of the galaxy and its molecular emission (Ruffa et al., 2019).