MedMamba: Vision Mamba for Medical Image Classification
Abstract
Medical image classification is a very fundamental and crucial task in the field of computer vision. These years, CNN-based and Transformer-based models have been widely used to classify various medical images. Unfortunately, The limitation of CNNs in long-range modeling capabilities prevents them from effectively extracting features in medical images, while Transformers are hampered by their quadratic computational complexity. Recent research has shown that the state space model (SSM) represented by Mamba can efficiently model long-range interactions while maintaining linear computational complexity. Inspired by this, we propose Vision Mamba for medical image classification (MedMamba). More specifically, we introduce a novel SS-Conv-SSM module. SS-Conv-SSM combines the local feature extraction ability of convolutional layers with the ability of SSM to capture long-range dependency, thereby modeling medical images with different modalities. To demonstrate the potential of MedMamba, we conducted extensive experiments using 14 publicly available medical datasets with different imaging techniques and two private datasets built by ourselves. Extensive experimental results demonstrate that the proposed MedMamba performs well in detecting lesions in various medical images. To the best of our knowledge, this is the first Vision Mamba tailored for medical image classification. The purpose of this work is to establish a new baseline for medical image classification tasks and provide valuable insights for the future development of more efficient and effective SSM-based artificial intelligence algorithms and application systems in the medical. Source code has been available at https://github.com/YubiaoYue/MedMamba.
Keywords Medical Images Image Classification Deep Learning State Space Models Transformers
1 Introduction
Modern medical research is inseparable from the support of various medical images[1]. Medical images are designed to provide accurate visual representation of the structure and function of various tissues and organs of the human body, to assist medical professionals and scientific researchers in conducting detailed exploration of normal and abnormal conditions in patients’ bodies, thereby serving clinical and research purposes. Purpose. Today, both cutting-edge medical research in laboratories and disease diagnosis by clinicians rely heavily on the rich information provided by medical image analysis to facilitate scientific inference and diagnosis[2, 3].
With the continuous development of medical technology, various medical imaging methods have emerged. In clinical settings, the most widely used medical imaging techniques include computed tomography (CT), ultrasound (US), X-rays, endoscopic imaging, and magnetic resonance imaging (MRI), among others. Unfortunately, the accuracy of detection and diagnosis for cancer and/or many other diseases depends on the professional knowledge of individual clinicians (such as radiologists and pathologists), which leads to significant differences in the way clinicians read and interpret medical images. In order to address and overcome this clinical challenge, many computer-aided detection and diagnosis (CAD) solutions have been developed and tested, aimed at helping clinical doctors more effectively read medical images and make diagnostic decisions in a more accurate and objective manner[4].
Numerous studies and applications have shown that deep learning has great potential in image processing, making it a mainstream technology in the field of CAD and is widely used in medical image classification, medical image segmentation, and medical target detection[5]. It is worth noting that in the clinical diagnosis process, accurately classifying various medical images is the most basic and extremely important task among many tasks[6, 7, 8], because image classification is an important part of patient diagnosis and image labels for classification tasks are easier to obtain. In addition, from the perspective of various algorithms and applications of deep learning, more advanced tasks, such as semantic segmentation, target detection, image generation, and image reconstruction, often directly rely on various data sets (such as the natural image data set ImageNet) Well-designed classification model. These classification models are used to act as backbones, encoders, and decoders in various model architectures for efficient feature extraction from image inputs[9, 10, 11].
A large number of studies have shown that classification models based on CNN and Transformer exhibit excellent performance in various medical image classification tasks and are widely used in various healthcare applications[12, 13, 14, 15, 16]. However, both CNN-based models and Transformer-based models have inherent limitations. CNN-based models are limited by local receptive fields, which greatly hinders their ability to capture long-range information[17, 18]. This often results in insufficient feature extraction, resulting in suboptimal classification results. Although the Transformer-based model shows excellent performance in global modeling, the self-attention mechanism requires quadratic complexity in terms of image size, resulting in a high computational burden, making the model unable to be applied to applications that require dense detection tasks (such as segmentation and reconstruction) and various practical scenarios.
Based on these facts, we are forced to develop a novel medical image classification architecture capable of capturing long-range information effectively and maintaining linear computational complexity. Recently, state space models (SSM) have attracted great interest from researchers. Building on classical SSM research [19], modern SSMs such as Mamba not only establish long-distance dependencies but also exhibit linear complexity related to input size. In addition, SSM-based models have been extensively studied in many fields, including language understanding[20, 21], general vision [18, 22], medical segmentation[23, 24], etc. In particular, some studies have utilized SSM to perform various image processing tasks, such as natural image classification and medical image segmentation. However, to the best of our knowledge, the performance of SSM-based medical image classification models remains to be explored.
Influenced by the success of VMamba [22] in natural image classification tasks, we propose MedMamba for the first time, a simple model based on modern SSM, aiming to demonstrate the potential of Mamba in various medical image classification tasks. Specifically, the core of MedMamba is composed of a module called SS-Conv-SSM. Unlike natural images, there is a high degree of similarity between various medical images, so the model is required to be able to effectively extract both fine-grained features and coarse-grained features. Based on this basic fact, SS-Conv-SSM uses both the local feature extraction ability of the convolutional layer and the long-range modeling ability of SSM to achieve the effective extraction of coarse and fine-grained features in medical images and accurate image classification. Comprehensive experiments were conducted on five medical datasets acquired by different imaging techniques to demonstrate the potential of MedMamba modules in medical image classification. Specifically, we conduct extensive experiments on three public datasets and two private datasets, and the results show that MedMamba can achieve competitive performance.
The main contributions of this article can be summarized as follows: 1) We propose MedMamba, marking the first exploration of the potential application of SSM based models in medical images with different modalities. 2) A comprehensive experiment was conducted on five datasets, and the results showed that MedMamba demonstrated considerable competitiveness. 3) We establish a new baseline for medical image classification tasks and provide valuable insights for the future development of more efficient and effective SSM based artificial intelligence algorithms and application systems in medicine.
2 Methods
2.1 Preliminaries
Among modern SSM-based models, namely the Structured State Space Sequence Model (S4) and Mamba[20, 24, 22], both rely on classical continuous systems that map one-dimensional input functions or sequences, denoted as , through intermediate implicit states to an output . The aforementioned process can be represented as a linear Ordinary Differential Equation (ODE):
| (1) | ||||
where represents the state matrix, while and denote the projection parameters.
S4 and Mamba discretize this continuous system to make it more suitable for deep learning scenarios. Specifically, they introduce a timescale parameter and transform and into discrete parameters and using a fixed discretization rule. Typically, the zero-order hold (ZOH) is employed as the discretization rule and can be defined as follows:
| (2) | ||||
After discretization, SSM-based models can be computed in two ways: linear recurrence or global convolution, defined as equations 3 and 4, respectively.
| (3) | ||||
| (4) | ||||
where represents a structured convolutional kernel, and denotes the length of the input sequence .
2.2 MedMamba
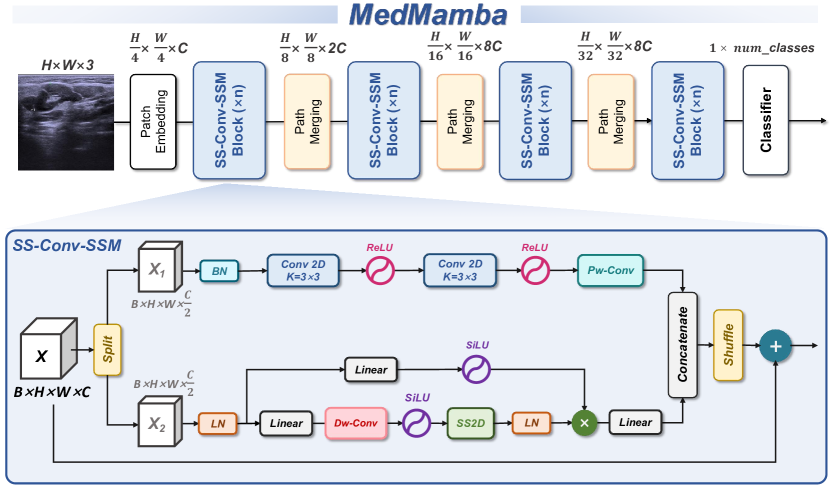
As shown in Figure 1, the overall architecture of MedMamba is shown. Specifically, the structure of MedMamba is very simple, including only the patch embedding layer, SS-Conv-SSM Block and patch merging layer.
In the MedMamba, a Patch Embedding layer firstly divides the input image into non-overlapping patches of size , thereby mapping the dimensions of the image to (Here, the default values of is set to 96), resulting in an embedded image . Subsequently, The is normalized by using a Layer Normalization [25] before feeding it into the backbone of MedMamba. The backbone is composed of four stages. It should be noted that patch merging layers are used after the output of the first three stages to reduce the height and width of input features, while increasing the number of channels. We use [2, 2, 4, 2] SS-Conv-SSM blocks in four stages, with each stage having [C, 2C, 4C, 8C] channels.
2.2.1 2D-selective-scan
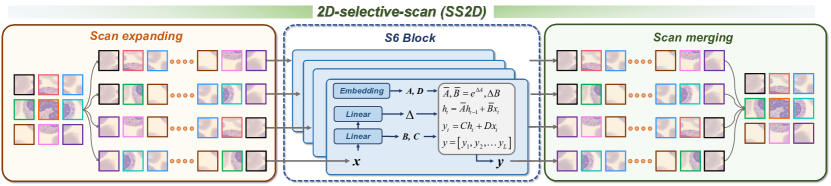
We first describe the 2D-selective-scan (SS2D) proposed by the VMamba [22], which is the core of SS-Conv-SSM Block. The SS2D consists of three components: a scan expanding operation, an S6 block, and a scan merging operation. As shown in Figure 2, the scan expanding operation unfolds the input image along four different directions (top-left to bottom-right, bottom-right to top-left, top-right to bottom-left, and bottom-left to top-right) into sequences. These sequences are then processed by the S6 block for feature extraction, ensuring that information from various directions is thoroughly scanned, thus capturing diverse features. Subsequently, as illustrated in Figure 2, the scan merging operation sums and merges the sequences from the four directions, restoring the output image to the same size as the input. The S6 block, derived from Mamba [20], introduces a selective mechanism on top of S4 [26] by adjusting the SSM’s parameters based on the input. This enables the model to distinguish and retain pertinent information while filtering out the irrelevant. The pseudo-code for the S6 block is presented in Algorithm 1.
2.2.2 SS-Conv-SSM Block
SS-Conv-SSM Block is the core module of MedMamba, as shown in Figure 1. Overall, SS-Conv-SSM is a straightforward dual-branch module. There aren’t many fancy tricks in SS-Conv-SSM Block. Firstly, the channel splitting operation is used to split the module input into two sub inputs with the same size. Next, the two sub inputs are fed into two branch (i.e., Conv-branch and SSM-branch)modules, respectively. In the Conv-branch, we simply use continuous convolutional layers to model the local features of the input. In the SSM-branch, we first utilize the layer Normalization layer to process the input. It is worth noting that the input is divided into two branches after passing through Layer Normalization. In the first branch of SSM, the input passes through a linear layer and an activation function. In the second branch of SSM-branch, the input is fed into the 2D Selective Scan module (SS2D) [22] for further feature extraction after passing through a linear layer, depthwise separable convolution, and activation function. Then, Layer Normalization is used to normalize the features and multiply them element by element with the output of the first branch, merging the two branches. Finally, a linear layer is used for feature mixing, and obtain the output of SSM-branch. At the end of the SS-Conv-SSM block, we merge the outputs of two branches along the channel dimension of the feature map and use a lightweight operation without parameters, i.e.,channel shuffle operation to facilitate information interaction between channels of two sub inputs. It is worth noting that the activation functions in the SSM-branch and Conv-branch default to SiLU and ReLU, respectively[27, 28].
3 Experiments and results
In this section, we conduct comprehensive experiments on MedMamba for various medical images classfication tasks. Specifically, we evaluate the performance of MedMamba three public medical datasets and two private datasets.
3.1 Datasets
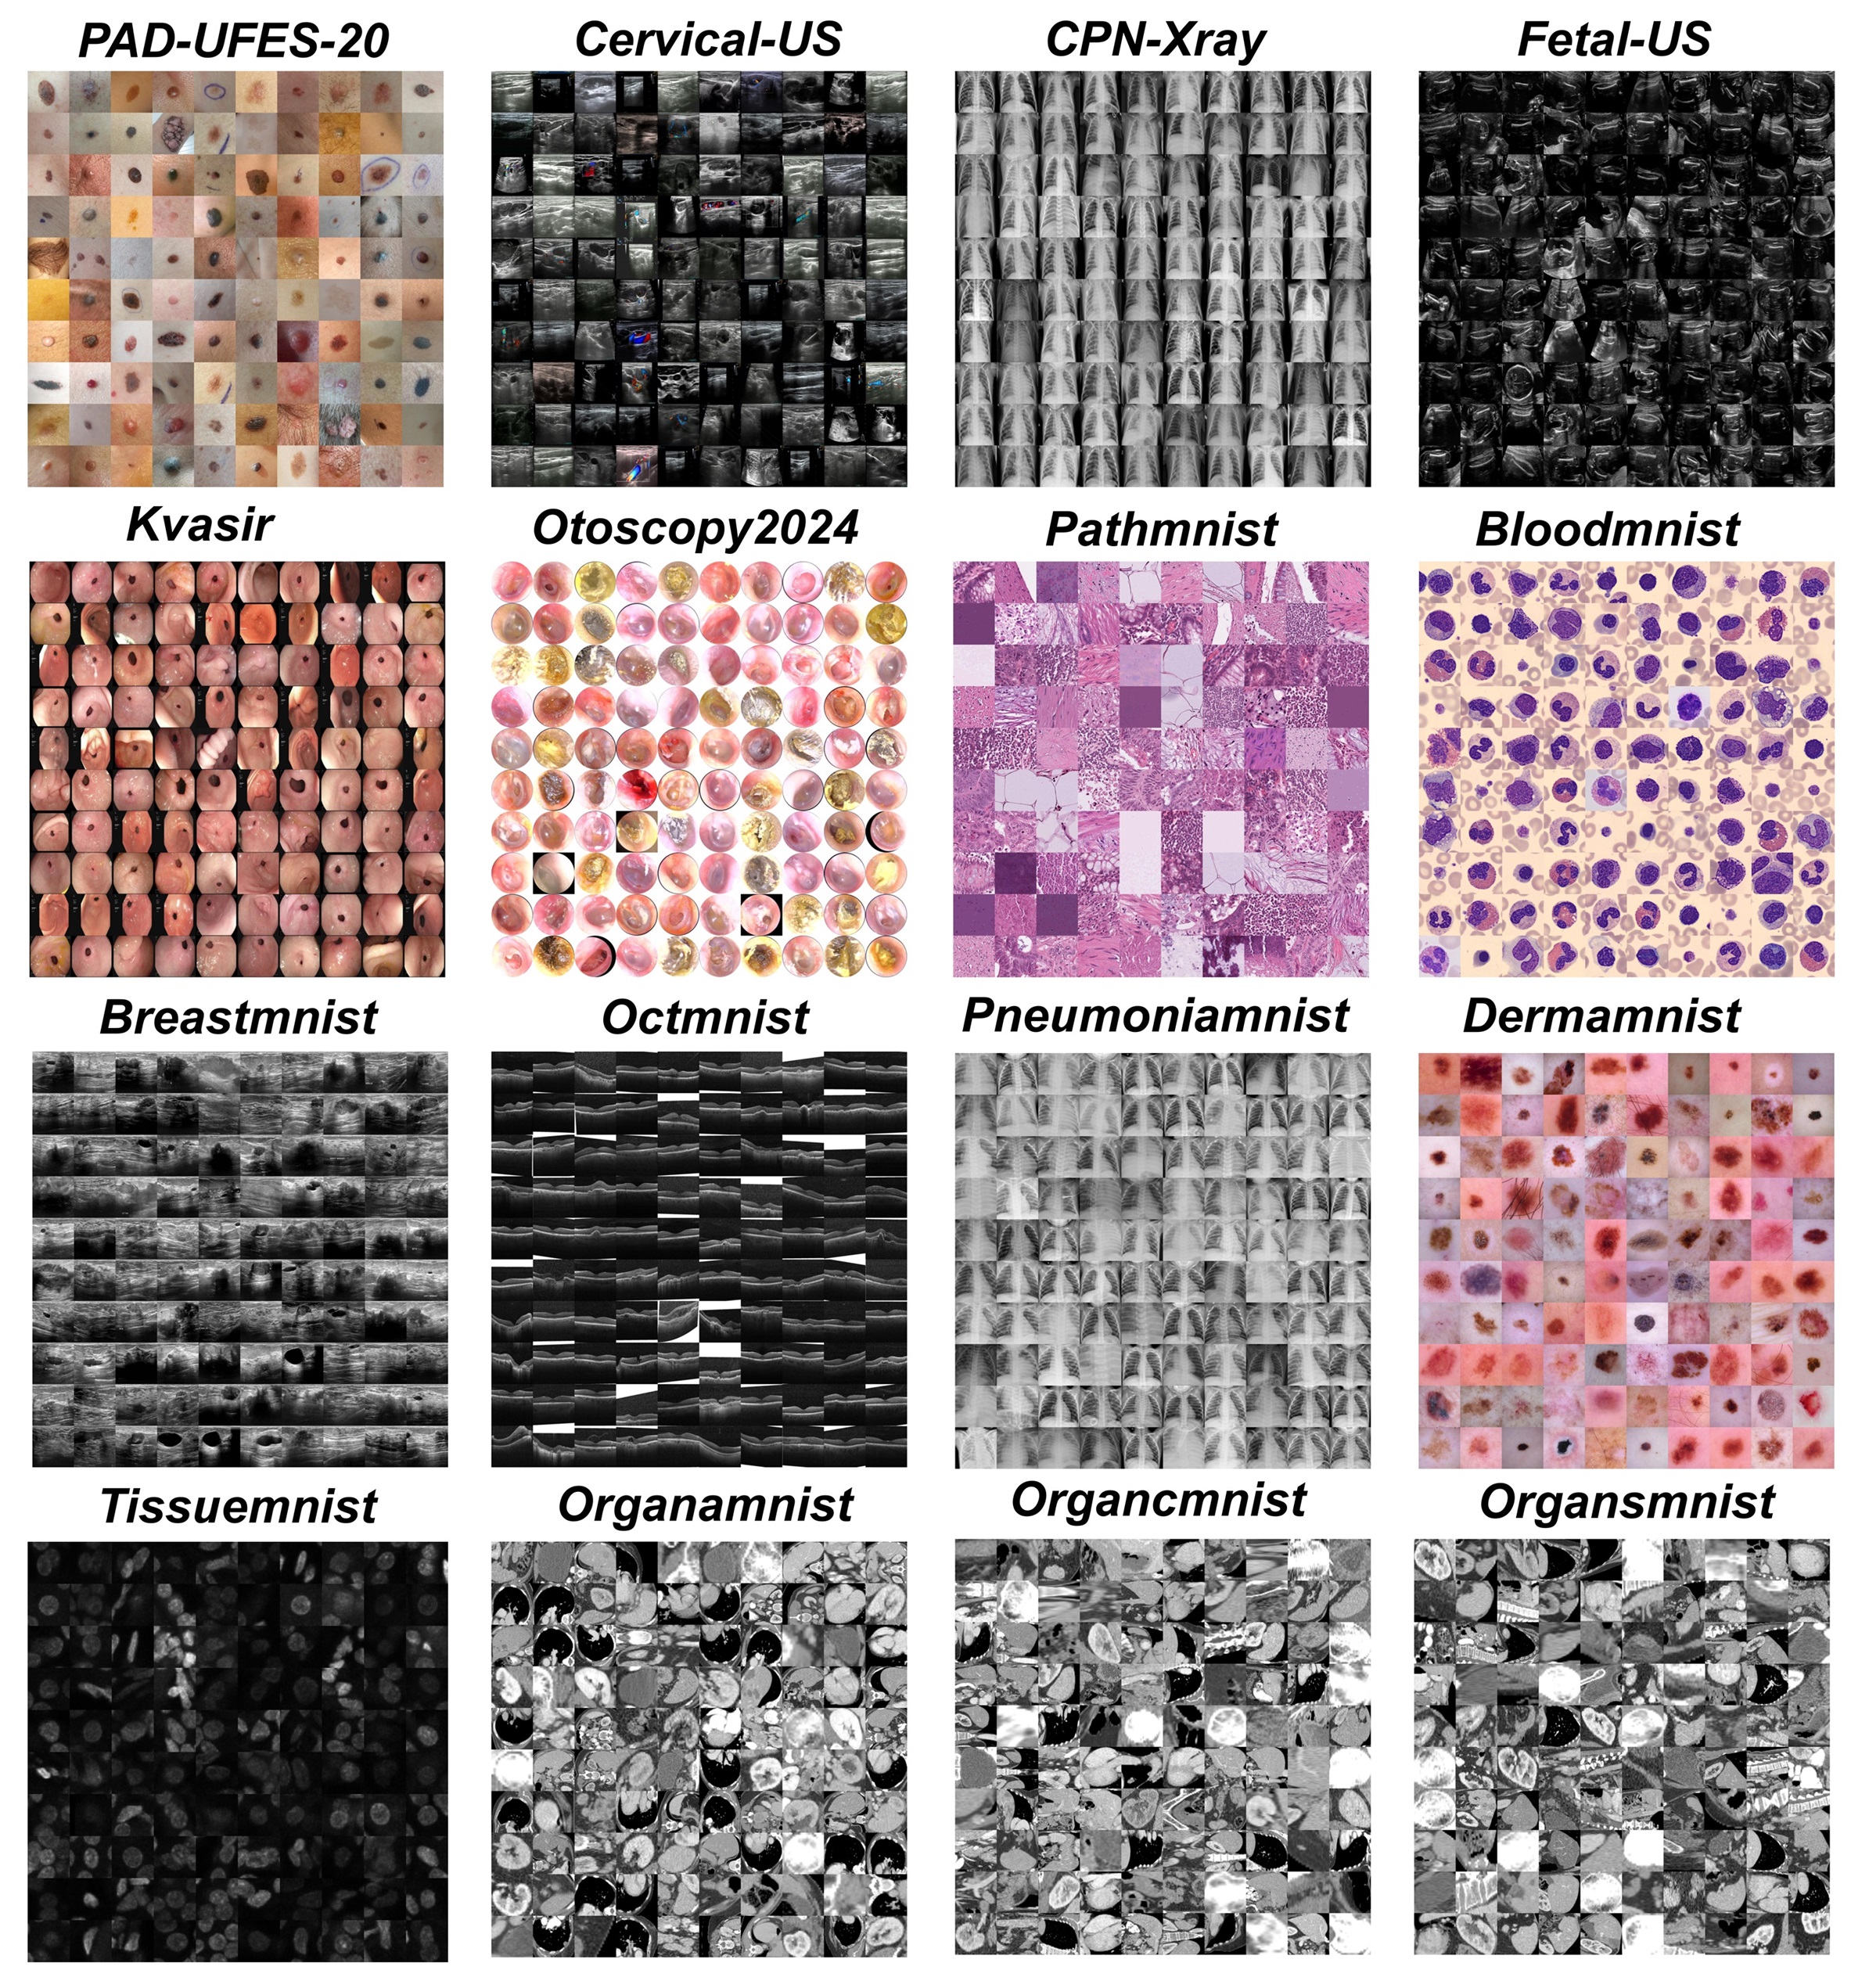
PAD-UFES-20. The PAD-UFES-20 dataset was collected along with the Dermatological and Surgical Assistance Program (in Portuguese: Programa de Assistência Dermatológica e Cirurgica - PAD) at the Federal University of Espírito Santo (UFES-Brazil), which is a nonprofit program that provides free skin lesion treatment, in particular, to low-income people who cannot afford private treatment. The dataset consists of 2,298 samples of six different types of skin lesions. Each sample consists of a clinical image and up to 22 clinical features including the patient’s age, skin lesion location, Fitzpatrick skin type, and skin lesion diameter. The skin lesions are: Basal Cell Carcinoma (BCC), Squamous Cell Carcinoma (SCC), Actinic Keratosis (ACK), Seborrheic Keratosis (SEK), Bowen’s disease (BOD), Melanoma (MEL), and Nevus (NEV). As the Bowen’s disease is considered SCC in situ, we clustered them together, which results in six skin lesions in the dataset, three skin cancers (BCC, MEL, and SCC) and three skin disease (ACK, NEV, and SEK). The images present in the dataset have different sizes because they are collected using different smartphone devices. All images are available in .png format. In total, there are 1,373 patients, 1,641 skin lesions, and 2,298 images present in the dataset. Each image/sample has a reference to the patient and the skin lesion in the metadata (dataset url: https://data.mendeley.com/datasets/zr7vgbcyr2/1).
Cervical lymph node lesion ultrasound images (Abbreviated as Cervical-US). Cervical-US is a private dataset containing 3392 cervical lymph node ultrasound images. Specifically, these images were obtained from 480 patients in the Ultrasound Department of the Second Affiliated Hospital of Guangzhou Medical University. The entire dataset is divided into four categories by clinical experts based on pathological biopsy results: normal lymph nodes (referred to as normal), benign lymph nodes (referred to as benign), malignant primary lymph nodes (referred to as primary), and malignant metastatic lymph nodes (referred to as metastatic). The number of normal, benign, primary and metastatic images are 1217, 601, 236 and 1338 respectively.
FETAL_PLANES_DB[29] (Abbreviated as Fetal-US). A large dataset of routinely acquired maternal-fetal screening ultrasound images collected from two different hospitals by several operators and ultrasound machines. All images were manually labeled by an expert maternal fetal clinician. Images are divided into 6 classes: four of the most widely used fetal anatomical planes (Abdomen, Brain, Femur and Thorax), the mother’s cervix (widely used for prematurity screening) and a general category to include any other less common image plane. Fetal brain images are further categorized into the 3 most common fetal brain planes (Trans-thalamic, Trans-cerebellum, Trans-ventricular) to judge fine grain categorization performance. Based on FETAL’s metadata, we categorize it into six categories. The number of images for each category is as follows: Fetal abdomen (711 images), Fetal brain (3092 images), Fetal femur (1040 images), Fetal thorax (1718 images), Maternal cervis (1626 images), and Other (4213 images) (dataset url: https://zenodo.org/records/3904280).
Covid19-Pneumonia-Normal Chest X-Ray Images[30, 31] (Abbreviated as CPN-Xray). Shastri et al collected a large number of publicly available and domain recognized X-ray images from the Internet, resulting in CPN-Xray. The CPN-Xray dataset is divided into 3 categories, namely COVID, NORMAL and PNEUMONIA. All images are preprocessed and resized to 256x256 in PNG format. It helps the researcher and medical community to detect and classify COVID19 and Pneumonia from Chest X-Ray Images using Deep Learning (dataset url: https://data.mendeley.com/datasets/dvntn9yhd2/1).
Kavsir Dataset[32]. The dataset is collected using endoscopic equipment at Vestre Viken Health Trust (VV) in Norway. The VV consists of 4 hospitals and provides health care to 470,000 people. The Kvasir dataset consists of images, annotated and verified by medical doctors (experienced endoscopists), including several classes showing anatomical landmarks, phatological findings or endoscopic procedures in the GI tract, i.e., hundreds of images for each class. The number of images is sufficient to be used for different tasks, e.g., image retrieval, machine learning, deep learning and transfer learning, etc. The anatomical landmarks include Z-line, pylorus, cecum, etc., while the pathological finding includes esophagitis, polyps, ulcerative colitis, etc. In addition, several set of images related to removal of lesions is also provided, e.g., "dyed and lifted polyp", the "dyed resection margins", etc. The dataset consist of the images with different resolution from 720x576 up to 1920x1072 pixels. Overall, the dataset is divided into the following eight categories: dyed-lifted-polyps (500 images), dyed-resection-margins (500 images), esophagitis (500 images), normal-cecum (500 images), normal-pylorus (500 images), normal-z-line (500 images), polyps (500 images), and ulcerative-colitis (500 images) (dataset url: https://www.kaggle.com/datasets/yasserhessein/the-kvasir-dataset/data).
Large-scale otoscopy dataset [33] (Abbreviated as Otoscopy2024). This dataset is a supplement to previous work. In previous publications, we collected 20542 endoscopic images of ear infections. On this basis, we have added an additional 2039 images from medical institutions. We will name 22581 endoscopic images of the ear as Otoscopy2024. Otoscopy2024 is a large dataset specifically designed for ear disease classification, consisting of 9 categories: Cholestestoma of middle ear(548 images), Chronic suppurative otitis media(4021 images), External auditory cana bleeding (451 images), Impacted cerumen (6058 images), Normal eardrum (4685 images), Otomycosis external (2507 images), Secretory otitis media (2720 images), Tympanic membrane calcification (1152 images), Acute otitis media (439 images).
Medmnist2D. MedMNIST2D datasets include a set of 12 pre-processed datasets that include CT, X-ray, ultrasound and OCT images. These datasets are used in various classification tasks including multi-label, ordinal, multi-class, regression, and binary. The size of the data in this collection varies from at least 100 to more than 100,000. Due to the focus of this work on medical image classification, 10 datasets from Medmnist were selected. As shown in Table 1, the diversity of these datasets has created a favorable criterion for classification tasks. The pre-processing and split of the datasets into training, validation and test subsets have been done according to [34, 35] (dataset url: https://medmnist.com/).
| Name | Data Modality | Task (# Classes / Labels) | # Samples | # Training / Validation / Test |
|---|---|---|---|---|
| MedMNIST2D | ||||
| PathMNIST | Colon Pathology | MC (9) | 107,180 | 89,996 / 10,004 / 7,180 |
| OCTMNIST | Retinal OCT | MC (4) | 109,309 | 97,477 / 10,832 / 1,000 |
| DermaMNIST | Dermatoscope | MC (7) | 10,015 | 7,007 / 1,003 / 2,005 |
| PneumoniaMNIST | Chest X-Ray | BC (2) | 5,856 | 4,708 / 524 / 624 |
| BreastMNIST | Breast Ultrasound | BC (2) | 780 | 546 / 78 / 156 |
| TissueMNIST | Kidney Cortex Microscope | MC (8) | 236,386 | 165,466 / 23,640 / 47,280 |
| BloodMNIST | Blood Cell Microscope | MC (8) | 17,092 | 11,959 / 1,712 / 3,421 |
| OrganAMNIST | Abdominal CT | MC (11) | 58,850 | 34,581 / 6,491 / 17,778 |
| OrganCMNIST | Abdominal CT | MC (11) | 23,660 | 13,000 / 2,392 / 8,268 |
| OrganSMNIST | Abdominal CT | MC (11) | 25,221 | 13,940 / 2,452 / 8,829 |
3.2 Evaluation Metrics
Here, based on the characteristics of medical images, we used accuracy, sensitivity, specificity, precision and F1-score as evaluation metrics for the model. The high or low values of these metrics can reflect the potential of the model. The definitions of these metrics are as follows:
| (5) |
| (6) |
| (7) |
| (8) |
| (9) |
In addition, due to the characteristics of medical images, AUC (Area under the receiver operating characteristic curve) was also used to further measure model performance.
3.3 Implementation Details
The average value ± standard deviation of the five-fold cross-validation results is used to thoroughly evaluate the potential of MedMamba. Before training the network, we resized all images to 224×224×3. Subsequently, the each image was normalized and standardized. During the training process, we employed the Adam optimizer with a 0.001 initial learning rate, of 0.9, of 0.999, and weight decay of 1e-4 and Cross-Entropy Loss to optimize the model parameters. To train the network, we utilized the PyTorch framework. We trained the model for 100 epochs and used a batch size of 64. We used an early-stop strategy to prevent model overfitting. Furthermore, we do not apply any data augmentation strategies and pre-trained weights to objectively demonstrate that the results of all model metrics benefit from MedMamba’s unique architecture. The training was conducted on a computer with Ubuntu 22.04 operating system and an NVIDIA GeForce RTX 4090 GPU.
3.4 Main results and findings
In previous work, researchers and developers tended to use classification models carefully designed for ImageNet[36] to classify medical images. Although these models were initially applied to natural image classification, experimental results have shown that they are also effective in medical image classification. Therefore, to demonstrate the potential of MedMamba, we compared it with some state-of-the-art models applied in medical image classification tasks, and the experimental results are shown in Table 2 and Table3. According to the results, although the proposed MedMamba architecture is very straightforward, it still performs well in medical image classification tasks and surpasses CNNs-based and Transformers-based models in some datasets.
| Dataset | Model | Precision(%) | Sensitivity(%) | Specificity(%) | F1-score(%) | OA(%) | AUC |
|---|---|---|---|---|---|---|---|
| PAD-UFES-20 | ResNet50[37] | 45.71 | 42.40 | 89.78 | 42.77 | 56.62 | 0.7626 |
| ConvNeXt-B [38] | 33.80 | 34.47 | 88.97 | 33.36 | 54.73 | 0.7613 | |
| ViT-B [17] | 32.04 | 33.21 | 88.05 | 32.20 | 50.36 | 0.7291 | |
| Swin-T [39] | 49.35 | 43.10 | 90.83 | 42.87 | 62.15 | 0.8396 | |
| MedMamba | 38.43 | 36.94 | 89.90 | 35.80 | 58.80 | 0.8070 | |
| Cervical-US | ResNet50[37] | 76.97 | 76.80 | 94.49 | 76.75 | 84.35 | 0.9433 |
| ConvNeXt-B [38] | 71.11 | 67.55 | 92.70 | 68.90 | 80.01 | 0.8875 | |
| ViT-B [17] | 59.15 | 54.59 | 90.05 | 54.86 | 73.91 | 0.8412 | |
| Swin-T [39] | 73.24 | 60.06 | 91.29 | 62.00 | 77.75 | 0.8804 | |
| MedMamba | 82.67 | 73.83 | 94.68 | 76.32 | 85.62 | 0.9524 | |
| Fetal-US | ResNet50[37] | 91.48 | 92.29 | 98.53 | 91.85 | 93.08 | 0.9901 |
| ConvNeXt-B [38] | 84.62 | 81.40 | 97.21 | 82.69 | 87.27 | 0.9738 | |
| ViT-B [17] | 77.95 | 77.18 | 96.51 | 77.50 | 83.66 | 0.9625 | |
| Swin-T [39] | 87.39 | 87.02 | 97.95 | 87.10 | 90.34 | 0.9867 | |
| MedMamba | 92.15 | 93.89 | 98.73 | 92.97 | 93.97 | 0.9931 | |
| CPN-Xray | ResNet50[37] | 97.57 | 97.55 | 98.74 | 97.56 | 97.51 | 0.9970 |
| ConvNeXt-B [38] | 93.82 | 93.84 | 96.85 | 93.83 | 93.75 | 0.9867 | |
| ViT-B [17] | 92.09 | 91.98 | 95.87 | 91.97 | 91.83 | 0.9807 | |
| Swin-T [39] | 95.64 | 95.61 | 97.73 | 95.62 | 95.53 | 0.9911 | |
| MedMamba | 97.21 | 97.17 | 98.54 | 97.19 | 97.12 | 0.9953 | |
| Kavsir | ResNet50[37] | 77.99 | 78.08 | 96.86 | 77.82 | 78.08 | 0.9729 |
| ConvNeXt-B [38] | 74.09 | 74.24 | 96.32 | 73.87 | 74.25 | 0.9660 | |
| ViT-B [17] | 74.46 | 73.25 | 96.17 | 72.40 | 73.25 | 0.9657 | |
| Swin-T [39] | 73.34 | 73.16 | 96.16 | 72.84 | 73.16 | 0.9630 | |
| MedMamba | 78.74 | 78.83 | 96.97 | 78.56 | 78.83 | 0.9731 | |
| Otoscopy2024 | ResNet50 [37] | 86.06 | 81.00 | 98.47 | 83.23 | 88.65 | 0.9847 |
| ConvNeXt-B [38] | 79.32 | 75.92 | 97.99 | 77.39 | 84.92 | 0.9782 | |
| Vit-B [17] | 78.36 | 74.16 | 87.81 | 75.88 | 83.44 | 0.9739 | |
| Swin-T [39] | 83.45 | 77.44 | 98.25 | 80.05 | 86.91 | 0.9821 | |
| MedMamba | 86.00 | 84.44 | 98.59 | 85.15 | 89.45 | 0.9889 |
| Methods | PathMNIST | DermaMNIST | OCTMNIST | PneumoniaMNIST | BreastMNIST | |||||
|---|---|---|---|---|---|---|---|---|---|---|
| AUC | ACC | AUC | ACC | AUC | ACC | AUC | ACC | AUC | ACC | |
| ResNet18 (28)[37] | 0.983 | 0.907 | 0.917 | 0.735 | 0.943 | 0.743 | 0.944 | 0.854 | 0.901 | 0.863 |
| ResNet18 (224)[37] | 0.989 | 0.909 | 0.920 | 0.754 | 0.958 | 0.763 | 0.956 | 0.864 | 0.891 | 0.833 |
| ResNet50 (28)[37] | 0.990 | 0.911 | 0.913 | 0.735 | 0.952 | 0.762 | 0.948 | 0.854 | 0.857 | 0.812 |
| ResNet50 (224)[37] | 0.989 | 0.892 | 0.912 | 0.731 | 0.958 | 0.776 | 0.962 | 0.884 | 0.866 | 0.842 |
| auto-sklearn[40] | 0.934 | 0.716 | 0.902 | 0.719 | 0.887 | 0.601 | 0.942 | 0.855 | 0.836 | 0.803 |
| AutoKeras[41] | 0.959 | 0.834 | 0.915 | 0.749 | 0.955 | 0.763 | 0.947 | 0.878 | 0.871 | 0.831 |
| Google AutoML[42] | 0.944 | 0.728 | 0.914 | 0.768 | 0.963 | 0.771 | 0.991 | 0.946 | 0.919 | 0.861 |
| MedVit-T[43] | 0.994 | 0.938 | 0.914 | 0.768 | 0.961 | 0.767 | 0.993 | 0.949 | 0.934 | 0.896 |
| MedVit-S[43] | 0.993 | 0.942 | 0.937 | 0.780 | 0.960 | 0.782 | 0.995 | 0.961 | 0.938 | 0.897 |
| MedVit-L[43] | 0.984 | 0.933 | 0.920 | 0.773 | 0.945 | 0.761 | 0.991 | 0.921 | 0.929 | 0.883 |
| MedMamba | 0.997 | 0.951 | 0.907 | 0.758 | 0.993 | 0.914 | 0.965 | 0.912 | 0.879 | 0.872 |
| Methods | BloddMNIST | TissueMNIST | OrganAMNIST | OrganCMNIST | OrganSMNIST | |||||
| AUC | ACC | AUC | ACC | AUC | ACC | AUC | ACC | AUC | ACC | |
| ResNet18 (28)[37] | 0.998 | 0.958 | 0.930 | 0.676 | 0.997 | 0.935 | 0.992 | 0.900 | 0.972 | 0.782 |
| ResNet18 (224)[37] | 0.998 | 0.963 | 0.933 | 0.681 | 0.998 | 0.951 | 0.994 | 0.920 | 0.974 | 0.778 |
| ResNet50 (28)[37] | 0.997 | 0.956 | 0.931 | 0.680 | 0.997 | 0.935 | 0.992 | 0.905 | 0.972 | 0.770 |
| ResNet50 (224)[37] | 0.997 | 0.950 | 0.932 | 0.680 | 0.998 | 0.947 | 0.993 | 0.911 | 0.975 | 0.785 |
| auto-sklearn[40] | 0.984 | 0.878 | 0.828 | 0.532 | 0.963 | 0.762 | 0.976 | 0.829 | 0.945 | 0.672 |
| AutoKeras[41] | 0.998 | 0.961 | 0.941 | 0.703 | 0.994 | 0.905 | 0.990 | 0.879 | 0.974 | 0.813 |
| Google AutoML[42] | 0.998 | 0.966 | 0.924 | 0.673 | 0.990 | 0.886 | 0.988 | 0.877 | 0.964 | 0.749 |
| MedVit-T[43] | 0.996 | 0.950 | 0.943 | 0.703 | 0.995 | 0.931 | 0.991 | 0.901 | 0.972 | 0.789 |
| MedVit-S[43] | 0.997 | 0.951 | 0.952 | 0.731 | 0.996 | 0.928 | 0.993 | 0.916 | 0.987 | 0.805 |
| MedVit-L[43] | 0.996 | 0.954 | 0.935 | 0.699 | 0.997 | 0.943 | 0.994 | 0.922 | 0.973 | 0.806 |
| MedMamba | 0.999 | 0.984 | 0.930 | 0.694 | 0.998 | 0.954 | 0.995 | 0.924 | 0.978 | 0.808 |
4 Conclusion
In this work, we first introduce an SSM-based model into medical image classification tasks and propose MedMamba as a baseline. In order to enable MedMamba to effectively model various medical images with fine-grained features, we constructed MedMamba using a hybrid module with convolutional layers and SSM. In order to fully demonstrate that MedMamba’s potential in medical classification tasks directly benefits from SSM, we did not use any pre-training strategies or data augmentation strategies. Extensive experiments were conducted on MedMamba using a large number of medical datasets with different modalities. The results show that MedMamba has excellent performance in medical image classification tasks. In addition, compared to various architectures widely used in medical classification tasks, MedMamba demonstrates strong competitiveness.
In addition, we summarize our future work into the following points: 1) We will further explore and test the potential of MedMamba on medical datasets obtained from other imaging technologies, and optimize the internal architecture of MedMamba. 2) We will further use explainable artificial intelligence to analyze MedMamba’s decision-making mechanism. In addition, the impact of MedMamba’s inference speed and model parameter size on practical applications should also be studied. 3) Due to the advantages of SSM in efficient long sequence modeling, further research on the performance of MedMamba in some high-resolution medical images (such as pathological images) may be beneficial. 4) We will attempt to use the backbone of MedMamba as an encoder or decoder to explore its application potential in more advanced medical image tasks, such as medical image segmentation, medical object detection, medical image registration, and medical image reconstruction.
References
- [1] Jian Wang, Hengde Zhu, Shui-Hua Wang, and Yu-Dong Zhang. A review of deep learning on medical image analysis. Mobile Networks and Applications, 26:351–380, 2021.
- [2] S Suganyadevi, V Seethalakshmi, and K Balasamy. A review on deep learning in medical image analysis. International Journal of Multimedia Information Retrieval, 11(1):19–38, 2022.
- [3] Lei Cai, Jingyang Gao, and Di Zhao. A review of the application of deep learning in medical image classification and segmentation. Annals of translational medicine, 8(11), 2020.
- [4] Shah Hussain, Iqra Mubeen, Niamat Ullah, Syed Shahab Ud Din Shah, Bakhtawar Abduljalil Khan, Muhammad Zahoor, Riaz Ullah, Farhat Ali Khan, and Mujeeb A Sultan. Modern diagnostic imaging technique applications and risk factors in the medical field: A review. BioMed Research International, 2022, 2022.
- [5] Xuxin Chen, Ximin Wang, Ke Zhang, Kar-Ming Fung, Theresa C Thai, Kathleen Moore, Robert S Mannel, Hong Liu, Bin Zheng, and Yuchen Qiu. Recent advances and clinical applications of deep learning in medical image analysis. Medical Image Analysis, 79:102444, 2022.
- [6] Mahmoud Khalil, Ahmad Khalil, and Alioune Ngom. A comprehensive study of vision transformers in image classification tasks. arXiv preprint arXiv:2312.01232, 2023.
- [7] Weibin Wang, Dong Liang, Qingqing Chen, Yutaro Iwamoto, Xian-Hua Han, Qiaowei Zhang, Hongjie Hu, Lanfen Lin, and Yen-Wei Chen. Medical image classification using deep learning. Deep learning in healthcare: paradigms and applications, pages 33–51, 2020.
- [8] Shreyank N Gowda and Chun Yuan. Colornet: Investigating the importance of color spaces for image classification. In Computer Vision–ACCV 2018: 14th Asian Conference on Computer Vision, Perth, Australia, December 2–6, 2018, Revised Selected Papers, Part IV 14, pages 581–596. Springer, 2019.
- [9] Joseph Redmon, Santosh Divvala, Ross Girshick, and Ali Farhadi. You only look once: Unified, real-time object detection. In Proceedings of the IEEE conference on computer vision and pattern recognition, pages 779–788, 2016.
- [10] Kaiming He, Georgia Gkioxari, Piotr Dollár, and Ross Girshick. Mask r-cnn. In Proceedings of the IEEE international conference on computer vision, pages 2961–2969, 2017.
- [11] Olaf Ronneberger, Philipp Fischer, and Thomas Brox. U-net: Convolutional networks for biomedical image segmentation. In Medical Image Computing and Computer-Assisted Intervention–MICCAI 2015: 18th International Conference, Munich, Germany, October 5-9, 2015, Proceedings, Part III 18, pages 234–241. Springer, 2015.
- [12] Wenben Chen, Ruiyang Li, Qinji Yu, Andi Xu, Yile Feng, Ruixin Wang, Lanqin Zhao, Zhenzhe Lin, Yahan Yang, Duoru Lin, et al. Early detection of visual impairment in young children using a smartphone-based deep learning system. Nature medicine, 29(2):493–503, 2023.
- [13] Xiaofeng Jiang, Michael Hoffmeister, Hermann Brenner, Hannah Sophie Muti, Tanwei Yuan, Sebastian Foersch, Nicholas P West, Alexander Brobeil, Jitendra Jonnagaddala, Nicholas Hawkins, et al. End-to-end prognostication in colorectal cancer by deep learning: a retrospective, multicentre study. The Lancet Digital Health, 6(1):e33–e43, 2024.
- [14] Yen-Chi Chen, Yuan-Chia Chu, Chii-Yuan Huang, Yen-Ting Lee, Wen-Ya Lee, Chien-Yeh Hsu, Albert C Yang, Wen-Huei Liao, and Yen-Fu Cheng. Smartphone-based artificial intelligence using a transfer learning algorithm for the detection and diagnosis of middle ear diseases: A retrospective deep learning study. EClinicalMedicine, 51, 2022.
- [15] Ling Dai, Bin Sheng, Tingli Chen, Qiang Wu, Ruhan Liu, Chun Cai, Liang Wu, Dawei Yang, Haslina Hamzah, Yuexing Liu, et al. A deep learning system for predicting time to progression of diabetic retinopathy. Nature Medicine, pages 1–11, 2024.
- [16] Zhongwen Li, Jiewei Jiang, Kuan Chen, Qianqian Chen, Qinxiang Zheng, Xiaotian Liu, Hongfei Weng, Shanjun Wu, and Wei Chen. Preventing corneal blindness caused by keratitis using artificial intelligence. Nature communications, 12(1):3738, 2021.
- [17] Alexey Dosovitskiy, Lucas Beyer, Alexander Kolesnikov, Dirk Weissenborn, Xiaohua Zhai, Thomas Unterthiner, Mostafa Dehghani, Matthias Minderer, Georg Heigold, Sylvain Gelly, et al. An image is worth 16x16 words: Transformers for image recognition at scale. arXiv preprint arXiv:2010.11929, 2020.
- [18] Lianghui Zhu, Bencheng Liao, Qian Zhang, Xinlong Wang, Wenyu Liu, and Xinggang Wang. Vision mamba: Efficient visual representation learning with bidirectional state space model. arXiv preprint arXiv:2401.09417, 2024.
- [19] Rudolph Emil Kalman. A new approach to linear filtering and prediction problems. 1960.
- [20] Albert Gu and Tri Dao. Mamba: Linear-time sequence modeling with selective state spaces. arXiv preprint arXiv:2312.00752, 2023.
- [21] Albert Gu, Karan Goel, and Christopher Ré. Efficiently modeling long sequences with structured state spaces. arXiv preprint arXiv:2111.00396, 2021.
- [22] Yue Liu, Yunjie Tian, Yuzhong Zhao, Hongtian Yu, Lingxi Xie, Yaowei Wang, Qixiang Ye, and Yunfan Liu. Vmamba: Visual state space model. arXiv preprint arXiv:2401.10166, 2024.
- [23] Jun Ma, Feifei Li, and Bo Wang. U-mamba: Enhancing long-range dependency for biomedical image segmentation. arXiv preprint arXiv:2401.04722, 2024.
- [24] Jiacheng Ruan and Suncheng Xiang. Vm-unet: Vision mamba unet for medical image segmentation. arXiv preprint arXiv:2402.02491, 2024.
- [25] Jimmy Lei Ba, Jamie Ryan Kiros, and Geoffrey E Hinton. Layer normalization. arXiv preprint arXiv:1607.06450, 2016.
- [26] Albert Gu, Karan Goel, and Christopher Ré. Efficiently modeling long sequences with structured state spaces. arXiv preprint arXiv:2111.00396, 2021.
- [27] Stefan Elfwing, Eiji Uchibe, and Kenji Doya. Sigmoid-weighted linear units for neural network function approximation in reinforcement learning. Neural networks, 107:3–11, 2018.
- [28] Abien Fred Agarap. Deep learning using rectified linear units (relu). arXiv preprint arXiv:1803.08375, 2018.
- [29] Xavier P Burgos-Artizzu, David Coronado-Gutiérrez, Brenda Valenzuela-Alcaraz, Elisenda Bonet-Carne, Elisenda Eixarch, Fatima Crispi, and Eduard Gratacós. Evaluation of deep convolutional neural networks for automatic classification of common maternal fetal ultrasound planes. Scientific Reports, 10(1):10200, 2020.
- [30] Sourabh Shastri, Isha Kansal, Sachin Kumar, Kuljeet Singh, Renu Popli, and Vibhakar Mansotra. Cheximagenet: a novel architecture for accurate classification of covid-19 with chest x-ray digital images using deep convolutional neural networks. Health and Technology, 12(1):193–204, 2022.
- [31] Sachin Kumar, Sourabh Shastri, Shilpa Mahajan, Kuljeet Singh, Surbhi Gupta, Rajneesh Rani, Neeraj Mohan, and Vibhakar Mansotra. Litecovidnet: A lightweight deep neural network model for detection of covid-19 using x-ray images. International Journal of Imaging Systems and Technology, 32(5):1464–1480, 2022.
- [32] Konstantin Pogorelov, Kristin Ranheim Randel, Carsten Griwodz, Sigrun Losada Eskeland, Thomas de Lange, Dag Johansen, Concetto Spampinato, Duc-Tien Dang-Nguyen, Mathias Lux, Peter Thelin Schmidt, et al. Kvasir: A multi-class image dataset for computer aided gastrointestinal disease detection. In Proceedings of the 8th ACM on Multimedia Systems Conference, pages 164–169, 2017.
- [33] Xinyu Zeng, Zifan Jiang, Wen Luo, Honggui Li, Hongye Li, Guo Li, Jingyong Shi, Kangjie Wu, Tong Liu, Xing Lin, et al. Efficient and accurate identification of ear diseases using an ensemble deep learning model. Scientific Reports, 11(1):10839, 2021.
- [34] Jiancheng Yang, Rui Shi, and Bingbing Ni. Medmnist classification decathlon: A lightweight automl benchmark for medical image analysis. In IEEE 18th International Symposium on Biomedical Imaging (ISBI), pages 191–195, 2021.
- [35] Jiancheng Yang, Rui Shi, Donglai Wei, Zequan Liu, Lin Zhao, Bilian Ke, Hanspeter Pfister, and Bingbing Ni. Medmnist v2-a large-scale lightweight benchmark for 2d and 3d biomedical image classification. Scientific Data, 10(1):41, 2023.
- [36] Jia Deng, Wei Dong, Richard Socher, Li-Jia Li, Kai Li, and Li Fei-Fei. Imagenet: A large-scale hierarchical image database. In 2009 IEEE conference on computer vision and pattern recognition, pages 248–255. Ieee, 2009.
- [37] Kaiming He, Xiangyu Zhang, Shaoqing Ren, and Jian Sun. Deep residual learning for image recognition. In Proceedings of the IEEE conference on computer vision and pattern recognition, pages 770–778, 2016.
- [38] Zhuang Liu, Hanzi Mao, Chao-Yuan Wu, Christoph Feichtenhofer, Trevor Darrell, and Saining Xie. A convnet for the 2020s. In Proceedings of the IEEE/CVF conference on computer vision and pattern recognition, pages 11976–11986, 2022.
- [39] Ze Liu, Yutong Lin, Yue Cao, Han Hu, Yixuan Wei, Zheng Zhang, Stephen Lin, and Baining Guo. Swin transformer: Hierarchical vision transformer using shifted windows. In Proceedings of the IEEE/CVF international conference on computer vision, pages 10012–10022, 2021.
- [40] Matthias Feurer, Aaron Klein, Katharina Eggensperger, Jost Springenberg, Manuel Blum, and Frank Hutter. Efficient and robust automated machine learning. Advances in neural information processing systems, 28, 2015.
- [41] Haifeng Jin, Qingquan Song, and Xia Hu. Auto-keras: An efficient neural architecture search system. In Proceedings of the 25th ACM SIGKDD international conference on knowledge discovery & data mining, pages 1946–1956, 2019.
- [42] Ekaba Bisong and Ekaba Bisong. Google automl: cloud vision. Building Machine Learning and Deep Learning Models on Google Cloud Platform: A Comprehensive Guide for Beginners, pages 581–598, 2019.
- [43] Omid Nejati Manzari, Hamid Ahmadabadi, Hossein Kashiani, Shahriar B Shokouhi, and Ahmad Ayatollahi. Medvit: a robust vision transformer for generalized medical image classification. Computers in Biology and Medicine, 157:106791, 2023.