ProbSAINT: Probabilistic Tabular Regression for Used Car Pricing
Abstract.
Used car pricing is a critical aspect of the automotive industry, influenced by many economic factors and market dynamics. With the recent surge in online marketplaces and increased demand for used cars, accurate pricing would benefit both buyers and sellers by ensuring fair transactions. However, the transition towards automated pricing algorithms using machine learning necessitates the comprehension of model uncertainties, specifically the ability to flag predictions that the model is unsure about. Although recent literature proposes the use of boosting algorithms or nearest neighbor-based approaches for swift and precise price predictions, encapsulating model uncertainties with such algorithms presents a complex challenge. We introduce ProbSAINT, a model that offers a principled approach for uncertainty quantification of its price predictions, along with accurate point predictions that are comparable to state-of-the-art boosting techniques. Furthermore, acknowledging that the business prefers pricing used cars based on the number of days the vehicle was listed for sale, we show how ProbSAINT can be used as a dynamic forecasting model for predicting price probabilities for different expected offer duration. Our experiments further indicate that ProbSAINT is especially accurate on instances where it is highly certain. This proves the applicability of its probabilistic predictions in real-world scenarios where trustworthiness is crucial.
1. Introduction
The Used car market is a vast and complex ecosystem with millions of vehicles traded each year. For instance, the German used car market was valued at 113.2 Billion USD in 2021 and is expected to reach a value of 171.03 Billion USD by 2027, with a compound annual growth rate (CAGR) of 7.12% during the forecasted period (Intelligence, 2022). Consequently, there is a need for a scalable automated pricing system to accommodate this demand. This increase in volume is accompanied by considerable volatility in the used car market. For example, during the COVID-19 pandemic, supply-chain challenges and shortage of chips and other electronic components, hindered the supply of both new and used cars, resulting in inflated prices and higher profit margins for these vehicles. Thus, complex machine learning techniques capable of swiftly adapting to rapidly changing market conditions are necessary for pricing. Furthermore, to ensure the trustworthiness of model predictions in an automated pricing system, quantification of uncertainties is crucial.
Used car pricing is a complex task involving features that describe vehicle characteristics such as vehicle-model, brand, and registration year, as well as usage attributes like the damage, offer duration, and mileage. Moreover, temporal features such as initial listing date and the selling date are also crucial factors. Previous machine learning methods (Venkatasubbu and Ganesh, 2019; Samruddhi and Kumar, 2020) for used-car pricing rely on simple linear or neighborhood-based models. Consequently, they struggle to manage the complex mixture of numerical, categorical and temporal features mentioned above. Recent studies utilize more complex Gradient Boosted Decision Tree models (GBDTs) (Jawed et al., 2023; Cui et al., 2022) for used-car pricing. However, they fail to compare their results with state-of-the-art deep learning solutions or restrict experiments to smaller datasets. In contrast to the specific area of used car pricing, recent advances in tabular learning have moved in the direction of complex deep attention-based neural networks (Borisov et al., 2022). In this work, we transfer and adapt these state-of-the-art models to the specific use case of used car pricing, resulting in pricing models which are able to handle complex feature sets while also providing enhanced prediction accuracies. Although numerous works exists on improving prediction accuracies on tabular dataset, uncertainty quantification has received less attention. This lack of study limits their applicability in industrial settings such as used car pricing, where trustworthiness is crucial. To address this issue, previous approaches have measured the uncertainty of model predictions as the standard deviation of values produced by an ensemble of models (Malinin et al., 2021; Lakshminarayanan et al., 2017). However, these techniques offer uncertainty in a post-hoc manner across multiple models rather than training a single model to learn uncertainty from a distributional loss.
This emphasizes the necessity for state-of-the-art attention-based tabular model SAINT (Somepalli et al., 2021) to be enhanced to provide uncertainty quantification. Building on this premise, we introduce our novel approach, ProbSAINT. While SAINT was initially designed for tabular classification and does not inherently offer uncertainty quantification, we extend its capabilities to the probabilistic tabular regression setting. The proposed ProbSAINT model incorporates a probabilistic loss, specifically the log-likelihood loss, allowing the model to learn the distribution of the response variable instead of focusing solely on individual point predictions. This approach provides a principled method for modeling uncertainty without the use of post-hoc ensembles as mentioned before. Furthermore, to our knowledge, the evaluation of an attention-based tabular model such as SAINT (Somepalli et al., 2021) on large real-world regression datasets is lacking in the literature. We close this gap in the literature by demonstrating that both ProbSAINT and the underlying SAINT are proficient in tackling real-world regression tasks, such as used car pricing with a dataset comprising 2 million data points.
In the context of used-car pricing, the offer duration feature, indicating how long a specific car has been on the market at the time of sale prediction, holds significant importance. However, this information is typically unavailable when predicting the initial sales price for a used car to be listed on a selling platform. Often, the expected offer duration represent a strategic decision by businesses, factoring in margins and the volume of similar used cars available. In other words, understanding the price elasticity of a given vehicle across multiple offer durations for optimal pricing is of interest. To address this, we propose the use of ProbSAINT for conditional-inference procedure named Probabilistic Dynamic Forecasting to evaluate the price elasticity for multiple expected offer duration in the future. In section 7, we illustrate how ProbSAINT learns distinct price elasticities for multiple vehicles.
By offering more precise predictions alongside principled uncertainty values, our approach enhances the reliability of machine-learning-based pricing methods in the eyes of human experts. In doing so, it significantly reduces the requirement for ensuring trustworthy predictions through the implementation of extensive hand-crafted rules, which are frequently employed in real-world business contexts. Thus, ProbSAINT can facilitate a move towards fully automated used car pricing. Our specific contributions are as follows.
-
•
We propose ProbSAINT, to offer probabilistic outputs, thereby providing confidence values for used car pricing.
-
•
We demonstrate the advantages of ProbSAINT empirically and qualitatively by utilizing appropriate distributional metrics.
-
•
We experimentally show that the underlying SAINT architecture serves as a valuable deep learning alternative for large-scale used car price predicion in comparison to the state-of-the-art boosting methods.
-
•
We introduce and illustrate the utilization of ProbSAINT as a probabilistic dynamic forecasting model with the ability to grasp market dynamics.
2. Related Work
Machine learning techniques have been previously employed for various price prediction settings, For example, real estate price prediction (Tchuente and Nyawa, 2022), house price estimation (Wang and Wu, 2018), inventory demand estimation (Bajari et al., 2015) are few use-cases where machine learning solutions have already seen an impact. On the topic of used car price prediction Venkatasubbu and Ganesh (2019) suggest the use of Lasso regression model for careful feature selection. The elimination of non-informative features was shown to improve the performance for used car price prediction within the Indian market. In another study, Samruddhi and Kumar (2020) propose a nearest neighbor approach for pricing used cars. However, the study ignore the temporal aspect of the problem and perform matching with the entire training dataset. Despite these efforts to apply machine learning for used car pricing, these methods primarily employ simple linear models. Recent studies utilize more complex Gradient Boosted Decision Tree models (GBDTs) (Jawed et al., 2023; Cui et al., 2022) for used-car pricing. However, they fail to compare their results with state-of-the-art deep learning solutions or restrict experiments to smaller datasets.
Advancement in the field of tabular regression is yet to be explored for the topic of used car pricing. Typically, gradient boosted tree algorithms like XGBoost (Chen and Guestrin, 2016), LightGBM (Ke et al., 2017) or CatBoost (Prokhorenkova et al., 2018) are used for tabular regression tasks due to their superior performance. Shwartz-Ziv and Armon (2022) compare the performance of several deep learning models with XGBoost method and conclude that efficient deep learning models for tabular data is still an active research area. Recent studies on using deep learning solutions for tabular data benefits from the use of attention mechanisms. Somepalli et al. (2021) introduce SAINT, a Transformer model (Vaswani et al., 2017), that utilizes self attention and inter-sample attention that rivals the performance of boosting tree algorithms for classification tasks. Although, SAINT was introduced for tabular classification tasks, Borisov et al. (2022), experiments on the effectiveness of using SAINT for tabular regression on a single dataset with 20 thousand samples. Here, the SAINT model, even though being the best deep learning model, was unable to outperform its gradient boosted counterparts. Evaluation on a single dataset does not provide qualitative understanding of the effectiveness of SAINT. A different study (Grinsztajn et al., 2022) highlights the subpar performance of deep learning methods for tabular data. It concludes that, despite being the top-performing deep learning model, SAINT still falls short when compared to Gradient Boosted Decision Trees (GBDTs). In this study, we extend the application of the SAINT model for tabular regression tasks and assess its performance on a substantial real-world pricing dataset. Furthermore, as the uncertainty quantification of tabular data models is a relatively less explored area, we modify the SAINT framework to generate probabilistic outputs. This adaptation aims to increase the model’s reliability in an industrial environment
Uncertainty quantification is a crucial aspect for any decision-making process. Previous works on the topic of price prediction ignores this aspect of the problem (Jawed et al., 2023; Cui et al., 2022; Samruddhi and Kumar, 2020). Even though boosting methods are highly competent within the tabular data regime, they are restricted to a scalar value for regression. In order to predict a Gaussian distribution output, the model requires at least two degrees of freedom, for example, the mean and standard deviation of the predictions. Hence, uncertainty quantification with boosted trees is a challenge. CatBoost (Prokhorenkova et al., 2018) and other boosting methods attempt to circumvent this challenge by providing uncertainty over an ensemble of models (Malinin et al., 2021; Sprangers et al., 2021). Another popular approach, Monte Carlo (MC) dropout (Gal and Ghahramani, 2016) uses the dropout (Srivastava et al., 2014) regularization term to quantify uncertainty. While several works have used MC dropout (Alarab et al., 2021) for uncertainty quantification, it has been shown to represent incorrect posterior for deeper neural networks (Foong et al., 2020). Above mentioned methods are not a principled method to model uncertainty, as the model is not trained for uncertainty quantification bur rather use ad-hoc post-processing to quantify uncertainty. More principled techniques to model uncertainty have been researched for deep learning models. Normalizing flow models (Papamakarios et al., 2021) are an emerging field of research to model exact posterior distributions from given data with the help of a series of bijective transformations. Even though normalizing flows are widely adopted within the computer vision domain (Abdelhamed et al., 2019) and time series domain (Rasul et al., 2020), extrapolation to tasks with a scalar value output is less explored. Generalized linear models (GLMs) (Nelder and Wedderburn, 1972) offer a principled approach to modelling uncertainty. These can be easily incorporated to any model by learning the distribution parameters of the target. Therefore, we adapt the SAINT model to a Generalized Linear model that easily learns the distribution parameters and provides probabilistic outputs.
3. Problem Definition
The problem of used car pricing involves learning from historic prices to predict the final sales price for an unseen used car. In addition, the task of probabilistic used car pricing involves calculating an expected price and a measure of uncertainty for the prediction, or more general, to predict the distribution of likely prices.
The abstract problem can be formalized as follows. Assume we have given a dataset of many samples drawn from an unknown distribution . The task is to find a model
which predicts for predictors a distribution for the target . Models should minimize the expected Negative Log Likelihood (NLL):
Models often choose a specific shape of target distribution in advance, e.g., a normal distribution. To predict for every a distribution then simplifies to predict the distribution’s parameters, i.e., its mean and variance:
and the Negative Log Likelihood loss (NLL) in then is
| (1) |
Here, is chosen as a small value to prevent divisions by and to provide numeric stability.
4. Methodology: ProbSAINT
The recent success of deep learning can often be attributed to the expressive power of the Transformer architecture (Vaswani et al., 2017). However, the direct application of the Transformer architecture on tabular data has not witnessed significant performance improvements similar to other domains (Grinsztajn et al., 2022), which has led to attention-based tabular models that fundamentally modify the base Transformer architecture. For example, SAINT (Somepalli et al., 2021) adds a specific embedding technique for numerical features and introduces inter-sample attention, which leads to significant performance gains in tabular classification tasks. For more details, we refer the reader to Somepalli et al. (2021). For our novel model ProbSAINT, we modify the SAINT model to perform the task of tabular regression with uncertainty quantification. In detail, the individual components of our model are as follows.
4.1. Encoding
As previously stated, the task of pricing used cars requires a model that can effectively handle both continuous and categorical variables. Typically, deep learning solutions embed categorical variables into a -dimensional space, leaving numerical features unprocessed (Huang et al., 2020). As a result, categorical variables often dominate the embedding space. The SAINT model, addresses this by using a separate, fully-connected network with ReLU activation for each continuous feature. This projects the single-dimensional numerical feature into the same -dimensional vector space where the categorical features are embedded, allowing a richer feature representation. More specifically, our encoder maps an input vector to a sequence of length of -dimensional vectors, i.e.,
where is the encoder of the -th feature of .
4.2. Self Attention and Inter-Sample Attention
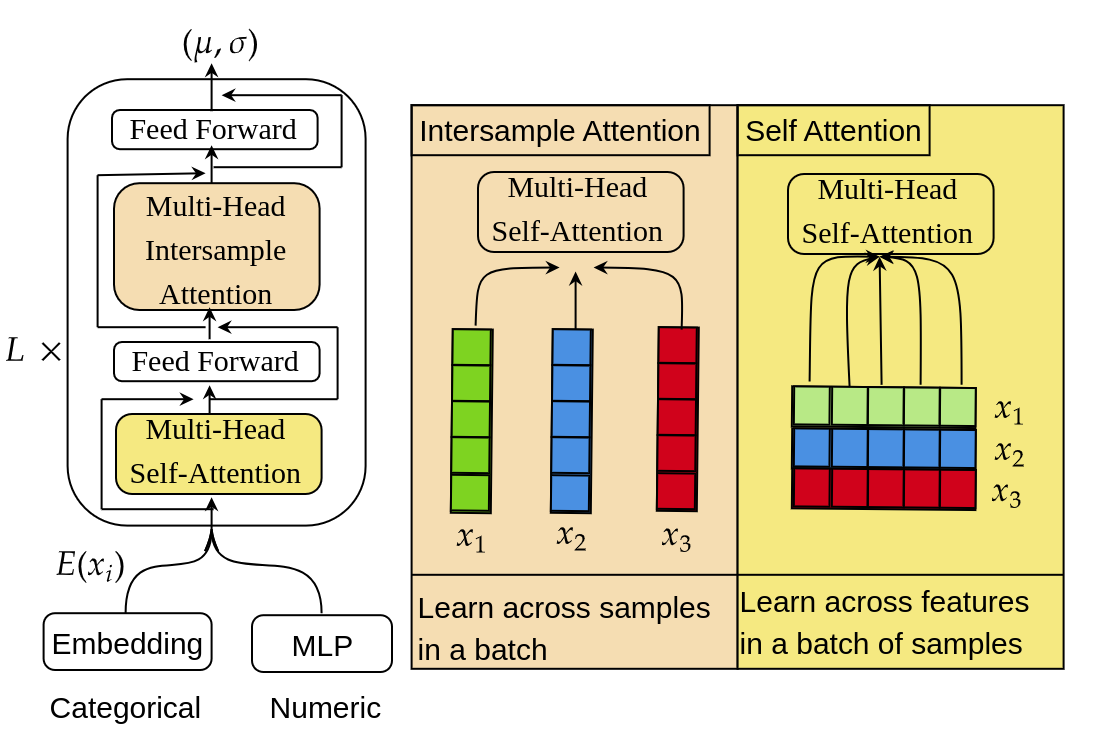
SAINT relies on the alternating use of self-attention and inter-sample attention. While self-attention is a concept borrowed from the Transformer architecture (Vaswani et al., 2017), inter-sample attention was first introduced in SAINT. Unlike the original attention mechanism, which applies attention across different features, inter-sample attention enables the computation of attention across different data points within a given batch. The ProbSAINT model along with the inter-sample attention is illustrated in Figure 1. The authors of the SAINT model suggest that the inter-sample attention enables the model to borrow missing or noisy features from other similar data points, which is beneficial in the tabular data setting. Therefore, the SAINT model is composed of a stack of identical blocks, each of which alternates between self-attention and inter-sample attention.
In detail, let be a batch of data points, where a data point is a sequence of many -dimensional vectors. We represent such datapoints via a matrix where is the -th feature of the -th element of the sequence. We represent the batch via a tensor , where . The self-attention layer applies the normal attention mechanism on each datapoint over the features or columns, which can be seen as a function
A self-attention layer applies this to all datapoints of a batch individually and can be seen as a function
Then, the inter-sample layer is applied over the datapoints or rows in a batch, which works as follows: We concat all sequences so that we have only one vector for each datapoint which can be interpreted as a map
on which the normal attention mechanism is applied, for which the output is then split back to a sequence via
The full inter-sample attention is then given via
4.3. Distributional Output
Our complete model is composed of an encoder and blocks of attention layers as illustrated in Figure 1. Furthermore, we incorporate a final 2-layer MLP with ReLU activation at the hidden layer and no activation at the output, to predict means and standard deviations. This approach differs from SAINT, where the 2-layer MLP only produces a single output for regression target. The model is trained on the objective defined in Equation 1.
| Feature | Type | Feature | Type |
|---|---|---|---|
| Odometer | Numeric | Available Date | Date |
| Condition | Categorical | Engine Type | Categorical |
| Age | Integer | Engine Size | Numeric |
| Offer Duration | Integer | Engine Power | Numeric |
| Make | Categorical | Fuel Type | Categorical |
| Initial Registration | Date | Transmission | Categorical |
| Model | Categorical | Euro Emissions Std | Categorical |
| Model Variant | Categorical | Sales Date | Date |
| Brand | Categorical | Sales Price | Numeric |
5. Experimental Setting
5.1. Dataset
Given the absence of large-scale benchmark datasets for used car pricing, we train and evaluate the ProbSAINT model on externally acquired and standardized data extracted from real-world Business-to-Customer (B2C) online websites such as autoscout24, mobile.de, among others. The dataset that we derive consists of 65 features, which include 55 categorical values, 7 numerical, and 3 date features. Spanning a period from July 1, 2018, to August 20, 2022, the data comprises approximately 2 million records. Table 1 provides a summary of the key features of the B2C dataset. We train the model on these 65 features with the aim of predicting the final sales price, also conditioned on the offer duration for a specific used car.
5.2. Data Preprocessing
We convert categorical features into integer encodings using sklearn (Pedregosa et al., 2011). This encoding treats any new categories that may appear in the testing range as unknown. In our scenario, this could involve the introduction of a new vehicle or a different variant of an existing vehicle. We also preprocess the dataset by replacing any missing values with a placeholder value. For the ‘Date’ features in the dataset, we generate integer features such as day of the month, month of the year, and year. For the months, we create embeddings as follows.
These periodic embeddings reflect the seasonal nature of the different months. Furthermore, we also incorporate the absolute time information by determining the number of days from a specified date to capture any trend information in the data.
5.3. Training and Evaluation
In our experiments, we adopt a time-wise split to divide the dataset into training, validation, and testing data. For example, if ‘2022-03-20’ is set as the beginning of the testing period, all records up to ‘2022-02-20’ form the training data. The validation data is composed of the last month’s data, spanning from ‘2022-02-20’ to ‘2022-03-20’, while the testing data includes three months of records, from ‘2022-03-20’ to ‘2022-06-20’. This time-wise split reflects real-world scenarios where the testing data lies in the future. Consequently, we create two versions of the B2C data: ‘B2C-March’, which starts the testing period on ‘2022-03-20’, and ‘B2C-June’, which starts the testing period on ‘2022-05-20’. Although retraining on the validation data could be a beneficial strategy, for the current research, we limit the model, to train only on the training split. A previous study (Jawed et al., 2023) on a similar dataset reported minimal to no performance enhancement after retraining on the validation data.
For the task of probabilistic prediction, all the neural network models, and the NGBoost model, were trained using Negative Log Likelihood (NLL) as outlined in Equation 1. The CatBoost model, which offers uncertainty quantification, was trained using the ‘RMSEWithUncertainty’ loss function. Regardless of the loss function used during training, we employ NLL as a metric to assess the quality of probabilistic predictions. In addition, for the evaluation of non-probabilistic point prediction tasks, we utilize Mean Absolute Error (MAE) and Mean Absolute Percentage Error (MAPE), which are defined as follows:
6. Probabilistic Price Prediction
Our results section begins with a comparison of ProbSAINT with other methods that offer probabilistic interpretations for tabular regression. We evaluate the model using the Negative Log Likelihood (NLL) as a probabilistic metric. Additionally, we report the deviation of the mean prediction () from the true selling price () using the Mean Absolute Percentage Error (MAPE).
The main focus of our research is to determine if the ProbSAINT model, which is trained on a distribution loss, can outperform the state-of-the-art boosting alternatives in quantifying uncertainty. In the following section, we first present the chosen baselines for our experiments, followed by an evaluation of the results in Table 2.
Baselines.
CatBoost, the system currently in use, serves as a primary baseline for our research. For uncertainty quantification, CatBoost provides an out-of-the-box uncertainty quantification measure when trained using the ”RMSEWithUncertainty” loss function, a model we refer to as ”CatBoostUn”. We describe below the core ideas for our chosen baselines.
-
(1)
MC-Dropout (Gal and Ghahramani, 2016) (ICML’16): MC-Dropout uses dropout during the testing phase as an approximate Bayesian inference in deep Gaussian processes. Here, we use the best performing SAINT model as the backbone for this method.
-
(2)
NGBoost (Duan et al., 2020) (ICML’20): NGBoost is a modular framework that learns using the ”Natural Gradient” descent as an alternative to stochastic gradient descent. NGBoost considers the parameters of a conditional distribution as targets for a multiparameter boosting algorithm.
-
(3)
CatBoostUn (Malinin et al., 2021) (ICLR’21): The well known CatBoost library allows uncertainty quantification of its predicted values when trained with the loss function ”RMSEWithUncertainty”. The model predicts the uncertainty from an ensemble-of-trees. The study claims that ensembles of gradient boasting models were able to successfully detect anomalous inputs.
-
(4)
ProbMLP: In order to contrast the importance of the SAINT architecture backbone in ProbSAINT, we use a deep Multi-Layer Perceptron (MLP) model as the base architecture.
| NLL | MAPE | |||||||
|---|---|---|---|---|---|---|---|---|
| B2C-March | B2C-June | B2C-March | B2C-June | |||||
| MC-Dropout | 22.145 | 1.128 | 11.099 | 0.256 | 0.058 | 0.000 | 0.056 | 0.000 |
| NGBoost | 8.462 | 0.058 | 8.228 | 0.017 | 0.059 | 0.001 | 0.055 | 0.001 |
| CatBoost | 8.491 | 0.003 | 8.217 | 0.001 | 0.063 | 0.000 | 0.057 | 0.000 |
| ProbMLP | 8.355 | 0.076 | 8.314 | 0.027 | 0.065 | 0.004 | 0.065 | 0.003 |
| ProbSAINT | 8.192 | 0.026 | 8.144 | 0.022 | 0.056 | 0.001 | 0.053 | 0.001 |
Analysis.
Table 2 presents a comparison of the proposed ProbSAINT with other methods used for uncertainty quantification. As observed from Table 2, despite extensive modifications to these GBDT methods, the NLL loss for these methods is higher than that of the proposed ProbSAINT model on both dataset splits. Interestingly, the high-quality probabilistic output from ProbSAINT does not compromise point prediction accuracy, as evidenced by the MAPE values for the corresponding models. The second best model in terms of the MAPE value is the MC-Dropout method that uses a SAINT backbone. The fact that the MC-Dropout model performs second best on the MAPE values is not a surprise here, as the underlying SAINT model was trained and tuned for the point prediction task. However, for the uncertainty quantification task the MC-Dropout method, that uses the dropout at testing phase, fails to capture uncertainty as shown by the NLL error rates. To summarize, while GBDT models are reliable for quick and accurate point predictions, ProbSAINT emerges as a far superior alternative for probabilistic forecasting.
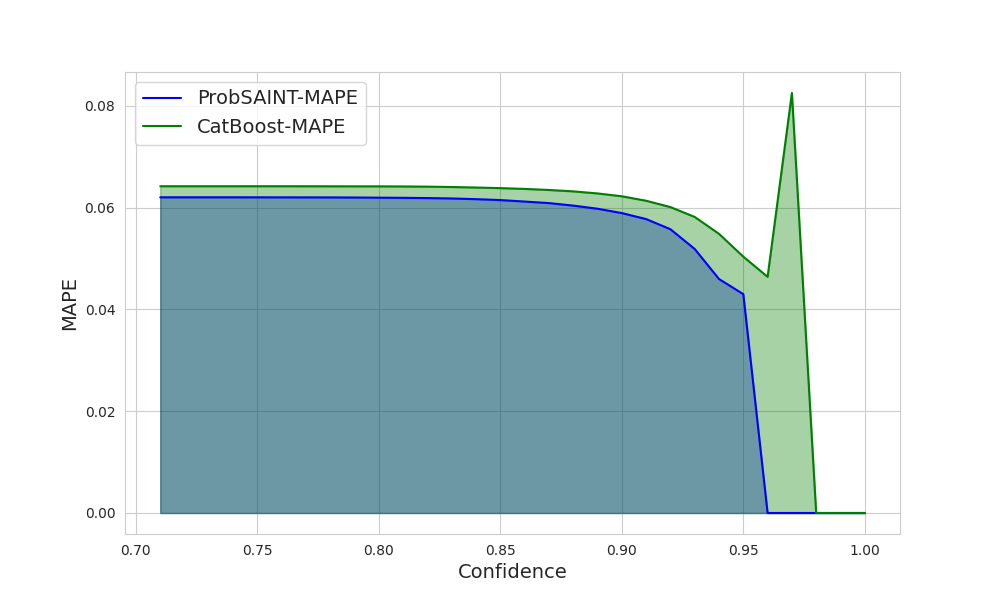
6.1. Probabilistic Prediction Quality at Multiple Confidence Levels
To further evaluate the benefits of employing ProbSAINT for uncertainty quantification, we graphically represent the confidence and the corresponding error for ProbSAINT and compare it with that of the CatBoostUn method, as depicted in Figure 2. In this context, we compute the confidence scores via
where indicates the mean and standard deviation of the prediction, respectively. As depicted in Fig. 2, CatBoostUn tends to make overconfident predictions, resulting in a larger area under the curve and outliers compared to ProbSAINT. More specifically, one can observe that the CatBoost error increases for highly confident predictions. Furthermore, even in the area of 0.93 to 0.95 confidence, the MAPE difference between ProbSaint and CatBoost increases. Thus, the ability of ProbSAINT to learn the standard deviation and mean using the NLL loss provides it with a clear advantage over the baseline.
6.2. Individual Price Predictions
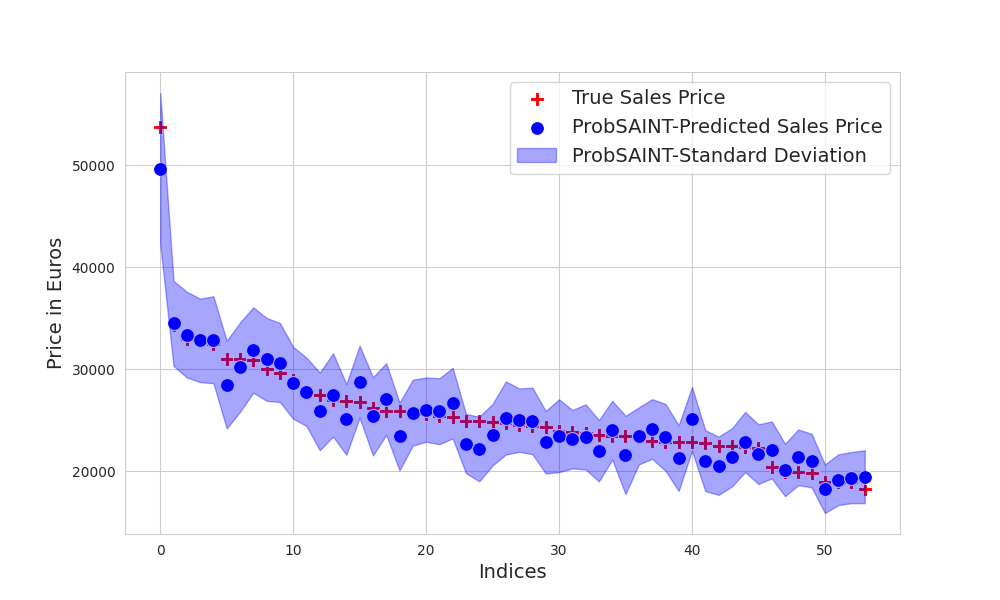
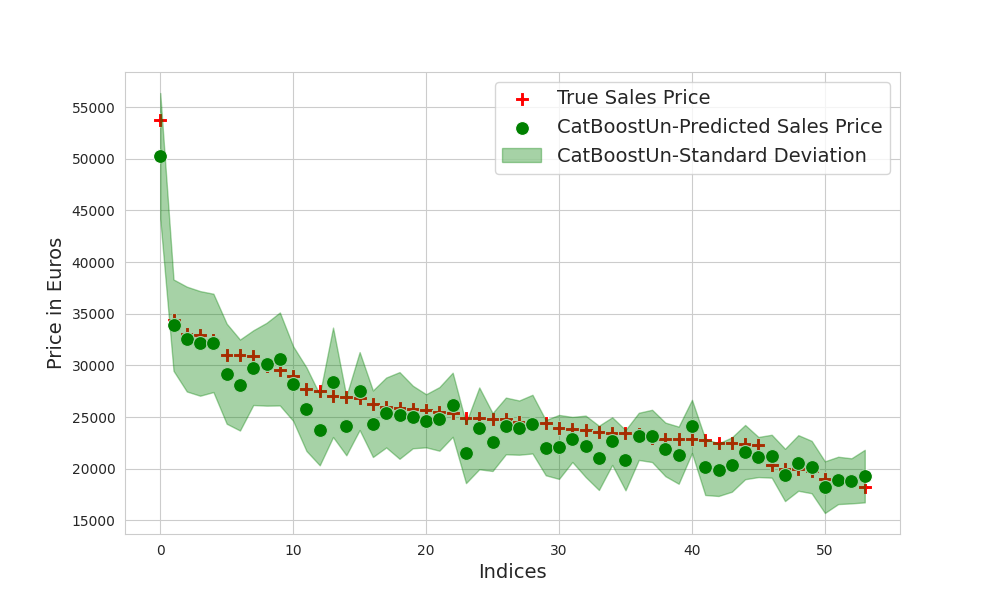
We furthermore compare the standard deviation and mean from ProbSAINT and CatBoostUn by plotting the difference to the true value in Figure 3. Here, the interesting observation is, that ProbSAINT slightly overpredict prices while CatBoost slightly underprices. However, for both methods the true value is always within the standard deviations, which indicates that both methods produce reasonable distributions.
6.3. Point Price Prediction
The probabilistic prediction results clearly show the advanatage of ProbSAINT. We now investigate wether the underlying model of ProbSAINT, namely SAINT, serves as a potent model for tabular regression on larger datasets. To address this auxiliary research question, we base our study on a previous survey paper (Borisov et al., 2022). This study compares various deep learning techniques with GBDTs and concludes that GBDTs outperform deep learning techniques for tabular tasks. However, the authors’ evaluation of their methods is based on a considerably smaller dataset, comprising nearly 20 thousand records for tabular regression, in contrast to the used-car pricing dataset, which contains 2 million rows. Consequently, we strive to answer this significantly relevant research question using results from Table 3.
Baselines.
As mention before, we consider GBDT methods as a strong baseline for our analysis as it has been shown to outperform other models in recent studies (Borisov et al., 2022; Grinsztajn et al., 2022). We choose additional baselines considering their superior performance on the previous study (Borisov et al., 2022). These are as follows.
-
(1)
KNN : K-Nearest Neighbor (KNN), identifies most similar data samples from the training data corresponding to the testing sample and averages the prediction across many samples.
-
(2)
MLP: Multi-Layer Perceptrons (MLP) are deep learning solutions that employ multiple layers of fully connected layers with ReLU non-linearity in between each layer.
-
(3)
LightGBM (Ke et al., 2017) (NeurIPS’17): A powerful gradient boosting technique that speeds up the conventional Gradient Boosted Decision Tree’s (GBDT), by ignoring instances with smaller gradients from the calculation of information gain and reduces the number of features by bundling mutually exclusive features.
-
(4)
XGBoost (Chen and Guestrin, 2016) (KDD’16): Another powerful scalable and effective gradient boosting technique widely used to achieve state-of-the-art performance in many machine learning challenges.
-
(5)
CatBoost (Prokhorenkova et al., 2018) (NeurIPS’18): Gradient boosting technique that uses the target statistics to encode high fidelity categorical features into numerical features. This allows CatBoost models to be trained with almost no preprocessing steps for efficient handling and with minimum information loss.
- (6)
We also experimented with additional baselines like the TabTransformer (Huang et al., 2020) and the FT-Transformer (Gorishniy et al., 2021) for the used car pricing task. These models encode each categorical variable with an attention layer, leading to large memory requirements to process the 2 million records with 56 categorical features in the used-car dataset. Hence, these model results could not be reported in the final evaluations. Additionally, recent work (Jawed et al., 2023) on used-car pricing compares these models on a much smaller dataset size and report almost double the error as that of the GBDT models for point prediction.
Analysis.
From the Table 3, we note that for larger datasets, such as the used-car pricing dataset, the SAINT model demonstrates performance on par with the GBDT models. The SAINT model outperforms in the ‘B2C-March’ split and exhibits comparable accuracy in the ‘B2C-June’ split for both MAPE and MAE metrics. Additionally, the results from Table 2 indicate that for ‘B2C-June’ the SAINT model is capable of similar performance as the GBDT methods in Table 3. It is also worth noting that the standard deviation values of the deep learning models are larger compared to the GBDT models, suggesting a higher sensitivity to random sources like parameter initialization. However, when compared to (Borisov et al., 2022) and (Jawed et al., 2023), where deep learning models face challenges with the regression task compared to GBDT models, we observe a clear indication that deep learning models could close the performance gap as the size of the dataset increases. However, the superiority of SAINT is not as clear as the one of ProbSAINT in the probabilistic setting. This indicates that our novel probabilistic training is a key factor for successful predictions.
| MAPE | MAE | |||||||
|---|---|---|---|---|---|---|---|---|
| B2C-March | B2C-June | B2C-March | B2C-June | |||||
| KNN | 0.175 | 0.002 | 0.173 | 0.002 | 6346.18 | 6398.92 | ||
| MLP | 0.064 | 0.001 | 0.067 | 0.001 | 2018.22 | 2133.89 | ||
| LightGBM | 0.058 | 0.000 | 0.053 | 0.000 | 1846.80 | 1732.12 | ||
| XGBoost | 0.058 | 0.000 | 0.054 | 0.000 | 1847.37 | 1737.77 | ||
| CatBoost | 0.058 | 0.000 | 0.053 | 0.000 | 1860.81 | 1713.94 | ||
| DeepFM | 0.058 | 0.000 | 0.065 | 0.002 | 1865.43 | 2006.16 | ||
| SAINT | 0.056 | 0.001 | 0.055 | 0.002 | 1834.51 | 1782.04 | ||
7. Probabilistic Dynamic Forecasting
The process of selling a used car involves a balancing act between the profit margin on the sale of a used-car and the volume of used-cars sold. In certain situations, it may be advantageous to sell the used-car as quickly as possible. Conversely, in other scenarios, it might be more beneficial to set a higher price for the used-car and allow it to remain listed on the platform for a longer duration.
The data considered in Section 5 includes the feature offer durations which indicates, the duration a specific car has been on the market at the time of sale. While this feature is beneficial during training and testing, it does not help in predicting the initial sales price for a new car entering the market. Here, a reasonable procedure is to identify a maximum of days that the car should be on the market, allow the model to predict the sales price with the offer durations being set to and with the offer durations being set to and choose a sales price between the two predicted values. This raises the question how ProbSAINT behaves with respect to varying this feature. Therefore, in this section, we investigate how the predicted prices vary for different models and different offer durations.
In this scenario, the task of pricing used cars can be viewed as a temporal forecasting task, where the objective is to predict the future price of an unknown used-car over various offer durations. However, unlike typical forecasting tasks, we do not have time-varying information for each used-car. Instead, we have a data point indicating the price at which the used-car was sold. Our used-car dataset comprises 2 million such data points, representing used-cars sold at various offer durations. The question then is: Can a model trained on these 2 million records learn the general market dynamics of how the selling price fluctuates across different offer durations for different used-cars?
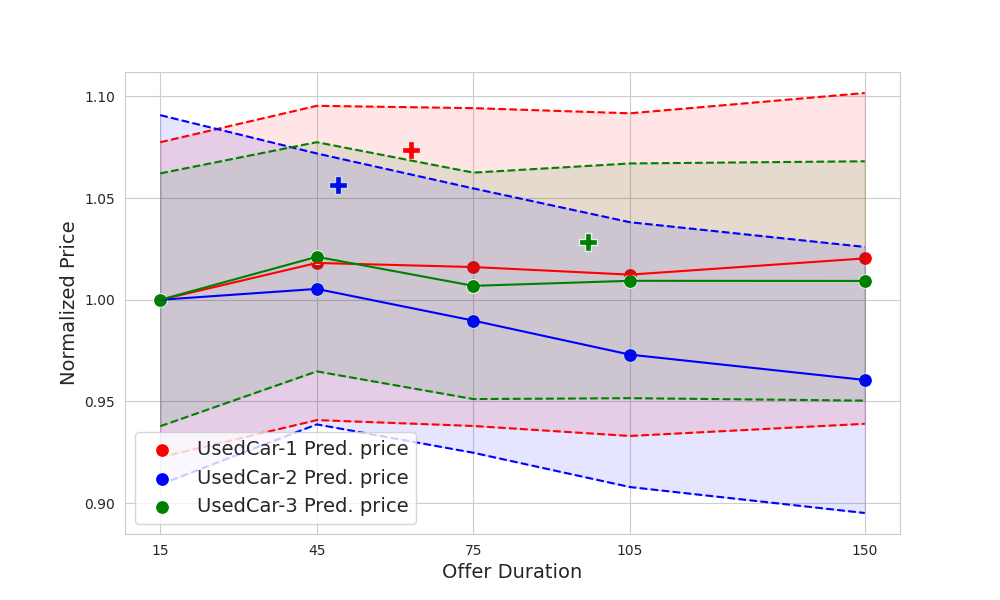
To answer this, we use a ProbSAINT model trained on B2C-March split, and choose 3 different used-cars for which all features except offer durations are fixed. Then, we let ProbSAINT predict the output distribution parameters and for different amount of offer durations, ranging from 15 to 150. This procedure of generating dynamical forecasts with ProbSAINT is shown in Algorithm 1. Figure 4 presents three distinct used cars, denoted as UsedCar-1, UsedCar-2, and UsedCar-3, each sold at different Offer durations. For instance, UsedCar-1 (represented in red) was sold after 62 days on the platform, while UsedCar-2 (in blue) and UsedCar-3 (in green) were sold after 48 and 98 days, respectively, as indicated by the plus symbol. The y-axis is normalized by the predicted price at 15 Offer duration to capture the underlying trend.
Analysis
Our results provide evidence that each model learns distinct market dynamics when it remains on the platform for an extended period. While UsedCar-1 and UsedCar-3’s price predictions do not show a clear trend with respect to increasing offer durations, ProbSAINT predicts a decreasing price trend for UsedCar-2 with an increasing offer duration. A possible outcome from the prediction is that the UsedCar-2 should be priced by risking a lower selling price due to the decreasing trend. It is further notable, that for all three models the price predicted after offer durations is higher than after . Thus, ProbSAINT indicates that keeping vehicles on the market for a short amount of time can be beneficial in contrast to immediate sales. We are of the opinion that understanding of these market dynamics could be advantageous in determining the best price for used cars.
| Model | Hyperparameters | Type | Values |
|---|---|---|---|
| SAINT ProbSAINT MC-Dropout | Dim | Categorical | [32, 64, 128, 256] |
| Depth | Categorical | [1, 2, 3, 6, 12] | |
| Heads | Categorical | [2, 4, 8] | |
| Dropout | Categorical | [0, 0.1, 0.2, 0.3, 0.4, 0.5, 0.6, 0.7, 0.8] | |
| MLP | Dim | Ordinal | (10-100) |
| Num. layers | Ordinal | (2, 5) | |
| Learning Rate | Continous | (0.0005, 0.001) | |
| NGBoost | Learning Rate | Continous | (001, 0.3) |
| Base | Categorical | [DecisionTree, GradBoost] | |
| Mini Batch Frac | Continous | (0.6, 1.0) | |
| CatBoost CatBoostUn | Learning Rate | Continous | (0,01, 0.3) |
| Max Depth | Ordinal | (2, 12) | |
| L2 Leaf Reg. | Continous | (0.5, 30) | |
| DeepFM | Droupout | Continous | (0, 0.9) |
| XGBoost | Max Depth | Ordinal | (2, 12) |
| Alpha | Continous | (1e-8, 1.0) | |
| Lambda | Continous | (1e-8, 1.0) | |
| Eta | Continous | (0.01, 0.3) | |
| LightGBM | Learning Rate | Continous | (0,01, 0.3) |
| Lambda L1 | Continous | (1e-8, 10) | |
| Lambda L2 | Continous | (1e-8, 10) | |
| Num. Leaves | Ordinal | (2, 4096) | |
| KNN | Neighbors | Ordinal | (3, 42) |
8. Hyperparameters
For hyperparameter tuning each model, we use Optuna (Akiba et al., 2019) with the default Tree-structured Parzen Estimator (TPE) algorithm. The TPE algorithm is a Sequential Model Based Optimization strategy (SMBO) that suggests the next best trial parameters conditioned on the evaluated trials from a pre-defined hyperparameter space. This facilitates effective hyperparameter search within an allocated budget. For our experiments, we set the budget as 20 trials for the Gradient Boosted Decision Tree (GBDT) models and 10 trials for the neural network models. The trials were defined considering the fact that the neural network models require longer training times in comparison to GBDT models. The model specific hyperparameters are listed in Table 4.
9. Deployed System
Our currently deployed system utilizes a CatBoost model similar, but not exactly as described in section 6 that predicts the ‘sales price’ based on the 65 features mentioned in section 5.2. The CatBoost pricing model, deployed on AWS, is live for the German market and was subsequently expanded to include the Italian, Spanish, and Czech markets. In 2023, the CatBoost solution predicted almost 2M pricing requests, with a human expert acceptance rate of 50-60%.
10. Conclusion and Future Work
We presented ProbSAINT, a novel deep neural network for probabilistic regression on tabular data. By adapting the well-established SAINT approach and incorporating a 2-layer MLP head, ProbSAINT is able to predict distributions instead of point predictions. Thus, ProbSAINT is able to provide confidence values for its predictions. This is especially required in real-world applications where trustworthiness is crucial, such as predicting for used car prices. Our experiments on real-world industry datasets show that ProbSAINT outperforms boosting-based state-of-the-art baselines for probabilistic regression tasks. Further experiments indicate that ProbSAINTs prediction are particularly accurate when it has a high confidence, validating that ProbSAINT computes reasonable target distributions. Finally, we demonstrate that ProbSAINT can be used to compute prices for multiple offer durations, allowing it to include background information like the maximal desired time in the market.
In this study, we trained ProbSAINT using an end-to-end approach, without the use of auxiliary or self-supervised pre-training tasks. In future work, we plan to develop useful pre-training tasks to leverage larger volume of additional data. However, determining the optimal pre-training strategy for probabilistic industrial applications such as used car pricing is an open problem. ProbSAINT’s ability to provide reliable point- and probabilistic outputs paves the way for future work on adapting established deep learning techniques like transfer learning and self-supervised representation learning.
References
- (1)
- Abdelhamed et al. (2019) Abdelrahman Abdelhamed, Marcus A. Brubaker, and Michael S. Brown. 2019. Noise Flow: Noise Modeling With Conditional Normalizing Flows. In Proceedings of the IEEE/CVF International Conference on Computer Vision (ICCV).
- Akiba et al. (2019) Takuya Akiba, Shotaro Sano, Toshihiko Yanase, Takeru Ohta, and Masanori Koyama. 2019. Optuna: A Next-generation Hyperparameter Optimization Framework. In Proceedings of the 25th ACM SIGKDD International Conference on Knowledge Discovery and Data Mining.
- Alarab et al. (2021) Ismail Alarab, Simant Prakoonwit, and Mohamed Ikbal Nacer. 2021. Illustrative discussion of mc-dropout in general dataset: uncertainty estimation in bitcoin. Neural Processing Letters 53 (2021), 1001–1011.
- Bajari et al. (2015) Patrick Bajari, Denis Nekipelov, Stephen P Ryan, and Miaoyu Yang. 2015. Machine learning methods for demand estimation. American Economic Review 105, 5 (2015), 481–485.
- Borisov et al. (2022) Vadim Borisov, Tobias Leemann, Kathrin Seßler, Johannes Haug, Martin Pawelczyk, and Gjergji Kasneci. 2022. Deep neural networks and tabular data: A survey. IEEE Transactions on Neural Networks and Learning Systems (2022).
- Chen and Guestrin (2016) Tianqi Chen and Carlos Guestrin. 2016. XGBoost: A Scalable Tree Boosting System. Proceedings of the 22nd ACM SIGKDD International Conference on Knowledge Discovery and Data Mining (2016). https://api.semanticscholar.org/CorpusID:4650265
- Cui et al. (2022) Baoyang Cui, Zhonglin Ye, Haixing Zhao, Zhuome Renqing, Lei Meng, and Yanlin Yang. 2022. Used Car Price Prediction Based on the Iterative Framework of XGBoost+LightGBM. Electronics 11, 18 (2022). https://doi.org/10.3390/electronics11182932
- Duan et al. (2020) Tony Duan, Avati Anand, Daisy Yi Ding, Khanh K Thai, Sanjay Basu, Andrew Ng, and Alejandro Schuler. 2020. Ngboost: Natural gradient boosting for probabilistic prediction. In International conference on machine learning. PMLR, 2690–2700.
- Foong et al. (2020) Andrew Foong, David Burt, Yingzhen Li, and Richard Turner. 2020. On the expressiveness of approximate inference in bayesian neural networks. Advances in Neural Information Processing Systems 33 (2020), 15897–15908.
- Gal and Ghahramani (2016) Yarin Gal and Zoubin Ghahramani. 2016. Dropout as a bayesian approximation: Representing model uncertainty in deep learning. In international conference on machine learning. PMLR, 1050–1059.
- Gorishniy et al. (2021) Yury Gorishniy, Ivan Rubachev, Valentin Khrulkov, and Artem Babenko. 2021. Revisiting deep learning models for tabular data. Advances in Neural Information Processing Systems 34 (2021), 18932–18943.
- Grinsztajn et al. (2022) Léo Grinsztajn, Edouard Oyallon, and Gaël Varoquaux. 2022. Why do tree-based models still outperform deep learning on typical tabular data?. In Advances in Neural Information Processing Systems 35: Annual Conference on Neural Information Processing Systems 2022, NeurIPS 2022, New Orleans, LA, USA, November 28 - December 9, 2022. http://papers.nips.cc/paper_files/paper/2022/hash/0378c7692da36807bdec87ab043cdadc-Abstract-Datasets_and_Benchmarks.html
- Guo et al. (2017) Huifeng Guo, Ruiming Tang, Yunming Ye, Zhenguo Li, and Xiuqiang He. 2017. DeepFM: A Factorization-Machine based Neural Network for CTR Prediction. IJCAI abs/1703.04247 (2017). https://api.semanticscholar.org/CorpusID:970388
- Huang et al. (2020) Xin Huang, Ashish Khetan, Milan Cvitkovic, and Zohar Karnin. 2020. Tabtransformer: Tabular data modeling using contextual embeddings. arXiv preprint arXiv:2012.06678 (2020).
- Intelligence (2022) Mordor Intelligence. 2022. Used Cars Market in Germany Size and Share Analysis. https://www.mordorintelligence.com/industry-reports/germany-used-car-market. Accessed: 2024-05-01.
- Jawed et al. (2023) Shayan Jawed, Jan Stening, and Lars Schmidt-Thieme. 2023. Pricing Used Vehicles at Volkswagen Financial Services AG. In 2023 IEEE International Conference on Big Data (BigData). IEEE Computer Society, 1736–1743.
- Ke et al. (2017) Guolin Ke, Qi Meng, Thomas Finley, Taifeng Wang, Wei Chen, Weidong Ma, Qiwei Ye, and Tie-Yan Liu. 2017. LightGBM: A Highly Efficient Gradient Boosting Decision Tree. In Neural Information Processing Systems. https://api.semanticscholar.org/CorpusID:3815895
- Lakshminarayanan et al. (2017) Balaji Lakshminarayanan, Alexander Pritzel, and Charles Blundell. 2017. Simple and scalable predictive uncertainty estimation using deep ensembles. Advances in neural information processing systems 30 (2017).
- Malinin et al. (2021) Andrey Malinin, Liudmila Prokhorenkova, and Aleksei Ustimenko. 2021. Uncertainty in gradient boosting via ensembles. ICLR (2021).
- Nelder and Wedderburn (1972) John Ashworth Nelder and Robert WM Wedderburn. 1972. Generalized linear models. Journal of the Royal Statistical Society Series A: Statistics in Society 135, 3 (1972), 370–384.
- Papamakarios et al. (2021) George Papamakarios, Eric Nalisnick, Danilo Jimenez Rezende, Shakir Mohamed, and Balaji Lakshminarayanan. 2021. Normalizing flows for probabilistic modeling and inference. The Journal of Machine Learning Research 22, 1 (2021), 2617–2680.
- Pedregosa et al. (2011) Fabian Pedregosa, Gaël Varoquaux, Alexandre Gramfort, Vincent Michel, Bertrand Thirion, Olivier Grisel, Mathieu Blondel, Peter Prettenhofer, Ron Weiss, Vincent Dubourg, et al. 2011. Scikit-learn: Machine learning in Python. Journal of machine learning research 12, Oct (2011), 2825–2830.
- Prokhorenkova et al. (2018) Liudmila Prokhorenkova, Gleb Gusev, Aleksandr Vorobev, Anna Veronika Dorogush, and Andrey Gulin. 2018. CatBoost: unbiased boosting with categorical features. Advances in neural information processing systems 31 (2018).
- Rasul et al. (2020) Kashif Rasul, Abdul-Saboor Sheikh, Ingmar Schuster, Urs Bergmann, and Roland Vollgraf. 2020. Multivariate probabilistic time series forecasting via conditioned normalizing flows. arXiv preprint arXiv:2002.06103 (2020).
- Samruddhi and Kumar (2020) K Samruddhi and R Ashok Kumar. 2020. Used car price prediction using k-nearest neighbor based model. Int. J. Innov. Res. Appl. Sci. Eng.(IJIRASE) 4 (2020), 629–632.
- Shwartz-Ziv and Armon (2022) Ravid Shwartz-Ziv and Amitai Armon. 2022. Tabular data: Deep learning is not all you need. Information Fusion 81 (2022), 84–90.
- Somepalli et al. (2021) Gowthami Somepalli, Micah Goldblum, Avi Schwarzschild, C Bayan Bruss, and Tom Goldstein. 2021. Saint: Improved neural networks for tabular data via row attention and contrastive pre-training. arXiv preprint arXiv:2106.01342 (2021).
- Sprangers et al. (2021) Olivier Sprangers, Sebastian Schelter, and Maarten de Rijke. 2021. Probabilistic gradient boosting machines for large-scale probabilistic regression. In Proceedings of the 27th ACM SIGKDD conference on knowledge discovery & data mining. 1510–1520.
- Srivastava et al. (2014) Nitish Srivastava, Geoffrey E. Hinton, Alex Krizhevsky, Ilya Sutskever, and Ruslan Salakhutdinov. 2014. Dropout: a simple way to prevent neural networks from overfitting. J. Mach. Learn. Res. 15 (2014), 1929–1958. https://api.semanticscholar.org/CorpusID:6844431
- Tchuente and Nyawa (2022) Dieudonné Tchuente and Serge Nyawa. 2022. Real estate price estimation in French cities using geocoding and machine learning. Annals of Operations Research (2022), 1–38.
- Vaswani et al. (2017) Ashish Vaswani, Noam Shazeer, Niki Parmar, Jakob Uszkoreit, Llion Jones, Aidan N Gomez, Łukasz Kaiser, and Illia Polosukhin. 2017. Attention is all you need. Advances in neural information processing systems 30 (2017).
- Venkatasubbu and Ganesh (2019) Pattabiraman Venkatasubbu and Mukkesh Ganesh. 2019. Used cars price prediction using supervised learning techniques. Int. J. Eng. Adv. Technol.(IJEAT) 9, 1S3 (2019).
- Wang and Wu (2018) Changchun Wang and Hui Wu. 2018. A new machine learning approach to house price estimation. New Trends in Mathematical Sciences 6, 4 (2018).