Asteroid collisions: expected visibility and rate
Abstract
Asteroid collisions are one of the main processes responsible for the evolution of bodies in the main belt. Using observations of the Dimorphos impact by the DART spacecraft, we estimate how asteroid collisions in the main belt may look in the first hours after the impact. If the DART event is representative of asteroid collisions with a m size impactor, then the light curves of these collisions will rise on time scales of about s and will remain bright for about one hour. Next, the light curve will decay on a few hours time scale to an intermediate luminosity level in which it will remain for several weeks, before slowly returning to its baseline magnitude. This estimate suffers from several uncertainties due to, e.g., the diversity of asteroid composition, their material strength, and spread in collision velocities. We estimate that the rate of collisions in the main belt with energy similar or larger than the DART impact is of the order of 7000 per year ( dex). The large range is due to the uncertainty in the abundance of -m size asteroids. We estimate the magnitude distribution of such events in the main belt, and we show that % of these events may peak at magnitudes brighter than 21. The detection of these events requires a survey with hr cadence and may contribute to our understanding of the asteroids’ size distribution, collisional physics, and dust production. With an adequate survey strategy, new survey telescopes may regularly detect asteroid collisions.
Subject headings:
asteroids — Collisional physics — Impact processes — Origin, Solar System —1. Introduction
Collisions between asteroids are one of the main processes responsible for shaping the numbers, size distribution, spins, and dynamical evolution of objects in the main belt (Dohnanyi 1969; Holsapple & Housen 2019; Holsapple 2022; Masiero et al. 2015). Furthermore, collisions are likely responsible for the replenishment of some of the zodiacal dust (Durda & Dermott 1997).
Asteroid collisions have likely already been detected several times: Prominent examples include the (596) Scheila outburst (Jewitt et al. 2011; Moreno et al. 2011; Ishiguro et al. 2011; Bodewits et al. 2011), and the P/2010A2 outburst (Jewitt et al. 2010; see however Agarwal et al. 2012). Many additional cases of asteroid activities were reported, some of which may be due to collisions (e.g., Jewitt & Hsieh 2022; Chandler et al. 2023a, b).
The most studied event is likely the (596) Scheila outburst. The event was discovered by Larson et al. (2010), likely about one week after the impact (e.g., Ishiguro et al. 2011). The slow ejecta mass was estimated to be of the order of to a few times kg (e.g., Jewitt et al. 2011; Hsieh et al. 2012; Ishiguro et al. 2011) expanding at a velocity of the order of 50 m s-1 (e.g., Moreno et al. 2011). It was estimated this event was produced by a small asteroid, several tens of meter size, colliding with Scheila at a velocity of about 5 km s-1.
One shortcoming of the previous detections is that they were likely caught days or weeks after the impact when the slow-moving ejecta dominates the light from the event. Based on the known collision events, Bodewits et al. (2011) estimated that collisions, as bright as the Sheila event, occur in the main belt about once every 5 years. Therefore, it is likely that minor collisions are much more frequent and can be detected regularly.
McLoughlin et al. (2015) used the cratering-size laws of Housen (2007) and Housen & Holsapple (2011) to estimate the brightness increase in the weeks after the impact. Their study implies a low probability of detection of asteroid collisions using surveys like Pan-STARRS (Chambers et al. 2016) and Catalina Sky Survey (Christensen et al. 2019). This is mainly due to the expectation that the week-long transients expected from asteroid collisions are too faint.
Recently, the DART mission (Cheng et al. 2018; Rivkin et al. 2021) gave us a glimpse at what an asteroid collision may look like immediately after the impact (Daly et al. 2023; Li et al. 2023; Graykowski et al. 2023; Shestakova et al. 2023; Ofek et al. 2024). Another example was the Deep Impact collision with comet 9P/Tempel (e.g., A’Hearn et al. 2005; A’Hearn & Combi 2007). The -band light curve of the DART impact event rises by about 2 magnitudes on a time scale of 100 s (Ofek et al. 2024). After about ten minutes, the light curve declines to an intermediate level, and after one day, it starts to decline, on a few days’ time scale, to its baseline magnitude. In Ofek et al. (2024), we argued that the finite rise time is due to a transition from an optically thick to an optically thin phase, while the decline represents the time in which some of the ejecta exits the photometric aperture in which the flux is measured. The DART-impact light curve can be explained by ejecta with two main velocity components. Fast ejecta moving at 1.6 km s-1 (Shestakova et al. 2023; Ofek et al. 2024), and slow ejecta moving at velocities of up to m s-1 (e.g., Li et al. 2023; Moreno et al. 2023; Jewitt et al. 2023; Ofek et al. 2024). Shestakova et al. (2023) found that the fast-ejecta light is dominated by emission lines of neutral species (Na I 5890, 5896 Å, K I 7699 Å, Li I 6708 Å). The slow ejecta, on the other hand, are composed of reflecting m to meter size particles (e.g., Li et al. 2023; Jewitt et al. 2023; Moreno et al. 2023; Kim & Jewitt 2023; Polishook et al. 2023; Ofek et al. 2024). While the fast ejecta were bright in the UV and visible bands, they were not detected in the band (Ofek et al. 2024). This suggests that the -band does not contain any prominent emission lines.
The DART-Dimorphos impact velocity was about 6.1 km s-1 (Cheng et al. 2023), similar to the expected mean asteroid collision velocity of about 6 km s-1 (Farinella & Davis 1992; Holsapple & Housen 2019). The DART impactor mass was 579.4 kg (Cheng et al. 2018, 2023), which is presumably the typical mass of an asteroid with a radius of 0.3-m (assuming a density of about 2.2 g cm-3). Impactors with higher mass will likely produce more ejecta and therefore brighter events (e.g., Petit & Farinella 1993; Holsapple & Housen 2019; Holsapple 2022).
We use the DART-Dimorphos impact light curve to show that asteroid collisions in the main belt will produce a hr duration transient, and we estimate the magnitude distribution of these events. We also estimate the relevant collision and detection rate for such events, and discuss their detectability and possible survey strategies to search for these collisions. Detecting asteroid collisions shortly after the impact, will allow us to compare these events with the DART impact, study asteroid collision physics, surface weathering, estimate the frequency of meter-sized asteroids, and evaluate the zodiacal dust production rate from asteroid collisions. The calculations in this paper were performed using tools available111https://github.com/EranOfek/AstroPack tag v1.1 in Ofek (2014); Ofek et al. (2023).
2. Scaling the DART light curve to the Main Belt
The uncertainties regarding the outcome of asteroid collisions are large and depend on multiple parameters like the material strength, structure, impact angle, and more (e.g., Dohnanyi 1969; Gault & Wedekind 1969; Luther et al. 2018; Holsapple & Housen 2019; Holsapple 2022; Statler et al. 2022). Another important parameter are the masses of the impactor and target. The asteroid size distribution, even at small sizes, likely follows a steep power law (e.g., Dohnanyi 1969; Pan & Sari 2005). Therefore, the collision rate is dominated by the smallest impactors and targets. Given this fact, we will hereafter use the approximation that all collisions between asteroids larger than m, generate as bright events as the DART event. In any case, our results only provide an order-of-magnitude estimate of asteroid collision visibility. In addition, our rate estimate (§4) suffers from major uncertainties due to the unknown size distribution, and numbers, of small ( m) asteroids.
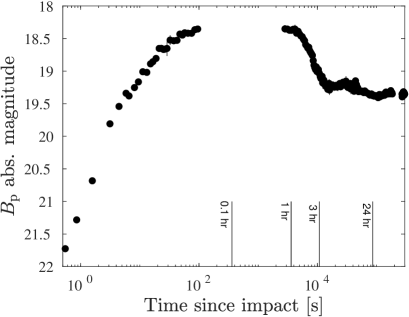
We adopt the light curve of the DART-Dimorphos impact as was reported by Ofek et al. (2024). This data set was obtained using the Large Array Survey Telescope (LAST; Ofek & Ben-Ami 2020; Ben-Ami et al. 2023) and produced by the LAST data reduction pipeline (Ofek et al. 2023; Ofek 2014; Soumagnac & Ofek 2018; Ofek 2019). LAST observations were taken without a filter, in a band covering the Å to Å and calibrated to the GAIA band (Gaia Collaboration et al. 2016; Evans et al. 2018; Gaia Collaboration et al. 2021). Here, we adopt the LAST light curve obtained using an aperture radius of . Figure 1 shows the Dimorphos-DART light curve if it had occurred at a distance of 1 AU from the observer and 1 AU from the Sun, with a phase angle of deg. We assume that the DART impact peaked at a Vega222The conversion between AB magnitude to Vega magnitude in the band is . magnitude of 12.8 in the GAIA- band (after removing the Didymos pre-impact light). The DART impact took place at a phase angle of deg, a solar distance of AU, and Geocentric distance of AU. We also assume that the baseline contribution of the target and impactor asteroids are negligible (i.e., the baseline flux of Didymos was removed). No time stretch was applied, for data points up to the peak of the event (at s), while for all times after 100 s, we stretch the time by a factor of 13 (; i.e., the ratio of the observer distance to the DART-impact distance). The reason is that in early times the light curve rise is dominated by the transition from optically thick to optically thin scattering, which is independent of the distance to the observer. However, when the material becomes optically thin (during maximum light), the surface area of the scattering particles is constant and the flux will start to decline only when the expanding ejecta become resolved, and some of the flux exits the photometric aperture. A possible caveat is that emission lines produced by neutral species with short lifetimes are present in the aperture. For example, Shestakova et al. (2023) estimated that at a distance of 1 AU from the Sun333This time scale increases with the distance from the Sun., Na I and K I will become ionized on a time scale of 1 day, while Li I will become ionized within about 1 hr. Since, at least in the case of the DART impact, Na I and K I line dominate the emission, we do not expect significant variations in the total emitted light444By total emitted light we mean the light measured in infinite photometric aperture., in the first several hours after the impact.
In Ofek et al. (2024), we present an optical-thickness model for the rise time of the DART-impact light curve. This rise-time is roughly given by
| (1) |
Here, is the ejecta mass, is the total absorption and scattering cross-section of the particles in the ejecta, is the cross-section radius of the particles, and is the ejecta velocity. The rise time, therefore, may provide some information on the ejecta mass, which presumably depends on the impactor mass. However, , , and are uncertain, and therefore, a robust estimation of the mass is currently not possible.
The relationship between the properties of the light curve and the phase angle remains uncertain. Specifically, if we assume that the emission from the fast ejecta is primarily governed by emission lines resulting from resonant scattering (Shestakova et al. 2023), the geometry of the ejecta could influence the absorption probability. Consequently, this variation may impact the overall brightness of the event. However, we do not anticipate a substantial dependence on the phase angle unless some of the light is due to reflectance from small particles. For the small particles (m) in the slow ejecta, phase angle-dependent Mie scattering dominates. For larger particles, collective effects like coherent backscattering and shadow may become important (e.g., Hapke 1986; Hapke et al. 1993). Since the prompt visibility of 1-m size asteroid collisions is presumably dominated by the fast ejecta, we will ignore phase angle effects. Due to a lack of additional information, we assume that the DART impact scattering properties are representative of asteroid collisions.
3. The apparent magnitude distribution of collision events
To calculate the magnitude distribution of collision events, we need the heliocentric () and Geocentric () distance distribution of asteroids in the main belt. Generating ephemerides to known numbered asteroids at random times results in a non-uniform ecliptic longitude distribution with peak-to-valley difference, relative to the mean, of about 70%. To obtain the mean magnitude distribution, we create a mock catalog of asteroids by generating ephemerides for all known numbered asteroids555Orbital elements from http://ssd.jpl.nasa.gov/dat/ELEMENTS.NUMBR.gz () between 2000 Jan 1 till 2001 Jan 1, in steps of 10 days. This resulted in a mock catalog with about asteroids (i.e., the position of each asteroid is evaluated at multiple times). This reduces the variations in the ecliptic longitude distribution to about666As we increase the catalog size by a factor of about 36 we expected a decrease in the variations by about . 10%. We included in the catalog only objects with semi-major axis in the range of 1.7 to 5.5 AU. About 63% of the asteroids in this mock catalog have Sun-observer-asteroid angle larger than 50 deg.
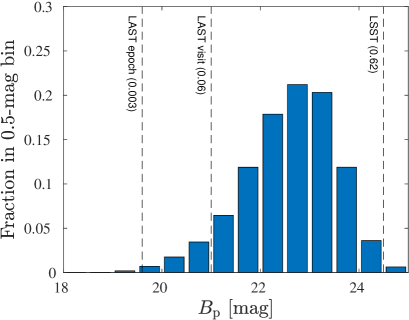
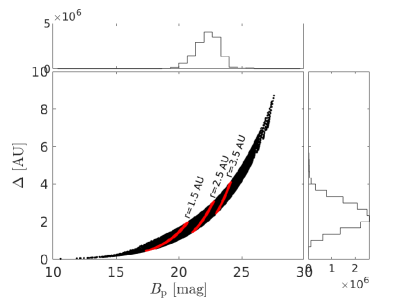
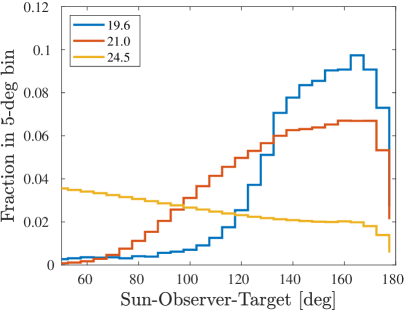
For each simulated asteroid, we scale the peak magnitude of the DART impact (12.6 mag), according to its heliocentric () and geocentric () distances. The expected magnitude distribution, of events with Sun-Observer-Asteroid angle larger than 50 deg, is shown in Figure 2. The dashed vertical lines represent limiting magnitudes of 19.6, 21.0, and 24.5. In parenthesis, next to each line, we give the estimated fraction of events brighter than that marked by the corresponding line (i.e., the cumulative sum of the histogram was multiplied by , which is the fraction of asteroids with Sun-Observer-Asteroid angle larger than 50 deg.). In Figure 3, we show the magnitude vs. distribution. Figure 4 shows the probability distribution of the Sun-Observer-Asteroid angle for collision events brighter than a magnitude of 19.6 (blue), 21.0 (magenta), and 24.5 (yellow).
The time, from impact, it takes to the light curve of the event to start decaying is roughly equal to the time it takes the ejecta to cross the photometric aperture. For a DART-like impact, with ejecta velocity of the order of 10 m s-1, and photometric aperture of about , this time scale is of the order of:
| (2) |
This relation was normalized such that the duration of the DART impact at AU is about 200 s matching the duration observed by Ofek et al. (2024). Collision simulations suggest that the fastest parts of the ejecta from asteroid collisions move at velocities of the order of 0.1 to 0.4 of the impact velocity (e.g., Luther et al. 2018). If accurate, this range would introduce about a half-order of magnitude uncertainty in the duration of the events.
We note that in the Scheila (596) event, the magnitude of the extended dust cloud was about 14.4 mag which corresponds to an absolute planetary magnitude777Defined as the magnitude at AU, AU, and at opposition, although in the Scheila case, the Sun-Observer-Asteroid angle was about 115 deg when it was discovered. of about 10. This is more than 8 magnitudes brighter than the fast-ejecta brightness of the Dimorphos-DART impact. This suggests that the Scheila (596) event was generated by an impactor with a mass much larger than that of the DART spacecraft. However, as estimated by Bodewits et al. (2011) such events are relatively rare – about one event every five years.
The DART impact was also detected using Swift-UVOT (Gehrels et al. 2004; Roming et al. 2005) in the near ultraviolet (NUV) band (Ofek et al. 2024), peaking at about 16.4 mag. Such events in the band can be potentially detected by ULTRASAT (Sagiv et al. 2014; Shvartzvald et al. 2023). Therefore, we also calculate the expected magnitude distribution in the band and find that the fraction of collision events at Sun-Observer-Asteroid angles larger than 50 deg, and brighter than the limiting magnitude of ULTRASAT in 900 s, is about . This suggests that the rate of such events in the is low.
We also estimate the fraction of events for a TESS-like observatory (Ricker et al. 2015). For a limiting magnitude of 17.8 in 200 s, the fraction of events that may be detected is about .
4. Collision rate
The collision rate of asteroids in the main belt is given by:
| (3) |
Here is the target radius, is the impactor radius, is the number of asteroid targets with radius larger than , is the same for the impactor, and is the mean intrinsic collision probability defined such that the number of collisions between two particles occurrs in a time interval is . Farinella & Davis (1992) used simulations to estimate the average intrinsic collision probability in the main belt: km-2 yr-1. This value was estimated based on a sample of 682 asteroids with diameter km. Therefore, we assume that this collision probability is also valid for smaller asteroids. The value of depends, in order of importance, on the semi-major axis, inclination, and eccentricity. However, given that the main uncertainty in our estimate is due to the poorly constrained number of small asteroids, here we use the average intrinsic collision probability. We note that we tested the effect of the semi-major axis dependency of on the magnitude distribution in Figure 2 and found that it typically changes this plot by less than 10%. Additional caveats in the estimation of and the average collision speeds between asteroids are discussed in Farinella & Davis (1992).
Assuming target and impactor densities of about 2.2 g cm-3, an impactor with a kinetic energy equivalent to DART would have a radius m. From energy conservation, we constrain the the DART impact’s fast ejecta mass to kg, and therefore we need m. These requirements are based on very simplistic assumptions and in reality they can be different, e.g., due to the uncertainties in collision physics.
The cumulative number of asteroids is usually parameterized as a power law . However, the power-law index is size-dependent and also asteroid type-dependent (e.g., Yoshida & Nakamura 2007; Maeda et al. 2021; Garcia-Martin et al. 2023). The cumulative number of asteroids larger than about 0.4 m is not measured directly. Maeda et al. (2021) estimated that about main-belt asteroids have radii larger than 150 m. They also found that the average power law index, , is about for asteroids in the radius range of 150 m to 500 m. Rewriting Equation 3 with the power-law size distribution gives:
| (4) |
where, for radius measured in km and assuming an albedo of , (Figure 10 in Maeda et al. 2021). Given these values, and assuming that the power-law index, , is valid down to the asteroid size of m; m; and m, we find a main-belt asteroids collision rate of yr-1. If one assumes that the power-law can be extrapolated, the uncertainty on the power-law index, of about 5%, is translated to a factor of about 2 uncertainty on the number of m size asteroids. Another major uncertainty is related to and that are needed in order to produce a DART-like display. Therefore, the uncertainty of the collision rate is likely about an order of magnitude in each direction.
5. Survey strategies and collision detectability
Here, we discuss the requirements for a survey that can detect asteroid collisions efficiently. Given the expected short duration of these events (– hr), a relatively fast cadence of hr is crucial.
An efficient survey needs to cover the ecliptic region. Since, at any given moment, about 95% of the known main-belt asteroids are found within 20 deg of the ecliptic, covering deg of the ecliptic is sufficient. Furthermore, assuming no strong phase-angle dependencies, Figure 4 suggests that shallow surveys can detect only the brightest (nearest) events. Therefore, observing at elongations (i.e., angular separation between Sun and target) deg is most efficient. However, for deep surveys like LSST, most of the events will be detected at low elongations.
Given the expected high rate of asteroid collisions, of about events per day brighter than magnitude 21, an important question is why such events, with hr time scale, were not found in the past. Typically, sky surveys (e.g., Heinze et al. 2018; Chambers et al. 2016; Bellm et al. 2019) require at least two epochs in a single band, to identify astrophysical transients. This is required in order to reject imaging artifacts (e.g., cosmic rays), and satellite glints (e.g., Corbett et al. 2020; Nir et al. 2021a, b). Furthermore, these images needed to be separated in time to screen for unknown Solar System objects. However, asteroid collisions with light curves similar to those shown in Figure 1, will in most cases only be detected in less than four images, and they will not be recovered in the next days after the first detection. Therefore, using current typical cadences, most asteroid collision events will be missed. In that respect, the LAST survey strategy is an important advantage. Specifically, LAST observes every field with s exposure, called a visit. This visit strategy allows for cosmic ray and satellite glint mitigation, as well as for detecting the motion of most main belt asteroids in a single visit. Furthermore, LAST has the potential, in some cases, to detect flux variability in a single visit (6 min time scale). The probability of LAST capturing an event will depend on the exact survey strategy. For example, if the LAST high cadence survey of about 2000 deg2 will be conducted mainly near the ecliptic, then LAST may be able to detect collision events at a rate of the order of ten per year.
Another channel to discover asteroid collisions is via their extended emission and the tails they develop. Based on the DART experience, the brightness of the extended emission and tail is lower than the magnitude of the prompt brightening, which is the subject of this paper. For example, the brightness of the extended phase of the DART impact is a factor of two ( mag) below that of the prompt phase. Furthermore, the mass of the slow-ejecta in the DART impact is in the range of to kg (e.g., Kim & Jewitt 2023; Ofek et al. 2024) – this is between two to three orders of magnitude higher, than the conservation-of-energy upper limit on the mass of the fast ejecta. Releasing this amount of ejecta requires an asteroid whose radius is at least a factor of 5 larger than our assumed (Eq. 3). Assuming , this means that the rate of events that produces slow ejecta mass similar to that produced in the DART event, is at least two orders of magnitude smaller (i.e., ), compared to the rate we estimate for the prompt events. Assuming that the currently deepest surveys that cover a large fraction of the sky (e.g., Pan-STARRS; Chambers et al. 2016) is complete to a limiting magnitude of about 21888See transients detection magnitude distribution in https://www.wis-tns.org/stats-maps/plots., we expect that a Pan-STARRS-like survey will find asteroid collision events every year (see however, McLoughlin et al. 2015). Since, in the slow ejecta phase, these transients should be visible for at least several weeks, they should be found by ongoing surveys. Interestingly, from 2019 to 2021, on average, about 3 active asteroids were reported every year (e.g., Jewitt & Hsieh 2022). Although there are other reasons for asteroids to become active (e.g., rotational breakup), at least some of these detections may be due to collisions of small (10-m size) asteroids. Due to the large uncertainty, in our rate estimate, we conclude that the estimated high rate of collisions, presented in this paper, can not be ruled out based on existing data.
6. Discussion
The detection of asteroid collisions in real time, soon after the event, can be used to constrain the size distribution of asteroids and their evolution and provide feedback to collision simulations. Here, we use the DART impact as a benchmark for such collisions and estimate their observed properties and rate. We estimate that about 7000 collisions per year, with a brightness increase similar or larger than the DART impact, occur in the main belt. Furthermore, we estimate that about 6% of these events will be brighter, at peak, than magnitude 21. Therefore, we expect of the order of events per day brighter than magnitude 21 and at angular distances deg from the Sun.
Both the rate and visibility estimates are highly uncertain. The main reasons are the large uncertainty on the number of small ( m sized) asteroids, and the possible diversity in asteroids’ physical properties that can presumably modify the optical output, compared to the DART impact event. However, detecting asteroid collisions can reduce some of these uncertainties. The main goal of our estimate is to guide possible searches and to help design survey strategies.
Although bright asteroid collisions are presumably very common, we speculate that the main reasons that such events were not found previously by sky surveys such as PTF, PanSTARRS, ATLAS, and ZTF (e.g., Law et al. 2009; Chambers et al. 2016; Heinze et al. 2018; Bellm et al. 2019), hours after the impact, include: (i) the requirement of transient surveys for at least two detections separated by hr at the same sky location; and (ii) the requirement of asteroid surveys for (typically) four or more measurements over a time scale of days. These problems can be avoided using dedicated surveys, or awareness by the survey analysis team to the possibility of finding such events.
Acknowledgements
We thank an anonymous referee for useful comments on the manuscript. E.O.O. is grateful for the support of grants from the Benozio center, Willner Family Leadership Institute, Ilan Gluzman (Secaucus NJ), Madame Olga Klein - Astrachan, Minerva foundation, Israel Science Foundation, BSF-NSF, Israel Ministry of Science, Yeda-Sela, Sagol Weizmann-MIT, and the Rosa and Emilio Segré Research Award. D.P. is thankful to the Israeli space agency and their near-Earth asteroids mitigation efforts. This research is supported by the Israeli Council for Higher Education (CHE) via the Weizmann Data Science Research Center, and by a research grant from the Estate of Harry Schutzman.
References
- Agarwal et al. (2012) Agarwal, J., Jewitt, D., Weaver, H., Mutchler, M., & Drahus, M. 2012, in European Planetary Science Congress 2012, EPSC2012–729
- A’Hearn & Combi (2007) A’Hearn, M. F., & Combi, M. R. 2007, Icarus, 187, 1, doi: 10.1016/j.icarus.2006.12.011
- A’Hearn et al. (2005) A’Hearn, M. F., Belton, M. J. S., Delamere, W. A., et al. 2005, Science, 310, 258, doi: 10.1126/science.1118923
- Bellm et al. (2019) Bellm, E. C., Kulkarni, S. R., Graham, M. J., et al. 2019, PASP, 131, 018002, doi: 10.1088/1538-3873/aaecbe
- Ben-Ami et al. (2023) Ben-Ami, S., Ofek, E. O., Polishook, D., et al. 2023, arXiv e-prints, arXiv:2304.02719, doi: 10.48550/arXiv.2304.02719
- Bodewits et al. (2011) Bodewits, D., Kelley, M. S., Li, J. Y., et al. 2011, ApJ, 733, L3, doi: 10.1088/2041-8205/733/1/L3
- Chambers et al. (2016) Chambers, K. C., Magnier, E. A., Metcalfe, N., et al. 2016, arXiv e-prints, arXiv:1612.05560. https://arxiv.org/abs/1612.05560
- Chandler et al. (2023a) Chandler, C. O., Oldroyd, W. J., Trujillo, C. A., et al. 2023a, Research Notes of the American Astronomical Society, 7, 27, doi: 10.3847/2515-5172/acbbce
- Chandler et al. (2023b) Chandler, C. O., Oldroyd, W. J., Hsieh, H. H., et al. 2023b, Research Notes of the American Astronomical Society, 7, 102, doi: 10.3847/2515-5172/acd768
- Cheng et al. (2018) Cheng, A. F., Rivkin, A. S., Michel, P., et al. 2018, P&SS, 157, 104, doi: 10.1016/j.pss.2018.02.015
- Cheng et al. (2023) Cheng, A. F., Agrusa, H. F., Barbee, B. W., et al. 2023, Nature, doi: 10.1038/s41586-023-05878-z
- Christensen et al. (2019) Christensen, E., Africano, B., Farneth, G., et al. 2019, in EPSC-DPS Joint Meeting 2019, Vol. 2019, EPSC–DPS2019–1912
- Corbett et al. (2020) Corbett, H., Law, N. M., Soto, A. V., et al. 2020, ApJ, 903, L27, doi: 10.3847/2041-8213/abbee5
- Daly et al. (2023) Daly, R. T., Ernst, C. M., Barnouin, O. S., et al. 2023, Nature, doi: 10.1038/s41586-023-05810-5
- Dohnanyi (1969) Dohnanyi, J. S. 1969, JGR, 74, 2531, doi: 10.1029/JB074i010p02531
- Durda & Dermott (1997) Durda, D. D., & Dermott, S. F. 1997, Icarus, 130, 140, doi: 10.1006/icar.1997.5803
- Evans et al. (2018) Evans, D. W., Riello, M., De Angeli, F., et al. 2018, A&A, 616, A4, doi: 10.1051/0004-6361/201832756
- Farinella & Davis (1992) Farinella, P., & Davis, D. R. 1992, Icarus, 97, 111, doi: 10.1016/0019-1035(92)90060-K
- Gaia Collaboration et al. (2021) Gaia Collaboration, Brown, A. G. A., Vallenari, A., et al. 2021, A&A, 649, A1, doi: 10.1051/0004-6361/202039657
- Gaia Collaboration et al. (2016) Gaia Collaboration, Prusti, T., de Bruijne, J. H. J., et al. 2016, A&A, 595, A1, doi: 10.1051/0004-6361/201629272
- Garcia-Martin et al. (2023) Garcia-Martin, P., Kruk, S., Popescu, M., et al. 2023, in AAS/Division for Planetary Sciences Meeting Abstracts, Vol. 55, AAS/Division for Planetary Sciences Meeting Abstracts, 113.01
- Gault & Wedekind (1969) Gault, D. E., & Wedekind, J. A. 1969, JGR, 74, 6780, doi: 10.1029/JB074i027p06780
- Gehrels et al. (2004) Gehrels, N., Chincarini, G., Giommi, P., et al. 2004, ApJ, 611, 1005, doi: 10.1086/422091
- Graykowski et al. (2023) Graykowski, A., Lambert, R. A., Marchis, F., et al. 2023, Nature, doi: 10.1038/s41586-023-05852-9
- Hapke (1986) Hapke, B. 1986, Icarus, 67, 264, doi: 10.1016/0019-1035(86)90108-9
- Hapke et al. (1993) Hapke, B. W., Nelson, R. M., & Smythe, W. D. 1993, Science, 260, 509, doi: 10.1126/science.260.5107.509
- Heinze et al. (2018) Heinze, A. N., Tonry, J. L., Denneau, L., et al. 2018, AJ, 156, 241, doi: 10.3847/1538-3881/aae47f
- Holsapple (2022) Holsapple, K. A. 2022, P&SS, 219, 105529, doi: 10.1016/j.pss.2022.105529
- Holsapple & Housen (2019) Holsapple, K. A., & Housen, K. R. 2019, P&SS, 179, 104724, doi: 10.1016/j.pss.2019.104724
- Housen (2007) Housen, K. R. 2007, in 38th Annual Lunar and Planetary Science Conference, Lunar and Planetary Science Conference, 1462
- Housen & Holsapple (2011) Housen, K. R., & Holsapple, K. A. 2011, Icarus, 211, 856, doi: 10.1016/j.icarus.2010.09.017
- Hsieh et al. (2012) Hsieh, H. H., Yang, B., & Haghighipour, N. 2012, ApJ, 744, 9, doi: 10.1088/0004-637X/744/1/9
- Ishiguro et al. (2011) Ishiguro, M., Hanayama, H., Hasegawa, S., et al. 2011, ApJ, 740, L11, doi: 10.1088/2041-8205/740/1/L11
- Ivezić et al. (2019) Ivezić, Ž., Kahn, S. M., Tyson, J. A., et al. 2019, ApJ, 873, 111, doi: 10.3847/1538-4357/ab042c
- Jewitt & Hsieh (2022) Jewitt, D., & Hsieh, H. H. 2022, arXiv e-prints, arXiv:2203.01397, doi: 10.48550/arXiv.2203.01397
- Jewitt et al. (2023) Jewitt, D., Kim, Y., Li, J., & Mutchler, M. 2023, ApJ, 952, L12, doi: 10.3847/2041-8213/ace1ec
- Jewitt et al. (2010) Jewitt, D., Weaver, H., Agarwal, J., Mutchler, M., & Drahus, M. 2010, Nature, 467, 817, doi: 10.1038/nature09456
- Jewitt et al. (2011) Jewitt, D., Weaver, H., Mutchler, M., Larson, S., & Agarwal, J. 2011, ApJ, 733, L4, doi: 10.1088/2041-8205/733/1/L4
- Kim & Jewitt (2023) Kim, Y., & Jewitt, D. 2023, arXiv e-prints, arXiv:2309.15116. https://arxiv.org/abs/2309.15116
- Larson et al. (2010) Larson, S., Kowalski, R., Sato, H., Yoshimoto, K., & Nakano, S. 2010, Central Bureau Electronic Telegrams, 2583, 1
- Law et al. (2009) Law, N. M., Kulkarni, S. R., Dekany, R. G., et al. 2009, PASP, 121, 1395, doi: 10.1086/648598
- Li et al. (2023) Li, J.-Y., Hirabayashi, M., Farnham, T. L., et al. 2023, Nature, doi: 10.1038/s41586-023-05811-4
- Luther et al. (2018) Luther, R., Zhu, M.-H., Collins, G., & Wunnemann, K. 2018, Materorite & Plan. Sci., 53, 1705
- Maeda et al. (2021) Maeda, N., Terai, T., Ohtsuki, K., et al. 2021, AJ, 162, 280, doi: 10.3847/1538-3881/ac2c6e
- Masiero et al. (2015) Masiero, J. R., DeMeo, F. E., Kasuga, T., & Parker, A. H. 2015, in Asteroids IV, 323–340, doi: 10.2458/azu_uapress_9780816532131-ch017
- McLoughlin et al. (2015) McLoughlin, E., Fitzsimmons, A., & McLoughlin, A. 2015, Icarus, 256, 37, doi: 10.1016/j.icarus.2015.04.015
- Moreno et al. (2011) Moreno, F., Licandro, J., Ortiz, J. L., et al. 2011, ApJ, 738, 130, doi: 10.1088/0004-637X/738/2/130
- Moreno et al. (2023) Moreno, F., Bagatin, A. C., Tancredi, G., et al. 2023, PSJ, 4, 138. https://arxiv.org/abs/2307.10086
- Nir et al. (2021a) Nir, G., Ofek, E. O., Ben-Ami, S., et al. 2021a, MNRAS, 505, 2477, doi: 10.1093/mnras/stab1437
- Nir et al. (2021b) Nir, G., Ofek, E. O., & Gal-Yam, A. 2021b, Research Notes of the American Astronomical Society, 5, 27, doi: 10.3847/2515-5172/abe540
- Ofek (2014) Ofek, E. O. 2014, MATLAB package for astronomy and astrophysics. http://ascl.net/1407.005
- Ofek (2019) —. 2019, PASP, 131, 054504, doi: 10.1088/1538-3873/ab04df
- Ofek & Ben-Ami (2020) Ofek, E. O., & Ben-Ami, S. 2020, arXiv e-prints, arXiv:2011.04674. https://arxiv.org/abs/2011.04674
- Ofek et al. (2023) Ofek, E. O., Shvartzvald, Y., Sharon, A., et al. 2023, arXiv e-prints, arXiv:2310.13063, doi: 10.48550/arXiv.2310.13063
- Ofek et al. (2024) Ofek, E. O., Kushnir, D., Polishook, D., et al. 2024, MNRAS, 527, 10507, doi: 10.1093/mnras/stad3707
- Pan & Sari (2005) Pan, M., & Sari, R. 2005, Icarus, 173, 342, doi: 10.1016/j.icarus.2004.09.004
- Petit & Farinella (1993) Petit, J.-M., & Farinella, P. 1993, Celestial Mechanics and Dynamical Astronomy, 57, 1, doi: 10.1007/BF00692457
- Polishook et al. (2023) Polishook, D., DeMeo, F. E., Burt, B. J., et al. 2023, PSJ, 4, 229, doi: 10.3847/PSJ/ad08ae
- Ricker et al. (2015) Ricker, G. R., Winn, J. N., Vanderspek, R., et al. 2015, Journal of Astronomical Telescopes, Instruments, and Systems, 1, 014003, doi: 10.1117/1.JATIS.1.1.014003
- Rivkin et al. (2021) Rivkin, A. S., Chabot, N. L., Stickle, A. M., et al. 2021, PSJ, 2, 173, doi: 10.3847/PSJ/ac063e
- Roming et al. (2005) Roming, P. W. A., Kennedy, T. E., Mason, K. O., et al. 2005, SSRv, 120, 95, doi: 10.1007/s11214-005-5095-4
- Sagiv et al. (2014) Sagiv, I., Gal-Yam, A., Ofek, E. O., et al. 2014, AJ, 147, 79, doi: 10.1088/0004-6256/147/4/79
- Shestakova et al. (2023) Shestakova, L., Serebryanskiy, A., & Aimanova, G. 2023, Icarus, 401, 115595, doi: 10.1016/j.icarus.2023.115595
- Shvartzvald et al. (2023) Shvartzvald, Y., Waxman, E., Gal-Yam, A., et al. 2023, arXiv e-prints, arXiv:2304.14482, doi: 10.48550/arXiv.2304.14482
- Soumagnac & Ofek (2018) Soumagnac, M. T., & Ofek, E. O. 2018, PASP, 130, 075002, doi: 10.1088/1538-3873/aac410
- Statler et al. (2022) Statler, T. S., Raducan, S. D., Barnouin, O. S., et al. 2022, arXiv e-prints, arXiv:2209.11873. https://arxiv.org/abs/2209.11873
- Yoshida & Nakamura (2007) Yoshida, F., & Nakamura, T. 2007, Planet. Space Sci., 55, 1113, doi: 10.1016/j.pss.2006.11.016