Biomechanical Comparison of Human Walking Locomotion on Solid Ground and Sand111The first two authors contributed equally to this work.
Abstract
Current studies on human locomotion focus mainly on solid ground walking conditions. In this paper, we present a biomechanic comparison of human walking locomotion on solid ground and sand. A novel dataset containing 3-dimensional motion and biomechanical data from 20 able-bodied adults for locomotion on solid ground and sand is collected. We present the data collection methods and report the sensor data along with the kinematic and kinetic profiles of joint biomechanics. A comprehensive analysis of human gait and joint stiffness profiles is presented. The kinematic and kinetic analysis reveals that human walking locomotion on sand shows different ground reaction forces and joint torque profiles, compared with those patterns from walking on solid ground. These gait differences reflect that humans adopt motion control strategies for yielding terrain conditions such as sand. The dataset also provides a source of locomotion data for researchers to study human activity recognition and assistive devices for walking on different terrains.
keywords:
Human walking locomotion, Granular terrain, Gait adaptationorganization=Department of Mechanical and Aerospace Engineering
Rutgers University,city=Piscataway,
state=NJ 08854,
country=USA
1 Introduction
The biomechanical study of human locomotion has been a fundamental aspect of understanding human physiology and developing assistive devices and wearable robotic systems. However, the majority of gait analysis research and open-source datasets were performed on level, solid ground (Camargo et al., 2021). This focus has yielded significant insights into the basic biomechanics of gait but has not encapsulated the full spectrum of challenges and variables present during everyday ambulation. When it comes to real-world locomotion, navigating through granular terrains such as sand or small pebbles can be particularly challenging due to their constantly yielding and shifting nature (Kowalsky et al., 2021).
Several research works have provided a comprehensive understanding of how different terrain conditions affect human walking locomotion. The metabolic cost of walking on compliant substrates was investigated in Grant et al. (2022), and the study provided a foundation for understanding the energy demands of walking on yielding terrains such as sand. The work of Zamparo et al. (1992) specifically examined the energy cost of walking and running on sand and highlighted the increased physical effort required on yielding surfaces. These studies underline the importance of terrain in influencing gait mechanics and energy efficiency. The research work on human gait in natural settings (Kowalsky et al., 2021) and on diverse surfaces such as forest terrains (Holowka et al., 2022) provided a comprehensive picture of the interaction between terrain type, gait parameters, and energy expenditure. Specific adaptations to walking on uneven terrains such as unanticipated steps were observed and corresponding lower limb bio-mechanical response was analyzed in Panizzolo et al. (2017). Another comprehensive overview of the terrain impacts on human sprint locomotion demonstrated the effects of different surfaces such as natural and artificial turf, and sand. The study in Xu et al. (2015) discussed the influence of deformation height on estimating the center of pressure (COP) during walking on level ground and sand.
Recent advancements in assistive technologies have significantly contributed to the understanding of human-terrain interaction during walking locomotion. Developments in exoskeleton control for uneven terrains in Jatsun et al. (2018) and the integration of human-in-the-loop control in soft exosuits on different terrains in Li et al. (2022) have enhanced activity recognition and response adaptability. The use of inertial measurement unit (IMU)-based algorithms for foot-ground contact detection (Kim and Lee, 2017) and terrain topography detection (Knuth and Groves, 2023) illustrates the complexity of walking dynamics on varied surfaces. These technologies play a crucial role in real-time walking gait phase estimation, especially on uneven terrain (Medrano et al., 2023). Additionally, studies focusing on the asymmetry of ground contact during running on sand (Dewolf et al., 2019) and the analysis of ground reaction forces and muscle activity in walking across different surfaces (Jafarnezhadgero et al., 2019) have extended the understanding of the biomechanical adaptations required for locomotion on diverse terrains. Moreover, Grant (2023) provided a holistic view of how human gait and energetics are altered when traversing substrates of varying compliance.
All the above-mentioned research emphasizes the complex interplay between human biomechanics and varying terrain types. Comprehensive joint-level biomechanics analysis on locomotion over such yielding terrain however remains scant. Recognizing this deficit, this study introduces a detailed analysis of human locomotion on two distinct terrains: solid ground and sand. The methodology involves collecting and analyzing a novel dataset of biomechanical data from able-bodied adults. A motion capture system coupled with ground reaction force (GRF) measurements is used to capture both kinematic and kinetic aspects of walking locomotion. We comprehensively analyze joint-level biomechanics, including GRFs and joint torque profiles, in environments that replicate natural walking conditions on both solid and yielding sand surfaces.
The main contributions of this work are twofold. First, an in-depth analysis of the biomechanical characteristics of human walking on granular terrains is presented. To the authors’ best knowledge, there is no reported result on GRFs and joint torque profiles and corresponding comparisons for humans walking both on sand and solid ground. This study fills such a knowledge gap and offers new insights into the biomechanical strategies employed by individuals when navigating through granular terrains—a scenario frequently encountered in daily life but seldom studied in detail. The biomechanical analysis in this work not only contributes to enhancing the understanding of human gait mechanics but also serves as a foundation for the development of assistive devices. Second, this work provides an experimental dataset that integrates synchronized motion capture and GRF data. This dataset is expected to be a valuable resource for further biomechanics and wearable sensor data research across varied environmental settings.
2 Methods
2.1 Experimental Setup and Protocol
In this study, twenty able-bodied healthy subjects ( males and females, age: , height: cm, weight: kg) participated in experiments and are labeled as S1 to S20. All participants are self-reported to be in a good health condition. An informed consent form was signed by each subject and the experimental protocol was approved by the Institutional Review Board (IRB) at Rutgers University.
Figure 1 shows the experimental setup in a laboratory. A three-segment walkway ( m long, m wide, and m high) was constructed as shown in the figure. Segment was built with reinforced plywood with one embedded force plate (model ACG-O from Advanced Mechanical Technology, Inc., Watertown, MA) to replicate a solid ground condition. Segment was a sand box filled with sand as a common granular terrain condition. Another force plate (from Bertec Corporation.) was buried cm beneath the sand surface to capture the GRFs. The GRF measurements collected within Segment were calibrated by a correlation for the sand layer thickness. The correlation curves can be found in A. Segment , made of the same material as segment one, was connected to segment two to ensure subjects could comfortably leave segment two without changing their gaits.
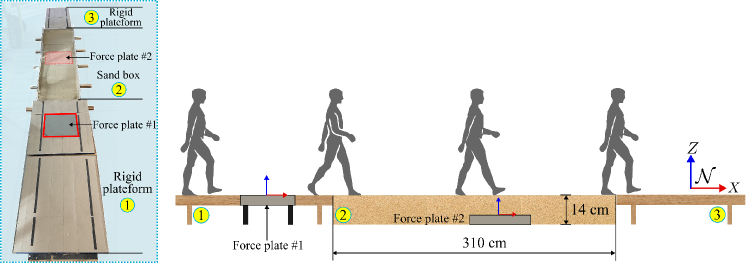
Starting at Segment of the walkway, each subject was instructed to walk in the preferred manner. For the first trials, the subject was required to walk back and forth on the walkway to get familiar with walking with the sensing devices and the terrain condition of the walkway. After that, another - trials of one-directional walking experiments were conducted. The sand surface was flattened before each trial.
2.2 Sensor Measurements and Data Collections
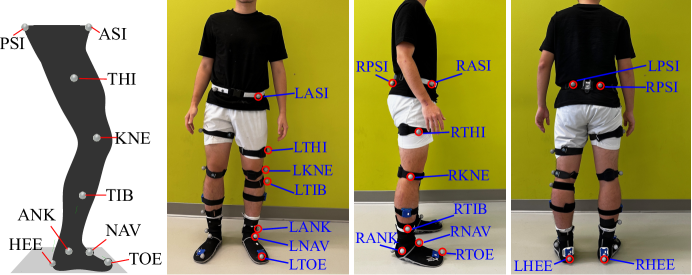
For the walking motion, a motion capture system ( Vantage cameras, Vicon Motion Systems Ltd.) was used to collect lower limb motion information with the sampling frequency Hz. A total of reflective markers were carefully attached firmly to each subject. Figure 2 shows the specific schematic of Vicon marker positions and their name labels. “L” and “R” represent “left” and “right”, respectively. The subjects were required to wear a pair of swimming boots for the free movement of foot navicular joints. Meanwhile, the GRF measurements were synchronized via hardware and software setup with the motion data at Hz.
2.3 Data Processing
Major gait events such as heel strike and toe-off were defined through motion data to identify the stance phases (i.e., single and double stance phase, respectively) of the gait cycle. The walking gait progression, namely, the joint angle, was normalized by a defined phase variable (between and ) according to the strike events. For clear presentation, the GRFs were normalized the weight of the subject and presented as the functions of the stance variable which was normalized between the heel-strike and toe-off.
The measurements and calculations of interest are joint angles of hip, knee, and ankle in the sagittal plane of the human walking locomotion, namely, the plane shown in Fig. 1. Likewise, we only presented the longitudinal and vertical forces in the -and -direction, respectively. Joint moments in the sagittal plane were also computed through an inverse dynamics model given the GRFs applied on the foot; see the detailed description in B. Other kinematic variables such as strike length/width, stance/swing time, vertical variation of center of mass (COM), and average walking velocity highlighted significant variations in the gait patterns between solid ground and sand, and they were included and reported in the study. The data processing was done by using custom algorithms in MATLAB software (Mathworks Inc., Natick, MA). A one-way repeated measures analysis of variance (ANOVA) was conducted to evaluate the impact of the terrains on the above-mentioned metrics.
3 Experimental Results
3.1 Kinematic Analysis Results
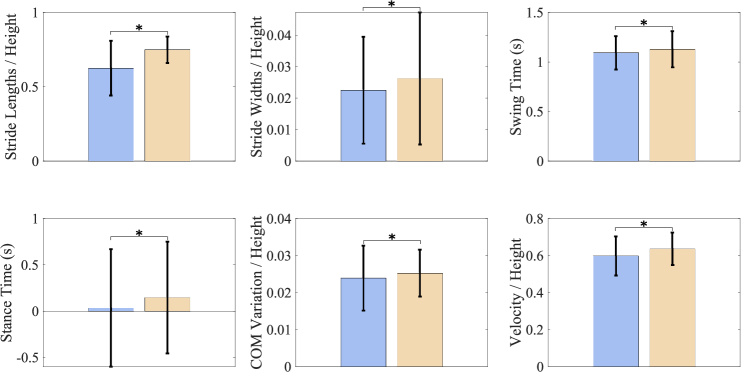
Strike Differences: Figure 3 illustrates stride profiles among all the subjects. Stride length was found to be significantly longer (i.e., %) on sand, with an accompanying increase of % in stride width. This gait adaptation is likely due to the deformable nature of the sandy terrain. The COM vertical variation during each step on the sand was also observed to increase by %, which was possibly due to the extra effort from the joints when subjects walked on the sand. Walking on sand also showed an obvious increase regarding the swing time and stance time. Overall, subjects tended to walk faster on sand than on solid ground. The ratio between average walking speed on solid ground versus that on sand was about .
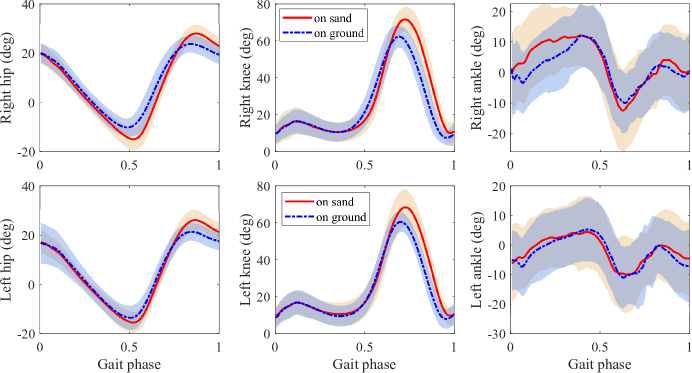
Joint Angles: Differences in joint angles, particularly in the lower extremities, were observed, and this indicates a distinct adjustment in walking strategy on sand compared to that on solid ground. Figure 4 shows the detailed profiles for the hip, knee, and ankle joints throughout the gait cycle. There was no clear difference regarding the joint angle pattern. Only slightly larger magnitudes were observed in the hip flexion/extension and knee flex/extension for walking on sand than those on solid ground. However, for ankle dorsi/plantarflexion, this difference did not clearly occur in the gait pattern.
3.2 Kinetic Analysis Results
The kinetic analysis provides insights into how walking on different terrains affects the forces exerted by and on the body:
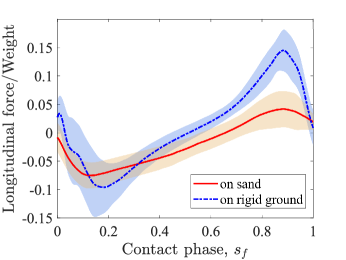
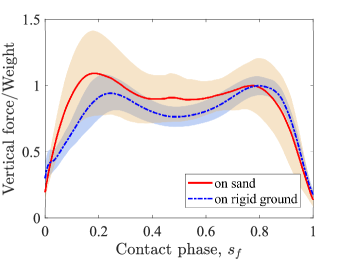
GRFs: Figures 5 and 5 show the longitudinal and vertical GRFs normalized by the subject’s weight, respectively. The shaded region indicated the one-standard variation. It is observed that the magnitude of the maximum longitudinal force on sand is relatively smaller than that on solid ground in both forward and backward directions. Furthermore, this noticeable disparity appears in the toe pushing off stage. On solid ground, the average pushing force is approximately four times larger than that on sand. However, regarding the vertical force , sandy terrain might provide more supporting force during the heel strike and foot rolling stages, compared with the solid ground. Moreover, the variation of the normal force on the sand is also more significant than that on the solid ground. It is also noticeable that there is a slight difference with the double-hump pattern of the vertical force throughout the contact phase. The magnitudes of two humps on the solid ground appear almost equivalent. Nevertheless, for the sandy terrain, the first hump of the force is slightly higher than the second one in the late contact phase. Similar results were also reported on the level sand in Xu et al. (2015).
Joint Moments: Figure 6 illustrates the joint moments (Nm/kg) in the sagittal plane normalized by the subject’s mass. The inverse dynamics calculation model used in this study was discussed in Shamaei et al. (2013) and the detailed description is presented in B. From the comparison results, we observe that for able-bodied locomotion, the joint moments kept consistent bilaterally both on sandy and solid terrain.
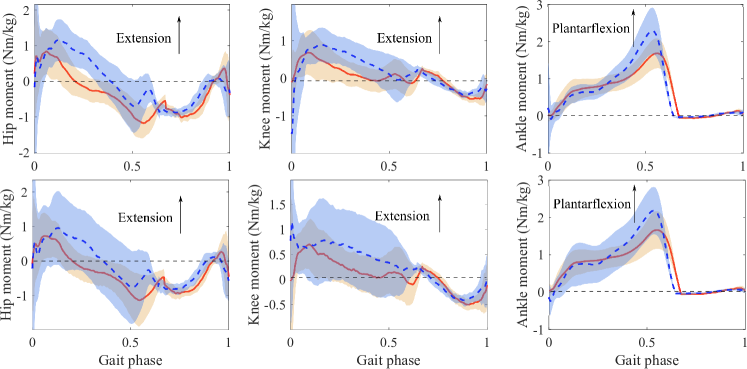
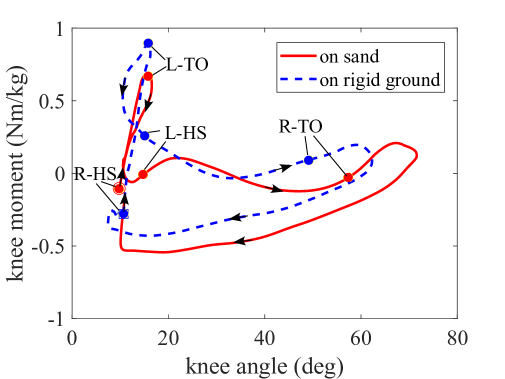
Figure 7 shows the comparison of the knee stiffness profiles on sandy and solid terrain. It is clear that, compared with that on solid ground, the knee moment contour of walking on sand shifts towards the large angle amplitude and lower moment amplitude directions. However, for the characteristic feature such as knee stiffness defined in the stance phase (Shamaei et al., 2013), i.e., shown as the trajectory R-HSL-TOL-HS in the figure, did not change significantly. This knee biomechanical profile potentially provides a tool for assistive device controllers to adjust strategies accordingly. By leveraging joint torque and angle data, assistive controllers can provide phase-specific assistance that aligns with the natural gait cycle, enhancing movement synergy. Adaptive real-time biomechanical feedback control, can dynamically adjust assistance on varying terrains and therefore, improve stability and energy efficiency for the user. This data-driven approach promises to refine the integration of exoskeletons with human locomotion and potentially enhance assistive device functionality. For example, using knee exoskeleton in Zhu and Yi (2023), we can further incorporate the active knee biomechanics profile with respect to the knee flex/extension.
4 Discussion
In this study, we examined human walking locomotion across two different terrain conditions, with an emphasis on a granular sandy condition. We collected walking data and extracted detailed kinematic and kinetic measurements and calculations. Moreover, we encompassed a set of comparisons throughout the walking gait profile (i.e., joint angles), joint moments, and GRFs. Insights on walking locomotion on sandy terrain are discussed as follows.
Strike and COM: Different from the experiment setup designed in Svenningsen et al. (2019), the subjects in this study were asked to walk across two different terrains sequentially from the solid ground to the sand box, allowing each subject to keep the preferred comfortable walking pace. Our findings suggest that walking strategies adapt significantly when transitioning from solid ground to sand. Participants tended to walk faster on sand than on solid ground; see the velocity ratio result in Fig. 3. The extended stride length and width observed on the sand were likely compensatory mechanisms to maintain balance on the yielding surface. Additionally, the increased COM vertical variation indicates an adaptive response to optimize energy efficiency and maintain stability on the yielding terrain, which was also found for the mid-stance phase ( gait cycle) in Svenningsen et al. (2019). These adaptations are pivotal for navigating through granular substrates, where it is challenging for gait strategies to navigate under solid ground.
Kinematics: The joint angles, especially in the lower extremities, demonstrate distinct variations between solid and sand terrains. Walking on the sandy terrain results in greater dorsiflexion of the ankle in the early stance phase but a similar peak amplitude of the ankle plantar flexion near toe-off. This is because the heel would experience an intrusion into the sand and then the forefoot was prevented from plantarflexion at the beginning of the stance phase; see the small portion of ankle plantarflexion on the solid ground shown as the blue dashed line in Fig. 4. Furthermore, a relatively larger variability of the ankle dorsi/plantarflexion on the sand was found compared with the hip flexion/extension and knee flex/extension. This represents the nature of complexity and instability of deformable terrain locomotion. Similarly, greater flexion is observed in the hip and knee profile. The high flexion in the toe-off and swing phase can be a compensation for the loss of momentum during the stance phase for the deformable sand.
Kinetics: The kinetic analysis revealed critical insights into the biomechanical demands of walking on different terrains. For kinematic profiles such as joint moments compared with on solid ground, sand walking locomotion required less hip extensor action until the mid-stance to control knee flexion and the forward rotation of the upper body. The longitudinal force shown in Fig. 5 has a small backward component at the hip joint which requires small hip extensors consequently. However, compared to solid ground, walking on sand demanded greater hip flexor to pull the thigh forward and upward at the latter half of the stance phase (including the double stance) and get ready for the knee extension and swing. This indicates large energy consumption to compensate for momentum loss at the stance leg. The distinct patterns in GRFs and joint moments suggest that walking on sand necessitates a reorientation of muscular efforts and joint mechanics. This reorientation is a complex interplay between maintaining stability, managing energy efficiency, and adapting to the terrain’s physical characteristics.
This study represents a significant advanced step in analyzing biomechanics during human locomotion across varying terrain types, specifically solid ground and sand. It is the first study that reports the GRFs and joint moments for humans walking on yielding terrains such as sand. The locomotion dataset provided by this study also generates new knowledge and enables to use wearable assistive devices and IMU-based activity recognition for human locomotion on yielding terrains. The kinematic analysis of the lower limbs aligns with existing studies, such as van den Berg et al. (2017). In contrast to Xu et al. (2015), which posited an experimental design that minimizes force dissipation in the sand, the calibration results detailed in A indicate a discrepancy between forces at the sand surface and the GRFs measured by the embedded force plate. Despite requiring calibration for magnitude, the discussed longitudinal and vertical GRFs in this work are in agreement in pattern to those reported by Xu et al. (2015). Contrary to Svenningsen et al. (2019), which found reduced walking speed and stride length on sand, the subjects in this study exhibited increased pace, longer strides, and greater vertical COM displacement. This discrepancy is attributed to the consistent starting conditions for all trials, eliminating bias from self-selected walking strategies per terrain. The methodology in this work thus captures the actual transition between gaits when moving from solid ground to sand. The adaptive locomotion on the sand can be ascribed to the inherent compensatory mechanisms of the human motor system by adjusting stride and body mechanics to maintain balance and stability on the less stable sand surface.
While acknowledging some study limitations, their impact on our findings is not excessively significant. The study’s design permitted subjects to walk at their preferred pace, leading to variability in walking speeds, diverging from other studies like Camargo et al. (2021) focused on locomotion velocity effects. This variability might influence biomechanical data consistency. Additionally, the research scope was limited to straight walking on level sand and solid ground, excluding complex movements like ascending, descending, and turning on granular terrains. Such limitations might restrict a comprehensive understanding of biomechanical adaptations in gait activities. The dataset lacks other lower limb biomechanics, such as EMG signals, important for analyzing muscle activation patterns. Future research should include diverse locomotive modes and participant demographics, using an array of sensors for gait analysis on different terrains to further enhance our understanding of human locomotion on granular terrains.
5 Conclusion
This study has contributed to the understanding of human walking locomotion on granular terrain by providing a detailed biomechanical analysis of gait adaptations. The findings were derived from comprehensive biomechanical and wearable sensor data from able-bodied adults and highlighted the intricate adjustments in stride, joint mechanics, and ground reaction forces necessary for efficient movement on challenging surfaces such as sand. These insights offered valuable implications for the development of advanced assistive devices and responsive robotic systems. We also provided and shared open-source kinematic and kinetic dataset and a comparison of human walking on solid and sand surfaces. Despite certain limitations such as the variability in walking speeds and the focus on able-bodied individuals, this research paved the way for future studies to explore a broader range of locomotion conditions and participant demographics and therefore, enhance the applicability of wearable sensing and assistive technologies in diverse environmental settings.
CRediT Authorship Contribution Statement
Chunchu Zhu: Conceptualization, Formal analysis, Methodology, Investigation, Experiments, Software, Writing – original draft. Xunjie Chen: Conceptualization, Formal analysis, Methodology, Investigation, Experiments, Software, Writing – original draft. Jingang Yi: Project administration, Supervision, Resources, Conceptualization, Writing – revision & editing.
Declaration of Competing Interest
The authors declare that they have no known competing financial interests or personal relationships that could have appeared to influence the work reported in this paper.
Acknowledgments
This study was partially sponsored by the US National Science Foundation under award CMMI-2222880. The authors thank Mr. Aditya Anikode of Rutgers University for his help in constructing the experimental setup in this study.
Appendix A Force Calibration
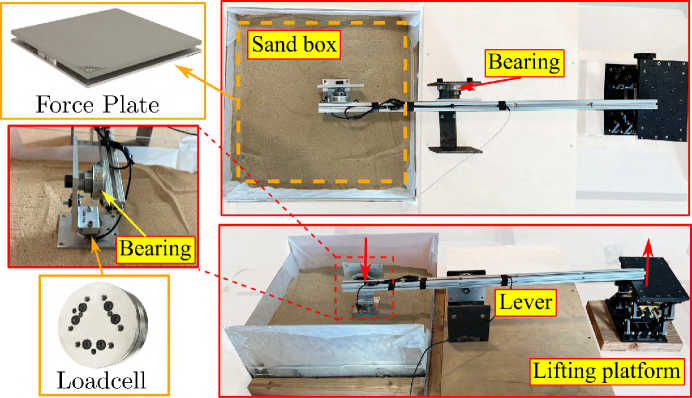
The force plate and sandbox configurations in the experiment were similar to that in Xu et al. (2015). However, the dissipation of the force under this design cannot be negligible. During the walking experiments, the force plate was embedded beneath a layer of sand with a depth of cm. The GRFs observed at the sand’s surface inherently differed from those recorded by the force plate because of the deformation characteristics and energy dissipation properties of sand substrates. Consequently, it is necessary to conduct force calibration to obtain accurate GRFs from the force plate.
As shown in Fig. 1, we designed and built a sand box with a force plate positioned beneath the sand layer. The calibration setup consists of a lever mechanism, featuring a force/torque load cell (ATI mini45) at one end and a vertically adjustable displacement lift platform at the other end. By raising the platform and leveraging the mechanical advantage of the bearing structure, the compression plate can firmly generate a controlled vertical force onto the sand’s surface. The magnitude of the applied force was recorded by the load cell and was synchronized with the force plate readings. This setup allowed us to establish a correlation between the force exerted at the surface and the force recorded at the bottom, under varying sand thickness conditions.
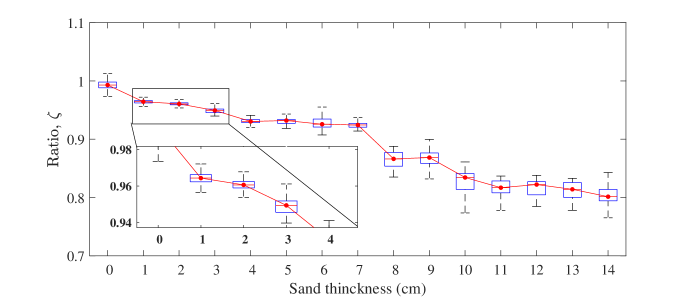
The calibration was performed by applying static known forces (obtained from the load cell and denoted by ) and recording the corresponding force plate measurements (denoted by ) at different sand thicknesses. The forces were exerted from to N with a N increment, and then lowered to with the same decrement. We increased the sand depth from 0 to cm by the increment of cm. The sand surface was paved flat before each compression calibration. These measurements were then used to generate a force ratio curve () that served as a calibration reference for interpreting the GRFs during the walking trials. This curve was essential for compensating for the deformation of sands and energy dissipation at various depths and this would allow for a precise adjustment in our biomechanical analysis. Moreover, it was confirmed that the location had no significant impact on the force plate measurements for the area directly above the force plate.
Figure. 2 shows the force calibration results of a total of fifteen sand thicknesses. The force measured beneath the sand was indeed smaller than that at the surface. Overall, the force ratio decreases as the sand layer becomes thicker. A significant ratio drop is observed when the sand thickness rises from to cm. In summary, this correction force ratio was used to re-calculate the actual GRFs from the force plate measurements. For the subject walking experiments, we used the ratio for the -cm sand depth, and therefore, the real vertical ground reaction force , where is the force plate measurements in the vertical direction.
Appendix B Inverse Dynamics
In this section, we discuss the calculation of the joint moments in the sagittal plane based on inverse dynamics. The formulations for ankle, knee, and hip joint moments are derived and articulated using Newtonian-Euler formulation specific to the foot, shank, and thigh segments, respectively. Similar derivations can be found in the support materials from the work of Shamaei et al. (2013).
As shown in Fig. 1, the leg consists of three segments, namely, the thigh, shank, and foot segment. For each segment, there are two joints, proximal and distal joints. To obtain the joint moments of each segment, the Newtonian-Euler method was used. Since the procedure is consistent for each segment, we only present the derivation of the proximal and distal joint moments for the foot segment as a brief example.
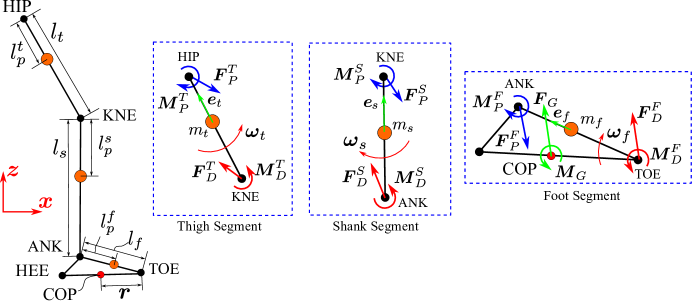
For the foot segment, the proximal joint is the ankle joint and the distal one is the toe. Here, we consider that the COP is located near the center of the line connecting the toe and heel marker as a simplification assumption, and the ground reaction force vector and moment vector are applied at the COP point. First, and should be transferred to the distal joint (toe) such that
| (1) |
where and are the distal force vector and moment vector at the toe, respectively. represents the position vector from the COP to the toe.
Next, according to the Newtonian method, the forces on the foot segment should satisfy , where is the mass of the foot segment and is the acceleration of the foot. Therefore, the force at the proximal joint (i.e., the ankle) is
| (2) |
where is the proximal joint force vector and is the unit vector along the axis. Using the Euler equation of the foot segment , where is the mass moment of inertia about the center of mass of the foot segment and is the angular acceleration of the foot segment. By plugging known forces, we obtain
| (3) |
where is the proximal joint moment, namely, the ankle moment. and are the length of the foot segment and distance from the ankle to the center of mass of the foot segment, respectively. is the unit vector of the foot segment direction (shown in Fig. 1) that represents the orientation of the foot.
For the knee and hip joint moments, we follow the same process as we treat the foot segment. For instance, we take the ankle and knee joint moments as the distal and proximal joint moments, respectively, for the shank segment, and the knee and hip joint moments are then treated as the distal and proximal joint moments, respectively, for the thigh segment. Then, the knee and hip moments are calculated respectively as
| (4) | ||||
and
| (5) | ||||
where () is the unit vectors of the shank (thigh) segment. () is the length of the shank (thigh) segment. () is the distance from the knee (hip) to the center of mass of the shank (thigh) segment. () is the moment inertial about the center of mass of the shank (thigh) segment. The angular acceleration of the shank (thigh) segment is denoted as ().
The formulations (3), (4), and (5) are consistent for both the stance leg and swing leg. For the swing leg, the ground reaction forces and moments are zero, i.e., and . Translation accelerations and angular accelerations of the leg segments can be extracted from the optical marker measurements. The corresponding anthropometry information of the subject such as segment length, mass, and location of COM can be found in Chapter 4 of Winter (2009). We used estimate ratios for the joint moment calculation in this study.
Appendix C Data availability
Supplementary dataset to this article can be found online at http://dx.doi.org/10.17632/jgdpjrf584.2.
References
- van den Berg et al. (2017) van den Berg, M.E., Barr, C.J., McLoughlin, J.V., Crotty, M., 2017. Effect of walking on sand on gait kinematics in individuals with multiple sclerosis. Multiple Sclerosis and Related Disorders 16, 15–21.
- Camargo et al. (2021) Camargo, J., Ramanathan, A., Flanagan, W., Young, A., 2021. A comprehensive, open-source dataset of lower limb biomechanics in multiple conditions of stairs, ramps, and level-ground ambulation and transitions. Journal of Biomechanics 119. Article 110320.
- Dewolf et al. (2019) Dewolf, A., Lejeune, T., Willems, P., 2019. The on-off ground asymmetry during running on sand. Computer Methods in Biomechanics and Biomedical Engineering 22, S291–S293.
- Grant et al. (2022) Grant, B., Charles, J., Geraghty, B., Gardiner, J., D’Août, K., Falkingham, P.L., Bates, K.T., 2022. Why does the metabolic cost of walking increase on compliant substrates? Journal of the Royal Society Interface 19. Article 20220483.
- Grant (2023) Grant, B.F., 2023. How are human gait and energetics modified when walking over substrates of varying compliance? Ph.D. thesis. The University of Liverpool. Liverpool, UK.
- Holowka et al. (2022) Holowka, N.B., Kraft, T.S., Wallace, I.J., Gurven, M., Venkataraman, V.V., 2022. Forest terrains influence walking kinematics among indigenous tsimane of the bolivian amazon. Evolutionary Human Sciences 4. Article e19.
- Jafarnezhadgero et al. (2019) Jafarnezhadgero, A., Fatollahi, A., Amirzadeh, N., Siahkouhian, M., Granacher, U., 2019. Ground reaction forces and muscle activity while walking on sand versus stable ground in individuals with pronated feet compared with healthy controls. PLoS ONE 14. Article e0223219.
- Jatsun et al. (2018) Jatsun, S., Savin, S., Yatsun, A., 2018. Walking pattern generation method for an exoskeleton moving on uneven terrain, in: 20th International Conference on Climbing and Walking Robots and the Support Technologies for Mobile Machines, Porto, Portugal. pp. 13–20.
- Kim and Lee (2017) Kim, M., Lee, D., 2017. Development of an imu-based foot-ground contact detection (fgcd) algorithm. Ergonomics 60, 384–403.
- Knuth and Groves (2023) Knuth, T., Groves, P., 2023. IMU based context detection of changes in the terrain topography, in: 2023 IEEE/ION Position, Location and Navigation Symposium, Monterey, CA. pp. 680–690.
- Kowalsky et al. (2021) Kowalsky, D.B., Rebula, J.R., Ojeda, L.V., Adamczyk, P.G., Kuo, A.D., 2021. Human walking in the real world: Interactions between terrain type, gait parameters, and energy expenditure. PLoS ONE 16. Article e0228682.
- Li et al. (2022) Li, Z., Li, X., Li, Q., Su, H., Kan, Z., He, W., 2022. Human-in-the-loop control of soft exosuits using impedance learning on different terrains. IEEE Transactions on Robotics 38, 2979–2993.
- Medrano et al. (2023) Medrano, R.L., Thomas, G.C., Keais, C.G., Rouse, E.J., Gregg, R.D., 2023. Real-time gait phase and task estimation for controlling a powered ankle exoskeleton on extremely uneven terrain. IEEE Transactions on Robotics 39, 2170–2182.
- Panizzolo et al. (2017) Panizzolo, F.A., Lee, S., Miyatake, T., Rossi, D.M., Siviy, C., Speeckaert, J., Galiana, I., Walsh, C.J., 2017. Lower limb biomechanical analysis during an unanticipated step on a bump reveals specific adaptations of walking on uneven terrains. Journal of Experimental Biology 220, 4169–4176.
- Shamaei et al. (2013) Shamaei, K., Sawicki, G.S., Dollar, A.M., 2013. Estimation of quasi-stiffness of the human hip in the stance phase of walking. PloS ONE 8. Article e81841.
- Svenningsen et al. (2019) Svenningsen, F.P., de Zee, M., Oliveira, A.S., 2019. The effect of shoe and floor characteristics on walking kinematics. Human Movement Science 66, 63–72.
- Winter (2009) Winter, D.A., 2009. Biomechanics and motor control of human movement. John Wiley & Sons, Hoboken, New Jersey, USA.
- Xu et al. (2015) Xu, H., Wang, Y., Greenland, K., Bloswick, D., Merryweather, A., 2015. The influence of deformation height on estimating the center of pressure during level and cross-slope walking on sand. Gait & Posture 42, 110–115.
- Zamparo et al. (1992) Zamparo, P., Perini, R., Orizio, C., Sacher, M., Ferretti, G., 1992. The energy cost of walking or running on sand. European Journal of Applied Physiology and Occupational Physiology 65, 183–187.
- Zhu and Yi (2023) Zhu, C., Yi, J., 2023. Knee exoskeleton-enabled balance control of human walking gait with unexpected foot slip. IEEE Robotics and Automation Letters 8, 7751–7758.