Internal consistency of multi-tier +EDMFT
Abstract
The multi-tier +EDMFT scheme is an ab-initio method for calculating the electronic structure of correlated materials. While the approach is free from ad-hoc parameters, it requires a selection of appropriate energy windows for describing low-energy and strongly correlated physics. In this study, we test the consistency of the multi-tier description by considering different low-energy windows for a series of cubic SrXO3 (X=V,Cr,Mn) perovskites. Specifically, we compare the 3-orbital model, the 5-orbital model, the 12-orbital model, and (in the case of SrVO3) the 14-orbital model and compare the results to available photoemission and X-ray absorption measurements. The multi-tier method yields consistent results for the and low-energy windows, while the models with states produce stronger correlation effects and mostly agree well with experiment, especially in the unoccupied part of the spectrum.
We also discuss the consistency between the fermionic and bosonic spectral functions and the physical origin of satellite features, and present momentum-resolved charge susceptibilities.
I Introduction
Materials with strong electron-electron interactions exhibit diverse and remarkable properties such as high- superconductivity, colossal magnetoresitance, and interaction driven metal-insulator transitions, and are thus of central interest in condensed matter physics [1]. A widely studied subclass of these materials are the transition metal oxides, which contain partially filled narrow -electron bands. These give rise to strong correlation phenomena, which cannot be captured at the level of effective single-particle descriptions. Theoretical studies of transition metal oxides often involve a combination of Density Functional Theory (DFT) [2, 3] in the Local Density Approximation (LDA) [3] and Dynamical Mean Field Theory (DMFT) [4]. The combined DFT+DMFT scheme has been successful in reproducing a wide range of correlated electron phenomena, including mass enhancements [5], and localized to itinerant electronic transitions [6]. This approach however suffers from two main drawbacks: the reliance on ad-hoc parameters such as Hubbard and Hund’s interactions, and the double counting of interaction energies [7]. DFT+DMFT hence cannot be considered a truly ab-initio method, and more sophisticated approaches need to be developed for reliable first-principles predictions of the properties of correlated materials.
A promising way forward is the + Extended Dynamical Mean Field Theory (EDMFT) [8, 9, 10, 11] method which is based on the formalism [12] and supplements the nonlocal self-energy and polarization with more accurate estimates of the local components calculated by EDMFT. Since both and EDMFT are diagrammatic methods, a double counting of self-energy and polarization contributions can be easily avoided. A further advantage of the +EDMFT formalism is that it involves no ad-hoc interaction parameters, since these are computed self-consistently, making it a genuinely ab-initio method. In the multi-tier implementation of the framework [9, 10], different degrees of freedom are treated at an appropriately chosen level of approximation. The full band space (TIER III) is treated at the level of one-shot (), while the physically more relevant low-energy subspace around the Fermi level (TIER II) is solved with the fully self-consistent + EDMFT scheme. In this self-consistency loop, due to the complexity of the many-body problem, only the local correlations of the most strongly correlated orbitals (TIER I) are treated with EDMFT.
If the downfolding from the higher-energy to the lower-energy subspaces was implemented exactly, and we could exactly solve the resulting many-body problem, then the low-energy correlated electronic structure would be independent of the choice of energy windows.
In reality, approximations are made, both in the downfolding [13] and in the solution of the low-energy effective theory (e. g. density-density approximation in the impurity interaction), and it is thus important to understand how much the low-energy physics depends on the choice of the different tiers in the multi-tier approach. In this study, we systematically test the internal consistency of our +EDMFT scheme using the well characterized and studied family of correlated perovskite compounds SrXO3 (X=V, Cr, Mn) as our test materials. Specifically, we will compare the 3-band () description to the five-band () modeling and to a 12-band treatment, which in addition to the states also includes the Oxygen manifold. In the case of SrVO3, we will also consider the 14-band model.
This paper is structured as follows: Section II presents the band structures and effective interactions for the tier II calculations, and the results including spectral functions and charge susceptibilities. Section III discusses the most important findings, while Section IV contains a brief outline of the method. A more detailed description of the multi-tier approach and of the susceptibility calculations can be found in the Supplemental Material.
II Results
II.1 DFT bandstructure and model spaces
The first step in generating the input for the +EDMFT self-consistency is to compute the DFT bandstructure of the “full” space, which contains correlation effects in the form of the exchange correlation potential. This bandstructure allows us to identify a relevant low-energy sector around the Fermi energy to which we can downfold, for use in the subsequent +EDMFT self-consistent calculations.
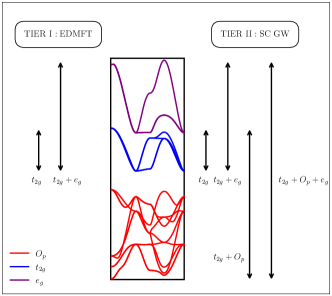
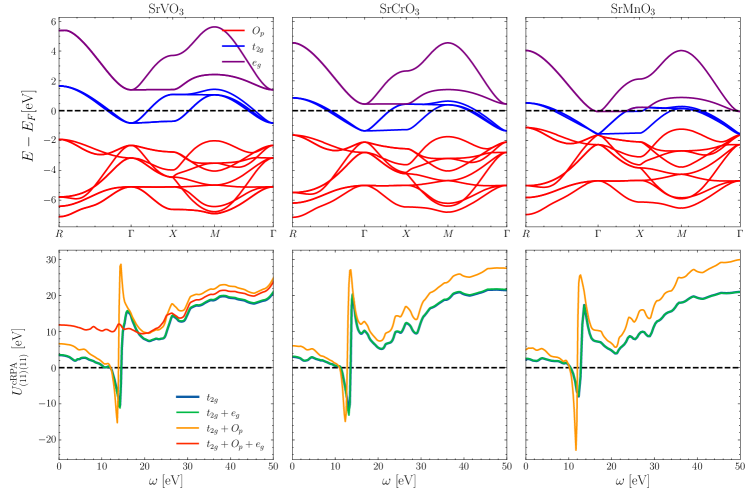
In the cubic perovskites SrXO3 (where X=V, Cr, Mn), the X cation is enclosed in an Oxygen octahedron, which is in turn enclosed in a Strontium cube. The most relevant low-energy bands around the Fermi level have predominantly character and originate from the X cation’s orbitals, see the blue bands in Fig. 1. The two higher lying bands are -like and are crystal-field-split from the . The 9 lower lying bands originate mainly from the Oxygen states. At the DFT level, Vanadium, Chromium and Manganese host 1, 2 and 3 electrons in the bands, respectively. For our tests of the consistency of the method, we will consider the , and model spaces (as well as for SrVO3), referring to the orbitals contained in the self-consistent (TIER II) subspace, see Fig. 2. For the TIER I subspace, which is treated with EDMFT, we choose the subspace of orbitals, where we expect the strongest correlation effects.
II.2 SrVO3
SrVO3 is a well-studied [14, 15, 16, 17, 18, 19, 20, 9, 21, 22] metallic perovskite compound, with a near-perfect cubic structure. Experimentally, it is found to be a metal with moderately renormalized conduction bands. Near the Fermi level, photoemission spectroscopy measurements [17] find a reduction of the band velocity by about a factor of two, compared to the LDA bandstructure. The photoemission spectra furthermore reveal an almost dispersionless feature around eV, which has been interpreted as a lower Hubbard band [16, 15], or as a signal originating primarily from Oxygen vacancies [20]. Inverse photoemission [19] and X-ray absorption spectra [23] reveal a broad peak centered at 2.5-3 eV in the unoccupied part of the spectrum, which could be an upper Hubbard band [16, 15], a plasmon sideband [9, 21, 22], or a feature originating from states [19].
II.2.1 Filling, interactions, and mass enhancements
At the LDA level, SrVO3 contains one electron per unit cell in the conduction bands (V 3 orbitals). Its bands are isolated from the empty bands and the filled Oxygen bands (see Fig. 1).
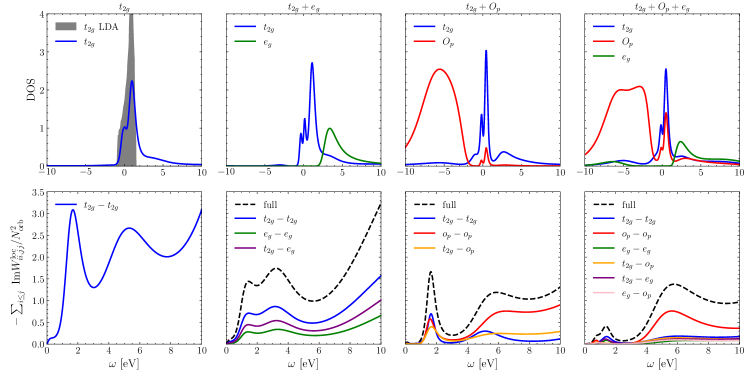
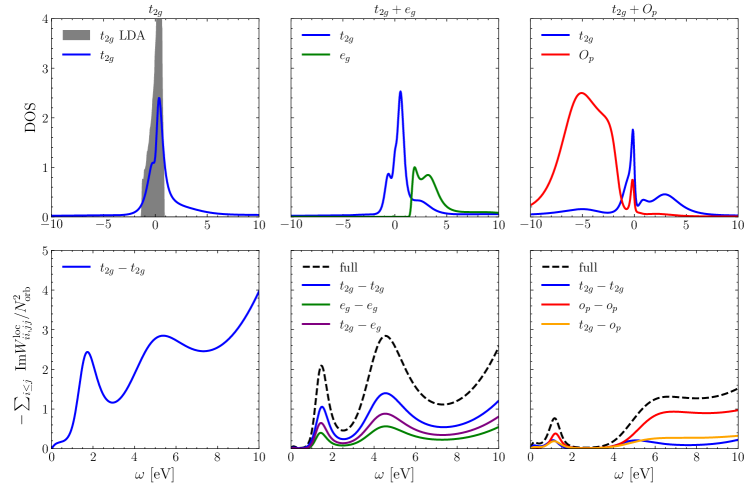
In the +EDMFT results, shown in Fig. 3, the local DOS displays a prominent quasiparticle peak, moderately renormalized with respect to the LDA DOS, and two side peaks which are not captured by DFT – a weak satellite in the range from to eV and a more prominent broad feature around - eV. To test the consistency of the EMDFT results, we take a closer look at the evolution of the spectral features with increasing size of the self-consistent (SC = Tier II + Tier I) space, and check how they compare with experimental data.
| 1.00 | 0.87 | 1.91 | 1.93 | |
| 0.61 | 0.64 | 0.36 | 0.44 | |
| 1.5 | 1.6 | 3.6 | 7.7 | |
| 2.7 | 2.8 | 5.1 | 9.2 | |
| 0.4 | 0.4 | 0.5 | 0.5 | |
| 3.5 | 3.6 | 6.6 | 11.8 | |
| 1.2 | 1.0 | 1.5 | 1.6 |
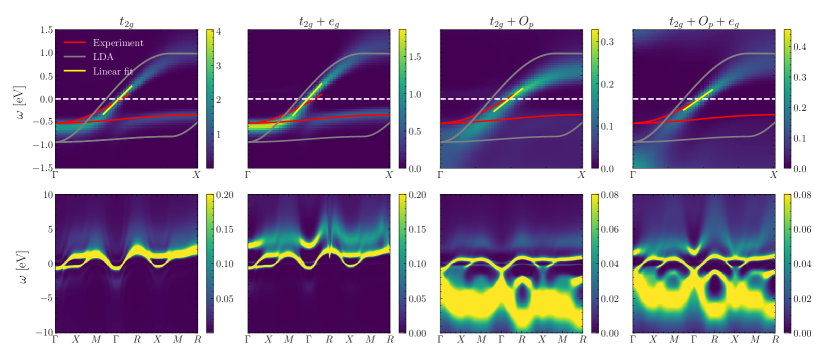
The last column of Tab. 1 reports the +EDMFT mass enhancements with respect to the LDA bandstructure, computed as a ratio of Fermi velocities. The corresponding fits to the correlated bands are shown in Fig. 4. We note that while the mass enhancements of - are comparable in the and models, up to the numerical uncertainty of the fitting procedure, the and models yield a stronger mass enhancement of , which is closer to the experimental value of . [17]
A larger SC space implies an increased degree of localization of the Wannier functions spanning this space, and a larger number of screening channels which are excluded in the cRPA construction. As a result, both the bare and screened interactions are larger in the models including , compared to the and models (see Fig. 1). We list the static () values of the local cRPA and impurity interactions in Tab. 1. Without the oxygen bands in the model, adding the states to the manifold has little effect on the effective interaction, consistent with previous findings [22]. The impact of the states however increases drastically when we further include the Oxygen states, as evidenced by a significant enhancement of the impurity interaction in the model when compared to the one. This demonstrates the important role of the - screening channels.
For the model, our cRPA static interaction is close to the value of reported in Ref. 21, while the static effective impurity interaction is almost identical to the difference (with the nearest-neighbor interaction), and hence to the naive estimate of the effective local interaction which takes nonlocal screening into account [24]. This confirms that our +EDMFT framework yields meaningful effective interactions.
A second effect, which influences the degree of correlations in our calculations, is the filling of the orbitals (indicated by in Tab. 1). Due to the hybridization with Oxygen states, in the and models (henceforth referred to as “ models”) is almost twice the filling of the three band counterpart. The “extra” electron in these models can be found by integrating the local spectral function of Fig. 3 in an energy window covering the Oxygen states.
II.2.2 Fermionic spectral functions
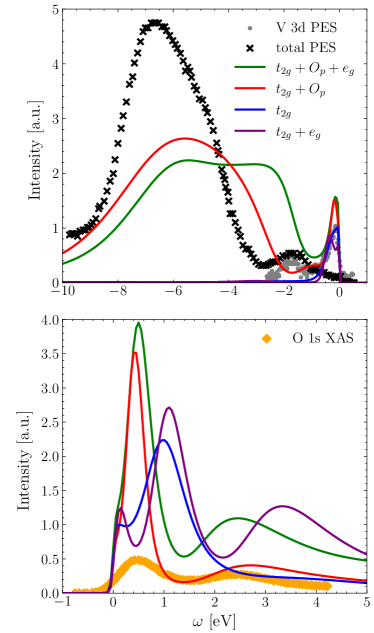
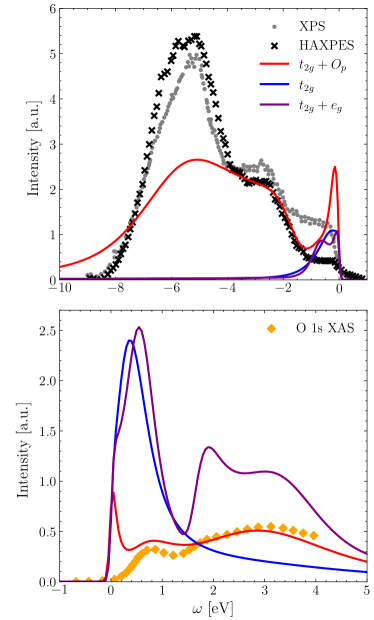
A comparison between the occupied parts of the local spectral function and photoemission spectroscopy (PES) data from Ref. 23 is shown in the top panel of Fig. 5. We note that the occupied part of the quasiparticle peak is well reproduced by all models, and that the spectral function appears to best capture a portion of the incoherent spectral weight (the latter is very broad and weak at eV in the and models). There is a widespread view in the literature that the feature found in experiments at eV represents a lower Hubbard band [16, 15]. Its relative amplitude with respect to the quasiparticle peak might however be severely overestimated by the presence of Oxygen vacancies generated by high UV doses [20]. The latter produce states at the same energy as the purported lower Hubbard band.
When compared to experimental PES, the models underestimate the binding energy of the Oxygen states by roughly 1-2 eV, a mismatch that we already find at the level of LDA. Fixing this inaccuracy hence most likely requires a scheme with full charge self-consistency (in TIER III) or some modification of the bandstructure input. The too strong hybridization with the Oxygen states is also the cause of the strong broadening and inaccurate dispersion of the occupied quasiparticle bands in the models, compared to the experimental data in Ref. 20 (top row of Fig. 4). In this comparison, it appears that the position of the renormalized occupied bands (but not their slope at the Fermi level) is better reproduced by the and models.
The dispersions on a longer momentum path (bottom row of Fig. 4) show similar widths of the occupied bands in all four models, consistent with the local spectra in Fig. 3.
A comparison of the unoccupied parts of the spectral function to Oxygen X-ray absorption spectra (O 1s XAS) from Ref. 23 is shown in the bottom panel of Fig. 5. O 1s XAS probes transitions from Oxygen core states to orbitals with partial Oxygen character. Since the Oxygens hybridize with the and orbitals, O 1s XAS allows to probe the unoccupied and states. The XAS spectrum has two notable humps at 0.5 and 2.5 eV, respectively, which are in good agreement with the peaks of the models, which explicitly capture the - and - hybridization. The quasiparticle peak in the models is strongly renormalized in the unoccupied part of the spectrum, compared to the and models, which is consistent with the previously noted stronger renormalization of the Fermi velocity. A comparison to the XAS data further shows that this much stronger renormalization is consistent with experiment.
II.2.3 Plasmon satellites and loss function
The nature of the spectral feature at around eV is still under debate [19, 22]. It has been interpreted as an upper Hubbard band [16], or as a (sub)plasmon feature originating from charge excitations within the manifold [10]. +EDMFT, which treats correlation and screening effects in a self-consistent manner, should be a useful tool for distinguishing between these two scenarios. Assuming that the satellite in the occupied part of the spectrum is the lower Hubbard band, the tentative upper Hubbard band position can be estimated from the static limit of the effective local interaction. The Mott gap in the atomic limit is , where is the electron population of the manifold and the lowest energies in the different charge sectors are obtained via Exact Diagonalization (ED) of a Kanamori-type Hamiltonian for the orbitals. Comparing the atomic gap values in Tab. 1 to the separation between the lower and upper satellites in the local DOS (Fig. 3) shows that the separations are too large/small with respect to the atomic gap values in all models, with the exception of the model. There is compatible with the subband splitting, making it difficult in this case to rule out a Hubbard band interpretation. These findings are consistent with the analysis of the and models in Refs. 9, 22.
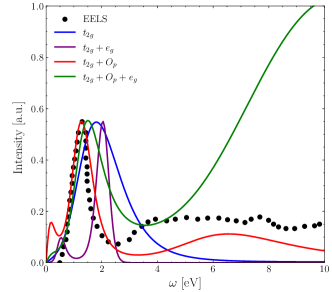
To test the plasmon scenario as a possible explanation for the high energy spectral feature, we focus on the imaginary part of the local screened interaction , reported in the bottom row of Fig. 3, and the loss function shown in Fig. 6. features two low energy peaks between 0 and 6 eV in all model spaces. For the and models, the calculated loss function does not feature the peak above 3 eV, present in the screened interaction, suggesting that the peak in for these models should originate directly from , which implicitly (through the downfolding) contains the Oxygen screening and whose spectrum indeed has a feature in this energy range, as evidenced in the plot of in Fig. 1.
When the Oxygen states are explicitly included, the loss function recovers the higher energy peak, in reasonable agreement with that of for the model, implying that the upper lying peak is mostly due to Oxygen states. This is also evidenced by its dominant oxygen character (Fig. 3). The large upper peak in the loss function can be traced back to the large - pole in in the 3-, 5- and 12-band models (bottom left of Fig. 1), which is now explicitly included in the screening channels of the 14-band model, captured by the loss function. Its relative amplitude is severely overestimated when compared to experiment, potentially due to a lower maximum Matsubara frequency cutoff used in the 14-band model.
The lower lying experimental peak at eV is captured rather well by all models and is mostly of V character, with some contribution from the O states.
A plasmonic excitation should manifest itself as a faint replica of the quasiparticle bandstructure, separated by the plasmon frequency (pole of the local screened interaction). A plasmon feature in the local fermionic spectral function would then be expected at , where is the position of the quasiparticle peak and the energy of one of the poles in . Such satellite features are indeed evident in the momentum resolved spectra shown in Fig. 4, which resemble the + cumulant expansion results in Ref. 21.
More quantitatively, taking the lowest energy poles of at and eV for the , , and models, respectively, is roughly at , , and eV. These values are compatible with the energy region of the right-most hump in the fermionic DOS (top row of Fig. 3).
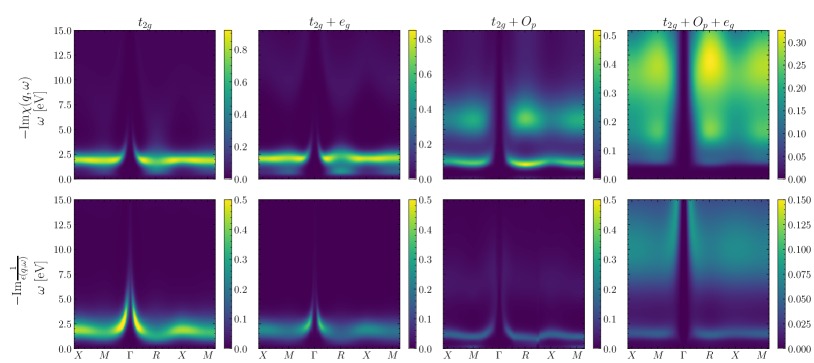
There is thus substantial evidence for interpreting the satellite in the unoccupied spectrum as a (sub-)plasmonic excitation. The dispersion of the plasmon is depicted in Fig. 7, which plots the charge susceptibility alongside the momentum-resolved loss function, which should diverge for plasmonic excitations. The negative curvature around the point can be likely attributed to band-structure effects similar to those occurring in transition metal dichalcogenides [26, 27].
The orbital make-up of the low-energy plasmonic excitation is mostly composed of - and - excitations in all models (see the orbital-resolved plots of in Fig. 3), although excitations involving states also remain competitive, likely due to - and - hybridization.
II.3 SrCrO3
SrCrO3 is a less-studied compound, whose ground state is still under debate due to a difficult high-pressure synthesis procedure. The first experimental measurements [28] suggested that SrCrO3 is a paramagnetic metal, while more recent results [29] reported a paramagnetic insulating behavior. EELS measurements performed in Ref. 30 indicate a paramagnetic metal. These experimental results contradict the numerical DFT calculations in Ref. 31, which predicted a rare antiferromagnetic (AFM) weakly correlated metallic phase, which was later supported by X-ray and O 1s XAS data [32]. A recent DFT+DMFT investigation [33] found that SrCrO3 can potentially host a charge disproportionated meta-stable insulating state, although implementing charge self-consistency yielded a metallic solution. It is thus interesting to apply the +EDMFT machinery to this compound.
| 2.00 | 1.83 | 2.95 | |
| (from ) | 0.50 | 0.54 | 0.16 |
| 1.4 | 1.1 | 5.8 | |
| 2.3 | 2.3 | 4.6 | |
| 0.3 | 0.4 | 0.6 | |
| 3.0 | 3.2 | 6.1 |
At the LDA level, there are 2 electrons in the derived bands. +EDMFT yields similar occupations for the and models, while the -like orbitals are almost half-filled in the model, see Tab. 2. The static values are smaller than in the case of SrVO3, but since the filling is larger, the correlation effects are stronger, as indicated by the smaller quasi-particle weight.
The local fermionic spectral functions are plotted for the three models in the top row of Fig. 8. All the solutions are metallic (we restrict our calculation here to the paramagnetic phase). Again, due to stronger bare interactions and larger filling, the renormalization of the bands is more pronounced in the model than in the other two models.
The local spectra show satellites below and above the quasi-particle peak, but in the case of the 3- and 5-band models, a comparison between the energy splitting and the atomic gap (Tab. 2) shows that these cannot be interpreted as Hubbard bands. The corresponding local screened interaction is plotted in the bottom row of Fig. 8. The lowest energy pole in at energy eV is compatible with the satellite feature in the fermionic spectra around eV, and appears to contribute also to the very weak satellite on the occupied side of the spectrum, consistent with the plasmon interpretation. The second lowest pole at energy eV may furthermore contribute to the broad tails of the satellites, although in the case, these contributions are masked by the hybridization with the Oxygen bands (occupied part), and by a possible upper Hubbard band feature (unoccupied part).
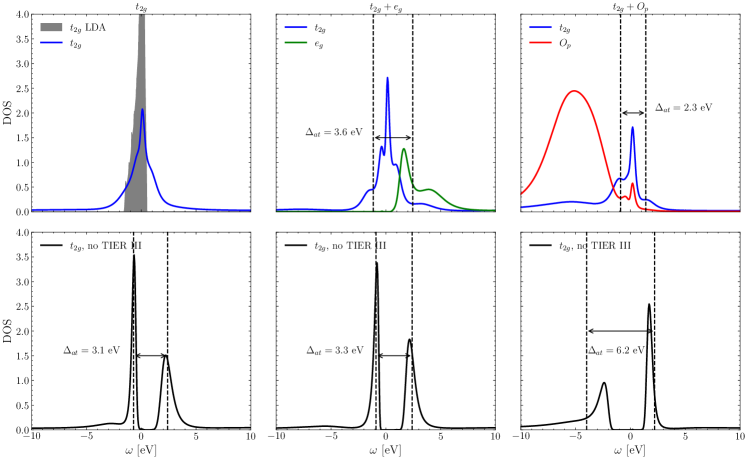
Figure 9 shows a comparison of the occupied and unoccupied spectral functions to the experimental spectra from Ref. 32 in the top and bottom panels, respectively. The occupied part of the spectrum has been probed with X-ray photoemission spectroscopy (XPS/HAXPES) [32] and the unoccupied part with O 1s XAS. We note a very good agreement for the model, which is able to reproduce all features in the occupied Oxygen and in the unoccupied spectrum. Only the presence of a quasi-particle peak is not confirmed by the experiments, but as mentioned above, the experimental situation concerning the metallic or insulating behavior is not yet settled. Nevertheless, we note that for all models, the width of the occupied quasi-particle peak is comparable to the extent of the right-most step feature between and 0 eV in the experimental spectra, which supports the theoretically predicted metallic solution. The first peak near 0.8 eV in the O 1s XAS spectra could be associated either with the first satellite in the model spectrum, or with the much broader quasi-particle peak in the and spectra. Similarly, the second broader satellite near 3 eV, which perfectly agrees in position and shape with the spectrum, could originate also from states, as seen from the comparison to the corresponding hump in the spectrum. A signal from the states is expected in the O 1s XAS spectra, since the Oxygen states also hybridize with the orbitals.
II.4 SrMnO3
| 3.00 (3.00) | 2.79 (3.00) | 3.97 (3.16) | |
| 0.36 | 0.43 | 0.18 | |
| 2.7 (3.1) | 3.6 (3.3) | 2.3 (6.2) | |
| 2.1 (2.3) | 2.5 (2.5) | 4.1 (4.8) | |
| 0.3 (0.4) | 0.3 (0.4) | 0.6 (0.7) | |
| 2.3 | 2.6 | 5.0 |
SrMnO3 is an insulating, antiferromagnetic perovskite compound, with a Néel temperature between 233 K [34] and 266 K [35].
Its Manganese cation hosts 3 -electrons in the unit cell, which at the LDA level occupy almost entirely the bands (Fig. 1). In paramagnetic +EDMFT calculations at , the local spectral function exhibits metallic behavior, with a quasi-particle peak in the vicinity of the Fermi level (Fig. 10), for all the low-energy subspaces considered. Upon removing the TIER III () self-energy contribution (which contains metallic screening from the DFT bandstructure), however, one recovers an electronic gap (bottom row of Fig. 10). This suggests a sensitivity of the method to the DFT starting point, since the metallicity of the DFT solution affects the EDMFT result even after self-consistency.
While the gap is missing in the full calculation, we may nevertheless proceed with the analysis of the higher-energy structures in the local spectral function. Here, we note the appearance of satellites in the and model spectra, whose separation is in good agreement with the gap computed in the atomic limit via ED, see Tab. 3 and the arrows in Fig. 10. We thus interpret these features as Hubbard bands. The Hubbard satellites cannot be resolved in the model, but they become prominent once we add the states. This shows that the states have a significant effect on the low-energy screening in SrMnO3, and hence on the correlation strength, as confirmed by the static impurity interaction values in Tab. 3. A more active role of the states, compared to SrVO3 and SrCrO3, is already expected from the LDA bandstructure (Fig. 1), where the bands for SrMnO3 overlap with the bands.
Incorporating the Oxygen orbitals into the SC space again results in a jump in the filling of the orbitals, as in the case of SrVO3: the shell now has nominally one extra electron coming from the hybridization with the Oxygens (see the prominent hump in Fig. 10 at eV). The quasi-particle weight, estimated from undergoes a substantial renormalization by a factor of two, compared to the model, which is more pronounced than what we observed for SrVO3.
III Discussion
We have systematically tested the multi-tier +EDMFT framework on the perovskite compounds SrXO3 (X=V, Cr, Mn) by comparing the low-energy electronic structures calculated in different energy windows. If the downfolding to these model subspaces, as well as the solutions of the corresponding many-body problems would be implemented with exact methods, the results would be consistent (up to hybridization effects).
For practical reasons the downfolding has been implemented here via cRPA and single-shot , while TIER II is treated at the level (with local vertex corrections), and TIER III at the EDMFT level (with density-density interactions). It is thus interesting to test to what extent this ab-initio framework produces consistent results for different model spaces. While inaccuracies may be expected for very small low-energy subspaces, one would expect systematic improvements as the self-consistently solved model spaces are enlarged.
To judge if this is indeed the case, we compared the calculated results to available PES and XAS data. For SrVO3, +EDMFT predicts a moderately correlated metallic phase in all model spaces, with the models yielding mass enhancements closest to experiment. The reduced band velocity near the Fermi level is a consequence of a strong renormalization of the bands in the unoccupied part of the spectrum, while in the occupied part, the and models actually produce a better agreement with the PES measurements along the -X path. The much stronger renormalization of the unoccupied bands in the models is consistent with the O 1s XAS spectrum, which due to hybridization between the and orbitals provides information on the unoccupied states. The much discussed satellite at eV in the local spectra (which has been interpreted as a lower Hubbard band or as a signal from Oxygen vacancies) is weakly present as a shoulder feature at -1 eV in the models, while the satellite around 3 eV could be interpreted as a plasmon. The position of the Oxygen bands in the calculations is about 1 eV too high, compared to the PES data, but this is already the case in the LDA input. Our calculations are not self-consistent in TIER III, and a charge-self consistent implementation could potentially correct this inaccuracy.
In the case of SrCrO3 we have demonstrated an excellent agreement between the model results and the available XPS and O 1s XAS data for the Oxygen and unoccupied states, while the signature of the quasi-particle peak is not clearly seen in XPS. The low-energy peak in the O 1s XAS would however be equally consistent with the (much wider) quasi-particle band of the and models, so that it is not clear in this case if the stronger correlation effects in the description improve the agreement with experiment. Again, the high-energy satellite near eV overlaps with the states, so that the XAS signal presumably detects not only the plasmon satellite of the bands, but also the states.
For SrMnO3, our paramagnetic calculations in all three model subspaces predict a metallic system, likely caused by the metallicity of the DFT starting point.
Our and simulations produced Hubbard bands in the (metallic) spectra, in contrast to the -only calculations. This shows that in this system, the states (which are very close to the Fermi level) play a relevant role in the low-energy screening of the electrons [22].
Overall, our calculations demonstrated a fair agreement between the first-principles results for the different model subspaces, and between the calculated and experimentally measured data, bearing in mind the absence of adjustable parameters in +EDMFT. Our study, however, also showed that there exist significant discrepancies between the results from the and model spaces, with the latter exhibiting stronger correlation effects. Since the and calculations appear to be in overall better agreement with the experiments, this hints at an overestimation of screening in the cRPA downfolding. An accurate treatment of screening from low-energy bands may require more sophisticated downfolding schemes [36, 13].
IV Methods
The DFT calculations were performed with the all-electron full-potential linearized augmented plane-wave (FLAPW) code FLEUR [37] on a k-point mesh, and the cRPA and downfolding with a customized SPEX code [38]. Wannier functions from the Wannier90 library [39] were used to define the models. The self-consistent multi-tier +EDMFT calculations were performed with the implementation described in Refs. 10, 9, using a CT-HYB quantum impurity solver for multi-orbital models with retarded interactions [40, 41]. A detailed description can be found in the Supplementary Material. A k-point grid and an inverse temperature of were used in all self-consistent -EDMFT calculations, with 477 Matsubara frequencies for the 3-, 5- and 12-band models and 238 for the 14-band model. The charge susceptibilities and dielectric functions were computed with the procedures described in the Supplementary Material.
Acknowledgements.
This work was supported by the Swiss National Science Foundation via NCCR Marvel and SNSF Grant No. 200021-196966. The calculations were run on the beo05 cluster at the University of Fribourg. F.P. acknowledges helpful discussions with Antoine Georges.References
- Dagotto [2005] E. Dagotto, Complexity in strongly correlated electronic systems, Science 309, 257 (2005), https://www.science.org/doi/pdf/10.1126/science.1107559 .
- Hohenberg and Kohn [1964] P. Hohenberg and W. Kohn, Inhomogeneous electron gas, Phys. Rev. 136, B864 (1964).
- Kohn and Sham [1965] W. Kohn and L. J. Sham, Self-consistent equations including exchange and correlation effects, Phys. Rev. 140, A1133 (1965).
- Georges et al. [1996] A. Georges, G. Kotliar, W. Krauth, and M. J. Rozenberg, Dynamical mean-field theory of strongly correlated fermion systems and the limit of infinite dimensions, Rev. Mod. Phys. 68, 13 (1996).
- Haule and Birol [2015] K. Haule and T. Birol, Free energy from stationary implementation of the functional, Phys. Rev. Lett. 115, 256402 (2015).
- Shim et al. [2007] J. H. Shim, K. Haule, and G. Kotliar, Modeling the localized-to-itinerant electronic transition in the heavy fermion system , Science 318, 1615 (2007).
- Karolak et al. [2010] M. Karolak, G. Ulm, T. Wehling, V. Mazurenko, A. Poteryaev, and A. Lichtenstein, Double counting in lda+dmft—the example of nio, Journal of Electron Spectroscopy and Related Phenomena 181, 11 (2010), proceedings of International Workshop on Strong Correlations and Angle-Resolved Photoemission Spectroscopy 2009.
- Biermann et al. [2003] S. Biermann, F. Aryasetiawan, and A. Georges, First-principles approach to the electronic structure of strongly correlated systems: Combining the approximation and dynamical mean-field theory, Phys. Rev. Lett. 90, 086402 (2003).
- Boehnke et al. [2016] L. Boehnke, F. Nilsson, F. Aryasetiawan, and P. Werner, When strong correlations become weak: Consistent merging of and dmft, Phys. Rev. B 94, 201106 (2016).
- Nilsson et al. [2017] F. Nilsson, L. Boehnke, P. Werner, and F. Aryasetiawan, Multitier self-consistent , Phys. Rev. Mater. 1, 043803 (2017).
- Kang et al. [2023] B. Kang, P. Semon, C. Melnick, G. Kotliar, and S. Choi, Comdmft v.2.0: Fully self-consistent ab initio gw+edmft for the electronic structure of correlated quantum materials, arXiv:2310.04613 (2023).
- Hedin [1965] L. Hedin, New method for calculating the one-particle green’s function with application to the electron-gas problem, Phys. Rev. 139, A796 (1965).
- Honerkamp et al. [2018] C. Honerkamp, H. Shinaoka, F. F. Assaad, and P. Werner, Limitations of constrained random phase approximation downfolding, Phys. Rev. B 98, 235151 (2018).
- Morikawa et al. [1995] K. Morikawa, T. Mizokawa, K. Kobayashi, A. Fujimori, H. Eisaki, S. Uchida, F. Iga, and Y. Nishihara, Spectral weight transfer and mass renormalization in mott-hubbard systems and : Influence of long-range coulomb interaction, Phys. Rev. B 52, 13711 (1995).
- Sekiyama et al. [2004] A. Sekiyama, H. Fujiwara, S. Imada, S. Suga, H. Eisaki, S. I. Uchida, K. Takegahara, H. Harima, Y. Saitoh, I. A. Nekrasov, G. Keller, D. E. Kondakov, A. V. Kozhevnikov, T. Pruschke, K. Held, D. Vollhardt, and V. I. Anisimov, Mutual experimental and theoretical validation of bulk photoemission spectra of , Phys. Rev. Lett. 93, 156402 (2004).
- Pavarini et al. [2004] E. Pavarini, S. Biermann, A. Poteryaev, A. I. Lichtenstein, A. Georges, and O. K. Andersen, Mott transition and suppression of orbital fluctuations in orthorhombic perovskites, Phys. Rev. Lett. 92, 176403 (2004).
- Yoshida et al. [2005] T. Yoshida, K. Tanaka, H. Yagi, A. Ino, H. Eisaki, A. Fujimori, and Z.-X. Shen, Direct observation of the mass renormalization in by angle resolved photoemission spectroscopy, Phys. Rev. Lett. 95, 146404 (2005).
- Sakuma et al. [2013] R. Sakuma, P. Werner, and F. Aryasetiawan, Electronic structure of srvo3 within +dmft, Phys. Rev. B 88, 235110 (2013).
- Tomczak et al. [2014] J. M. Tomczak, M. Casula, T. Miyake, and S. Biermann, Asymmetry in band widening and quasiparticle lifetimes in : Competition between screened exchange and local correlations from combined and dynamical mean-field theory , Phys. Rev. B 90, 165138 (2014).
- Backes et al. [2016] S. Backes, T. C. Rödel, F. Fortuna, E. Frantzeskakis, P. Le Fèvre, F. Bertran, M. Kobayashi, R. Yukawa, T. Mitsuhashi, M. Kitamura, K. Horiba, H. Kumigashira, R. Saint-Martin, A. Fouchet, B. Berini, Y. Dumont, A. J. Kim, F. Lechermann, H. O. Jeschke, M. J. Rozenberg, R. Valentí, and A. F. Santander-Syro, Hubbard band versus oxygen vacancy states in the correlated electron metal , Phys. Rev. B 94, 241110 (2016).
- Nakamura et al. [2016] K. Nakamura, Y. Nohara, Y. Yosimoto, and Y. Nomura, Ab initio plus cumulant calculation for isolated band systems: Application to organic conductor and transition-metal oxide , Phys. Rev. B 93, 085124 (2016).
- Petocchi et al. [2020] F. Petocchi, F. Nilsson, F. Aryasetiawan, and P. Werner, Screening from states and antiferromagnetic correlations in perovskites: A investigation, Phys. Rev. Res. 2, 013191 (2020).
- Inoue et al. [1994] I. Inoue, I. Hase, Y. Aiura, A. Fujimori, K. Morikawa, T. Mizokawa, Y. Haruyama, T. Maruyama, and Y. Nishihara, Systematic change of spectral function observed by controlling electron correlation in ca1-xsrxvo3 with fixed 3d1 configuration., Physica C: Superconductivity 235-240, 1007 (1994).
- Schüler et al. [2013] M. Schüler, M. Rösner, T. O. Wehling, A. I. Lichtenstein, and M. I. Katsnelson, Optimal hubbard models for materials with nonlocal coulomb interactions: Graphene, silicene, and benzene, Phys. Rev. Lett. 111, 036601 (2013).
- Su et al. [2023] C.-P. Su, K. Ruotsalainen, A. Nicolaou, M. Gatti, and A. Gloter, Plasmonic properties of srvo3 bulk and nanostructures, Advanced Optical Materials 11, 2202415 (2023).
- van Wezel et al. [2011] J. van Wezel, R. Schuster, A. König, M. Knupfer, J. van den Brink, H. Berger, and B. Büchner, Effect of charge order on the plasmon dispersion in transition-metal dichalcogenides, Phys. Rev. Lett. 107, 176404 (2011).
- Husain et al. [2023] A. A. Husain, E. W. Huang, M. Mitrano, M. S. Rak, S. I. Rubeck, X. Guo, H. Yang, C. Sow, Y. Maeno, B. Uchoa, T. C. Chiang, P. E. Batson, P. W. Phillips, and P. Abbamonte, Pines’demon observed as a 3d acoustic plasmon in sr2ruo4, Nature 621, 66 (2023).
- Chamberland [1967] B. Chamberland, Preparation and properties of srcro3, Solid State Communications 5, 663 (1967).
- Zhou et al. [2006] J.-S. Zhou, C.-Q. Jin, Y.-W. Long, L.-X. Yang, and J. B. Goodenough, Anomalous electronic state in and , Phys. Rev. Lett. 96, 046408 (2006).
- Alario-Franco [2008] Alario-Franco, Electron energy loss spectroscopy in acro3 (a = ca, sr and pb) perovskites, Journal of Physics: Condensed Matter 20, 505207 (2008).
- Qian et al. [2011] Y. Qian, G. Wang, Z. Li, C. Q. Jin, and Z. Fang, The electronic structure of a weakly correlated antiferromagnetic metal, srcro3: first-principles calculations, New Journal of Physics 13, 053002 (2011).
- Zhang et al. [2015] K. H. L. Zhang, Y. Du, P. V. Sushko, M. E. Bowden, V. Shutthanandan, L. Qiao, G. X. Cao, Z. Gai, S. Sallis, L. F. J. Piper, and S. A. Chambers, Electronic and magnetic properties of epitaxial perovskite srcro3(001), Journal of Physics: Condensed Matter 27, 245605 (2015).
- Carta et al. [2023] A. Carta, A. Panda, and C. Ederer, Emergence of a potential charge disproportionated insulating state in srcro3 (2023), arXiv:2312.12033 [cond-mat.str-el] .
- Chmaissem et al. [2001] O. Chmaissem, B. Dabrowski, S. Kolesnik, J. Mais, D. E. Brown, R. Kruk, P. Prior, B. Pyles, and J. D. Jorgensen, Relationship between structural parameters and the néel temperature in and , Phys. Rev. B 64, 134412 (2001).
- Takeda and Ohara [1974] T. Takeda and S. Ohara, Magnetic structure of the cubic perovskite type srmno¡sub¿3¡/sub¿, Journal of the Physical Society of Japan 37, 275 (1974).
- Shinaoka et al. [2015] H. Shinaoka, M. Troyer, and P. Werner, Accuracy of downfolding based on the constrained random-phase approximation, Phys. Rev. B 91, 245156 (2015).
- [37] FLEUR project: http://www.flapw.de.
- Friedrich et al. [2010] C. Friedrich, S. Blügel, and A. Schindlmayr, Efficient implementation of the approximation within the all-electron flapw method, Phys. Rev. B 81, 125102 (2010).
- Pizzi et al. [2020] G. Pizzi, V. Vitale, R. Arita, S. Blügel, F. Freimuth, G. Géranton, M. Gibertini, D. Gresch, C. Johnson, T. Koretsune, J. Ibañez-Azpiroz, H. Lee, J.-M. Lihm, D. Marchand, A. Marrazzo, Y. Mokrousov, J. I. Mustafa, Y. Nohara, Y. Nomura, L. Paulatto, S. Poncé, T. Ponweiser, J. Qiao, F. Thöle, S. S. Tsirkin, M. Wierzbowska, N. Marzari, D. Vanderbilt, I. Souza, A. A. Mostofi, and J. R. Yates, Wannier90 as a community code: new features and applications, Journal of Physics: Condensed Matter 32, 165902 (2020).
- Werner et al. [2006] P. Werner, A. Comanac, L. de’ Medici, M. Troyer, and A. J. Millis, Continuous-time solver for quantum impurity models, Phys. Rev. Lett. 97, 076405 (2006).
- Werner and Millis [2010] P. Werner and A. J. Millis, Dynamical screening in correlated electron materials, Phys. Rev. Lett. 104, 146401 (2010).