Ices on pebbles in protoplanetary discs
Abstract
The formation of solid macroscopic grains (pebbles) in protoplanetary discs is the first step toward planet formation. We aim to study the distribution of pebbles and the chemical composition of their ice mantles in a young protoplanetary disc. We use the two-dimensional hydrodynamical code FEOSAD in the thin-disc approximation, which is designed to model the global evolution of a self-gravitating viscous protoplanetary disc taking into account dust coagulation and fragmentation, thermal balance, and phase transitions and transport of the main volatiles (H2O, CO2, CH4 and CO), which can reside in the gas, on small dust ( m), on grown dust ( m) and on pebbles. We model the dynamics of the protoplanetary disc from the cloud collapse to the 500 kyr moment. We determine the spatial distribution of pebbles and composition of their ice mantles and estimate the mass of volatiles on pebbles, grown dust and small dust. We show that pebbles form as early as 50 kyr after the disc formation and exist until the end of simulation (500 kyr), providing prerequisites for planet formation. All pebbles formed in the model are covered by icy mantles. Using a model considering accretion and desorption of volatiles onto dust/pebbles, we find that the ice mantles on pebbles consist mainly of H2O and CO2, and are carbon-depleted compared to gas and ices on small and grown dust, which contain more CO and CH4. This suggests a possible dominance of oxygen in the composition of planets formed from pebbles under these conditions.
keywords:
astrochemistry – accretion, accretion discs – protoplanetary discs – hydrodynamics – solid state: volatile – stars: pre-main-sequence1 Introduction
There is a number of unsolved problems in the theory of planet formation, e.g., the formation of kilometre-scale planetesimals from micron grains. In the context of giant planet formation, the subsequent stages may possibly involve the core accretion mechanism (Mizuno, 1980; Bodenheimer & Pollack, 1986; Pollack et al., 1996; Boley, 2009; Helled et al., 2014). Recently, more attention is drawn to the mechanism of pebble accretion (Ormel & Klahr, 2010; Lambrechts & Johansen, 2012; Morbidelli et al., 2015; Ida et al., 2016; Lambrechts et al., 2017; Johansen & Lambrechts, 2017), which may solve many problems related to the timescale of the gas and ice giants formation (Bitsch et al., 2015). Given the relatively short lifetimes of protoplanetary discs (on the order of million years; Haisch et al., 2001; Mamajek, 2009; Pfalzner et al., 2014), pebbles may contribute significantly to planet formation.
Pebbles are macroscopic solid dust grains, typically larger than a few millimetres, that are large enough to drift relative to gas (and to small dust grains dynamically coupled to gas), but small enough for gas to have a noticeable effect on their dynamics in the conditions of protoplanetary discs (Lambrechts & Johansen, 2012). Because of friction with the gas, pebbles accrete onto protoplanetary cores much more efficiently than planetesimals, thus accelerating the process of planet formation (Ormel & Klahr, 2010). The chondrules present in primitive meteorites have characteristic sizes on the order of millimetres, indicating that their parent bodies may have formed as a result of pebble accretion (Johansen et al., 2015). The fragmentation barrier and dust drift barrier also give a similar value of maximum dust size in protoplanetary discs (from millimetres to decimetres, Testi et al., 2014).
The collisional evolution of dust and its interaction with gas allow dust grains to grow to macroscopic sizes (1 cm), but this process does not lead directly to the formation of planetesimals (Testi et al., 2014). Besides coagulation, which leads to grains sticking and growing in size, dust is also subject to fragmentation, if the grains collide with impact velocities exceeding some threshold value m s-1. The dust size distribution function is the result of the balance of these two processes, and the fragmentation velocity plays an important role in establishing this balance.
The studies by Elbakyan et al. (2020) and Vorobyov et al. (2023) show that the amount and spatial distribution of pebbles in the protoplanetary disc depend significantly on the fragmentation velocity.
The fragmentation velocity, in turn, depends on the properties of dust grains, in particular, on the presence of ice mantles that weakens the fragmentation (Wada et al., 2009; Gundlach & Blum, 2015; Okuzumi et al., 2016). Therefore, ice mantles on the dust grain surface should favour the formation of pebbles. Destruction of ice mantles by luminosity outbursts characteristic of young stars leads to potentially observable changes in the dust properties in protoplanetary discs (Vorobyov et al., 2022; Houge & Krijt, 2023). The distribution of volatiles in the disc determines the chemical composition of the ice mantles and changes dramatically in the vicinity of the snowlines. In particular, various ices accumulate at their respective snowlines (Stevenson & Lunine, 1988; Stammler et al., 2017; Krijt et al., 2018; Molyarova et al., 2021). Snowlines are also associated with the formation of planetesimals (Drążkowska & Alibert, 2017; Okuzumi et al., 2012).
The chemical composition of the ice covering the dust grains, and particularly pebbles, is noteworthy because it may be related to the future composition of the proto-atmospheres of the forming planets (Öberg et al., 2011b; Eistrup et al., 2018; Öberg & Wordsworth, 2019; Linz et al., 2021; Eistrup & Henning, 2022). Throughout its evolution, the protoplanetary disc is affected by many physical and chemical factors and undergoes significant changes, such as episodic accretion outbursts (see Hartmann et al., 1998; Audard et al., 2014). However, to date, there are not many studies on the evolution of the chemical composition of pebbles subject to collisional evolution in protoplanetary discs. Few mechanisms have been found to explain the possible change in the chemical composition of pebbles with time. For example, there is an effect of diffusion of vaporised ice mantles back behind the snowline (so-called cold finger effect Meijerink et al., 2009), as well as a similar effect related to azimuthal variations of gas and dust radial velocities in a self-gravitating protoplanetary disc (Molyarova et al., 2021).
In the work by Vorobyov et al. (2023) it was shown that pebbles are present in the disc from the early stages of its evolution, but the ice mantles on dust grains were not taken into account to determine the fragmentation efficiency. Modelling of the dynamics of multicomponent dust taking into account the chemical composition ( although without changes in dust composition due to sublimation or freeze-out) in the three-dimensional SPH model was carried out in Pignatale et al. (2017). It was shown that the drift of dust grains is affected by their material density, leading to the segregation of dust grains of different chemical composition. Using a 1D viscous disc model with dust evolution and chemical kinetics, Booth & Ilee (2019) showed that dust radial drift leads to the enhancement of molecular abundances inside their snowlines. Their model also accounted for the difference in between ice-covered and silicate grains.
In this paper, we study the distribution of pebbles in the protoplanetary disc and the composition of their ice mantles using the 2D thin-disc FEOSAD code (Vorobyov et al., 2018a). Modelling of advection and adsorption/desorption of volatiles is based on the model from Molyarova et al. (2021), and the definition of pebbles is adopted from Vorobyov et al. (2023) with some modifications. The paper is organised as follows. In Section 2 we describe the numerical model and its parameters, emphasising new features compared to the Vorobyov et al. (2018b): the definition of pebbles (Section 2.3) and the volatiles evolution model (Section 2.4). In Section 3, we present the evolution of the composition of the solid component, including ice mantles on small and grown dust and on pebbles. We also study an impact of the initial cloud mass in Section 3.4. In Section 4, we discuss individual model parameters and their influence on the properties of pebbles in the disc the variation of the initial cloud mass. In Section 5, we make conclusions about the dynamics of pebbles in the protoplanetary disc and the composition of their ice mantles.
2 Model description
In this paper, we use numerical simulations of the formation and evolution of the protostellar/protoplanetary disc using the FEOSAD (Formation and Evolution Of Stars And Discs) model presented in Vorobyov et al. (2018b), with further modifications in Molyarova et al. (2021). FEOSAD is a two-dimensional hydrodynamic code in a thin-disc approximation. The simulation starts from the gravitational collapse of a prestellar cloud and ends at the T Tauri stage. The simulation captures spatial scales from a few to thousands of au with a spatial resolution on the log-spaced numerical grid that allows us to study the evolution of various structures in the disc, such as spiral arms, rings, and self-gravitating clumps.
One of the advantages of such 2D modelling is that it uses the full set of hydrodynamic equations and at the same time does not require significant computational resources compared to the full 3D approach. It also allows to more accurately calculate thermal balance as it employs time-dependent energy equation instead of polytropic approximation frequently used in 3D models. A natural shortcoming of the 2D thin disc approximation is that it considers vertically integrated surface densities and lacks the detailed description of the disc vertical structure. For example, the snowlines of the volatiles in the upper layers can be situated at different distances than those in the midplane. It also omits some dynamical processes for which vertical direction is essential, such as meridional circulation. This kind of a thin-disc approach is a useful tool to study the long-term evolution of protoplanetary discs.
The FEOSAD code includes the following physical processes: self-gravity of the disc, turbulent viscosity parameterised using the approach of Shakura & Sunyaev (1973), radiative cooling and heating by the stellar and background irradiation, viscous heating, dust evolution, dust drift relative to gas, including back reaction of dust on gas, and phase transitions and transport of the main volatiles. Dust evolution is determined by collisional growth and fragmentation. Friction between dust and gas includes back reaction of dust grains on gas (see Section 2.1 for more details). Central star properties evolve with time according to stellar evolution code STELLAR (Yorke & Bodenheimer, 2008; Vorobyov et al., 2017) depending on gas accretion to the central sink cell.
2.1 Dynamics of gas and dust
Hydrodynamic equations describing the conservation laws for mass, momentum and energy for the gas component have the form:
| (1) |
| (2) |
| (3) |
where the lower indices and denote the planar components (, ) in polar coordinates, is the gas surface density, is the internal energy per unit surface area, is the vertically integrated gas pressure determined from the ideal equation of state with , is the friction force between gas and dust (see Vorobyov et al., 2023, for more details), is the gas velocity in the disc plane, is the gradient along the planar coordinates of the disc. The gravitational acceleration in the disc plane is defined as and includes the gravity of the central protostar and the self-gravity of gas and dust in the disc, which is calculated by solving the Poisson integral and is the viscous stress tensor (Vorobyov & Basu, 2010). Expressions for radiative cooling and heating (the latter includes stellar and background irradiation) can be found in Vorobyov & Elbakyan (2018). The background radiation temperature is assumed to be 15 K.
Gas and dust evolve together and interact with each other through gravity and friction force, which accounts for the back reaction of dust on gas according to the analytical method described in Stoyanovskaya et al. (2018); Lorén-Aguilar & Bate (2014). Initially, all dust is in the form of small submicron grains, but it grows as the protoplanetary disc forms and evolves. The small submicron dust is assumed to be coupled to the gas, while the grown dust can be dynamically separated from the gas. In this paper, we adopt the same dust growth model as described in Molyarova et al. (2021). In the FEOSAD code, the small and grown dust populations are represented through their surface densities and , respectively. Each dust population has a size distribution according to the power law with the normalisation constant and fixed exponent . For small dust population, the minimum size is cm, and the maximum size is cm. For grown dust, is the minimum size, and is the maximum size, which varies in space and time due to dust coagulation and fragmentation. These distributions are similar to the classic interstellar dust size distribution of Mathis et al. (1977), albeit with different size limits.
The dynamics of small and grown dust grains is described by the following continuity and momentum equations (note that small dust is assumed to be strictly dynamically coupled to gas):
| (4) |
| (5) |
| (6) |
where is the grown dust velocity. The term is the conversion rate of small dust into the grown dust per unit surface area (in g s-1 cm-2). The last term in the equation (5) is responsible for the turbulent diffusion of dust, similar to Vorobyov et al. (2020a). The turbulent diffusivity is related to the kinematic viscosity as , with the Schmidt number .
In the dust growth model, the maximum grown dust size is calculated at each time step for each cell as a solution to the following equation:
| (7) |
where the dust growth rate describes the change in due to coagulation and fragmentation, and the second term on the left-hand side describes the change in due to dust advection. We calculate the dust growth rate as
| (8) |
where is the volume density of dust in the midplane, g cm-3 is the density of the refractory core of dust grains, and is the collision velocity between dust grains. The source term describes dust evolution due to coagulation and fragmentation in the collision between dust grains of both populations. Eq. (8) is based on the monodisperse model of Stepinski & Valageas (1997), adapted for our two-population case by using total dust volume density instead of only that of grown dust. We assume that Brownian motion and turbulence are the main sources of collisions. Thus relative velocity of the colliding dust grains can be expressed from the velocity of Brownian particles and turbulence-induced velocity (Ormel & Cuzzi, 2007; Birnstiel et al., 2012)
| (9) |
Here is the Boltzmann constant, is the midplane temperature, is the mass of particles of the maximum size , is the viscosity parameter (see Section 2.2), is the Stokes number, and is the sound speed. Growth rate depends on through and (see Section 2.3). This approach is described in more detail in Vorobyov et al. (2018b) with a modification of the power-law distribution treatment presented in Molyarova et al. (2021); Vorobyov et al. (2022).
The value of is limited by the fragmentation barrier (Birnstiel et al., 2012), the maximum dust size cannot exceed the value determined by the properties of dust grains. If at any point is higher than , is set to zero. The maximum size of grown dust allowed by fragmentation is defined as
| (10) |
where is the fragmentation velocity, which depends on the presence or absence of ice mantles (see Section 2.4).
2.2 Viscosity parameterisation
To calculate the turbulent viscosity the model uses a variable -parameter in the parameterisation by Shakura & Sunyaev (1973). The viscosity required for mass and angular momentum transport in protoplanetary discs is considered to be primarily due to the turbulence generated by the magnetorotational instability (Balbus & Hawley, 1991; Turner et al., 2014). In FEOSAD, turbulent viscosity is accounted for through the viscous stress tensor (see Eqs. (2), (3)), and its magnitude is defined as , where is the vertical scale height of the gas disc calculated assuming local hydrostatic equilibrium. To simulate accretion in the layered-disc model of Armitage (2010) we consider an effective and adaptive parameter (eq. (12) in Kadam et al., 2022). The parameter is calculated as a weighted average value for the combination of the layers with active and suppressed magneto-rotational instability:
| (11) |
The active layer is assumed to have a surface density of g cm-2, and the dead zone is assumed to have a surface density of . We assume that in the active layer (Flaherty et al., 2017; Flaherty et al., 2018). In the dead zone, if the gas temperature is below K. Otherwise, MRI burst is developed and is set to 0.1, as suggested by the results of 3D simulations of the MRI bursts (Zhu et al., 2020). This parameterisation of allows to account for the suppression of turbulence and the corresponding decrease of mass transport through the dead zone. A more detailed description is presented in Bae et al. (2014); Kadam et al. (2019); Kadam et al. (2022).
2.3 The definition of pebbles
The Stokes number in protoplanetary discs is commonly used to describe dust dynamics. It is defined as
| (12) |
where is the Keplerian angular velocity and is the gas volume density in the midplane. Grains with are most strongly affected by the gas and they drift rapidly in the radial direction toward pressure maxima. Millimetre- to centimetre-sized dust grains known as pebbles are characterised by a relatively high value of and drift relative to the gas, in contrast to smaller dust grains coupled to gas and moving with it.
In this paper we adopt the definition of pebbles from Vorobyov et al. (2023), with some modifications. In FEOSAD, two dust populations are considered, small ( µm) and grown ( µm) dust grains. We define pebbles as the grown dust grains that have Stokes number and the dust radius above some threshold values and . In regions of the disc where both of these conditions are met, the pebbles have a size distribution that is part of the size distribution of grown dust, with sizes ranging from to . The minimum pebble size is
| (13) |
Here is the size of dust grains that have Stokes number equal to for the local disc conditions. In the disc regions where pebbles exist, this value is defined as
| (14) |
In the original definition by Vorobyov et al. (2023), some regions of the disc with were discarded due to the restriction on the minimum pebble size. Some grown dust grains present in such regions were not considered as pebbles because the definition discarded all grown grains at the location instead of only those with radius from to . Our modified definition includes all grown grains with size and Stokes number above the specified boundary values and into definition of pebbles. More detailed comparison of the definition of pebbles in Vorobyov et al. (2023) and in the present work can be found in Appendix A.
For the main model, we adopt the boundary values and cm. To test the sensitivity of the results to the definition of pebbles, we also consider the boundary values and cm in various combinations (see Section 4.1). The criteria for pebble definition are based on studies of Lambrechts & Johansen (2012); Lenz et al. (2019) and references therein. The Stokes number allows us to identify large grains moving independently of the gas, but it also depends on the local gas density. In our simulation there is an infalling envelope surrounding the disc, where reaches large values even for micron-sized dust grains. The condition allows us to leave them out of consideration.
The surface density of pebbles inside each cell is calculated under the assumption that its size distribution function continues with the same slope as the size distribution function for grown dust (), which leads to the following expression:
| (15) |
where µm. Pebbles defined in this way are part of the grown dust population. The surface densities of ices on pebbles are denoted as , where H2O, CO2, CH4 or CO. They are determined from the surface densities of ices on grown dust assuming that mass fraction of ice on pebbles is equal to mass fraction of ice on grown dust.
| (16) |
2.4 The chemical model
We consider four volatile species, H2O, CO2, CH4 and CO, which can be present in the gas, on small dust and on grown dust. Each of the volatile species is described by its surface density in the gas , on small dust , and on grown dust . At the post-processing, we also consider part of the ices on grown dust as the ices on pebbles (see Eq. (16)). The distribution of volatiles in different phases over the disc can change due to the following three main processes: advection, collisional evolution of dust, and phase transitions. These processes are consecutively treated at every hydrodynamic step. First, the phase transitions are calculated as described below in this Section. Then, after the dust evolution step, where grain size is changing due to coagulation and fragmentation, ice mantles are redistributed between the dust populations in the same way as their refractory cores: the mass fraction of ice on small dust moved to the surface of grown dust equals to the mass fraction of small dust transformed into grown dust. At the third step, the volatiles are assumed to advect with their respective component (gas or dust), following the same Eqs. (1)–(3) and (4)–(2.1), using the same third-order-accurate piece-wise parabolic method as for the gas and dust components (Vorobyov et al., 2018a).
The chemical processes in our modelling are treated as described in Molyarova et al. (2021). They include only adsorption of gas-phase species onto the surface of small and grown dust grains, and their thermal desorption, as well as photo-desorption by interstellar UV radiation. No gas-phase or surface reactions are included, and the only considered chemical processes are desorption and adsorption, which were shown to be the most important for gas-phase abundances of most species (Ilee et al., 2011). The chemical evolution of the surface densities of volatile species is calculated analytically from time-dependent balance equations (Eqs. (19)–(21) in Molyarova et al., 2021, see also their Appendix A):
| (17) | |||||
| (18) | |||||
| (19) |
where the mass rate coefficients per disc unit area of adsorption and desorption for the species are calculated for local conditions at every hydrodynamic step, separately for small and grown dust populations. For convenience, we will further omit the indices referring to the species () and the dust population (“sm” or “gr”).
For each dust population, the desorption rate is a sum of thermal desorption and photo-desorption . Thermal desorption rate is calculated from the following expressions
| (20) |
| (21) |
where cm-2 is the surface density of binding sites (characteristic value for amorphous water ice from Cuppen et al., 2017), is the binding energy of the species to the surface, is the species molecular mass, is mass of a proton.
The pre-exponential factor in Eq. (21) is adopted as in Tielens & Allamandola (1987) and Hasegawa & Herbst (1993), and is applied under the assumption of zeroth-order desorption, which seems to better describe desorption of CO and H2O in TPD experiments (Fraser et al., 2001; Öberg et al., 2005; Bisschop et al., 2006). However, as was pointed out by Minissale et al. (2022), this approach to calculation pre-exponential factors does not account for the rotational part of the partition functions of desorbing molecules and consequently underestimates the pre-exponential factor by a few orders of magnitude, especially for bigger molecules. This change in parameter value can lead to the positions of the snowlines shifted to colder regions by several astronomical units. However, the contribution of binding energy to the value of is more significant, as it is included exponentially. We choose to keep the standard approach which was also adopted previously in Molyarova et al. (2021), and note that it affects the precise positions of the snowlines. The adopted values of binding energies are based on the experimental data for sublimation from icy surface (Cuppen et al., 2017). These are 5770 K for H2O, 2360 K for CO2, 1100 K for CH4 and 850 K for CO.
To calculate the desorption rates from each dust population, we also need (cm2 cm-2), which is the total surface area of dust grains (small or grown) per disc unit area. For our power-law size distribution () they are:
| (22) | |||||
| (23) |
Photodesorption rate by interstellar irradiation can be important in the outer disc regions with lower optical depth. We do not include the photo-desorption by stellar or accretion irradiation, because they are more efficient at the inner radii and in the disc upper layers, which are not properly treated in our thin-disc approximation. We assume that the UV radiation field produced by the star and the accretion region is zero in the midplane, where we consider our species to be, due to high optical depth. The photo-desorption rate can be estimated as
| (24) |
where (photons cm-2 s-1) is the UV photon flux and (mol photon-1) is the photodesorption yield. We assume that the photodesorption yield is equal to one of water (Westley et al., 1995).
The radiation flux is calculated for each disc point and is expressed in the units of standard UV field, . The intensity of the interstellar UV radiation field corresponding to is photon cm-2 s-1 (Draine, 1978). For a disc situated in a star-forming region, a slightly elevated unattenuated UV field is applicable, so we assume . For the disc midplane, which is illuminated from above and below, this field scales with the UV optical depth towards the disc midplane as
| (25) |
| (26) |
Here cm2 g-1, cm2 g-1 are typical values of absorption coefficients in the UV for small and grown grains (Pavlyuchenkov et al., 2019, Fig. 1).
The adsorption rate depends on a total surface area of dust per unit volume , which is related to the total surface area of dust per unit disc surface through the scale height as (Brown & Charnley, 1990): Desorption rate formula requires the total surface area of grains, while for the adsorption rate the total collisional cross section is used (Brown & Charnley, 1990), thus an additional factor of emerges and
| (27) |
For more detailed description of the derivation of rate coefficient of adsorption and desorption, please see Section 2.3 in Molyarova et al. (2021).
We assume that initially in a prestellar core, small dust grains are covered with ice mantles, grown dust has not yet formed, and the volatiles are absent in the gas phase. The initial relative abundances of the volatiles are based on observations of ices in protostellar cores around the low-mass protostars Öberg et al. (2011a) and are related as H2O : CO2 : CO : CH. We choose to concentrate on considering main carbon- and oxygen-bearing species, so NH3, which has the abundance comparable to that of CH4, is not included. The initial mass fractions of ices relative to the refractory grain cores is .
Fragmentation velocity is the key parameter that determines , and hence the maximum dust grain size . To account for the effect of ice mantles on dust evolution, we adopt the fragmentation velocity depending on the presence of ice mantles on grown dust. At each time step, the values of are updated after calculating the surface densities of the volatiles. In collisions with velocities , grown dust grains coagulate, while in collisions with higher velocities, they fragment. In this paper, we assume that ice mantles increase regardless of their composition (see Molyarova et al., 2021). This assumption is based on laboratory studies by Wada et al. (2009); Gundlach & Blum (2015). Icy dust grains have m s-1, and bare dust grains have m s-1. Grown dust at a given location in the disc is considered icy if at that location, the total amount of ice on the grown dust is sufficient to cover all grown grains with at least one monolayer of ice. The thickness of the monolayer is estimated as the size of a water molecule cm.
2.5 The considered models and their main parameters
The simulation starts from a molecular cloud core with the initial profiles of gas surface density and angular velocity describing typical prestellar cores
| (28) |
| (29) |
Initially, all refractory material is in the form of small dust, with the surface density calculated assuming dust-to-gas mass ratio of 0.01. The calculation was performed on a polar grid with the outer boundary of the computational area , and the inner boundary . The central disc region inside au is replaced by a sink cell (see Vorobyov et al., 2018a). We assume that about 10% of the matter accreted to the protostar is ejected as jets and outflows. By the end of the simulation, a small amount of mass remains in the envelope. The main parameters of the considered models are summarised in Table LABEL:tab:model.
We consider two models with different initial cloud masses: 0.66 and 1 . We use M1 model ( 0.66 ) as the reference model, and M2 model to investigate how the initial cloud mass affects our conclusions (see Section 3.4). The disc mass relative to the stellar mass at the end of the simulations is quite high and approximately the same in the two models (0.55 and 0.60, respectively), i.e., both discs are gravitationally unstable, but the total mass of the system also affects gas and dust evolution. The disc is formed at 53 kyr in M1 model and at 79 kyr in M2 model.
| Model | (0.5 Myr) | (0.5 Myr) | |||||||
|---|---|---|---|---|---|---|---|---|---|
| () | (%) | (K) | (km s-1 pc-1) | (g cm-2) | (au) | (au) | () | () | |
| M1 | 0.66 | 0.28 | 15 | 2.26 | 1029 | 6116 | 0.40 | 0.22 | |
| M2 | 1.00 | 0.28 | 15 | 1.51 | 1543 | 9170 | 0.58 | 0.35 |
3 RESULTS
3.1 Global disc evolution
Figure 1 shows the global evolution of the disc main parameters in M1 model. The gas and dust surface densities evolve forming a system of ring-like structures in the disc at kyr, seen as bright yellow horizontal lines in panels (a), (b), and (c). The dust size changes dramatically at the water snowline indicated by the cyan dashed line (see panel (d) of Figure 1). Outside the snowline, maximum dust size () reaches centimetres, while inside the snowline it is only fractions of millimetre. In addition, at kyr, an about 1 au wide dust ring is formed at approximately 1 au distance. It appears as a region of higher gas and dust surface densities in the three upper panels of Figure 1, with visible changes in dust size, and Stokes number at the same times ( kyr) and radial distances ( au). Inside this ring, water is in the ice phase (note that the specified region is circumvented by a dashed blue line marking the snowline position) and dust size also reaches centimetres. In panel (g) we can see that inside this ring is significantly lower than , as well as in the regions outside the water snowline. This is due to the fact that in the inner ice ring around 1 au and in almost all regions beyond the water snowline collisional dust fragmentation is less efficient and dust evolution is dominated by radial drift. These regions turn out to be most favourable for the formation of pebbles, as we see in panels (f) and (i). In this context, the ring at au is particularly noteworthy, suggesting possible connection with the formation of the terrestrial planets of the Solar System, which have similar radial distances.
In some disc regions dust becomes large enough to be defined as pebbles (see Section 2.3). Panel (f) of Figure 1 shows that pebbles appear at kyr at distances of about 10 to 50 au. This region begins to expand and after 300 kyr is located between 5 and au. This region is also characterised by the formation of dust rings. In the ring at au shifting with time parallel to the water snowline, the surface density of pebbles reaches g cm-2. In addition, after kyr, a narrow ring of pebbles forms at 1 au at the inner edge of the inner ice ring. As can be seen from the position of the water snowline in panels (f) and (i) of Figure 1, pebbles in the disc exist only in regions where water is in the ice phase.
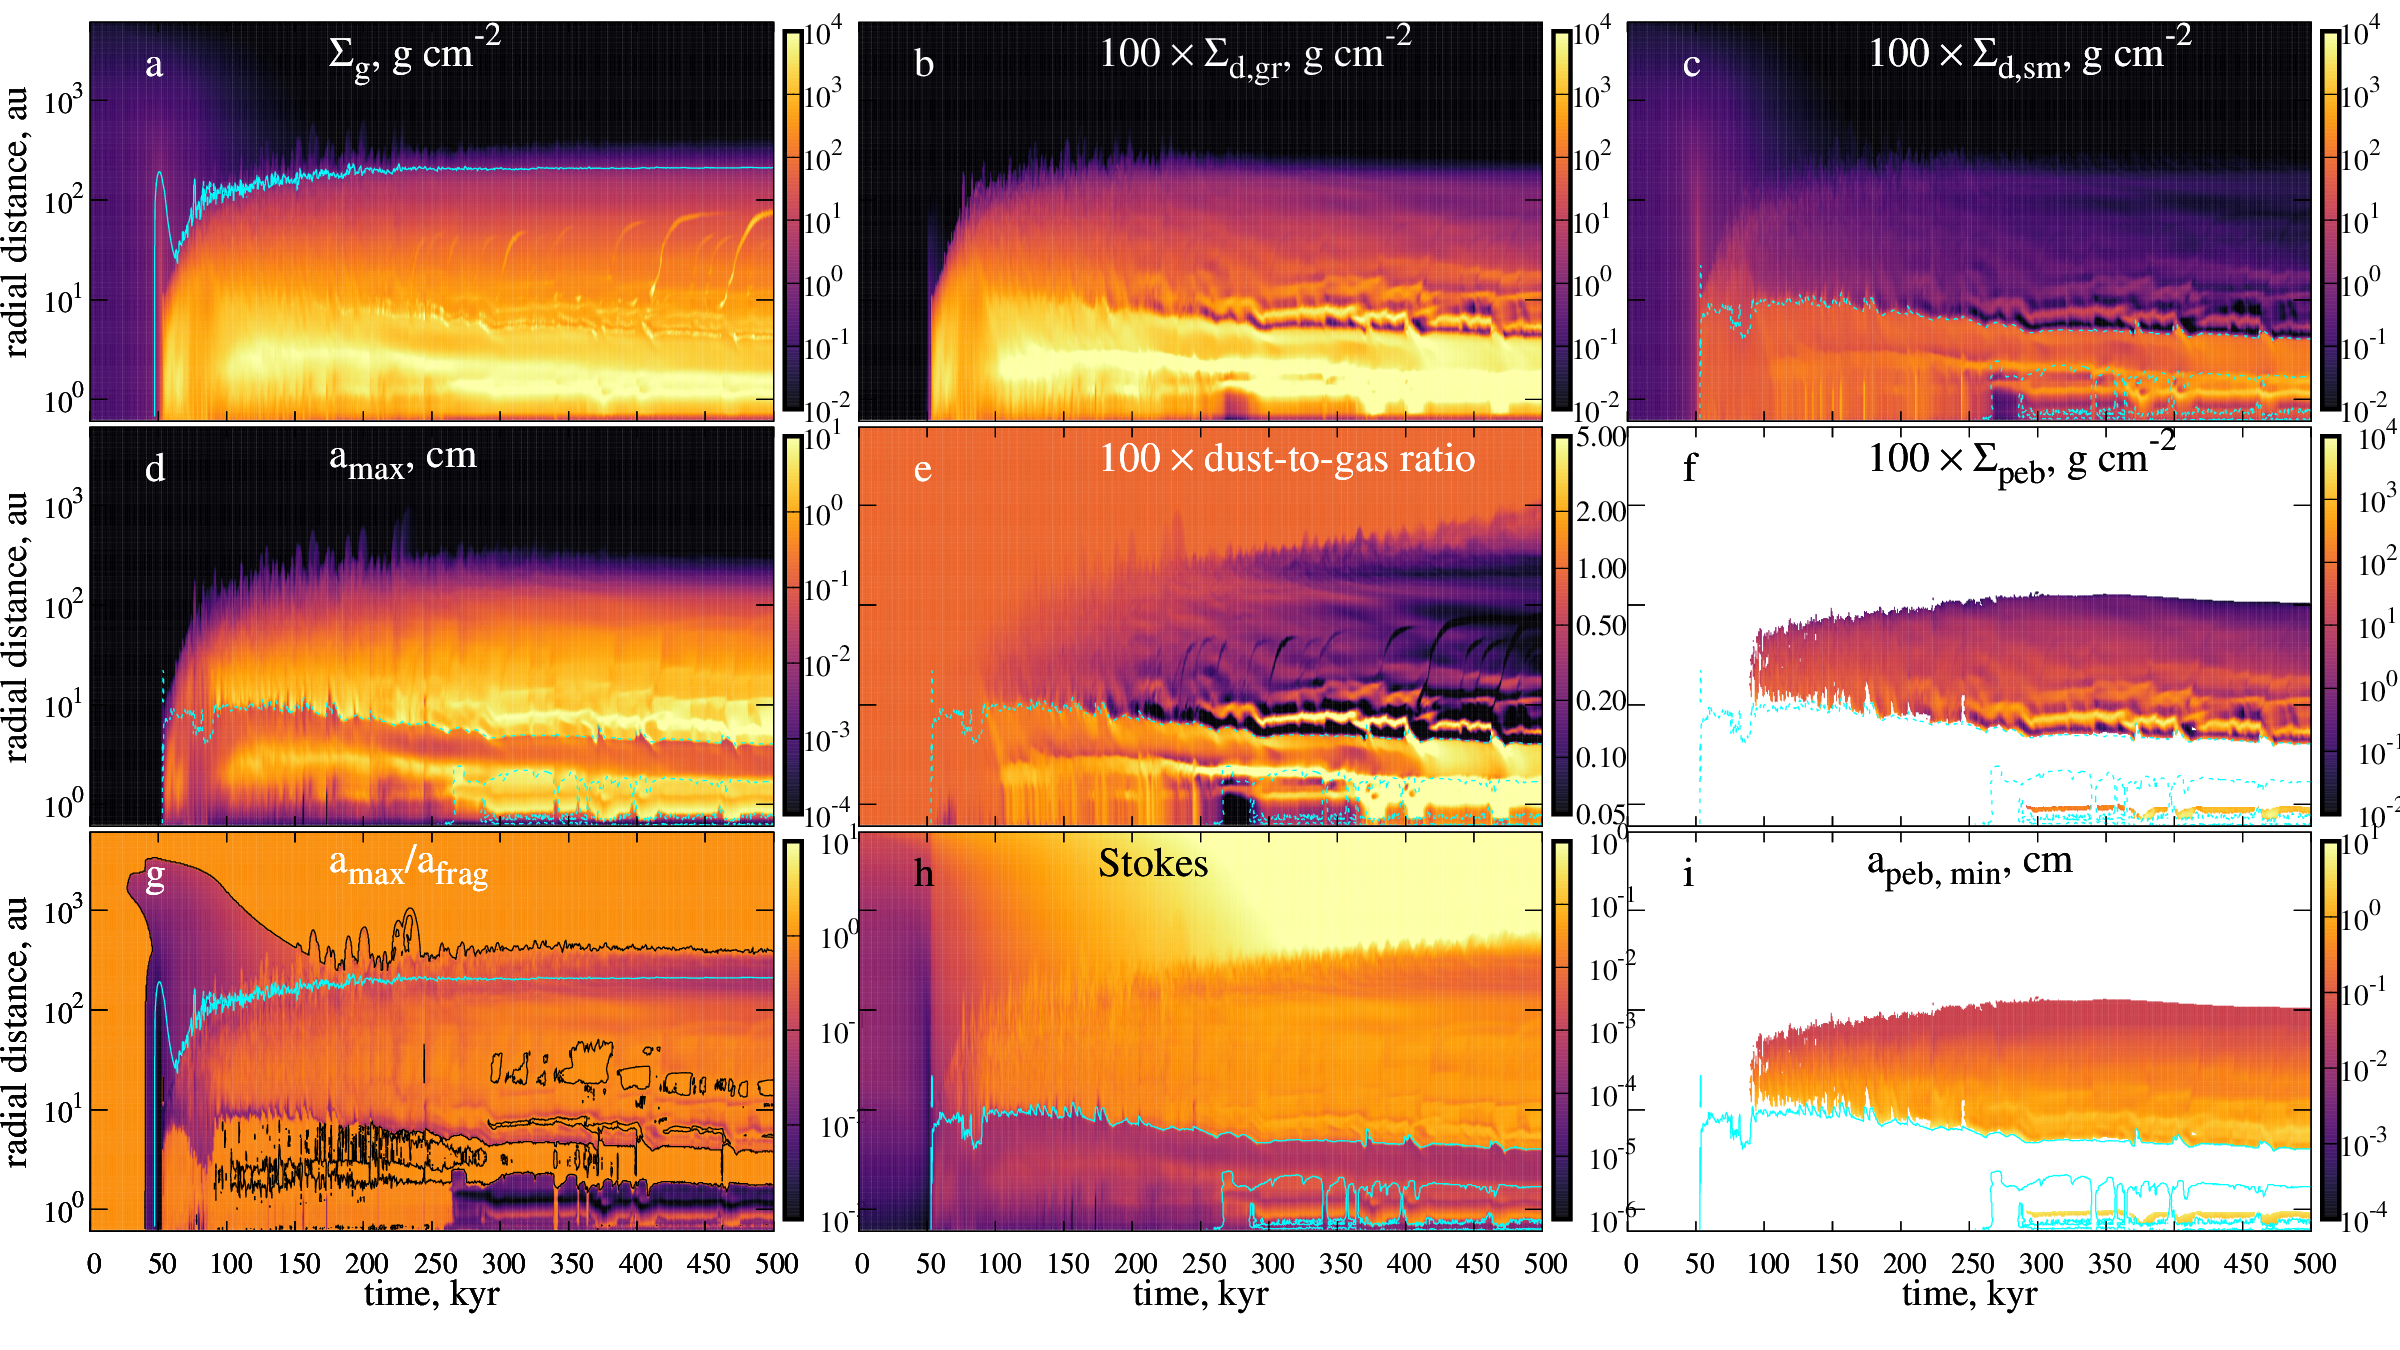
Figure 2 shows the evolution of the azimuthally averaged radial distributions of four volatiles (H2O, CO2, CH4 and CO) in the gas, on grown dust and on pebbles. The panels on the left show the fraction of these volatiles in the gas. After kyr their abundance is elevated in the inner regions of the disc, compared to the earlier stages (around 100 kyr). The abundances of gas-phase H2O and CO2 inside their snowlines increase gradually and reach values an order of magnitude higher than immediately after the disc formation. These additional volatiles are brought from the outer disc regions by the drift of grown dust grains (Birnstiel et al., 2012), bringing ice mantles that subsequently sublimate into the gas phase (Drążkowska & Alibert, 2017; Krijt et al., 2018). The snowlines of CH4 and CO are further from the star due to their lower desorption energies. At these larger distances, dust grains are smaller and have lower surface density (see panels (b) and (d) of Figure 1), so the effect of the drift bringing in the volatiles is weaker. However, the fraction of these species in the gas is also elevated at the inner side of their snowlines, as was previously shown by Molyarova et al. (2021).
The central panels of Figure 2 show the distribution of volatiles on grown dust. In most of the disc, their mass fractions are close to the initial values for the ices on small dust at the onset of the collapse. However, near the snowlines, there are regions with the increased amount of ice on grown dust. For H2O and CO2 this effect is more pronounced, and their surface density at some time instances exceed that of the grown dust. These snowlines are situated at smaller distances, hence more volatiles that are brought with drifting dust can accumulate at the snowline. These are also the species that have multiple snowlines. At the radial distances where these species tend to freeze (inside 10 au), the radial distribution of the temperature is substantially non-monotonous due to the presence of substructures, particularly, of the dense dust rings. Inside the dust rings, the densities are higher and temperatures are lower compared to the surrounding regions (see, e.g., Kadam et al., 2022). This creates the conditions favourable for the freeze-out of volatiles inside the rings, which occurs for H2O at au, and for CO2 at au.
The right panels of Figure 2 show the distribution of volatiles on pebbles. We see that H2O is present on pebbles in both inner and outer regions where pebbles exist. CO2 ice is present on pebbles in almost all the regions where pebbles exist as well, however the inner boundary of the CO2 ice spatial distribution on pebbles begins a few astronomical units farther from the star. Between the H2O and CO2 snowlines, only H2O is present on pebbles, as well as in the inner ring at 1 au. At early times between kyr, small amount of CH4 ice appears on pebbles, after that it is constantly present at the distances from about 30 to 80 au. CO ice on pebbles appears at later times, after 250 kyr, at distances from about 80 to 120 au, and by 500 kyr this region shifts to au. At some radii, the surface density of CO on pebbles exceeds the surface density of pebbles themselves.
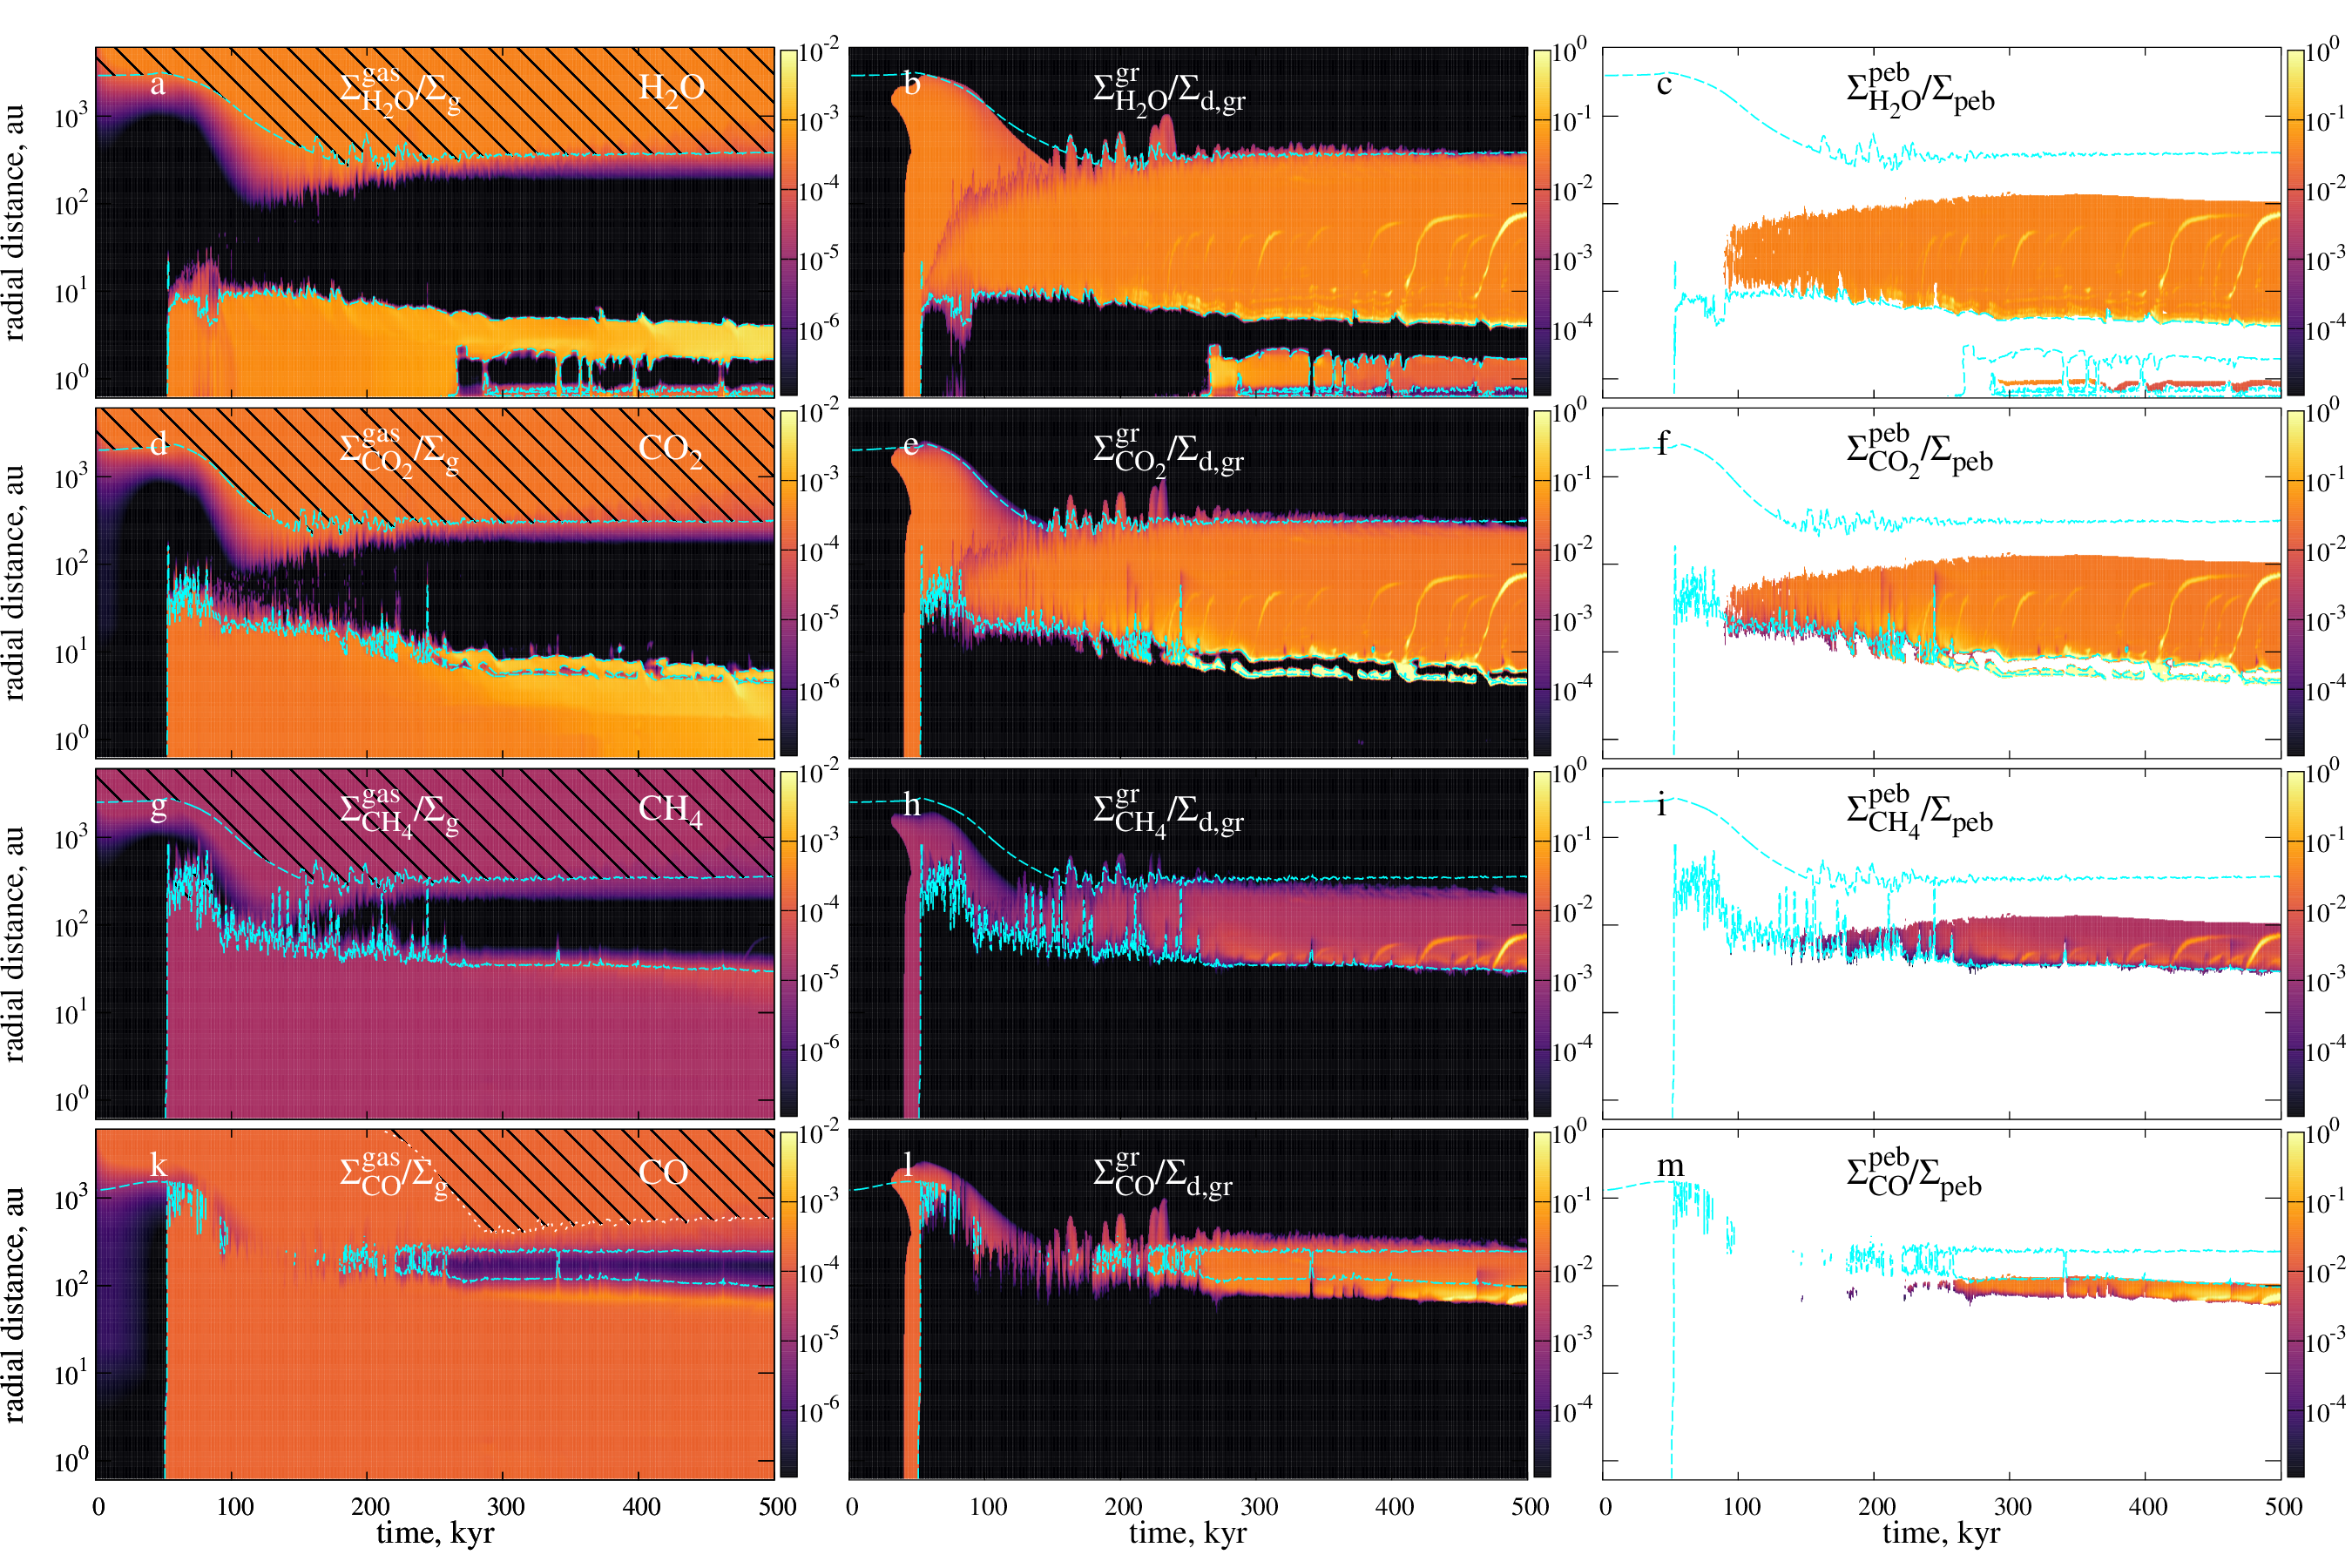
The adsorption and desorption processes have finite non-zero time scales, so the current balance of volatile content in the gas and in the ice does not necessarily correspond to the equilibrium solution. This can be seen in Figure 2, where the position of the equilibrium snowlines, calculated under the simplifying assumption of equal desorption and adsorption rates, is shown by the cyan lines. The equilibrium snowline position are calculated 1) for azimuthally averaged distributions and 2) assuming equilibrium between adsorption and desorption rates (see Section 2.4 in Molyarova et al., 2021). In some cases, ice is present beyond the region delineated by the equilibrium snowline in Figure 2, namely inside the snowline. In particular, CO ice is present au closer to the star than it is expected from its equilibrium snowline defined by thermal desorption. This indicates a significant contribution of non-steady-state and non-axisymmetric effects to the distribution of volatiles, especially in the outer regions of the disc. The main dynamical factors leading to the deviation from equilibrium are the presence of spirals and the radial drift of icy dust grains.
The development of the magnetorotational instability (MRI, Balbus & Hawley, 1991, 1998; Turner et al., 2014) in the inner regions of the disc can result in the occurrence of accretion and luminosity bursts (Zhu et al., 2010; Kadam et al., 2020; Vorobyov et al., 2020b). Such bursts are caused by the increase in turbulence and are taken into account by the associated increase in in our models. Accretion and luminosity bursts self-consistently appear in our simulations for as long as the conditions for the MRI development are fulfilled (see Section 2.2). Accretion outbursts with tens of magnitude occur regularly during the first 250 kyr of disc evolution. The luminosity outburst accompanying the growth in the accretion rate heats the disc and leads to thermal desorption of ices, temporarily shifting the snowlines of all volatiles farther away from the star (Cieza et al., 2016; Vorobyov et al., 2013; Houge & Krijt, 2023). Such shifts can be seen as “spikes” in the positions of snowlines in Figure 2. Bright outbursts inevitably affect the composition of ice mantles on dust grains, including pebbles. A more detailed investigation of the effect of the outbursts on the composition of ices is beyond the scope of this paper and merits a separate study.
3.2 Composition of solids
The solid matter in the disc consists of the following components: small dust, grown dust and pebbles, and ices (H2O, CO2, CH4, and CO) covering all these types of dust grains. We will refer to small dust, grown dust and pebbles as refractory components, meaning that in our model, they are in the solid phase at any conditions in the disc, unlike the volatiles that can be either in the ice or in the gas. In our modelling, pebbles are part of grown dust population. In order to distinguish pebbles from grown dust of smaller sizes, we will hereafter refer to the mass or mass fraction of grown dust meaning that of grown dust excluding the pebbles, unless otherwise stated.
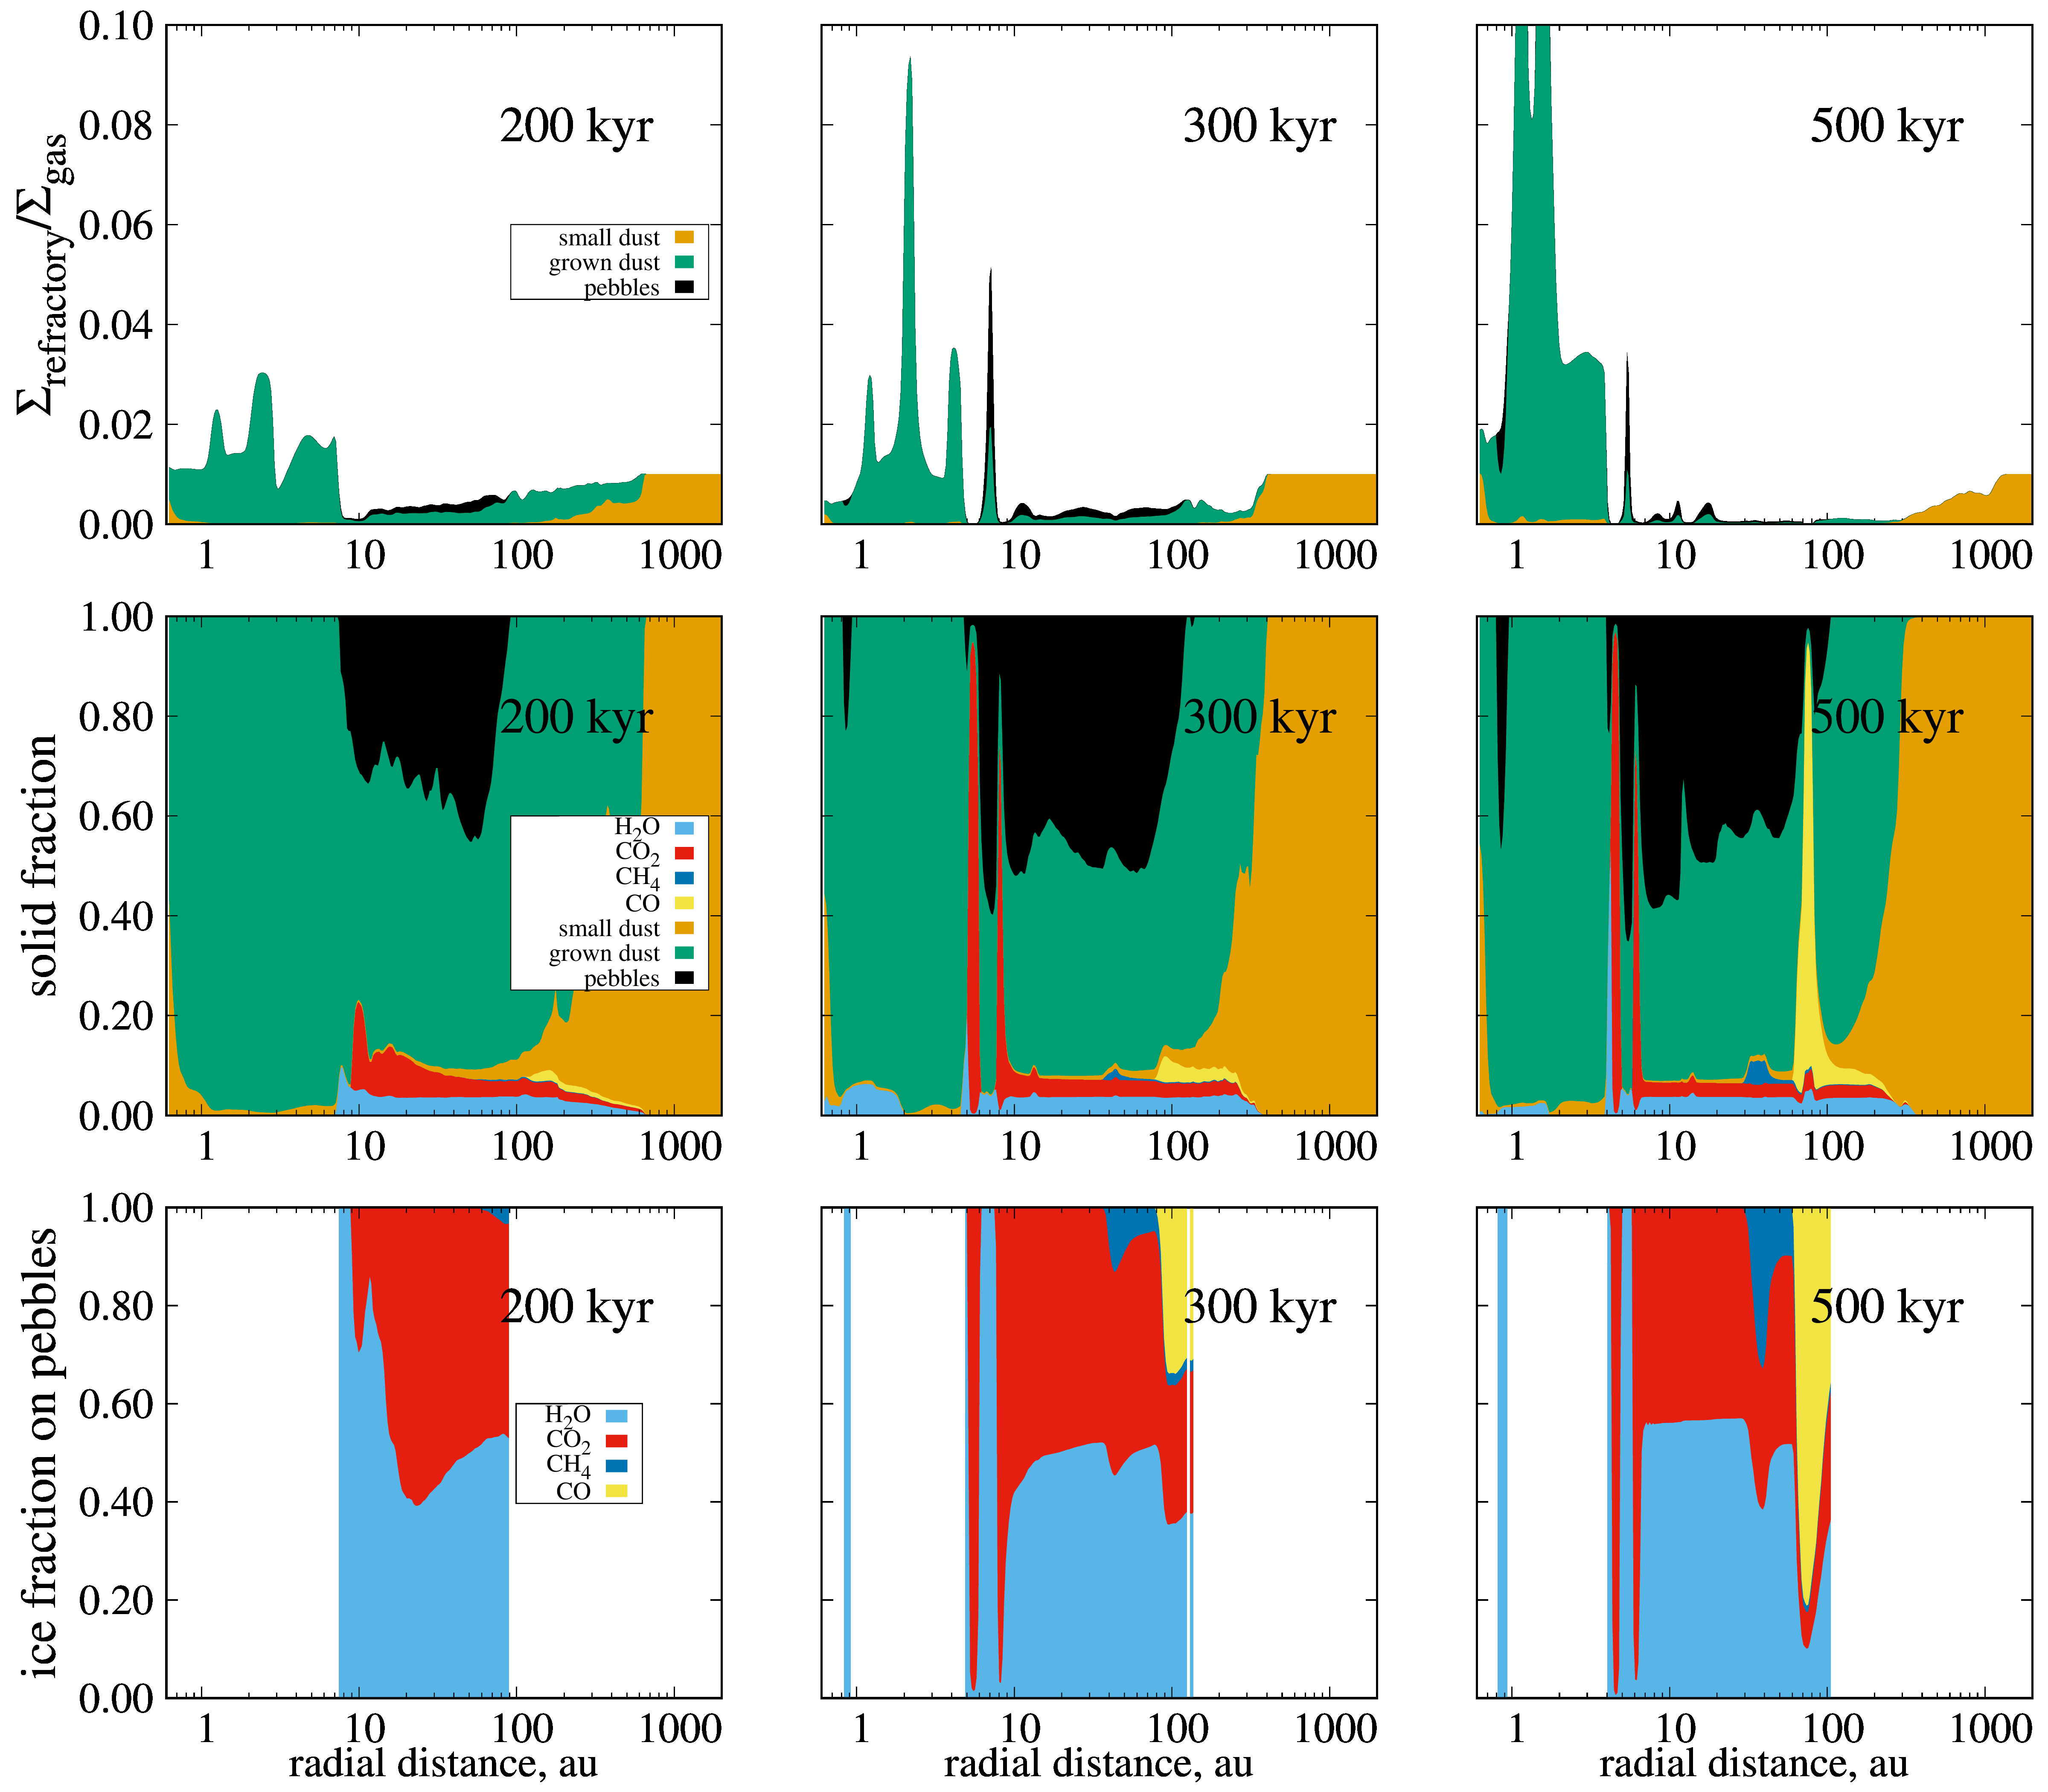
The top panels of Figure 3 show the cumulative mass fraction of refractory components relative to gas as a function of distance from the star. It shows three characteristic time instances: an early gravitationally unstable disc (200 kyr); an intermediate stage of disc evolution (300 kyr); and an evolved nearly axisymmetric disc (500 kyr). The mass fraction of refractories relative to gas evolves from the initial value of 0.01 as a result of dust growth and dynamics in the disc. The initial value is only kept in the surrounding envelope beyond au, where collisions are rare and dust grains do not deviate much from their initial state in the cloud. In the inner 10 au, the fraction of refractories becomes a few times higher, while in the disc outside this distance the refractory component is depleted. This distribution is a result of the radial drift of grown dust combined with the variable in our model. Dust drift efficiently brings the solid material to the inner disc (Weidenschilling, 1977b), but its rate depends on grain size and fragmentation hampers this process (Birnstiel et al., 2012). The change of at the water snowline ( au depending on time) decreases and the drift slows down, leading to accumulation of grown dust in this inner region.
At distances from the water snowline to au, a noticeable fraction of solid matter is in pebbles. These are the distances where grown dust can reach larger sizes due to higher of ice-covered grains. Their mass fraction relative to the gas is mostly below 0.005, however inside the rings rich in dust, e.g. at 8 au after 300 kyr, or at 1 au at 500 kyr it can exceed 0.01. The results of Vorobyov et al. (2022) show similar amount of pebbles for -parameter values and , which are close to the values in our modelling. However, for their modelling also produces a high fraction of pebbles in the inner disc regions, which in our results are absent, although inside 10 au is where the dead zone is situated, with values of as low as . This is the result of m s-1 for all dust grains in Vorobyov et al. (2022), which is higher than our value for bare grains ( m s-1), thus providing less fragile dust in the inner disc regions in their modelling. We conclude that pebbles constitute a significant fraction of solid material in most of the disc, and their existence is favoured by the presence of ice mantles.
Volatiles are also an important component of the solid material. In the regions where dust grains are covered with mantles, these mantles typically consist of hundreds of monolayers of ice. The middle row of Figure 3 shows the fraction of ice and refractory components in the solid phase across the disc. At the selected times, CO2 and H2O dominate the ice composition in most of the disc. There are peaks in the species ice abundances associated with their snowlines, where their mass fraction becomes significant in the total ice composition. By 500 kyr, the main water snowline is at 4 au, with a narrow peak where H2O comprises half of the local solid mass. In two narrow annuli at au at 300 kyr and at au at 500 kyr, CO2 dominates in the composition of solids. At late times and at distances of about 100 au, there is an annulus where more than 90% of the mass of solids is in CO ice. Ice accumulation at these radii is associated with the snowlines of the corresponding volatiles. Dust drifting relative to the gas brings volatiles from the outer regions of the disc, and the azimuthal variations in the radial velocity of gas and dust allow the volatiles to move back to the ice phase in the vicinity of the snowlines (see Figure 5 and Section 3.3.1 in Molyarova et al., 2021).
The most notable peaks of ices are presented by the two annuli of CO2 ice. They surround a prominent dust ring rich in pebbles, which begins to form after 200 kyr. These ice annuli appear due to the temperature contrast between the ring and the nearby regions creating multiple snowline structure. The temperature in the regions immediately inside and outside this ring is determined by the irradiation from the star and accretion, but inside the ring itself, the temperature is higher. Due to elevated gas surface density in the ring, which can be seen in Figure 1, the contribution of viscous heating is more significant, and radiative cooling is less efficient because of higher optical depth of dust. As a result, CO2 is sublimated inside the dense ring and frozen in the adjoining regions. The mass fraction of CO2 ice in the solid component around the dust ring is high due to lowered dust surface density outside the ring, while the absolute surface density of CO2 ice is fairly the same. This means that the peaks of CO2 appear in the middle row of Figure 3 because of depletion of dust, which drifts towards the ring’s pressure maximum, rather than because of the overabundance of CO2 ice.
The lower panels of Figure 3 show the relative ice fraction in ice mantles on pebbles. At 200 kyr, the ice on pebbles consists mainly of H2O and CO2, with approximately equal mass fraction except for the specific ice-rich annuli described above. The pebbles formed at 1 au are covered exclusively by H2O ice. Throughout the disc lifetime, water is always present in the composition of ices on pebbles, making up about half the mass fraction of the ice mantle. At later times, other volatiles start to dominate the composition of ices on pebbles in the vicinity of their respective snowlines. As the disc cools down with time, the snowlines move closer to the star, and more volatile species CH4 and CO are able to freeze-out and contribute to the composition of ice mantles on pebbles, which are only present inside au. By the end of the simulation, CO becomes the dominant species on pebbles beyond 60 au, while H2O and CO2 remain the main ices on pebbles inside this distance.
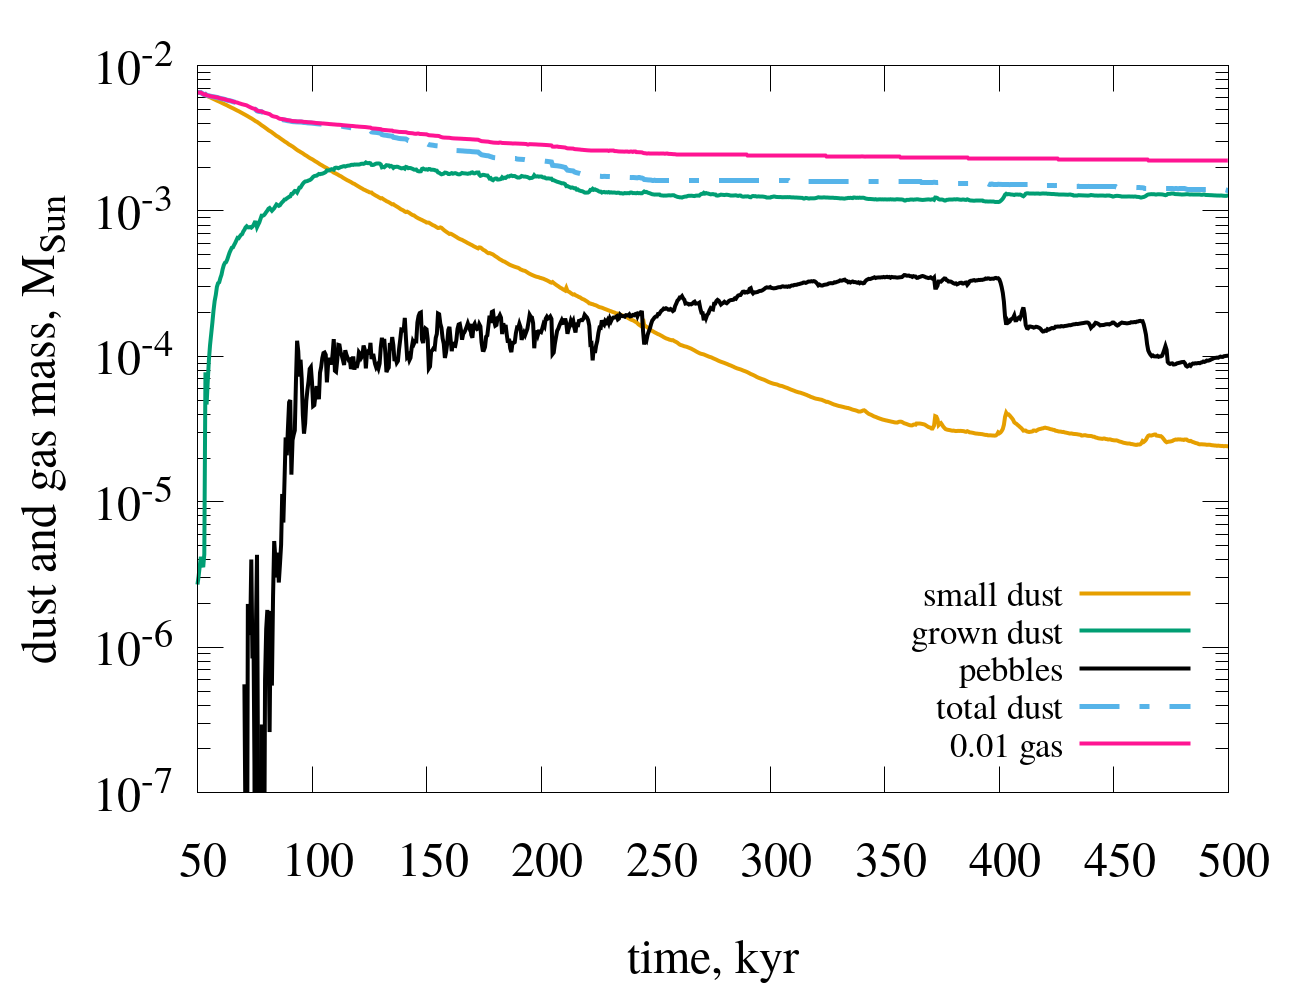
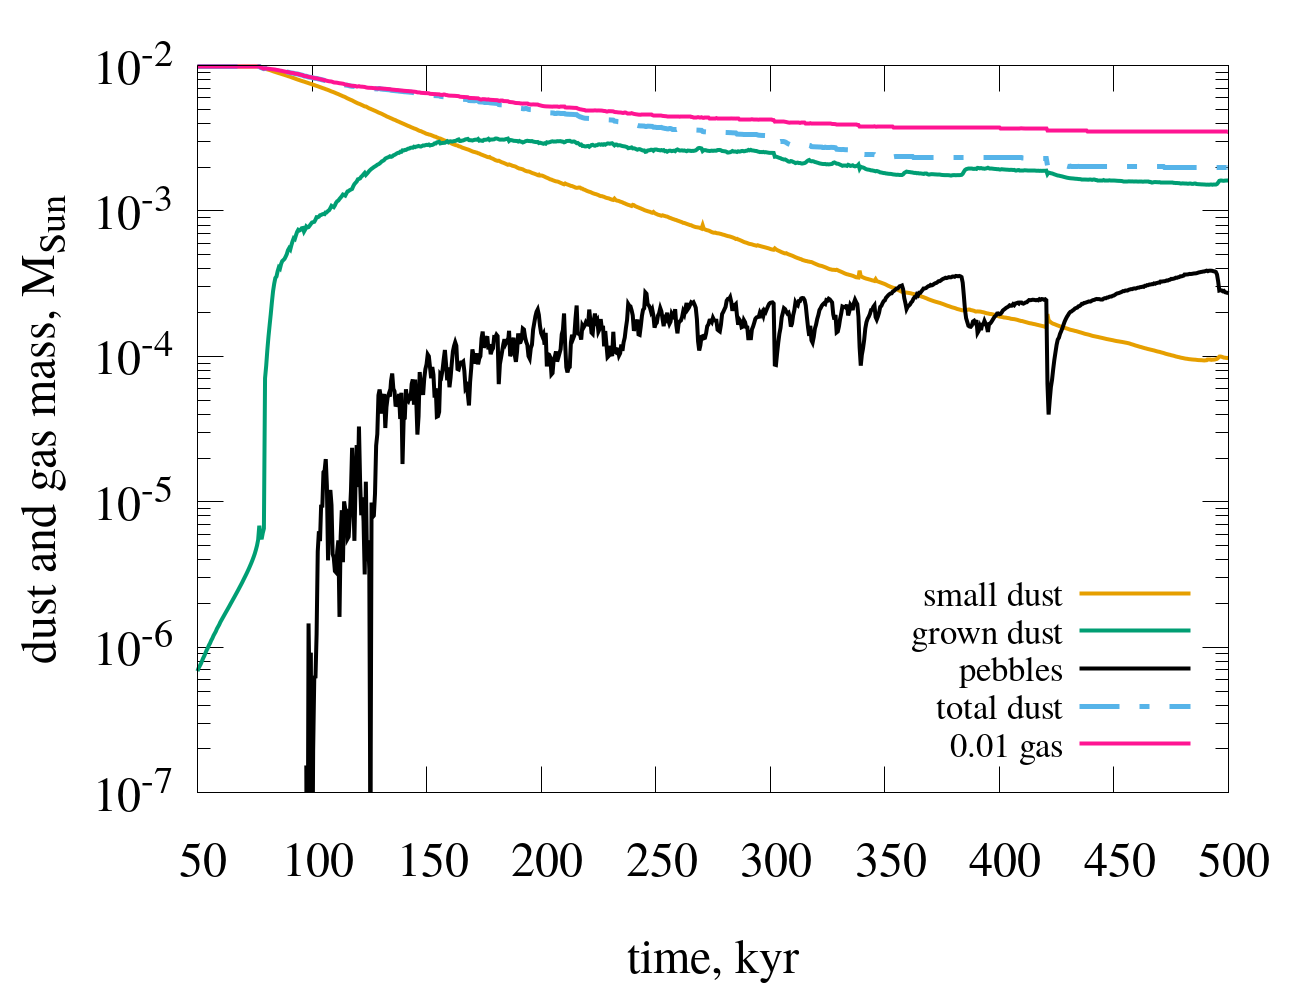
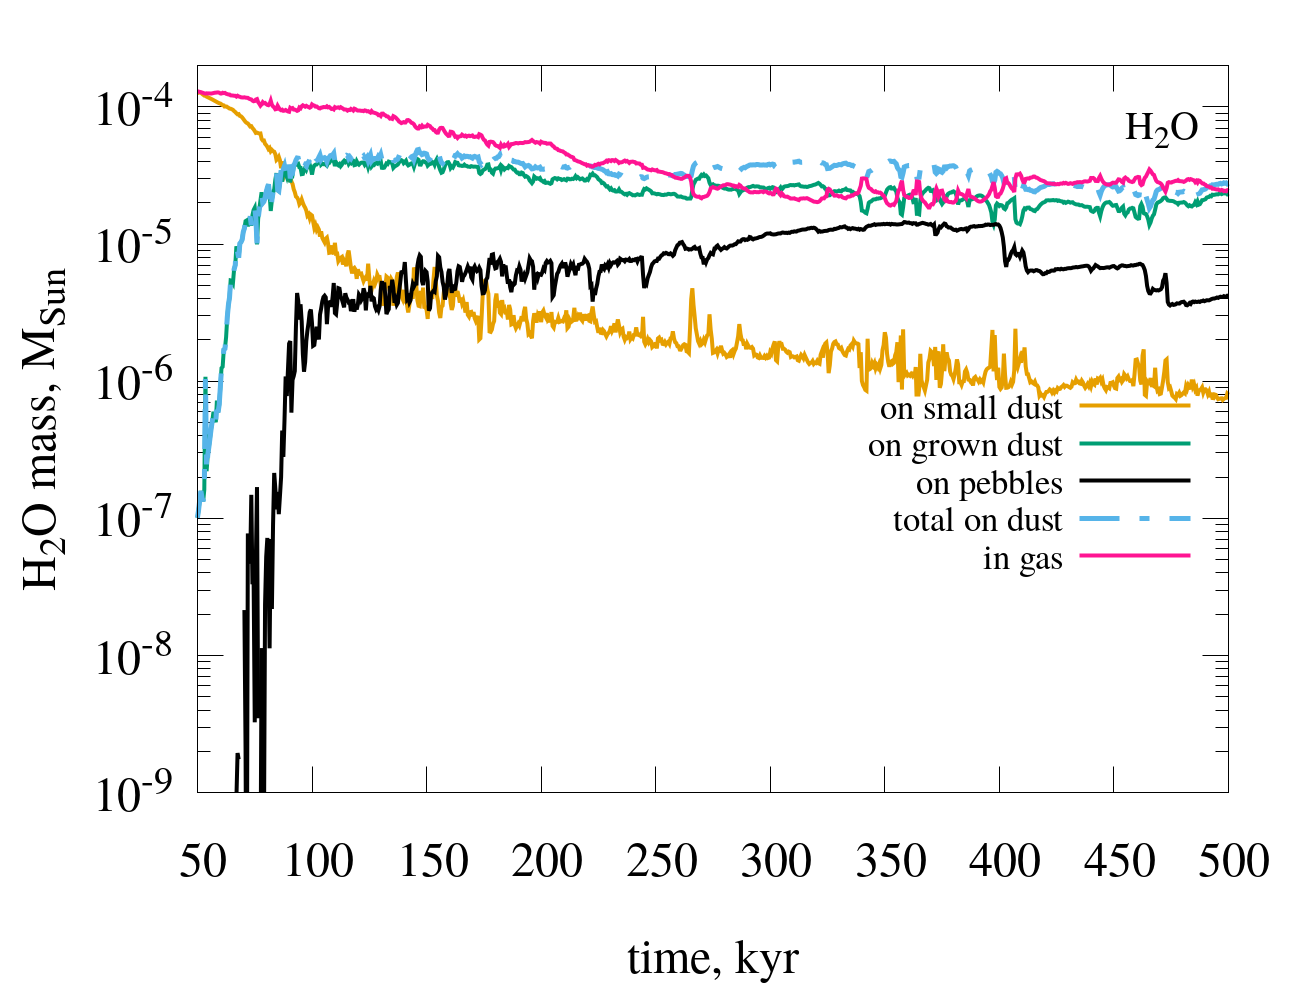
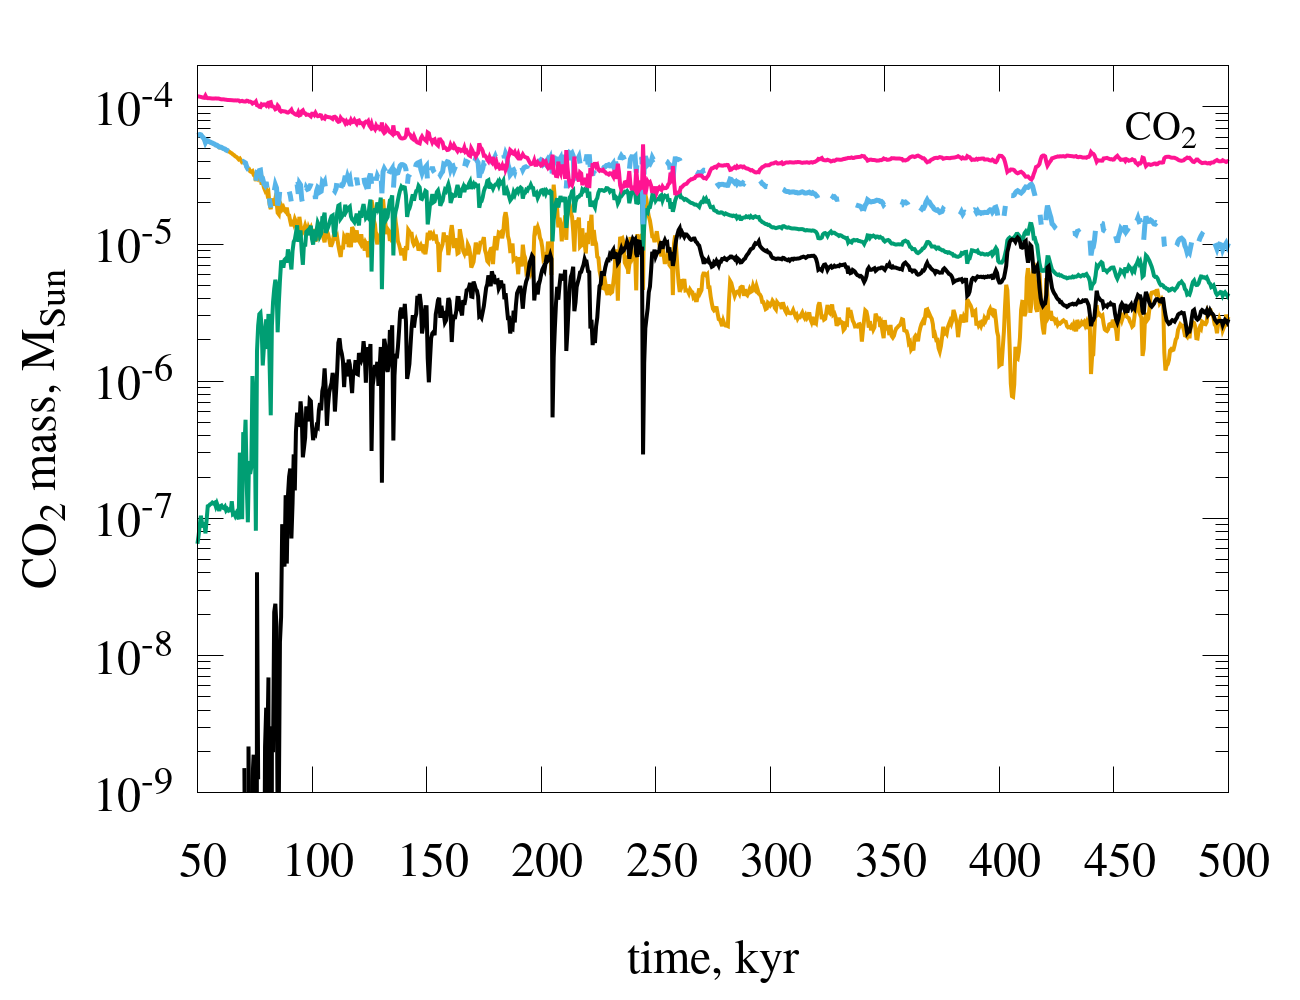
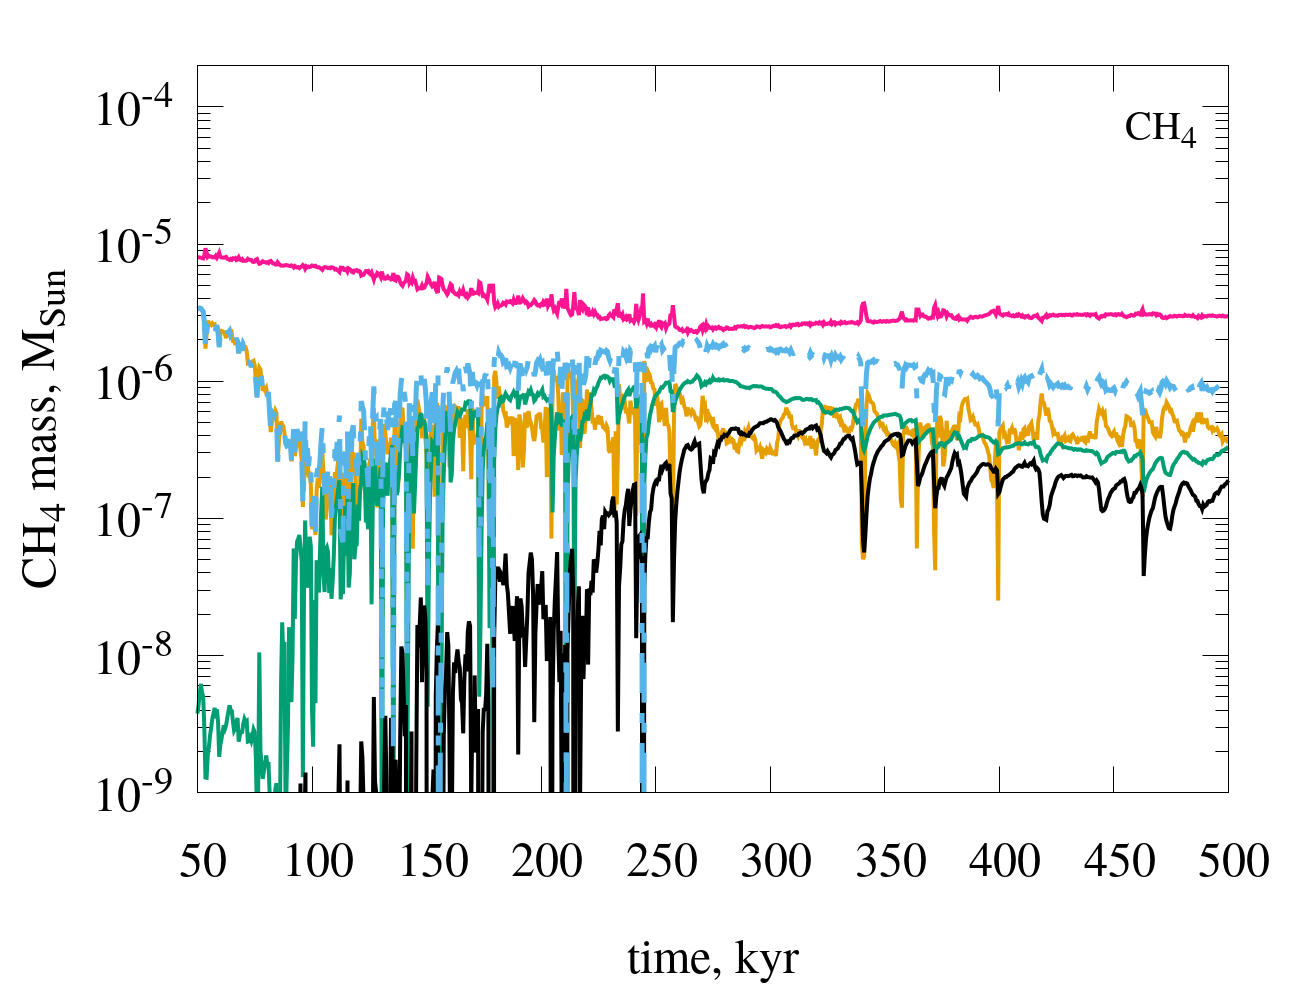
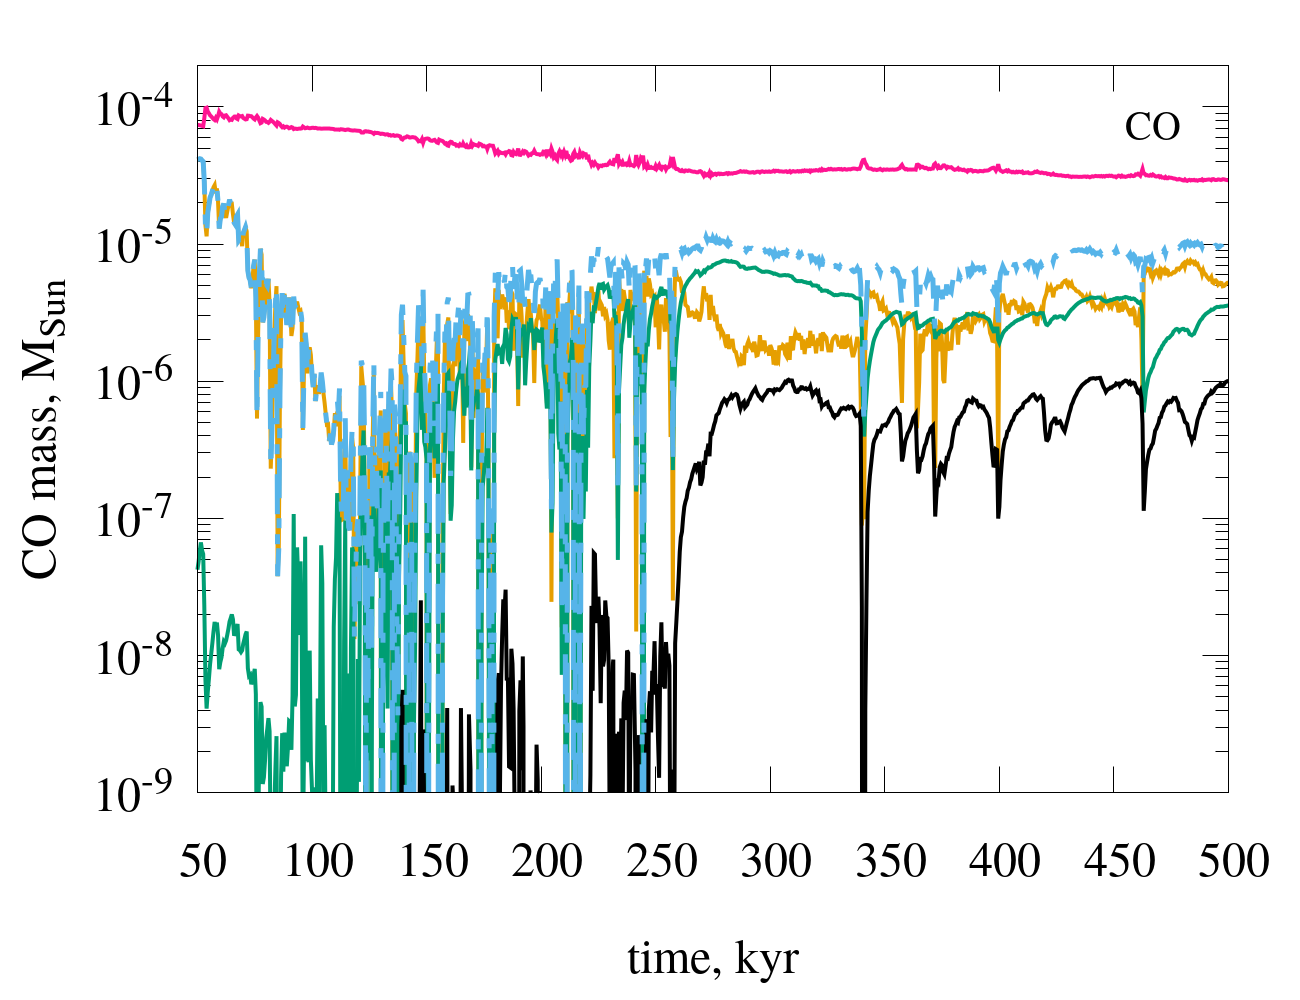
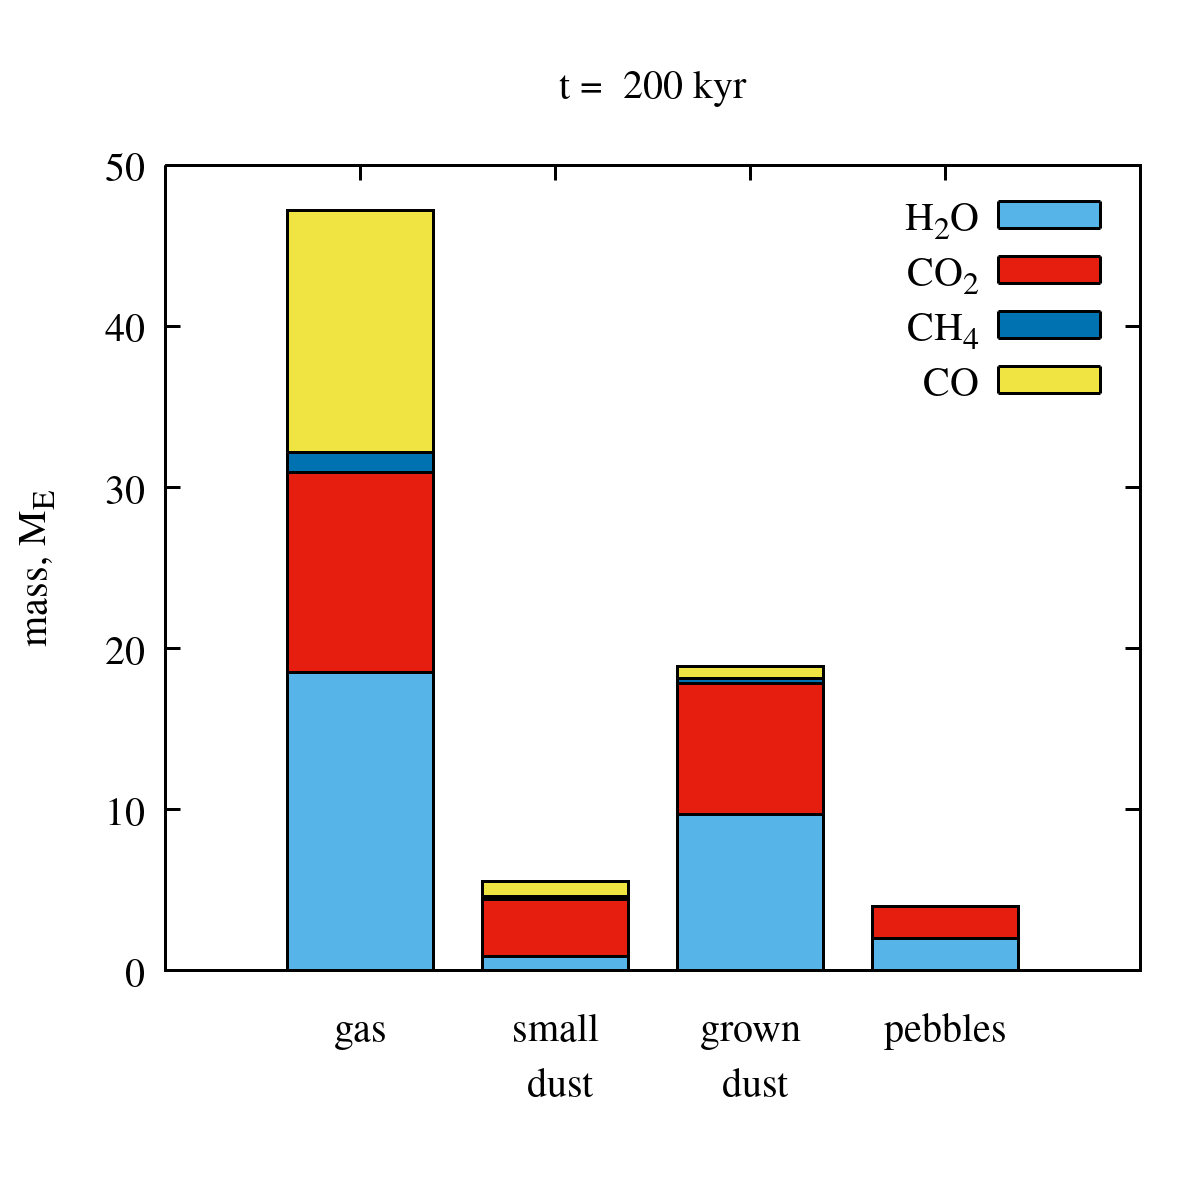
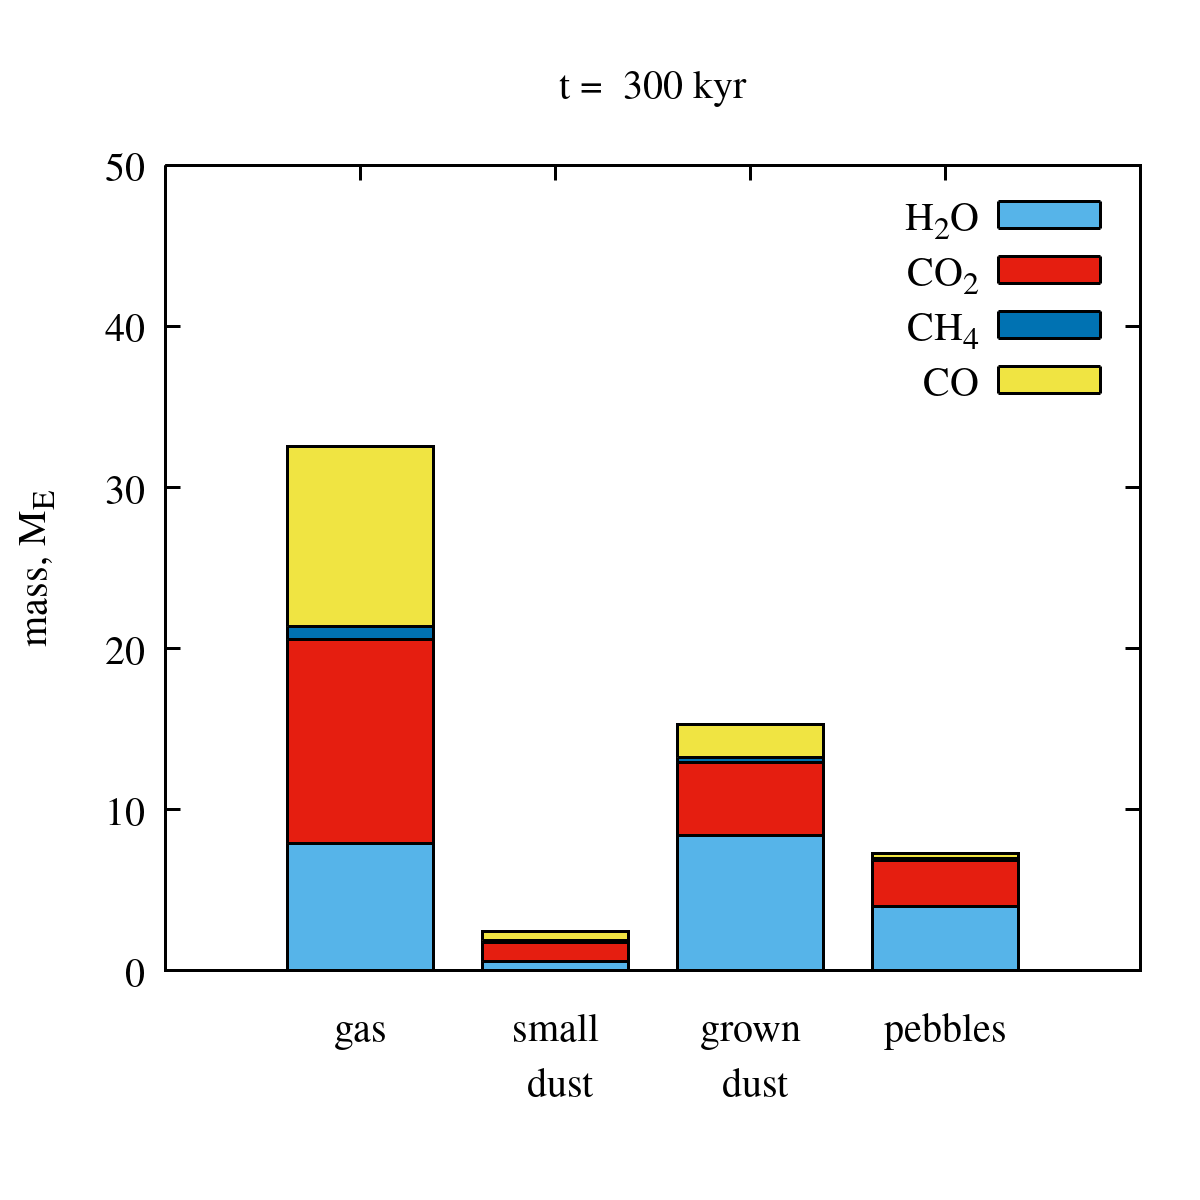
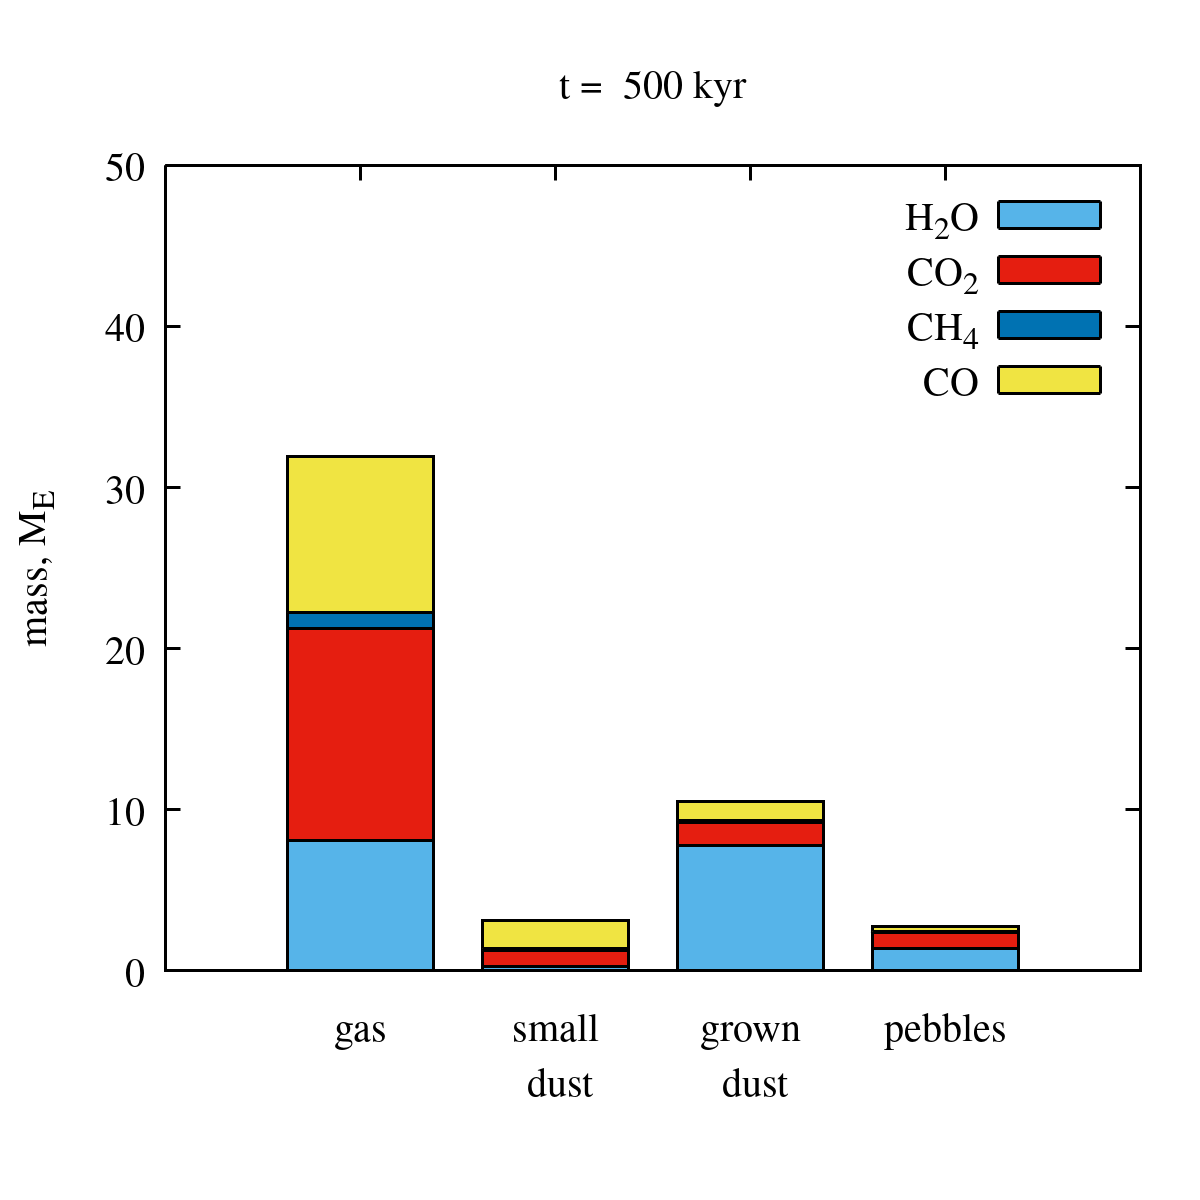
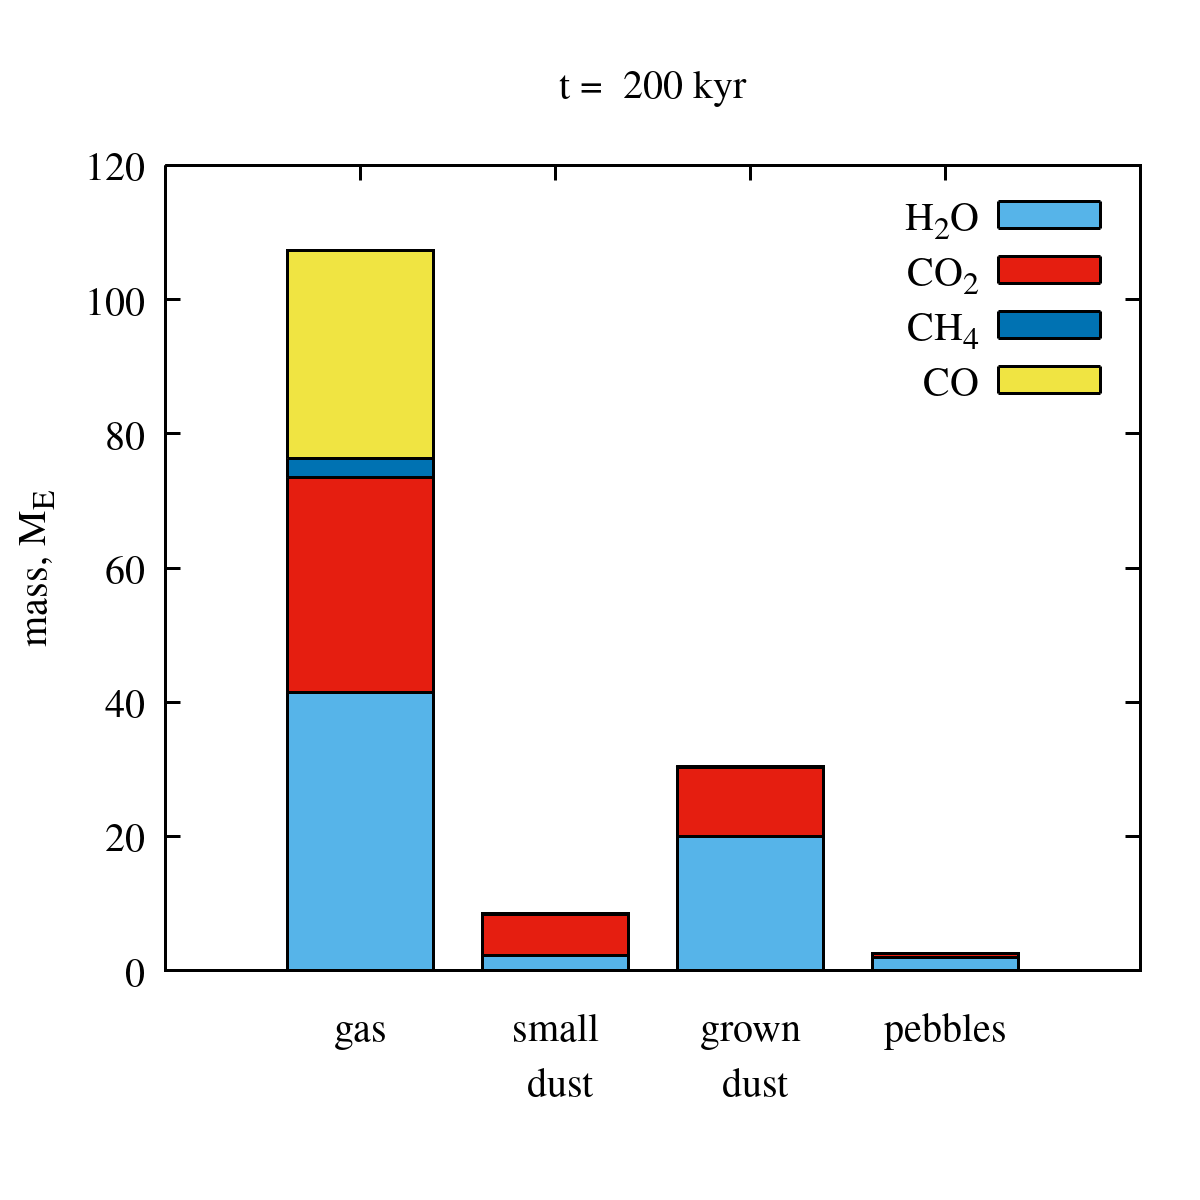
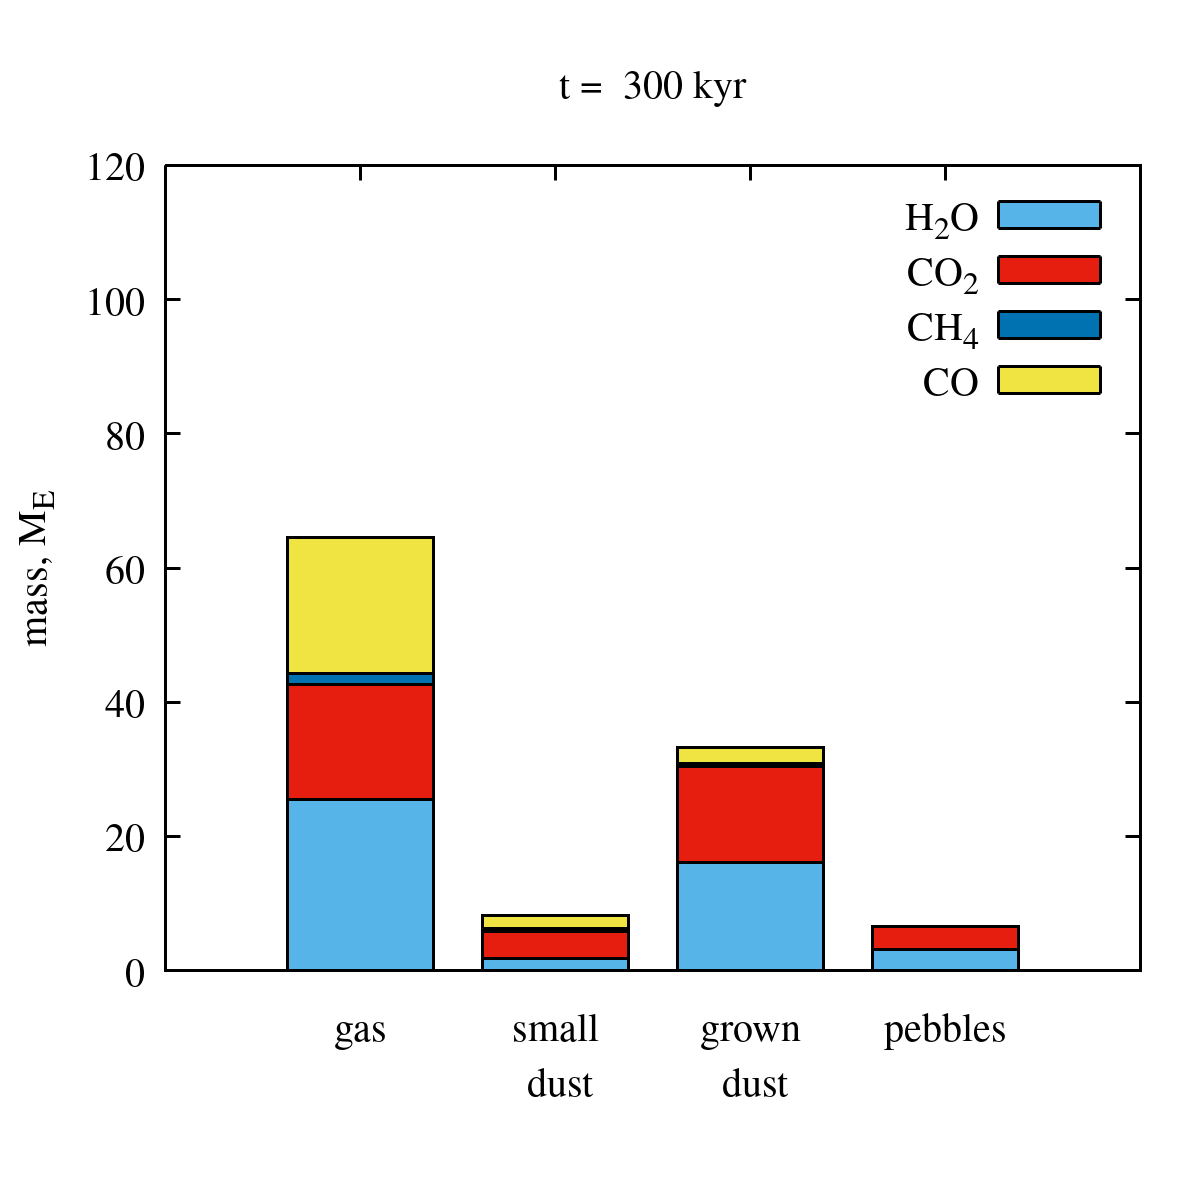
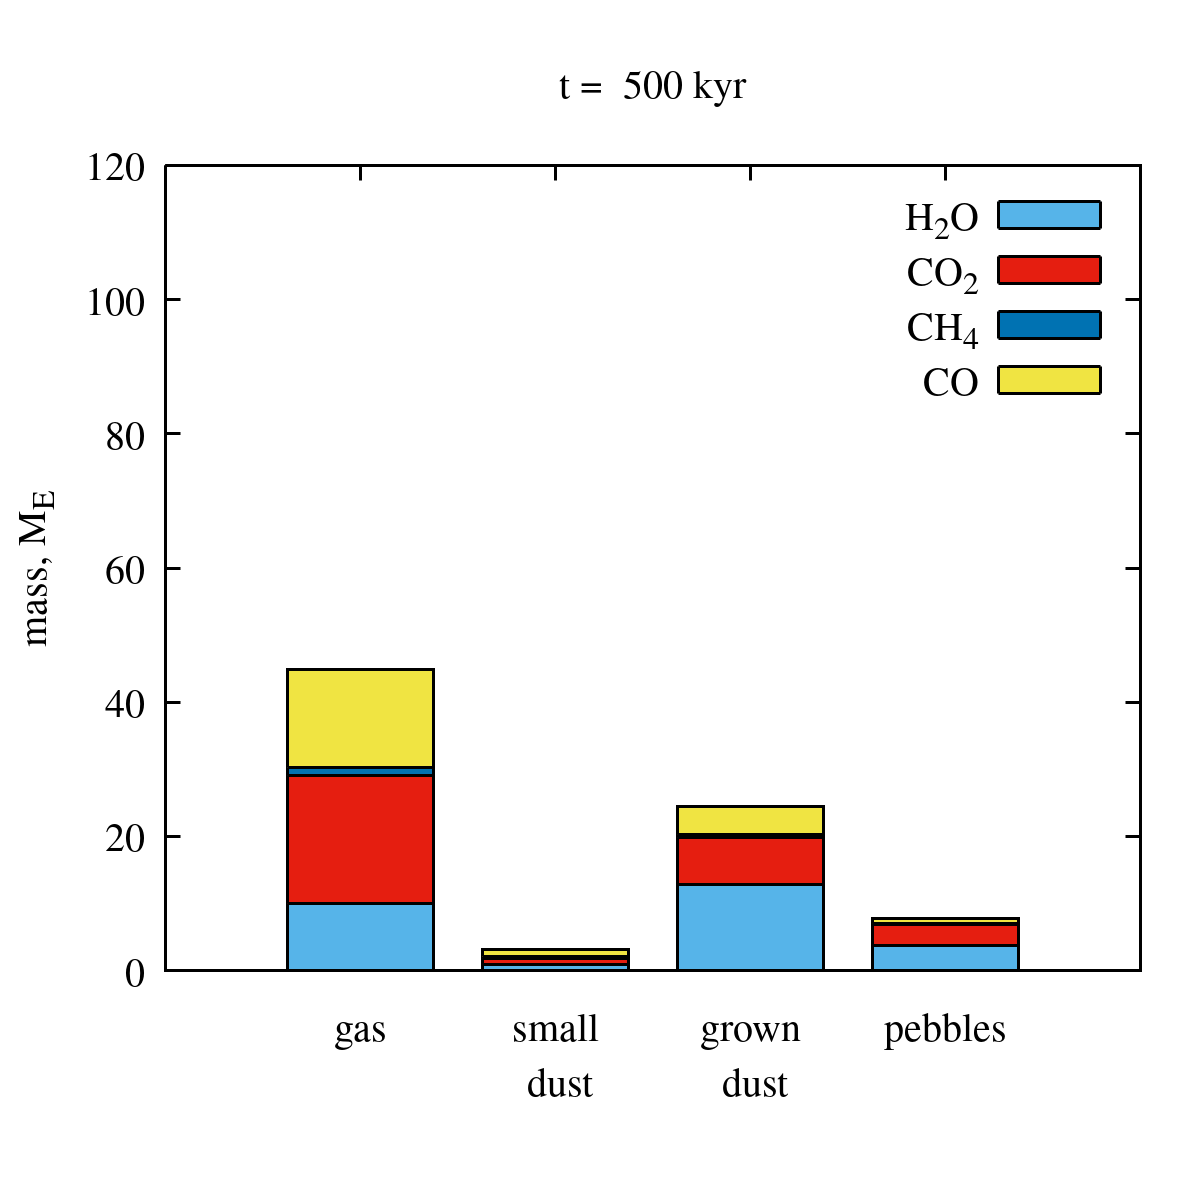
Figure 4 shows the evolution of the total mass of gas and various solid fractions. We integrated surface densities of the components over the entire computational area, which means that in addition to the disc, they include the matter from the outer envelope. Since the envelope mostly consists of primordial matter that hardly evolved from the initial state in terms of dust size, the total masses of pebbles and grown dust in the model are almost identical to those inside the disc. For small dust and gas this difference is more substantial, with a few per cent of mass belonging to the envelope. We note that the model includes accretion from the disc, which means that some matter, including gas, dust and volatiles leaves the disc and contributes to the content of the central sink cell, protostar, with a fraction of mass ejected with jets. Thus, the total masses of gas and dust in Figure 4 are declining.
It can be seen that the mass of small dust gradually decreases, while the mass of grown dust first increases due to its formation by coagulation of small dust, reaching , then gradually decreases due to radial drift of grown grains to the star. As for pebbles, they are present during almost the entire disc lifetime. At 100 kyr, only 50 kyr after the disc formation, the pebble mass reaches a value of and increases slightly with time, but by the end of the simulation falls back to this value. The maximum pebble mass is reached at 400 kyr and is about ( ), which is comparable to the mass of solids in the Minimum Mass Solar Nebula ( , Weidenschilling, 1977a). The pebbles are abundant from the very early stages of disc formation, which means that the conditions for planet formation exist throughout the lifetime of the disc. However, whether these pebbles can immediately start forming planetesimals, e.g., through the streaming instability (Youdin & Goodman, 2005) remains an open question and requires a separate consideration.
As for M2 model, which has , the total mass of gas and dust in it is times higher than in M1 model described above. The integrated amount of pebbles formed in the models is only slightly different, as shown in the right panel of Figure 4. It reaches later, by kyr, which is kyr after the disc formation. The maximum value of is reached by 490 kyr. The masses of pebbles in the two models are of the same order, but the timing is different, the more massive M2 model characterised by slower evolution.
Figure 5 presents the evolution of the integrated mass of volatiles in different phases.
Although pebbles are part of grown dust and locally they have identical relative fractions of ices, globally the compositions of their mantles are different because grown dust exists in a wider region of the disc. The integrated mass of water ice on grown dust is several times larger than that on pebbles, but this difference decreases with time, reaching its minimum at 400 kyr. At 400 kyr, as well as 460 kyr, the amount of pebbles itself decreases sharply (see Figure 4), leading to simultaneous decrease of the mass of water ice on pebbles.
The masses of CO2 and CH4 ices on grown dust are not significantly different from their masses on pebbles after kyr. The mass of CO ice on grown dust during the entire disc lifetime exceeds the mass of CO ice on pebbles by several orders of magnitude. Overall, ice mantles on grown dust are more rich in CH4 and CO than ice mantles on pebbles.
While CO is almost absent on pebbles, in the gas its integrated mass is comparable to the masses of gas-phase water and CO2. Since CO is more volatile, it is in the gas phase in most parts of the disc. The total abundance of carbon in the gas is higher than in the ice, suggesting a higher C/O ratio. Small dust mantles are dominated by CO2 and CO ices, although the CO ice mass changes frequently due to outbursts and is more sensitive to them. Compared to CO2 and CO, water and methane masses on small dust are lower by a factor of several. For water this is because small dust is dominant in the outer regions of the disc, while water ice is depleted there and brought closer to the star with inward-drifting grown dust grains. For methane the low mass is due to its low initial abundance. Most of the mass of the volatiles belongs in the gas phase, the only exception being H2O, which mostly dominate in the ice phase after kyr.
The integrated masses of ices on pebbles compared to the integrated masses of volatiles in the gas, on small dust, and on grown dust at different time points are presented in Figure 6. The total ice composition is dominated by oxygen-rich H2O and CO2. The contribution of CO is more significant for the ice on grown dust, and especially for the ice on small dust. This means that these ice mantles contain relatively more carbon than the ice mantles on pebbles. In the gas composition, one third of the mass of volatiles is encapsulated in CO, making the gas phase the most carbon-rich fraction, although oxygen still dominates the elemental composition. Thus, ices on pebbles demonstrate characteristically lowered carbon abundance compared to ices on grown and small dust grains, as well as the volatiles in the gas.
In M2 model, the total mass of ice mantles on pebbles is of the same order as in M1 model, if not slightly lower (see lower panels in Figure 6). Although total mass of volatiles is higher in M2 model due to higher initial core mass, the pebble masses have similar values (see Figure 4). The mass fraction of ices on pebbles are also similar between the models, leading to the close values of total ice masses on pebbles. An exception is presented by the 500 kyr time instance, when in M2 model the ice mass on pebbles is times higher than in M1 model. This is the consequence of the two pebble-depletion events in M1 model, that lead to 3 times lower pebble mass at 500 kyr than the maximum value reached at 400 kyr. The disc in M2 model did not experience such events by the end of the simulation, so its pebble mass is close to the maximum value. The difference in the pebble mass is directly translated to the difference in pebble ice masses. Overall, in terms of the ice chemical composition, these models are only slightly different, i.e., the mass of the initial cloud does not affect the main conclusions about the composition of ice on pebbles.
The pebble depletion events in the M1 model, which can be seen at about 400 and 460 kyr in panels (b) and (f) of Figure 1, occur due to the episodic development of gravitational instability in the inner rings centred at 1-2 and 7-8 au. This is confirmed by the analysis of the Toomre Q-parameter, which drops below 1.5 during these events. These episodes of the ring instability are likely caused by mass influx from the colder disc regions beyond 10 au, where the gravitational instability persists throughout most of the considered disc evolution period. Normally, the rings represent local pressure maxima, towards which the grown dust drifts, separated by a pressure minimum in the gap between the two rings. When the gravitational instability develops in the rings, the gas density distribution is perturbed, and the gap between the two rings disappears. As a result, pebbles that were localised in the outer ring begin to drift inward and cross the water snowline. Sublimation of water ice mantles lowers the fragmentation barrier of bare grains. Dust grains react to this new fragmentation barrier by decreasing in both the size and Stokes number below the values typical of pebbles. These grains are no longer able to regrow to pebbles because they are now in a warmer region and cannot sustain their ice mantles. A similar event occurs in the M2 model at later time (close to 500 kyr).
3.3 Two-dimensional distribution of pebbles
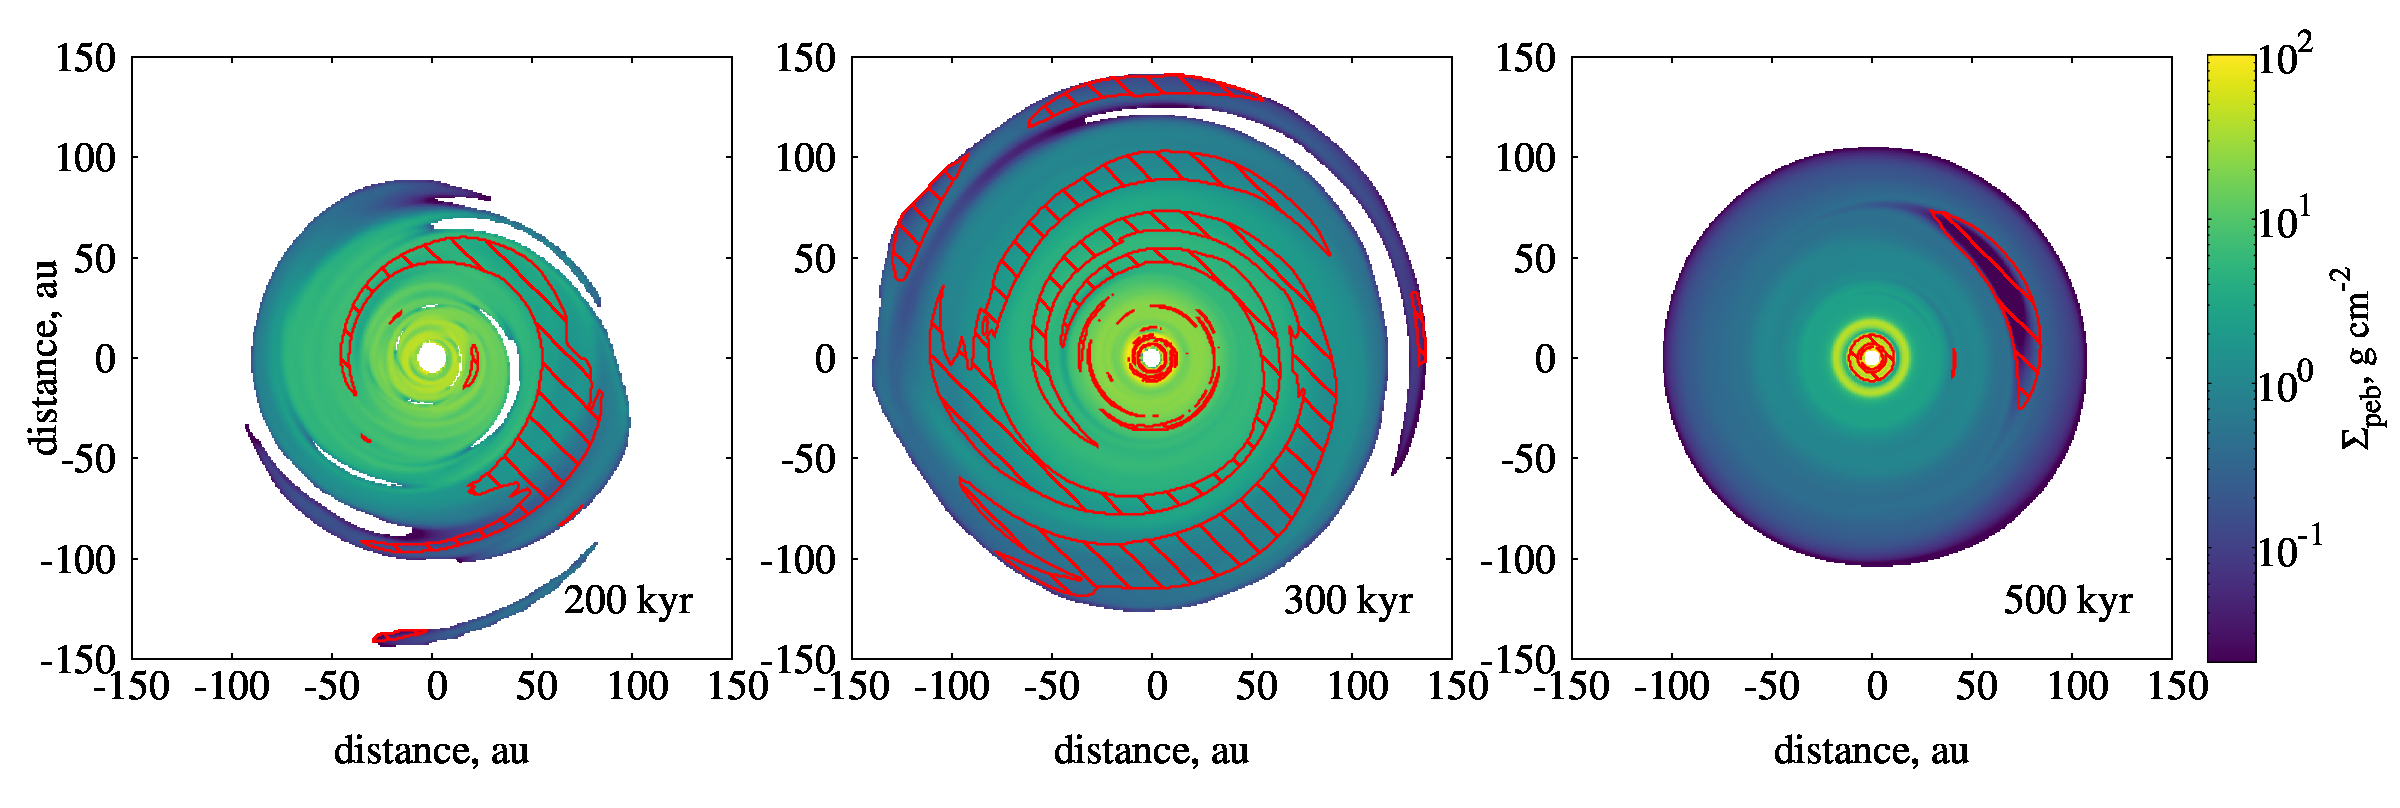
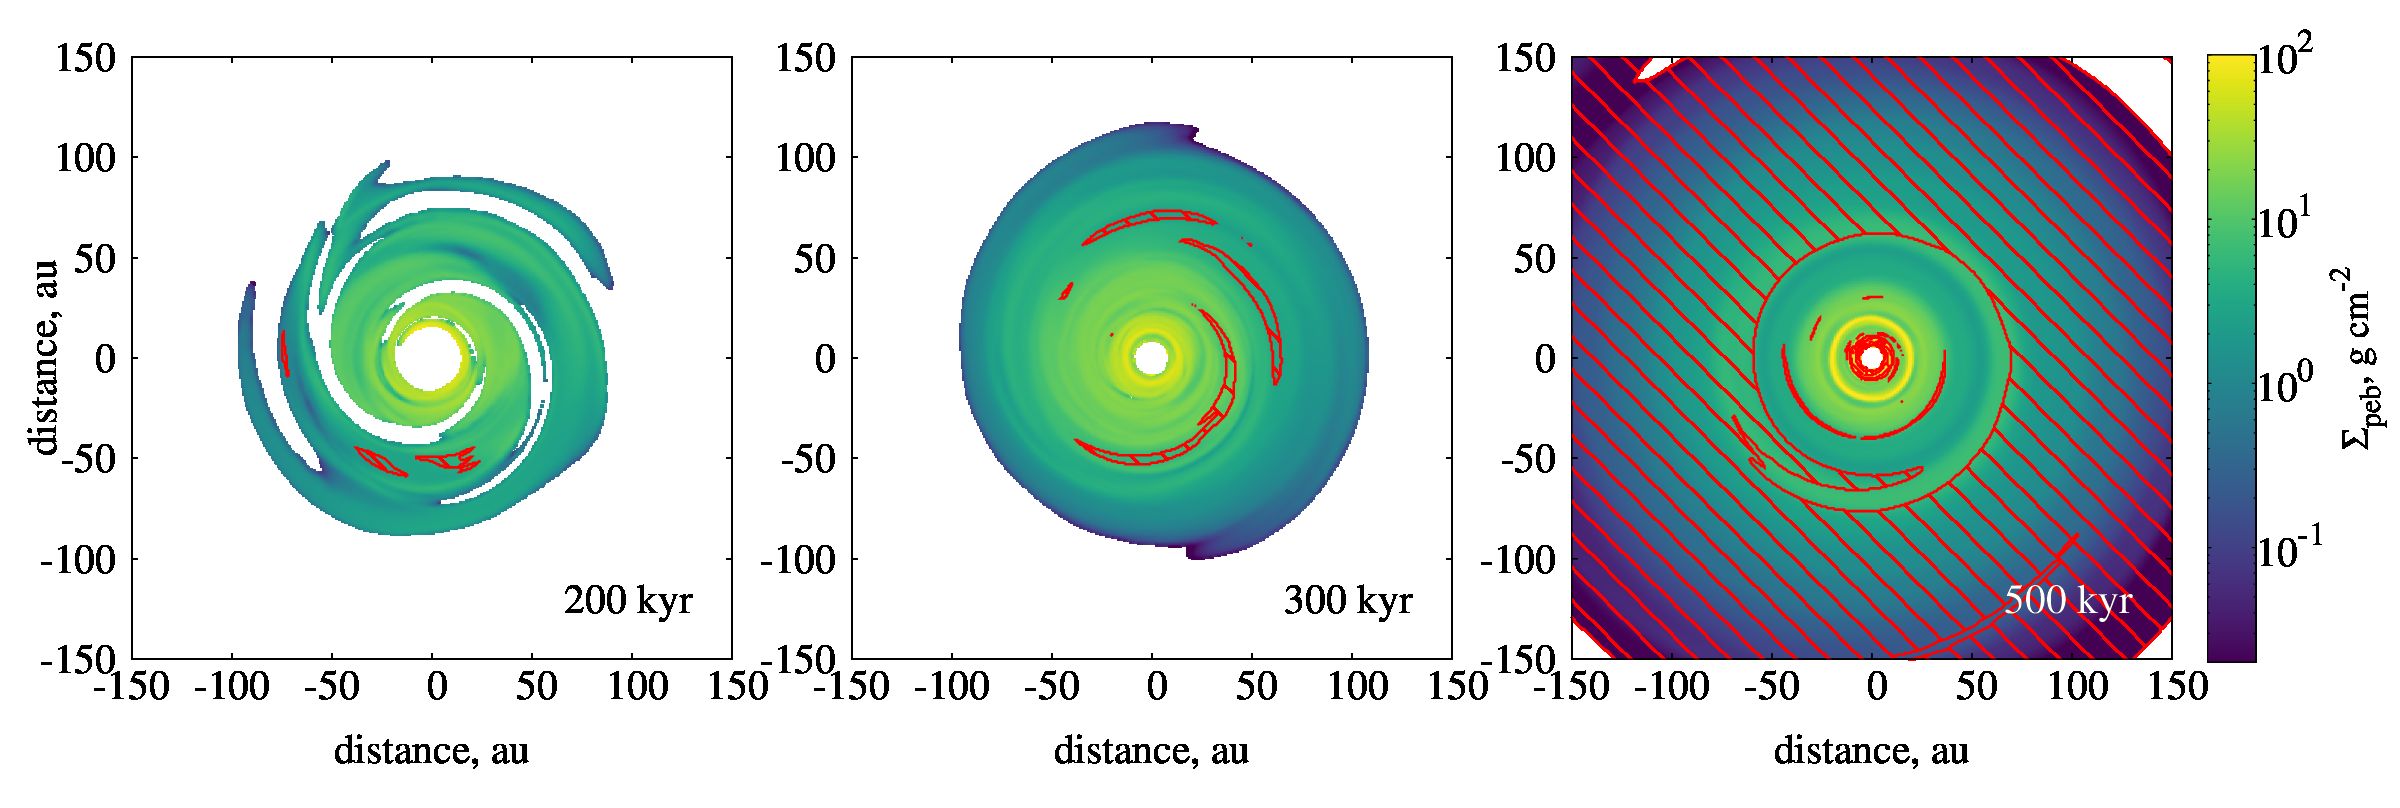
Figure 7 shows the surface density of pebbles in the protoplanetary disc at different times (200, 300, and 500 kyr), which were calculated using the criteria from Section 2.3. The upper panel shows the calculations for M1 model, and the lower panel is for M2 model. The surface density of pebbles decreases with time at the disc edge and increases closer to the central regions, for both cases. In the inner disc regions, at tens of au distances, is elevated due to dust growing and drifting to the star, and the formation of dust rings. At the early stages, the shapes of the pebble spatial distributions are asymmetric. The most noticeable difference between the models is that the area covered by pebbles in M2 model increases only by the 500 kyr, while in M1 model this region reaches its maximum size earlier and decreases again by 500 kyr. Total mass of pebbles in M1 model is also decreased by this time, which is related to the dynamics of the pebble-rich dust ring at 10 au.
Figure 7 also shows the region with pebbles if the lowest limit at Stokes number in the definition of pebbles is higher, . It can be seen that with this tighter constraint, the region of pebble existence is much smaller and has a fragmented shape. The two-dimensional maps for ices on pebbles are shown in Appendix B.
3.4 Massive disc
In order to check how total star plus disc mass affects the amount of pebbles formed in the disc, their composition and distribution, we performed calculations for a more massive model (M2 model in Table LABEL:tab:model). Here we highlight the most important characteristics of pebbles in the massive model.
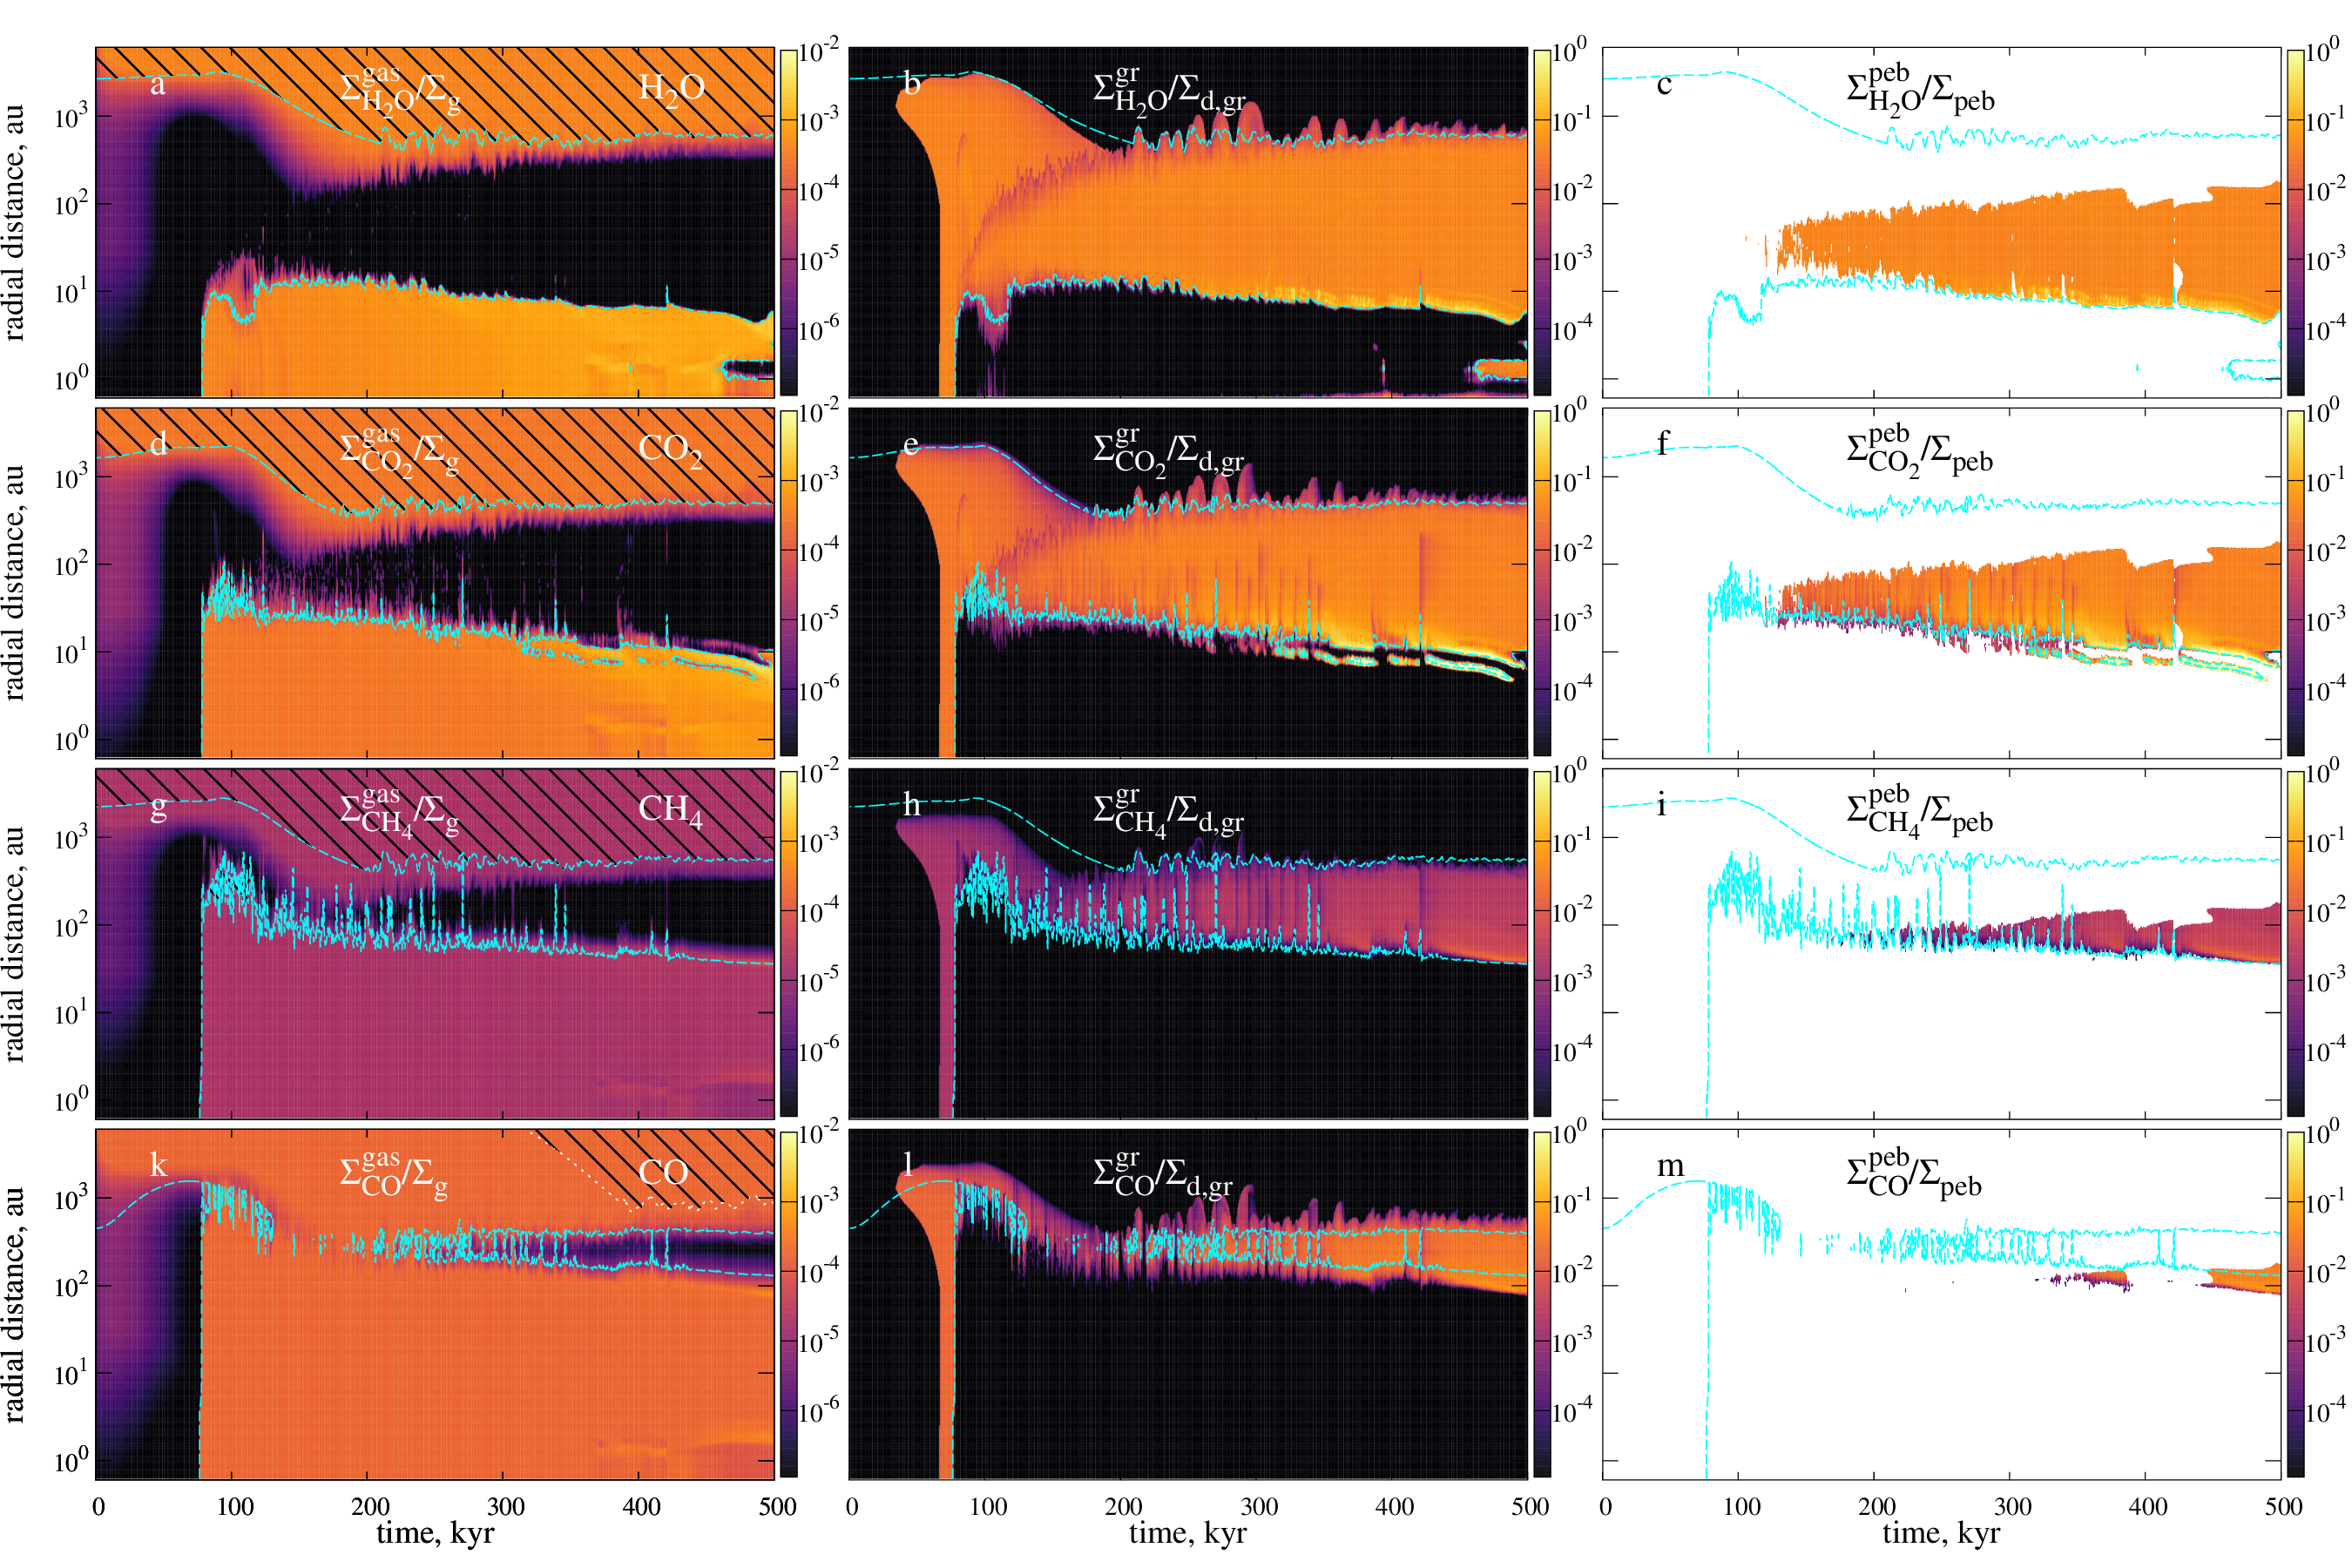
Figure 8 shows the evolution of the radial distributions of volatiles in M2 model. The dense dust ring at 1 au in M2 model is formed later than in the reference model, it contains grown dust covered with water ice mantles, but the conditions for the existence of pebbles (Section 2.3) are not fulfilled. In M2 model, ices of CO2, CH4, and CO appear on pebbles later than in the low-mass M1 model. The accumulation of volatiles in the ice phase in the vicinity of the snowlines is less pronounced, the annuli dominated by CH4 and CO are absent, and the annuli dominated by CO2 are weaker. Otherwise, the composition of ices on pebbles in the models is similar, which is also shown in Figure 6. In M2 model, H2O and CO2 are also the main volatiles on pebbles, so the conclusion of a reduced carbon abundance compared to ices on grown and small dust and volatiles in the gas remains valid.
The main difference between the two considered models is timing: the characteristic changes happen later in the more massive model. Unlike M1 model, where maximum pebble mass is reached at 400 kyr, in M2 model, the pebble mass is growing until 500 kyr. The events of sharp drops of pebble mass like those at 400 and 460 kyr in M1 model do not occur in M2 model, until perhaps at kyr, for which the consequences are unclear due to the limited time of calculation. Water ice in the ring at 1 au appears 150 kyr later. These differences in timing are caused by the differences in thermal structure. More massive disc is warmer, both because the central star providing the radiative heating is more massive and consequently hotter, and because the viscous heating is more efficient at higher gas surface densities. Thus the low enough temperatures in the inner disc are established later. Furthermore, the snowlines of all species are further from the star, which is most notable for H2O, as its snowline divides the regions with different . The more massive M2 model reaches the thermal structure comparable to that of M1 model at later times.
Despite the fact that the total mass of gas and dust in M2 model is 1.5 times higher than in M1 model, the integrated pebble masses in the models are very similar. The shape and size of the main region where pebble exist in the two models are similar, although in the massive model the spiral structure in the shape of this region is more pronounced (see Figure 7). However, in M2 model the radial extent of this region gradually increases during almost the entire considered time interval, which can be traced from the H2O ice distribution on pebbles (panel (c) in Figure 8). The inner edge of this region is a few au farther away from the star due to the farther position of the water snowline in this warmer disc. As the surface density of pebbles generally grows toward the centre, this lowers the total mass of pebbles in M2 model, making it close to that in M1 model.
4 Discussion
In the previous section, we analyse the amount of pebbles, their distribution and chemical composition of their ice mantles mostly focusing on a single protoplanetary disc model with certain parameters (M1 model). In this Section, we consider how particular model parameters can influence the properties of pebbles in the disc and our conclusions.
4.1 Parameters of pebble definition
To distinguish pebbles from grown dust, we used the definition based on the work of Vorobyov et al. (2023), where the key parameters are the threshold values of and cm (see Section 2.3). Here we also consider the following combinations of threshold parameters: and cm, and cm, and and cm. The chosen values are five times higher than those adopted in our reference model, so they correspond to larger and more dynamically decoupled pebbles and they imply a stricter restriction on the existence of pebbles.
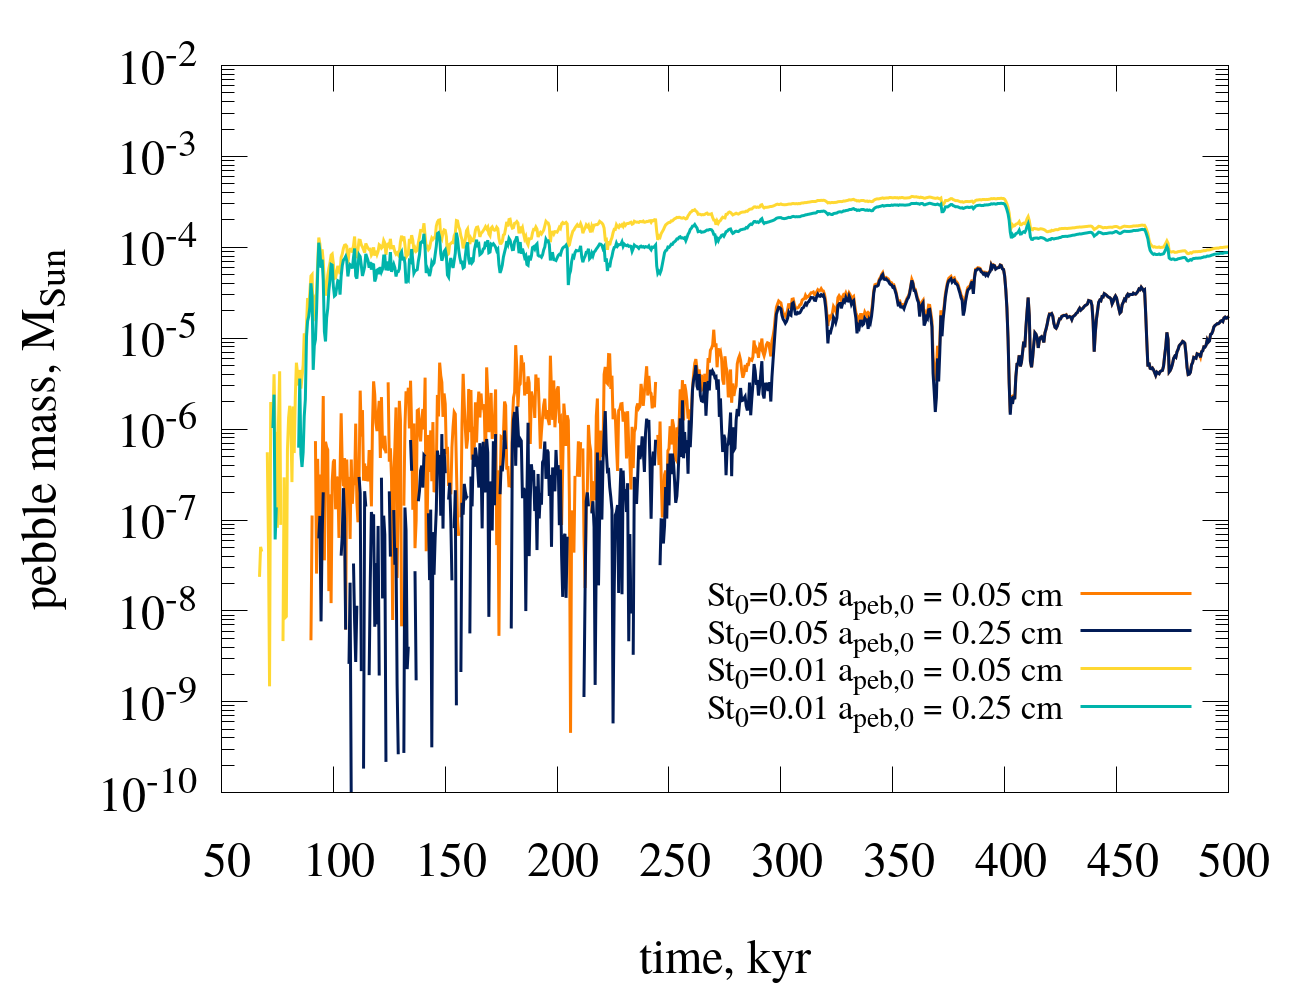
The total mass of pebbles in the disc for the definition of pebbles with different parameters is shown in Figure 9. If we compare the cases of different at fixed , we see that changing leads to an order of unity difference in the total pebble mass. At , changing has almost no effect on the pebble mass after 300 kyr, i.e., all pebbles are cm.
If we change the critical Stokes number, the pebble mass in the disc drops significantly. The main effect of applying more strict definition of pebbles is the reduced areas where pebbles exist and lower surface density of pebbles. The former has already been shown in the two-dimensional distributions in Figure 7, where the shaded areas () are much smaller compared to the coloured ones (). The value of in these areas is also generally lower, because depends on (see Eqs. (13) and (15)). With , the total mass of pebbles does not exceed until almost 300 kyr. The maximum value of is , which is a factor of 5 smaller than with the baseline definition. Thus, most pebbles in the model have Stokes number in the range . Stokes parameter is the most important boundary condition in the definition of pebbles.
As can be seen from panel (h) of Figure 1, grains with are practically absent in the protoplanetary disc. Many models of planet formation through pebble accretion consider high values of , such as 0.1 or 1 (e.g., Lambrechts & Johansen, 2012). We show that grains with such values are hardly available in young discs with dust growth self-consistently formed through the collapse of a prestellar core.
4.2 Chemical composition of the ice
The present work is focused on the composition of the ice mantles on pebbles in the context of global dust growth and migration in a protoplanetary discs. We do not aim to accurately predict the composition of ices, and rather describe it in the first-order approximation. There are many astrochemical models of protoplanetary discs that employ comprehensive chemical reaction networks, such as ALCHEMIC (Semenov et al., 2010), ANDES (Akimkin et al., 2013), NAUTILUS (Wakelam et al., 2015) or ProDiMo (Kamp et al., 2017). They include gas-phase and surface reactions and various sources of ionisation. However, these models do not describe global gas and dust dynamics, which is the focus of FEOSAD code. There are many other chemical models of protoplanetary discs that include different other physical processes and approximations, see the review by Öberg et al. (2023) and references therein. Some hydrodynamic simulations of protoplanetary discs include complicated chemical kinetics modelling (Ilee et al., 2017; Wang et al., 2019). However, they only allow to follow disc evolution for relatively short timescales ( yr). In FEOSAD, we describe global evolution of a dusty disc, beginning from the core collapse, and therefore need to use a simplified chemical model allowing for fast analytical solution.
The initial abundances of the volatiles should influence the final composition of ice on pebbles. Apart from the four most dominant volatiles, other species, including complex organics (Bacmann et al., 2012; Ceccarelli et al., 2022), are also present in the composition of protostellar cores and are not considered in the present paper. The abundances of these species are much lower than water, carbon dioxide, or carbon monoxide, but together they can contribute significantly to the carbon and oxygen balance of the volatiles.
The adopted ice fractions are based on the observed ice composition in protostellar cores (Öberg et al., 2011a). The mass fraction of the ices relative to the total gas mass was calculated under the assumption that the water abundance relative to the gas number density is , which is based on numerical models of Pontoppidan et al. (2004); Boogert & Ehrenfreund (2004). However, under these assumptions, the total mass of ice in the model appears to be more than an order of magnitude lower than the mass of the refractory component (). Data from the Solar System studies and the observations of the ISM suggest that dust grains in protoplanetary discs should be covered by ice mantles with masses comparable to the refractory dust grain cores, or even exceeding them by up to times (Pontoppidan et al., 2014). In line with this, for example, modelling the formation of planetesimals on the water snowline, Drążkowska & Alibert (2017) assumed an initial water content of of the dust mass, implying equal masses of water mantles and refractory cores. Using this higher abundance of water could affect the ratio between the volatile and refractory components of dust grains in our modelling results.
The choice of the low initial mass fraction of ice is also justified by the model limitations. We neglect the contribution of ice mantles to the mass and size of dust grains and assume that mantles do not affect their dynamics. Since the model implies zero-order desorption, the local amount of a volatile species in the ice phase also does not affect the desorption rate, but the adsorption (freeze-out) rate is proportional to the current amount of the gas-phase volatile species. Thus, an increase in the abundance of volatiles by several times should lead to a shift of the snowlines closer to the star, i.e., to the expansion of the ice phase dominated region.
As the first approximation, we can claim that the resulting surface densities of ices in the disc, including ices on pebbles, are proportional to the initial mass fractions of the corresponding volatiles. However, one should remember that the assumption of massless ice mantles will no longer hold with the increased initial ice masses. With the mass fractions of volatiles adopted in the presented modelling, masses of ice mantles exceed masses of refractory cores in some parts of the disc. With higher initial ice fractions, this assumption might be violated in the whole disc. The modelling of adsorption and desorption of mantles for dust grains mainly consisting of volatiles is a problem on its own relevant for the conditions of protoplanetary discs and it merits a focused consideration.
During protoplanetary disc lifetimes, the chemical composition of ice and gas will also inevitably change due to chemical reactions in the gas phase and on the surface of the dust grains (Henning & Semenov, 2013). These processes include surface chemical reactions (Hasegawa et al., 1992; Garrod, 2008), photo-reactions in ice mantles under UV irradiation (Öberg et al., 2009) and sublimation by cosmic rays (Ivlev et al., 2015). This would lead to the formation of more complex species with different desorption energies, which could transfer to the other phase and hence participate in the motion of the other dynamical component (grown dust or gas/small dust). In the presented model we consider only the most important chemical processes: adsorption and desorption, but the role of other chemical reactions may also be decisive. Modelling dust drift in a viscous disc in combination with a large chemical reaction network, Booth & Ilee (2019) demonstrated that the direct transport of chemical species with dust grains dominates over chemical reactions, determining the distribution of volatiles, if is high enough (). In our model with variable -parameter, this condition is fulfilled outside the dead zone ( au), however, in the inner regions the role of chemistry may be more important and should be investigated in separate studies.
The desorption energies we adopted from Molyarova et al. (2021) can also be model parameters. In particular, they depend on the presence of other ices within the mantle (Cuppen et al., 2017). Changes in the desorption energies can lead to shifts in the snowlines. For example, for CO, a shift of the snowline by au can lead to this species completely absent on pebbles and prevent the formation of a region where CO dominates the ice composition (see Section 3.2 and Figure 3). Another important parameter is the value of pre-exponential factor. As shown by Minissale et al. (2022), the widely used approach by Hasegawa & Herbst (1993), which we also use, underestimates pre-exponential factor. It produces values that are orders of magnitude lower compared to both experimental data and the transition state theory approach, that give similar values. Using those newer values would allow to more precisely determine the positions of the snowlines in protoplanetary discs.
To test the effect of the chosen thermal desorption parameters on our results, we calculated the equilibrium positions of the snowlines in M1 model using the recommended values of desorption energy and pre-exponential factor from Table 5 of Minissale et al. (2022). For H2O, the positions of the snowlines changed only slightly. The temperature gradient is high around the water snowline, so even though the freeze-out temperature is significantly different, the position is almost the same. For CH4, the difference in the parameters is relatively small, and the snowline is shifted inwards by 10 au. The snowline of CO2 is shifted outwards by au. Its new position is beyond the dust ring at au, and the region with CO2 ice inside 10 au disappears. For CO, the snowline is shifted significantly mostly due to the change in binding energy, which is a factor of higher in Minissale et al. (2022). However, the CO desorption energies previously discussed in the literature (e.g. Cuppen et al., 2017) are not as high. At the same time, if only the pre-exponential factor is to be changed, then no CO ice is present in the disc at all. This is an ambiguous result, which hampers the determination of the CO snowline position, as it is unclear what desorption parameters are better to use.
4.3 Fragmentation velocity
The surface density of ice on grown dust in the model has a direct effect on the fragmentation velocity. However, the threshold value of the amount of ice required to cover a dust grain with one monolayer and thus to affect the value of is very low, on the order of for the millimetre-sized dust (see Equation (40) in Section 2.6 of Molyarova et al., 2021). A proportional increase in the amount of ice means that this condition will be satisfied in a slightly larger part of the disc. Given that in the vicinity of the snowline the surface density of volatiles changes exponentially in the radial direction, the region where dust grains are covered by ice will not change significantly.
More significant changes should be expected when considering other values of . The values of and 5 m s-1 adopted in this paper are relatively low. For example, in Molyarova et al. (2021), three times higher fragmentation velocities were considered. Numerical modelling shows that ice-covered dust aggregates can avoid fragmentation in collisions at velocities up to 50 m s-1 (Wada et al., 2009). Meanwhile, in laboratory experiments, dust grains with ice mantles fragment at velocities above m s-1 (Gundlach & Blum, 2015). However, also depends on the monomer size, which in our model is m, so a lower value of fragmentation velocity seems more appropriate (see Eqs. (3) and (4) in Okuzumi & Tazaki, 2019, and related references). The choice of higher values of weakens the role of fragmentation and allows dust grains to coagulate over a wider range of conditions. However, due to dust radial drift, this does not guarantee the survival of these grown dust grains in the disc (Weidenschilling, 1977b).
At higher , we can expect an increase in the total amount of pebbles in the disc, but their accretion rate onto the star should also increase: in this situation, the relative fraction of solids of the disc can become lower. In Elbakyan et al. (2020), a higher fragmentation threshold of m s-1 is adopted, and dust grains reach a size of a few centimetres. Their comparison of models with fixed and different and 30 m s-1 shows that lower fragmentation velocity leads to a smaller dust size (of the order of millimetres). However, the global disc evolution is weakly affected because at the drift is determined by advection and dust is drifting with gas regardless of its size. For lower values, the situation must be different when such a broad span in is considered. The fact that the amount of pebbles in the disc is very sensitive to for was thoroughly demonstrated in Vorobyov et al. (2023).
If we discard the considered effect of ice mantles and assume a relatively high value of for regions with “bare” silicate dust grains, then pebbles without ice mantles may also exist in the disc. Another caveat of the model is that the chemical composition of the mantle does not affect the value of fragmentation velocity. In particular, we do not consider the effect of CO2, which in laboratory experiments was shown to reduce to values typical of bare silicate dust (Musiolik et al., 2016a, b).
5 Conclusions
In this work, we model the formation and global evolution of a self-gravitating viscous protoplanetary disc using the two-dimensional hydrodynamic code FEOSAD. The simulations include gas dynamics, dust dynamics and growth, thermal balance, and volatile dynamics starting from cloud collapse to 500 kyr. We analyse the distribution of pebbles and the distribution of the main volatile species (H2O, CO2, CH4 and CO) in the gas, on small dust, on grown dust and on pebbles. The main conclusions of the work are listed below.
-
•
We show that pebbles are present in a protoplanetary disc already kyr after the disc formation until the end of modelling (0.5 Myr). The integral mass of pebbles in the disc reaches a value of at kyr, subsequently increasing by a factor of three and falling back to by the end of the simulation, which is from a few percent to a quarter of the mass of all grown dust. The maximum value of the total pebble mass (excluding ice mantles) is about or , which is comparable to the mass of solid matter in the Minimum Mass Solar Nebula. This suggests that there are prerequisites for planet formation at the early stages of disc evolution.
-
•
All pebbles present in the disc are covered by ice mantles, i.e., there are no “bare” pebbles consisting exclusively of the refractory core. Ice mantles on pebbles consist mainly of H2O and CO2, and are carbon-depleted compared to the mantles on small dust, grown dust, and to the gas, which contain more CO2 and CH4. This suggests a possible dominance of oxygen in the composition of planets formed from pebbles under these conditions.
-
•
Most of the pebbles in the model have Stokes number between 0.01 and 0.05, and the grains with are practically absent in the disc, which should be accounted for in the planet formation models.
We consider different parameters in the definition of pebbles, as well as two models with different initial masses of the collapsing cloud. Comparison of the results showed that the above conclusions stay valid for the considered model parameters.
Acknowledgements
We are grateful to Vardan Elbakyan for fruitful discussions regarding the definition of pebbles. The study was funded by a grant from the Russian Science Foundation 22-72-10029, https://rscf.ru/project/22-72-10029/
Data availability
The data underlying this article will be shared on reasonable request to the corresponding author.
References
- Akimkin et al. (2013) Akimkin V., Zhukovska S., Wiebe D., Semenov D., Pavlyuchenkov Y., Vasyunin A., Birnstiel T., Henning T., 2013, ApJ, 766, 8
- Armitage (2010) Armitage P. J., 2010, Astrophysics of Planet Formation. Cambridge University Press, Cambridge, UK
- Audard et al. (2014) Audard M., et al., 2014, in Beuther H., Klessen R. S., Dullemond C. P., Henning T., eds, Protostars and Planets VI. pp 387–410 (arXiv:1401.3368), doi:10.2458/azu_uapress_9780816531240-ch017
- Bacmann et al. (2012) Bacmann A., Taquet V., Faure A., Kahane C., Ceccarelli C., 2012, A&A, 541, L12
- Bae et al. (2014) Bae J., Hartmann L., Zhu Z., Nelson R. P., 2014, ApJ, 795, 61
- Balbus & Hawley (1991) Balbus S. A., Hawley J. F., 1991, ApJ, 376, 214
- Balbus & Hawley (1998) Balbus S. A., Hawley J. F., 1998, Reviews of Modern Physics, 70, 1
- Birnstiel et al. (2012) Birnstiel T., Klahr H., Ercolano B., 2012, A&A, 539, A148
- Bisschop et al. (2006) Bisschop S. E., Fraser H. J., Öberg K. I., van Dishoeck E. F., Schlemmer S., 2006, A&A, 449, 1297
- Bitsch et al. (2015) Bitsch B., Lambrechts M., Johansen A., 2015, A&A, 582, A112
- Bodenheimer & Pollack (1986) Bodenheimer P., Pollack J. B., 1986, Icarus, 67, 391
- Boley (2009) Boley A. C., 2009, ApJ, 695, L53
- Boogert & Ehrenfreund (2004) Boogert A. C. A., Ehrenfreund P., 2004, in Witt A. N., Clayton G. C., Draine B. T., eds, Astronomical Society of the Pacific Conference Series Vol. 309, Astrophysics of Dust. p. 547 (arXiv:astro-ph/0311163), doi:10.48550/arXiv.astro-ph/0311163
- Booth & Ilee (2019) Booth R. A., Ilee J. D., 2019, MNRAS, 487, 3998
- Brown & Charnley (1990) Brown P. D., Charnley S. B., 1990, MNRAS, 244, 432
- Ceccarelli et al. (2022) Ceccarelli C., et al., 2022, arXiv e-prints, p. arXiv:2206.13270
- Cieza et al. (2016) Cieza L. A., et al., 2016, Nature, 535, 258
- Cuppen et al. (2017) Cuppen H. M., Walsh C., Lamberts T., Semenov D., Garrod R. T., Penteado E. M., Ioppolo S., 2017, Space Sci. Rev., 212, 1
- Draine (1978) Draine B. T., 1978, ApJS, 36, 595
- Drążkowska & Alibert (2017) Drążkowska J., Alibert Y., 2017, A&A, 608, A92
- Eistrup & Henning (2022) Eistrup C., Henning T., 2022, A&A, 667, A160
- Eistrup et al. (2018) Eistrup C., Walsh C., van Dishoeck E. F., 2018, A&A, 613, A14
- Elbakyan et al. (2020) Elbakyan V. G., Johansen A., Lambrechts M., Akimkin V., Vorobyov E. I., 2020, A&A, 637, A5
- Flaherty et al. (2017) Flaherty K. M., et al., 2017, ApJ, 843, 150
- Flaherty et al. (2018) Flaherty K. M., Hughes A. M., Teague R., Simon J. B., Andrews S. M., Wilner D. J., 2018, ApJ, 856, 117
- Fraser et al. (2001) Fraser H. J., Collings M. P., McCoustra M. R. S., Williams D. A., 2001, MNRAS, 327, 1165
- Garrod (2008) Garrod R. T., 2008, A&A, 491, 239
- Gundlach & Blum (2015) Gundlach B., Blum J., 2015, ApJ, 798, 34
- Haisch et al. (2001) Haisch Karl E. J., Lada E. A., Lada C. J., 2001, ApJ, 553, L153
- Hartmann et al. (1998) Hartmann L., Calvet N., Gullbring E., D’Alessio P., 1998, ApJ, 495, 385
- Hasegawa & Herbst (1993) Hasegawa T. I., Herbst E., 1993, MNRAS, 263, 589
- Hasegawa et al. (1992) Hasegawa T. I., Herbst E., Leung C. M., 1992, ApJS, 82, 167
- Helled et al. (2014) Helled R., et al., 2014, in Beuther H., Klessen R. S., Dullemond C. P., Henning T., eds, Protostars and Planets VI. pp 643–665 (arXiv:1311.1142), doi:10.2458/azu_uapress_9780816531240-ch028
- Henning & Semenov (2013) Henning T., Semenov D., 2013, Chemical Reviews, 113, 9016
- Houge & Krijt (2023) Houge A., Krijt S., 2023, MNRAS, 521, 5826
- Ida et al. (2016) Ida S., Guillot T., Morbidelli A., 2016, A&A, 591, A72
- Ilee et al. (2011) Ilee J. D., Boley A. C., Caselli P., Durisen R. H., Hartquist T. W., Rawlings J. M. C., 2011, MNRAS, 417, 2950
- Ilee et al. (2017) Ilee J. D., et al., 2017, MNRAS, 472, 189
- Ivlev et al. (2015) Ivlev A. V., Röcker T. B., Vasyunin A., Caselli P., 2015, ApJ, 805, 59
- Johansen & Lambrechts (2017) Johansen A., Lambrechts M., 2017, Annual Review of Earth and Planetary Sciences, 45, 359
- Johansen et al. (2015) Johansen A., Mac Low M.-M., Lacerda P., Bizzarro M., 2015, Science Advances, 1, 1500109
- Kadam et al. (2019) Kadam K., Vorobyov E., Regály Z., Kóspál Á., Ábrahám P., 2019, ApJ, 882, 96
- Kadam et al. (2020) Kadam K., Vorobyov E., Regály Z., Kóspál Á., Ábrahám P., 2020, ApJ, 895, 41
- Kadam et al. (2022) Kadam K., Vorobyov E., Basu S., 2022, MNRAS, 516, 4448
- Kamp et al. (2017) Kamp I., Thi W. F., Woitke P., Rab C., Bouma S., Ménard F., 2017, A&A, 607, A41
- Krijt et al. (2018) Krijt S., Schwarz K. R., Bergin E. A., Ciesla F. J., 2018, ApJ, 864, 78
- Lambrechts & Johansen (2012) Lambrechts M., Johansen A., 2012, A&A, 544, A32
- Lambrechts et al. (2017) Lambrechts M., Morbidelli A., Johansen A., 2017, in Chondrules as Astrophysical Objects. p. 2010
- Lenz et al. (2019) Lenz C. T., Klahr H., Birnstiel T., 2019, ApJ, 874, 36
- Linz et al. (2021) Linz H., et al., 2021, Experimental Astronomy, 51, 661
- Lorén-Aguilar & Bate (2014) Lorén-Aguilar P., Bate M. R., 2014, MNRAS, 443, 927
- Mamajek (2009) Mamajek E. E., 2009, in Usuda T., Tamura M., Ishii M., eds, American Institute of Physics Conference Series Vol. 1158, Exoplanets and Disks: Their Formation and Diversity. pp 3–10 (arXiv:0906.5011), doi:10.1063/1.3215910
- Mathis et al. (1977) Mathis J. S., Rumpl W., Nordsieck K. H., 1977, ApJ, 217, 425
- Meijerink et al. (2009) Meijerink R., Pontoppidan K. M., Blake G. A., Poelman D. R., Dullemond C. P., 2009, ApJ, 704, 1471
- Minissale et al. (2022) Minissale M., et al., 2022, ACS Earth and Space Chemistry, 6, 597
- Mizuno (1980) Mizuno H., 1980, Progress of Theoretical Physics, 64, 544
- Molyarova et al. (2021) Molyarova T., Vorobyov E. I., Akimkin V., Skliarevskii A., Wiebe D., Güdel M., 2021, ApJ, 910, 153
- Morbidelli et al. (2015) Morbidelli A., Lambrechts M., Jacobson S., Bitsch B., 2015, Icarus, 258, 418
- Musiolik et al. (2016a) Musiolik G., Teiser J., Jankowski T., Wurm G., 2016a, ApJ, 818, 16
- Musiolik et al. (2016b) Musiolik G., Teiser J., Jankowski T., Wurm G., 2016b, ApJ, 827, 63
- Öberg & Wordsworth (2019) Öberg K. I., Wordsworth R., 2019, AJ, 158, 194
- Öberg et al. (2005) Öberg K. I., van Broekhuizen F., Fraser H. J., Bisschop S. E., van Dishoeck E. F., Schlemmer S., 2005, ApJ, 621, L33
- Öberg et al. (2009) Öberg K. I., Garrod R. T., van Dishoeck E. F., Linnartz H., 2009, A&A, 504, 891
- Öberg et al. (2011a) Öberg K. I., Boogert A. C. A., Pontoppidan K. M., van den Broek S., van Dishoeck E. F., Bottinelli S., Blake G. A., Evans Neal J. I., 2011a, ApJ, 740, 109
- Öberg et al. (2011b) Öberg K. I., Murray-Clay R., Bergin E. A., 2011b, ApJ, 743, L16
- Öberg et al. (2023) Öberg K. I., Facchini S., Anderson D. E., 2023, ARA&A, 61, 287
- Okuzumi & Tazaki (2019) Okuzumi S., Tazaki R., 2019, ApJ, 878, 132
- Okuzumi et al. (2012) Okuzumi S., Tanaka H., Kobayashi H., Wada K., 2012, ApJ, 752, 106
- Okuzumi et al. (2016) Okuzumi S., Momose M., Sirono S.-i., Kobayashi H., Tanaka H., 2016, ApJ, 821, 82
- Ormel & Cuzzi (2007) Ormel C. W., Cuzzi J. N., 2007, A&A, 466, 413
- Ormel & Klahr (2010) Ormel C. W., Klahr H. H., 2010, A&A, 520, A43
- Pavlyuchenkov et al. (2019) Pavlyuchenkov Y., Akimkin V., Wiebe D., Vorobyov E., 2019, MNRAS, 486, 3907
- Pfalzner et al. (2014) Pfalzner S., Steinhausen M., Menten K., 2014, ApJ, 793, L34
- Pignatale et al. (2017) Pignatale F. C., Gonzalez J. F., Cuello N., Bourdon B., Fitoussi C., 2017, MNRAS, 469, 237
- Pollack et al. (1996) Pollack J. B., Hubickyj O., Bodenheimer P., Lissauer J. J., Podolak M., Greenzweig Y., 1996, Icarus, 124, 62
- Pontoppidan et al. (2004) Pontoppidan K. M., van Dishoeck E. F., Dartois E., 2004, A&A, 426, 925
- Pontoppidan et al. (2014) Pontoppidan K. M., Salyk C., Bergin E. A., Brittain S., Marty B., Mousis O., Öberg K. I., 2014, in Beuther H., Klessen R. S., Dullemond C. P., Henning T., eds, Protostars and Planets VI. pp 363–385 (arXiv:1401.2423), doi:10.2458/azu_uapress_9780816531240-ch016
- Semenov et al. (2010) Semenov D., et al., 2010, A&A, 522, A42
- Shakura & Sunyaev (1973) Shakura N. I., Sunyaev R. A., 1973, A&A, 24, 337
- Stammler et al. (2017) Stammler S. M., Birnstiel T., Panić O., Dullemond C. P., Dominik C., 2017, A&A, 600, A140
- Stepinski & Valageas (1997) Stepinski T. F., Valageas P., 1997, A&A, 319, 1007
- Stevenson & Lunine (1988) Stevenson D. J., Lunine J. I., 1988, Icarus, 75, 146
- Stoyanovskaya et al. (2018) Stoyanovskaya O. P., Vorobyov E. I., Snytnikov V. N., 2018, Astronomy Reports, 62, 455
- Testi et al. (2014) Testi L., et al., 2014, in Beuther H., Klessen R. S., Dullemond C. P., Henning T., eds, Protostars and Planets VI. pp 339–361 (arXiv:1402.1354), doi:10.2458/azu_uapress_9780816531240-ch015
- Tielens & Allamandola (1987) Tielens A. G. G. M., Allamandola L. J., 1987, Composition, Structure, and Chemistry of Interstellar Dust. Springer, Dordrecht, p. 397, doi:10.1007/978-94-009-3861-8_16
- Turner et al. (2014) Turner N. J., Fromang S., Gammie C., Klahr H., Lesur G., Wardle M., Bai X. N., 2014, in Beuther H., Klessen R. S., Dullemond C. P., Henning T., eds, Protostars and Planets VI. pp 411–432 (arXiv:1401.7306), doi:10.2458/azu_uapress_9780816531240-ch018
- Vorobyov & Basu (2010) Vorobyov E. I., Basu S., 2010, ApJ, 719, 1896
- Vorobyov & Elbakyan (2018) Vorobyov E. I., Elbakyan V. G., 2018, A&A, 618, A7
- Vorobyov et al. (2013) Vorobyov E. I., Baraffe I., Harries T., Chabrier G., 2013, A&A, 557, A35
- Vorobyov et al. (2017) Vorobyov E. I., Elbakyan V., Hosokawa T., Sakurai Y., Guedel M., Yorke H., 2017, A&A, 605, A77
- Vorobyov et al. (2018a) Vorobyov E. I., Akimkin V., Stoyanovskaya O., Pavlyuchenkov Y., Liu H. B., 2018a, A&A, 614, A98
- Vorobyov et al. (2018b) Vorobyov E. I., Akimkin V., Stoyanovskaya O., Pavlyuchenkov Y., Liu H. B., 2018b, A&A, 614, A98
- Vorobyov et al. (2020a) Vorobyov E. I., Elbakyan V. G., Takami M., Liu H. B., 2020a, A&A, 643, A13
- Vorobyov et al. (2020b) Vorobyov E. I., Khaibrakhmanov S., Basu S., Audard M., 2020b, A&A, 644, A74
- Vorobyov et al. (2022) Vorobyov E. I., et al., 2022, A&A, 658, A191
- Vorobyov et al. (2023) Vorobyov E. I., Elbakyan V. G., Johansen A., Lambrechts M., Skliarevskii A. M., Stoyanovskaya O. P., 2023, A&A, 670, A81
- Wada et al. (2009) Wada K., Tanaka H., Suyama T., Kimura H., Yamamoto T., 2009, ApJ, 702, 1490
- Wakelam et al. (2015) Wakelam V., et al., 2015, ApJS, 217, 20
- Wang et al. (2019) Wang L., Bai X.-N., Goodman J., 2019, ApJ, 874, 90
- Weidenschilling (1977a) Weidenschilling S. J., 1977a, Ap&SS, 51, 153
- Weidenschilling (1977b) Weidenschilling S. J., 1977b, MNRAS, 180, 57
- Westley et al. (1995) Westley M. S., Baragiola R. A., Johnson R. E., Baratta G. A., 1995, Nature, 373, 405
- Yorke & Bodenheimer (2008) Yorke H. W., Bodenheimer P., 2008, in Beuther H., Linz H., Henning T., eds, Astronomical Society of the Pacific Conference Series Vol. 387, Massive Star Formation: Observations Confront Theory. p. 189
- Youdin & Goodman (2005) Youdin A. N., Goodman J., 2005, ApJ, 620, 459
- Zhu et al. (2010) Zhu Z., Hartmann L., Gammie C. F., Book L. G., Simon J. B., Engelhard E., 2010, ApJ, 713, 1134
- Zhu et al. (2020) Zhu Z., Jiang Y.-F., Stone J. M., 2020, MNRAS, 495, 3494
Appendix A Different criteria for pebble definition
In this paper we use a modified version of the definition of pebbles from Vorobyov et al. (2023). The main difference is in the definition of , which is defined in Eq. (27) in Vorobyov et al. (2023) and in Eq. (13) in the present study. If in some disc point, is below (0.01 and 0.05 cm, in Vorobyov et al., 2023, respectively), then in the previous definition simply goes to zero. However, there still exist grains with higher , which are larger that in this point, which are excluded from consideration by this definition. Instead of neglecting all dust in this point, we set higher value of , which allows us to account for more grains large enough to be called pebbles.
Another advantage of the modified definition of pebbles is that it allows to more consistently compare the different versions of the boundary value . In the previous definition, the regions discarded at could be included at , if the corresponding grain sizes and were on the opposite sides of cm, i.e., . So at different the regions where pebble exist would be independent. In the modified definition, the regions with higher or are always the subset of the regions with lower boundary values.
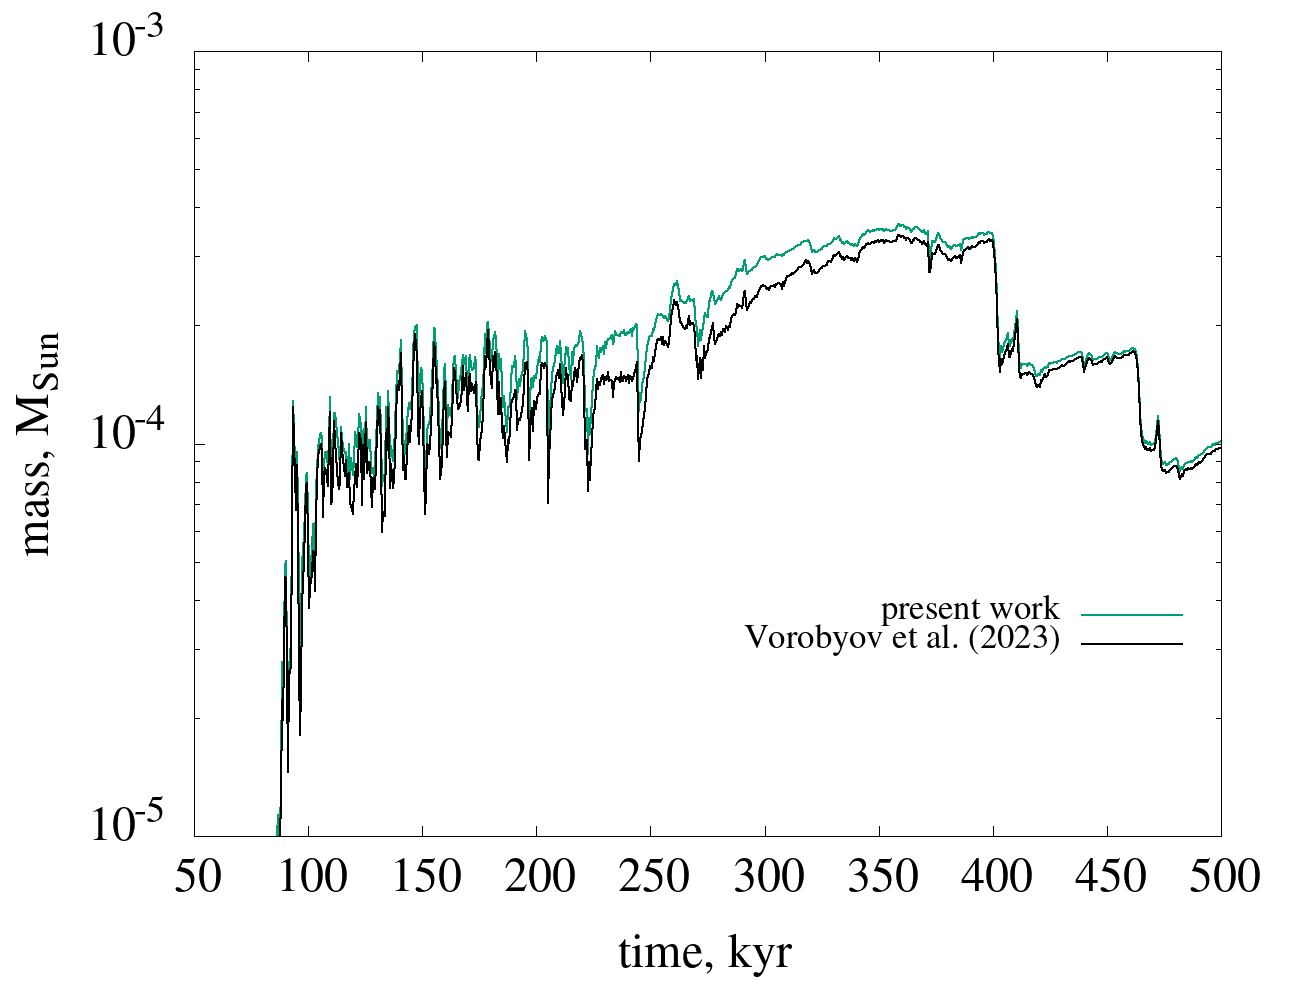
Figure 10 shows integrated mass of pebbles for these two different definitions of pebbles with the same boundary values and cm. Between 200 and 400 kyr the values of pebble masses are different by a factor of unity, but earlier and later the difference is very small. This means that the contribution of the regions discarded by the definition of Vorobyov et al. (2023) is not large in terms of total pebble amount. However, we believe that it is important to use the new definition that includes pebbles from more disc regions. The formation of planets may already begin at 200 kyr, and the presence of pebbles in wider range of conditions may affect the rate of formation of planets. Moreover, the composition of ices in the discarded regions can also be different and relevant for the composition of planets.
Appendix B Two-dimensional distribution of ices on pebbles
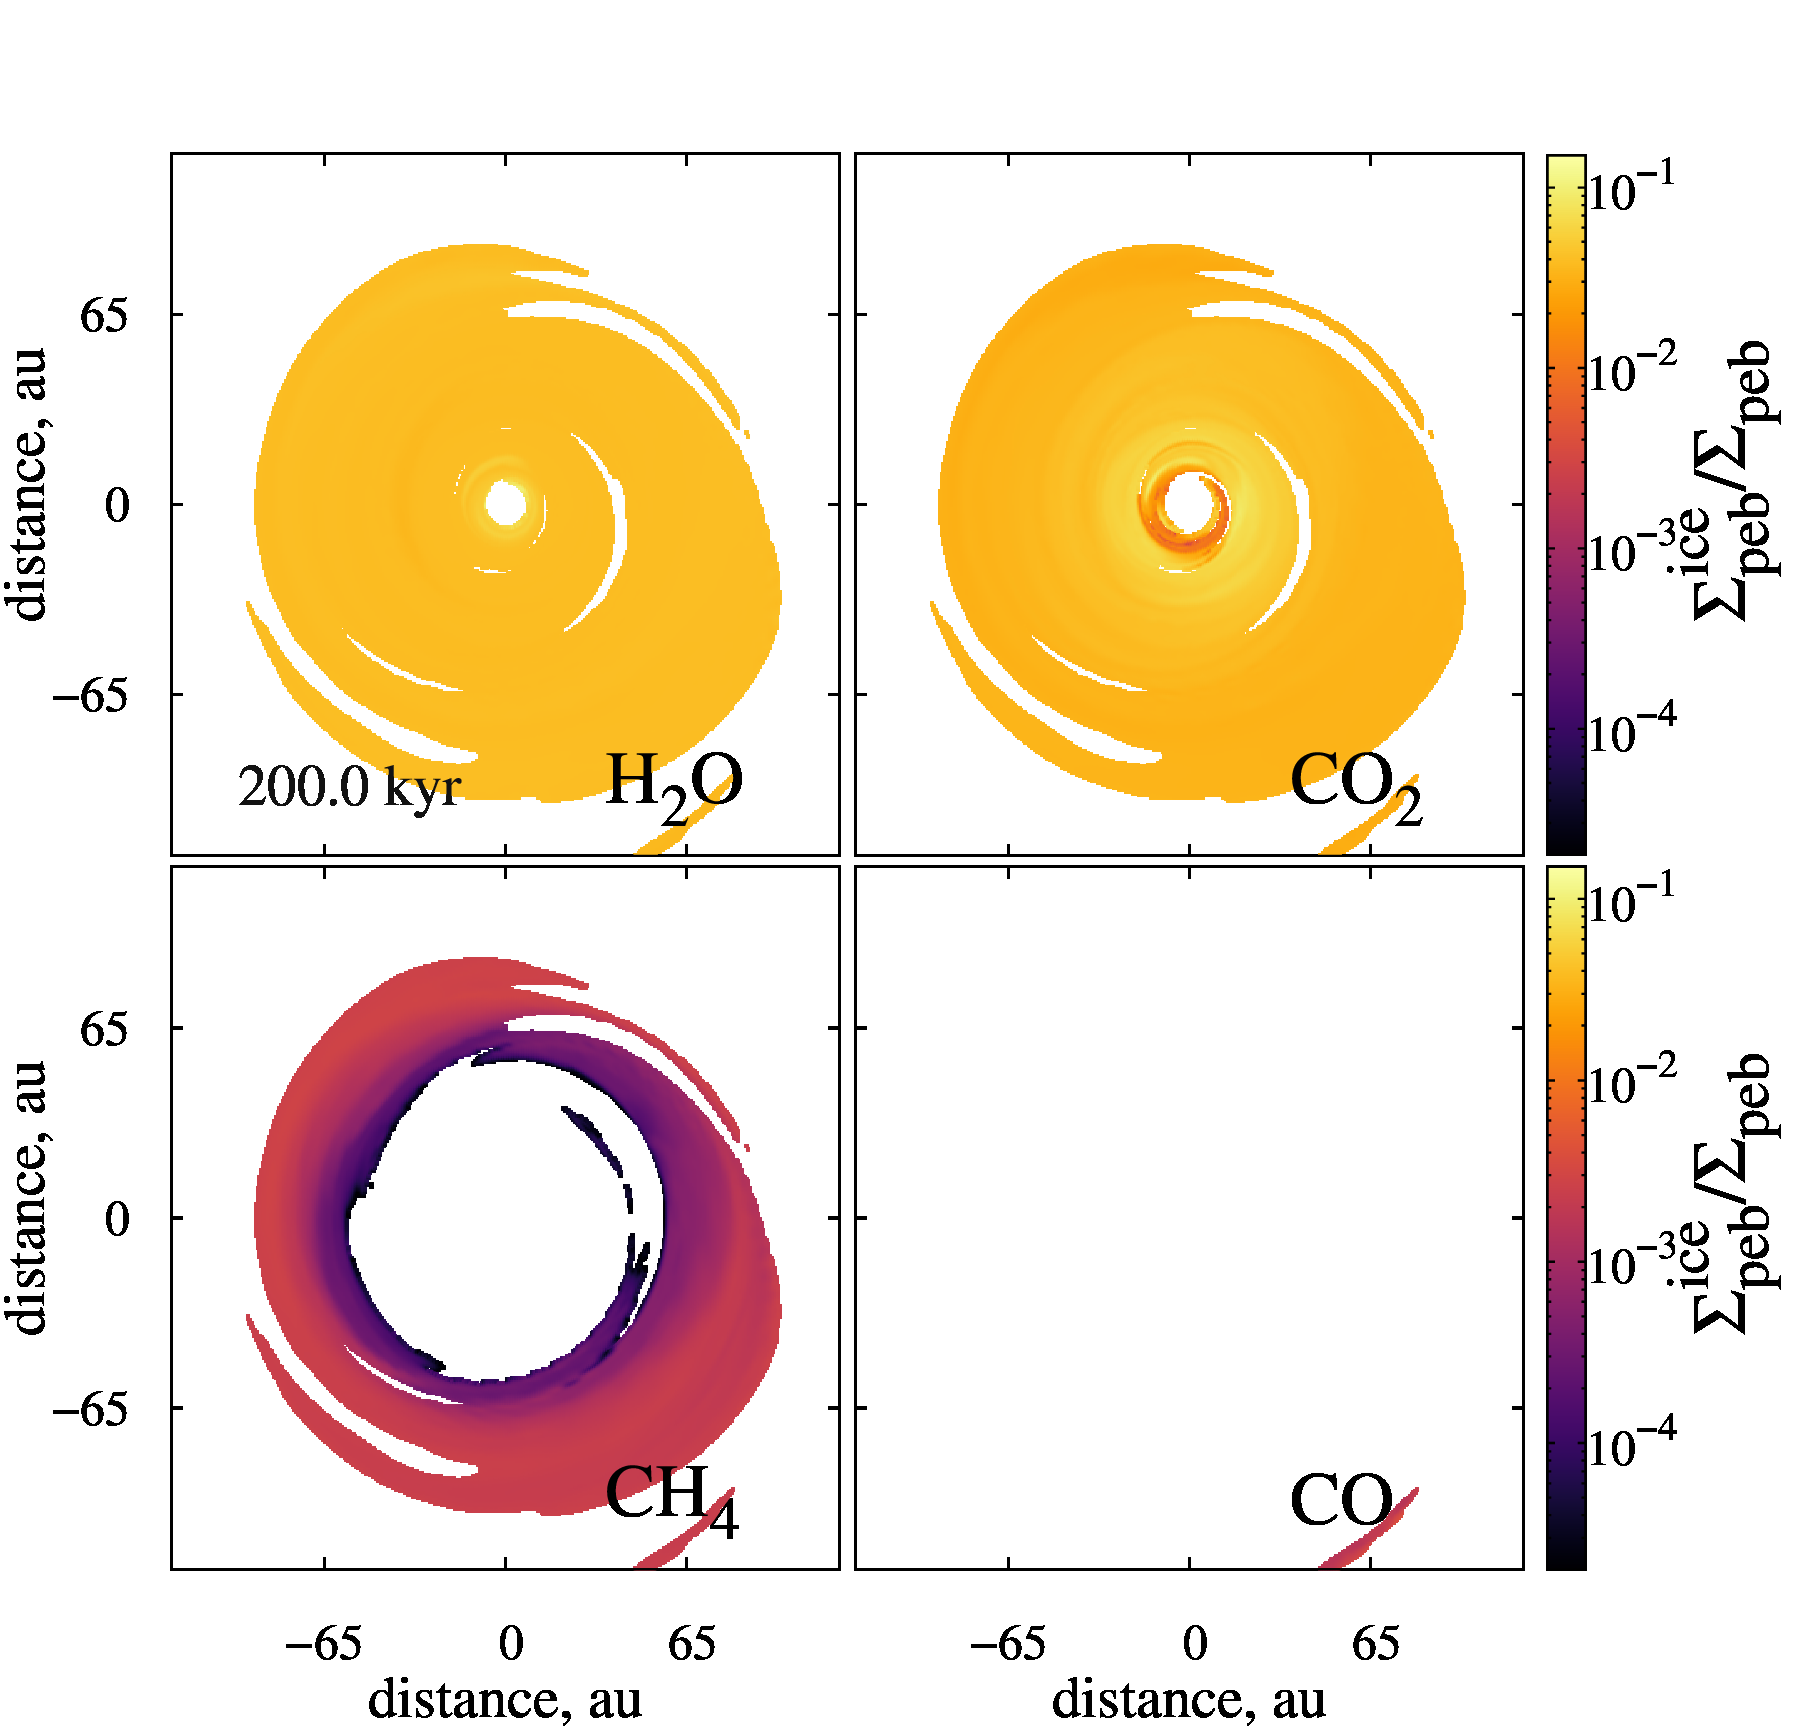

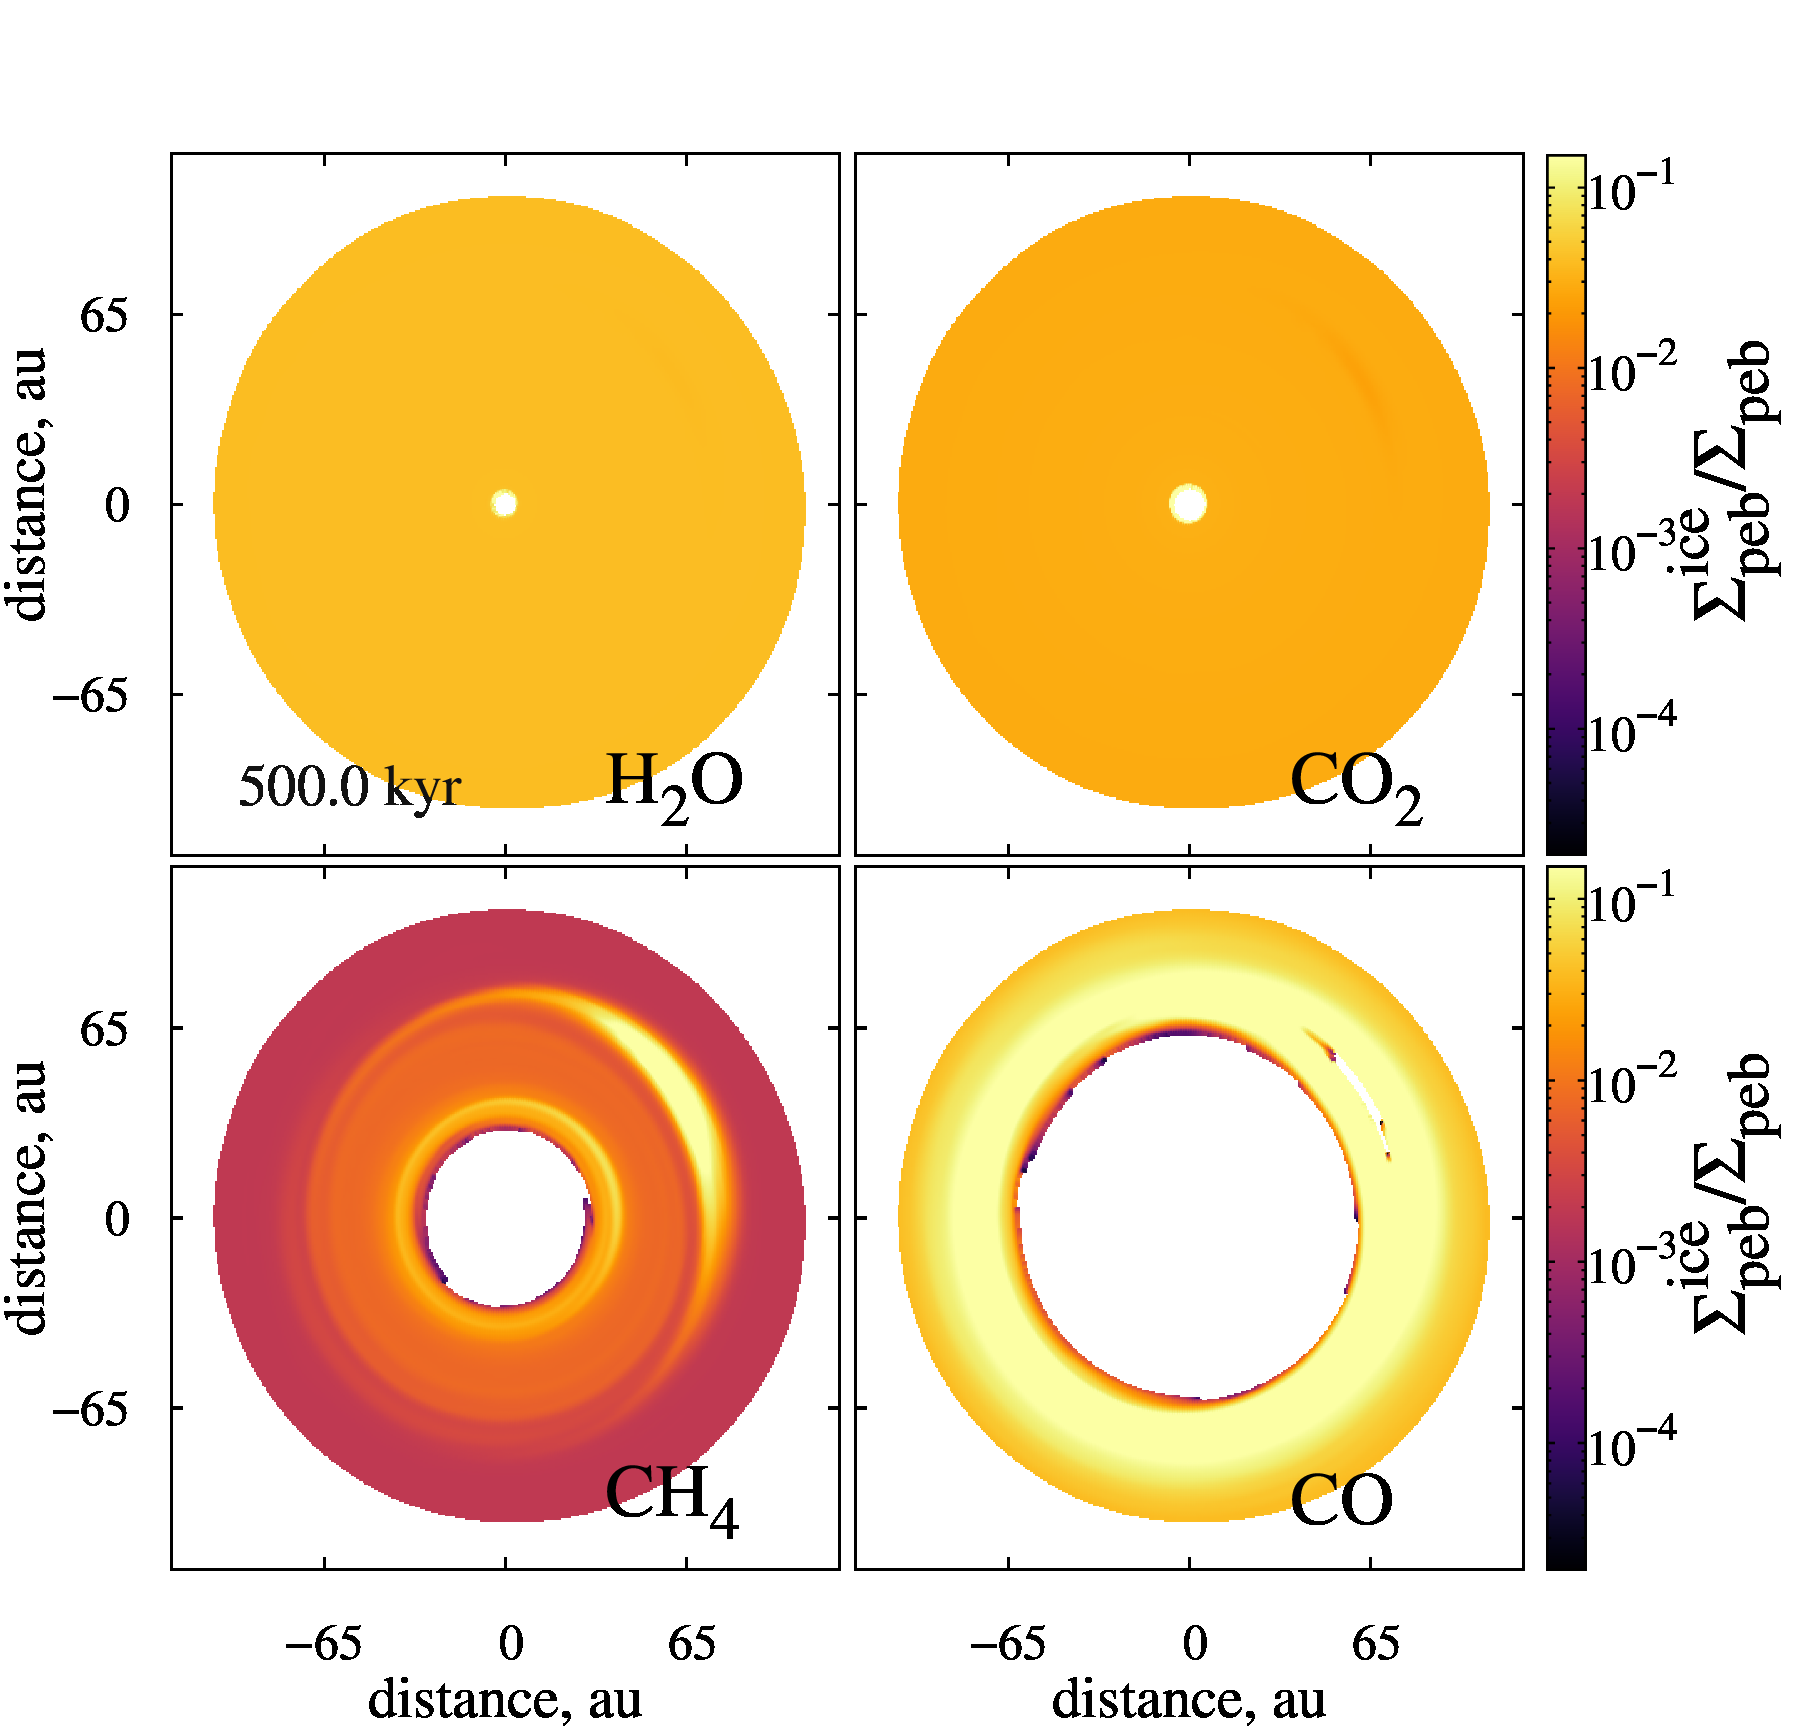
Figure 11 shows the surface densities of H2O, CO2, CH4, and CO ice on pebbles relative to the surface density of pebbles in M1 model at different times (200, 300, and 500 kyr). The distribution of H2O repeats the distribution of pebbles in Figure 7. It can also be seen that H2O and CO2 ices are the most abundant on pebbles, and they are evenly distributed over the disc.