Cold Filaments Formed in Hot Wake Flows Uplifted by AGN Bubbles in Galaxy Clusters
Abstract
Multi-wavelength observations indicate that the intracluster medium in some galaxy clusters contains cold filaments, while their formation mechanism remains debated. Using hydrodynamic simulations, we show that cold filaments could naturally condense out of hot gaseous wake flows uplifted by the jet-inflated active galactic nucleus (AGN) bubbles. Consistent with observations, the simulated filaments extend to tens of kpc from the cluster center, with a representative mass of for a typical AGN outburst energy of . They show smooth velocity gradients, stretching typically from inner inflows to outer outflows with velocity dispersions of several hundred . The properties of cold filaments are affected substantially by jet properties. Compared to kinetic energy-dominated jets, thermal energy-dominated jets tend to produce longer cold filaments with higher masses. With the same jet energy, AGN jets with an earlier turn-on time, a lower jet base, or a higher power heat the cluster center more effectively, and produce shorter filaments at a much later epoch.
1 Introduction
Multi-wavelength observations show that the intracluster medium (ICM) in some galaxy clusters contains cold filaments with and emissions (Conselice et al. 2001; Fabian et al. 2003; Hatch et al. 2006; Salomé et al. 2006; Salomé et al. 2008; McDonald & Veilleux 2009; Hamer et al. 2016; Russell et al. 2019; Olivares et al. 2019; Tamhane et al. 2023; Oosterloo et al. 2023), but how these cold filaments arise in the ICM remains a puzzle. These filaments could extend to several tens kpc from the cluster center (Conselice et al. 2001; Salomé et al. 2006; McDonald & Veilleux 2009; Russell et al. 2019; Olivares et al. 2019; Calzadilla et al. 2022), with typical masses of (Salomé et al. 2008; Russell et al. 2019; Olivares et al. 2019), width (Conselice et al. 2001; Hatch et al. 2006; McDonald & Veilleux 2009; Fabian et al. 2016), and smooth velocity gradients (Hatch et al. 2006; McDonald & Veilleux 2009; Hamer et al. 2016; Russell et al. 2019; Olivares et al. 2019). Furthermore, observations show that these elongated filaments in some clusters lie between active galactic nucleus (AGN) bubbles and the cluster center (Fabian et al. 2003; Hatch et al. 2006; Salomé et al. 2006; Salomé et al. 2008; Russell et al. 2017). This phenomenon was also named the ’alignment effect’ in radio galaxies in some early studies (Chambers et al. 1987; McCarthy et al. 1987; Best et al. 1996; Saikia 2022). This leads to the idea that these filaments may be uplifted by AGN bubbles, which are inflated by AGN jets (Fabian et al. 2003; McDonald et al. 2010; McDonald et al. 2012; Churazov et al. 2013; McNamara et al. 2016; Russell et al. 2017; Calzadilla et al. 2022; Donahue & Voit 2022). Though AGN feedback is believed to be an important heating source to solve the cooling flow problem in the ICM (see McNamara & Nulsen 2007; Fabian 2012; McNamara & Nulsen 2012; Heckman & Best 2014; Donahue & Voit 2022; Bourne & Yang 2023 for reviews), the physical relation between AGN bubbles and cold filaments has not been firmly established, and should be investigated in combination with the complex gasdynamic processes of AGN feedback (Guo et al. 2018).
Theoretical analyses and numerical simulations show that AGN bubbles could drag the hot ICM away from the cluster center. Pope et al. (2010) proposes the Darwin drift model in fluid mechanics (Darwin 1953; Dabiri 2006) to explain the filaments behind buoyant AGN bubbles. Hydrodynamic simulations show extended hot wake flows behind AGN bubbles by evolving existing or instantaneously generated off-center low-density bubbles (Churazov et al. 2001; Saxton et al. 2001; Brüggen 2003; Reynolds et al. 2005; Roediger et al. 2007; Revaz et al. 2008; Brighenti et al. 2015; Zhang et al. 2022). In Revaz et al. (2008) and Brighenti et al. (2015), a fraction of the hot gas embedded in the wake flows cools down to K, forming cold filaments. These studies focus on the buoyant evolution of off-center AGN bubbles, without directly simulating the jet evolution. For more realistic cases, the formation of AGN bubbles during the jet evolution and the associated shock heating processes should also be simulated to study this mechanism, as shock heating may prevent the formation of cold filaments. Jet simulations of Duan & Guo (2018) show that hot wake flows (referred as trailing outflows therein) indeed form behind the jet-inflated bubbles, which is roughly consistent with the Darwin drift model predictions. While potentially explaining hot metal-rich outflows preferentially aligned with the large-scale axes of X-ray cavities in observations(Kirkpatrick et al. 2009; Simionescu et al. 2009; Kirkpatrick et al. 2011; Kirkpatrick & McNamara 2015), hot wake flows do not cool down to form cold filaments in Duan & Guo (2018).
The correlation between cold gas condensation and AGN feedback in the ICM has been investigated in many studies. Some authors find that local thermal instability could occur when the ICM is significantly disturbed by AGN outflows (Sharma et al. 2012; Gaspari et al. 2012; Li & Bryan 2014a; Li & Bryan 2014b; Beckmann et al. 2019), while others directly adopt multi-phase AGN outflows containing warm, ionized gas ejected at the cluster center (Qiu et al. 2020). In these studies, AGN feedback usually behaves as multiphase outflows, and the cold gas condensation is usually overly clumpy and widespread but not concentrated along the jet axis as thin filaments. Therefore, widespread overly clumpy gas condensation in these simulations may not be responsible for the formation of those cold filaments observed to lie between AGN bubbles and the cluster center (Fabian et al. 2003; Hatch et al. 2006; Salomé et al. 2006; Salomé et al. 2008; ; Olivares et al. 2019) and for the feature of very thin structures (Conselice et al. 2001; Hatch et al. 2006; McDonald & Veilleux 2009; Fabian et al. 2016).
In this work, we focus on the formation of radial cold filaments due to radiative cooling in hot wake flows uplifted by jet-inflated AGN bubbles, following our previous work on hot metal-rich outflows uplifted by AGN bubbles (Guo et al. 2018; Duan & Guo 2018). In Duan & Guo (2018), hot gas in wake flows does not cool down to form cold filaments, probably due to the relatively low spatial resolution (hundreds pc) adopted. Here we greatly increase spatial resolution with the adaptive mesh refinement (AMR) technique. To simulate AGN feedback, it is important to determine the set-up of jet injection and jet parameters in particular. While the matter and energy contents of AGN jets are still unclear observationally (Boehringer et al. 1993; Ineson et al. 2017; Croston et al. 2018; Fan et al. 2018; Abdulla et al. 2019; Blandford et al. 2019; Hardcastle & Croston 2020), simulations of AGN jet outbursts with different parameters show diversity in bubble morphology and heating processes (Guo 2015; Duan & Guo 2020; Guo 2020; Su et al. 2021; Weinberger et al. 2023; Huško & Lacey 2023a; Huško & Lacey 2023b). The kinetic energy dominated jet preferentially inflates radially-elongated bubbles far from the cluster center and deposits energy there, while the thermal energy dominated jet tends to inflate transverse-wide bubbles and deposit energy closer to the cluster center. Here we also investigate how the energy content of AGN jets affects the formation and properties of cold filaments.
The remainder of the paper is organized as follows. In Section 2, we analytically estimate the mass of wake flows uplifted by AGN bubbles in the ICM. In Section 3, we present a series of simulations with varying jet parameters to study the formation of cold filaments in hot wake flows uplifted by AGN bubbles in the ICM. Finally, in Section 4, we present a summary of our results with some brief discussions.
2 Analytical Estimations
In this section, we estimate the typical mass of hot wake flows uplifted by AGN bubbles via the Darwin drift model (Darwin 1953; Dabiri 2006), which serves as an upper limit of the mass of cold filaments forming in wake flows behind AGN bubbles. As an object moves through an ambient fluid, the Darwin drift refers to a net displacement of some fluid behind the object along its moving direction (Darwin 1953). Though bubbles inflated by AGN jets are not ideal spherical objects and the ambient ICM is not potential flow as considered in the original Darwin drift model (Darwin 1953), we will apply this model to derive a rough estimate of the wake mass and show that the result is well consistent with previous simulations (Duan & Guo 2018) and observations (Kirkpatrick & McNamara 2015).
In the Darwin drift model, the drift volume can be estimated as (Darwin 1953; Dabiri 2006):
| (1) |
where is the volume of the moving body (e.g., AGN bubble), and is a numerical constant with a value of for the case of a moving spherical solid object (Darwin 1953) or for the case of a moving vortex bubble (Dabiri 2006).
We may estimate the jet outburst energy from X-ray observations of galaxy clusters according to (Duan & Guo, 2020)
| (2) |
where and are the observed pressure and volume of AGN bubbles or X-ray cavities, respectively, and is the effective adiabatic index of the plasma in AGN bubbles. is the energy coupling efficiency, defined as the fraction of AGN jet energy transferred to the ICM, typically around for both powerful and weak jet outbursts, as shown in Duan & Guo (2020) with hydrodynamic jet simulations. For relativistic plasma, taking , the outburst energy can be estimated as for . If taking , for .
For a rough estimation, we assume that the wake flow (drift) behind an AGN bubble has a uniform density , pressure , and a total mass of . Equation (1) may be rewritten as
| (3) |
If we suppose the ratio of the pressure of the bubble to the wake flow is , combine equation (3) and equation (2), take , we have
| (4) |
where is the Boltzmann constant, is the proton mass, is the typical gas temperature in the wake flow, is the mean molecular weight per particle, and we take . Thus, we have
| (5) |
Here we have taken , , , , with a typical value of K in the cluster inner regions, and the energy of the AGN jet outburst with a typical value of erg. This estimation of the mass of the wake flow uplifted by an AGN bubble is consistent with X-ray observations of metal-rich outflows (Kirkpatrick & McNamara 2015) and our previous simulation (Duan & Guo 2018).
In Equation (5), we give an estimate of the mass of wake flows but not that of cold filaments. In our model, cold filaments form via radiative cooling in hot wake flows, and thus, a cold filament uplifted by an AGN bubble should have a mass lower than our estimated value here. We investigate this problem with hydrodynamic simulations in the following section.
3 Hydrodynamic Simulations
In this section, we present a suite of hydrodynamic simulations to explore the formation of cold filaments in wake flows uplifted by AGN bubbles in the ICM. We focus on a thermal energy-dominated jet run and a kinetic energy-dominated jet run, comparing the differences in filament formation processes. We further investigate the impact of other model parameters on our results in Section 3.5.
3.1 Numerical Setup
| Run | ||||
|---|---|---|---|---|
| Jfth9 | 0.9 | 250 | 50 | 5 |
| Jfth1 | 0.1 | — | — | — |
| Jtjeton200 | — | 200 | — | — |
| Jtjeton300 | — | 300 | — | — |
| Jtjet5 | — | — | 5 | — |
| Jzjet1 | — | — | — | 1 |
Note. — The relevant jet parameters in our simulations include the thermal energy fraction at the jet base , the jet turn-on time , the jet duration and the height of the jet base . The mark ’—’ means that the corresponding parameter has the same value as in the fiducial run Jfth9.
Assuming axisymmetry around the jet axis, we solve the basic hydrodynamic equations (see Guo et al. 2018) with radiative cooling and gravity in (R, z) cylindrical coordinates using the AMR code MPI-AMRVAC 2.0 (Xia et al. 2018). We choose the galaxy cluster A1795 as our model cluster, following Guo et al. (2018) to set up the static gravitational potential and the initial conditions. The ICM is initially in hydrostatic equilibrium in the gravitational potential well contributed by a dark matter halo, a central galaxy, and a supermassive black hole. The initial density and temperature distributions provide a good fit to X-ray observations of this cluster (Guo et al. 2018). We adopt the TVDLF scheme (Keppens et al. 2012) in combination with the second-order temporal discretization in this study, and a comparison of the results between the TVDLF and HLLC schemes is shown in Appendix A. We use reflective boundary conditions at the inner boundaries and outflow boundary conditions at the outer boundaries.
In our simulations, the radiative cooling rate is , where is the electron number density, is the ion number density, and the cooling function is adopted from Sutherland & Dopita (1993) with a fixed metallicity . We use the ‘exact’ cooling method (Townsend 2009) in MPI-AMRVAC 2.0 to calculate cooling processes, and adopt a lower temperature floor K.
The computational domain has a base grid with a resolution of 2 kpc from the origin to 800 kpc and is refined initially with a spatial resolution of 0.25 kpc from the origin to 200 kpc, 0.5 kpc from 200 kpc to 300 kpc, 1 kpc from 300 kpc to 400 kpc, and 2 kpc from 400 kpc to 800 kpc. With the base grid marked as level 1 in MPI-AMRVAC, we use up to six refinement levels, and the finest resolution is 62.5 pc. The mass of cold gas condensation converges as we increase the refinement level to six. Following Li & Bryan (2012) and Qiu et al. (2019) with modifications, an additional grid refinement is triggered to divide a cell into two equal parts when both of the following criteria are satisfied:
(i) The density criterion: the density in this cell meets , where is the current refinement level, and we choose .
(ii) The cooling time criterion: the cooling time scale in this cell meets . Here, is the cooling time, where is the thermal energy density in the cell and is the local cooling rate, and is the local sound crossing time, where is the local sound speed and is the grid size. We choose the factor as the mass of cold gas condensation converges when we increase to this value.
In all our simulations, the ICM first evolves under gravity and radiative cooling. In the pure cooling run without AGN feedback, a cooling catastrophe develops in the ICM at the cluster center at Myr. In our AGN simulations, we turn on AGN jets at for a duration of . During the AGN phase , a constant jet is injected along the direction by adding mass, momentum, and energy into a cylinder with a cross-section radius of kpc and a spatial interval of along the direction. The injected jet corresponds to a uniform jet with a fixed velocity , where is the speed of light. The total energy of one jet injected into our simulated domain is with a thermal fraction of , where is the thermal energy injected by the jet. We choose and in our two fiducial runs Jfth9 and Jfth1, respectively, to represent the thermal energy-dominant jet and the kinetic energy-dominant jet. In runs Jfth9 and Jfth1, the jet turn-on time is set to be Myr, just about 10 Myr earlier than the time of cooling catastrophe in our pure cooling run. The jet duration is set to be Myr, which roughly equals to the sound crossing timescale within kpc in the cluster center and represents the typical mild AGN outbursts as studied in Duan & Guo (2020). The position of the jet base is set as kpc. The adopted values of the jet parameters in our various AGN runs are shown in Table 1.
3.2 Morphology of AGN Bubbles and Cold Filaments
Figure 1 shows the evolution of the gas temperature distribution (top panels) and velocity streamlines (bottom panels; overlapping with the gas density distribution) in run Jfth9 with a thermal energy-dominated jet (). The jet outburst produces an obvious bow shock, which sweeps the ambient ICM gas outward and heats the gas (Guo et al. 2018; Duan & Guo 2020). In run Jfth9, the jet inflates a large bubble at tens of kpc away from the cluster center. The relatively dense gas at the cluster center is then uplifted in the form of a laminar wake flow behind the AGN bubble, as studied in detail in Duan & Guo (2018). On a larger scale, the wake flow mainly forms within the gas circulations triggered by the anabatic jet-inflated AGN bubbles, as clearly shown in the velocity streamline plots (also see Guo et al. 2018 and Duan & Guo 2018). At , part of the gas in the wake flow cools down to K, forming short filamentary structures, which then grow to form a long cold filament at about . At an earlier time , cold gas has not appeared in the wake flow, but the lower part of the wake flow near the cluster center has already begun to fall down towards the cluster center. Thus, we conclude that the cold gas forms by condensation in the hot dense wake flow uplifted by the bubble. As the bubble moves further away from the cluster center, the cold gas together with a large part of the wake flow continues to fall down to the center (see Myr in Figure 1). We adopt a lower temperature floor of K in our simulations, and in reality the gas in cold filaments might cool down to a temperature much lower than K.
In run Jfth1 with , the kinetic energy-dominated jet cannot inflate a transverse-wide bubble near the cluster center, as shown in Figure 2. Actually, this kind of mild kinetic energy-dominant jets can only inflate young bubbles elongated along the jet direction (Perucho et al. 2019; Duan & Guo 2020; Guo 2020; Huško & Lacey 2023b), and then evolves into transverse-wide bubbles at a very late stage and far away from the cluster center (Huško & Lacey 2023b), which may be responsible for giant radio sources (Dabhade et al. 2023). Consequently, the jet in run Jfth1 cannot sustain strong gaseous circulations at the cluster center for a relatively long time, and finally produces a much shorter cold filament than in run Jfth9. Furthermore, unlike in run Jfth9, the cold gas in run Jfth1 appears first near the cluster center, which may be due to the fact that the kinetic energy dominant jet heats the gas at the cluster center less efficiently than the thermal energy dominant jet in run Jfth9 (Duan & Guo 2020), as further shown in Section 3.3.
3.3 Evolution of cold filaments: mass, distribution and velocity
We investigate the properties of cold filaments in this subsection. In our analysis, we define cold gas with the gas temperature satisfying K. Our results are robust to the specific choice of . As the gas cooling curve peaks at K (Schure et al. 2009), the gas at around this temperature cools down to K rapidly, and the amount of gas in the temperature interval - K is rare (see Appendix B). Figure 3 shows the evolution of cold gas properties in runs Jfth9 and Jfth1, including the mass, typical velocity, and spatial distribution of cold filaments.
In the pure cooling simulation, the cooling catastrophe in the ICM occurs at Myr when cold gas starts to accumulate in the cluster center. The cold mass accumulation is shown clearly in the top left panel of Figure 3 (black dashed line). The mass of cold gas in this run increases rapidly after Myr and reaches about at Myr. We note that there are several minor dips on the cold gas mass curve due to numerical issues related to the choice of and numerical scheme, which are unimportant for the current study, as further investigated in Appendix A.
The mass and vertical extension of the cold filaments are shown in the left panels of Figure 3. In run Jfth9 (red lines and dots), the cooling flow is reversed (also see Guo et al. 2018), and the cooling catastrophe is delayed from Myr in the pure cooling run to Myr in run Jfth9 (red dashed line in the top left panel). During Myr, a cold filament forms in the wake flow below the AGN bubble (see Figure 1). As shown in the top-left panel of Figure 3, the main part of the cold filament (defined as the cold gas located at ) has a typical mass of about (red solid line) during most of its lifetime. The value of this mass is insensitive to the choice of the temperature criterion for cold gas, and a 10-times-lower value of K results in a very close mass of the cold filament (red dotted line). The length of the cold filament, defined as the maximum distance of the cold gas from the cluster center, reaches kpc at as shown in the bottom-left panel (red dots).
In run Jfth1 (blue lines and dots), the kinetic-energy-dominated jet penetrates away from the cluster center quickly, resulting in a much less efficient heating on the gas in the cluster central region. Thus, as shown in the top-left panel of Figure 3, the AGN outburst in run Jfth1 does not delay the cooling catastrophe substantially. As discussed in subsection 3.2, a cold filament still forms in this run during Myr, but with a much lower maximum length of kpc (at Myr) than in run Jfth9. The cold filament also has a lower typical mass of several . As shown in the left panels of Figure 3, there is a second short filament in both runs Jfth9 and Jfth1. This feature is not the focus of the current study, and in Appendix B, we show that it is mainly caused by gas motions after the wake flow falls back down to the cluster center at later times.
To investigate the typical width of the simulated cold filaments, we show in the the bottom right panel of Figure 3 the temporal evolution of the maximum transverse width of the cold filaments located within the spatial intervals of kpc kpc and kpc kpc for runs Jfth9 and Jfth1, respectively. The typical width of the simulated cold filaments is about pc, especially for the long filament in run Jfth9 (red dots). This result is consistent with some previous observations of cold filaments with typical widths lower than 1 kpc (Conselice et al. 2001; Hatch et al. 2006; McDonald & Veilleux 2009; Fabian et al. 2016). There may exist a mixing layer between a cold filament and its surrounding hot gas, where subtle physics such as gas mixing, thermal conduction, and magnetic fields may interplay with the gas cooling process (Gronke & Oh 2020; Nelson et al. 2020; Faucher-Giguere & Oh 2023), potentially affecting the width of the cold filament. We leave these detailed microscopic processes for future studies.
To investigate typical gas velocities in the cold filaments, we find the maximum and minimum -component velocities of the cold gas located at kpc, denoted as and , respectively. As shown in the top right panel of Figure 3, usually refers to the maximum infall velocity in the cold filaments, while refers to the minimum infall velocity or the maximum outflow velocity if some cold gas is outflowing. The maximum infall velocity in our simulated cold filaments is typically a few hundred km/s. At early times, some cold gas may be outflowing, while at later times all the cold gas falls towards the cluster center. The dotted lines in the top right panel of Figure 3 show the temporal evolution of the maximum vertical velocity at kpc in runs Jfth1 and Jfth9. In both runs, the maximum vertical velocity of the cold gas in the inner 1 kpc remains zero at early times, indicating that the cold gas appearing at high altitudes does not originate from uplifting the cold gas at the cluster center, but actually forms at kpc by cooling out directly from the uplifted dense hot wake flow.
3.4 Velocity structure in cold filaments
In this subsection, we investigate the velocity structure, i.e., the vertical distribution of the z-component velocity () of the cold gas at , in the cold filaments in our simulations. In Figure 4, we show the plots of runs Jfth9 and Jfth1 at Myr and Myr, respectively. Each triangle in both panels represents a computational cell containing cold gas at kpc at the corresponding time. Clearly, both cold gas outflows and inflows appear in the filaments at these two representative times (also see the plot in Figure 3). In particular, outflows and inflows coexist at the far-side of the filaments from the cluster center, and the inflow velocity then gradually increases towards the cluster center. Such a stretching structure with relatively smooth velocity gradients is consistent with previous observations of some cold filaments (Hatch et al. 2006; McDonald & Veilleux 2009; Hamer et al. 2016; Russell et al. 2019). Our simulations further predict that the typical velocity dispersions in cold filaments are several hundred .
3.5 Dependence on additional jet parameters
In addition to the jet’s energy content (thermal versus kinetic energies) discussed above, the properties of cold filaments may also be affected by other jet parameters. Here we adopt run Jfth9 as our fiducial run and investigate the impact of additional jet parameters by varying only one additional jet parameter in each comparison run. The parameters of these comparison runs are shown in Table 1 and the main results are shown in Figure 5, as described in detail below.
First, we study the impact of the jet turn-on time, . In run Jfth9, the jet is turned on at 250 Myr, slightly before the starting time of the central cooling catastrophe ( Myr) in the pure cooling run. Here we consider two additional cases: (i) In run Jtjeton200 with Myr (green lines in Figure 5), the cooling catastrophe is delayed to Myr, much later than the delayed starting time of the cooling catastrophe ( Myr) in run Jfth9. Before turning on the AGN jet outburst, the ICM gas in the cluster center continues to acquire higher densities and lower entropy due to radiative cooling. Thus, the gas in the cluster center at Myr has much lower densities and higher entropy than at Myr in run Jfth9, and consequently after the same AGN outburst, the central lower-density higher-entropy gas in run Jtjeton200 has a much larger cooling time than in run Jfth9. The same argument also explains the significantly-delayed formation time ( Myr) of a much shorter lower-mass () cold filament in run Jtjeton200 than in our fiducial run. (ii) In run Jtjeton300 with 300 Myr (purple lines in Figure 5), the AGN jet ourburst turned on 40 Myr after the onset of the cooling catastrophe significantly impedes the continuous condensation of cold gas, but can not destroy the cold gas core in the cluster center. Obviously it is hard for our jet outburst initiated at kpc to destroy the dense core with a mass within 1 kpc from the cluster center. Compared with run Jfth9, the cold filament in run Jtjeton300 with a later jet turn-on time has a comparable mass and maximum length but a longer lifetime.
Second, we study the impact of the location of the jet base . To sufficiently resolve the cross section of AGN jets, galaxy-scale simulations (Omma et al. 2004; Vernaleo & Reynolds 2006; Gaspari et al. 2012; Weinberger et al. 2018) often initiate AGN jets at the jet base with a jet radius of order 1 kpc, much larger than in observations (e.g., Blandford et al. 2019). To avoid overheating the cluster center by the wide jet, we place the jet base at = 5 kpc in our fiducial run (run Jfth9). To investigate the impact of on our results, here we change the jet base to = 1 kpc in run Jzjet1, much closer to the cluster center than in our fiducial setup. As shown in Figure 5 (orange lines), it is clear that this = 1 kpc jet delays the onset of the cooling catastrophe to Myr, much later than in the fiducial run (Jfth9), confirming that the gas in the cluster center is heated much more effectively with the lower jet base ( = 1 kpc). Similar to run Jtjeton200 discussed above, run Jzjet1 with a lower jet base produces a much shorter cold filament (about 10 kpc) at much later times than our fiducial run. Our result indicates that the location of the jet base significantly affects gas heating and subsequent condensation in the cluster center and we suggest that it should be treated carefully in simulations of galaxy evolution with AGN jet feedback.
Finally, we study the impact of the jet power in run Jtjet5. The same amount of jet energy as in run Jfth9 is injected for a duration of 5 Myr in a comparison run Jtjet5, so the jet has a power ten times stronger. As shown previously in Guo et al. (2018) and Duan & Guo (2020), this kind of powerful thermal energy-dominated jet can heat the cluster center very efficiently and suppress cooling flows very effectively. As shown in Figure 5 (blue lines), this powerful jet delays the onset of the cooling catastrophe to Myr, much later than in the fiducial run (Jfth9). Similar to runs Jtjeton200 and Jzjet1 discussed above, this powerful jet produces a much shorter cold filament at later times than in our fiducial run Jfth9.
Through these results, one can see the properties of cold filaments, especially the filament length, indeed vary in runs with different jet parameters. Long filaments could be produced when the jets are triggered near or after the onset of the central cooling catastrophe and have proper injection powers, thermal fractions, and jet bases. Although AGN jet feedback causes the formation of linear wake flows and gas condensation in cold filaments, it generally has a negative-feedback effect on the ICM by heating it and delaying the onset of the central cooling catastrophe. With the same amount of jet energy, if the cluster center is overheated due to a low jet base, a short jet duration, or an early jet turn-on time, gas condensation in the wake flow would occur at a late stage and the formed cold filament would be relatively short (as demonstrated in runs Jtjeton200, Jzjet1, and Jtjet5).
4 Summary and Brief Discussion
We present a systematic study on the formation of cold filaments in the wake flows uplifted by jet-inflated AGN bubbles in the ICM. To get physical intuition, we first estimate the typical mass of wake flows in Section 2, and the result is consistent with our previous simulations (Duan & Guo 2018) and X-ray observations of metal-rich outflows in galaxy clusters (Kirkpatrick & McNamara 2015). Using hydrodynamic simulations with high spatial resolution achieved by the AMR technique, here we confirm that cold filaments could indeed form by condensation in hot wake flows behind AGN jet-inflated bubbles. In our analysis, we focus on the formation of the jet-inflated bubbles and cold filaments in the ICM produced by AGN jets with different thermal fractions and also investigate the impact of other jet parameters, such as the jet turn-on time, the position of jet base, and the jet power. The main results are summarized as follows:
(i) Cold thin filaments could naturally form by condensation in the hot dense wake flows uplifted by jet-inflated AGN bubbles. The simulated cold filaments extend to tens of kpc from the cluster center, having a typical width of about 500 pc and a typical mass of , which is consistent with the results of previous buoyant-bubble simulations (Revaz et al. 2008) and multi-wavelength observations (Conselice et al. 2001; Hatch et al. 2006; Salomé et al. 2008; McDonald & Veilleux 2009; Olivares et al. 2019; Russell et al. 2019).
(ii) The cold filaments in our AGN jet simulations have similar kinetic properties as in observations (Hatch et al. 2006; McDonald & Veilleux 2009; Hamer et al. 2016; Russell et al. 2019) and previous simulations of buoyant bubbles (Revaz et al. 2008; Brighenti et al. 2015). The velocity fields in cold filaments show relatively smooth velocity gradients as in stretching structures. At a representative epoch, the outer part of the filaments contains both inflows and outflows, while the inner part is mainly inflowing towards the cluster center. The typical velocity dispersion in the filament is several hundred .
(iii) The properties of cold filaments formed in AGN wake flows depend on the energy content (thermal fraction) of AGN jets. Compared to kinetic energy-dominated jets, thermal energy-dominated jets tend to produce longer cold filaments with higher masses as they inflate wider low-density bubbles, which stay in the cluster inner regions for a longer duration and induce stronger gas circulations and wake flows.
(iv) The properties of cold filaments, especially the filament length, are also affected by other jet parameters. With the same amount of injected energy, AGN jets with an earlier turn-on time, a lower jet base, or a higher power heat the cluster center more effectively, resulting in a longer delay of the central cooling catastrophe and longer cooling times for uplifted wake flows. The cold filaments are thus formed at a much later epoch with shorter lengths (see Figure 5).
We note that our results, especially the lifetime and morphology of cold filaments, may be affected quantitatively by some subtle physical processes such as thermal conduction, turbulent mixing, magnetic fields, cosmic rays (Gronke & Oh 2020, Nelson et al. 2020, Faucher-Giguere & Oh 2023), the uncertainty in the gas cooling function (Schure et al. 2009), and even numerical methods (Martizzi et al. 2019; Weinberger et al. 2023). Nonetheless, we expect that the main results of our simulations are robust, such as the general formation processes of cold filaments by condensation in hot dense wake flows of AGN bubbles and the impact of various jet parameters. We further suggest that these jet parameters (e.g., the height of the jet base) should be treated carefully in simulations of galaxies and galaxy clusters containing AGN jet feedback, as they affect both the effectiveness of central gas heating and gas condensation in AGN wake flows.
Appendix A Gas Cooling with Different Resolutions and Numerical Schemes
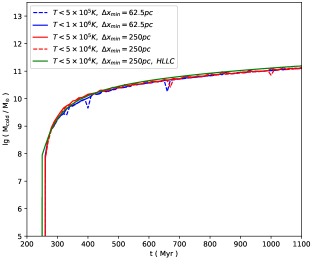
Several minor dips appear on the total cold gas mass curves in Figures 3 and 5. We show here that this feature is related to the numerical scheme, spatial resolution and our cold gas criterion, which have rather minor impact on the overall evolution of AGN bubbles and cold filaments. In Figure A1, we present a comparison of cold gas condensation in pure cooling runs using different cold gas temperature criterion (), spatial resolutions and numerical schemes. The blue dashed line repeats the black dashed line in the top left panel of Figure 3 having several minor dips. These dips disappear when we increase from K to K (blue solid line), or change the finest resolution from to (red solid line). However, if we lower to K in the low resolution run, several dips appear again (red dashed line). Furthermore, the dips also disappear if the numerical scheme is changed from TVDLF to HLLC (green line). We suggest that the appearance of these minor dips is a manifestation of numerical diffusion when cold gas moves through the hot ICM (LeVeque 1998; LeVeque 2002). Compared to HLLC, the dips are easier to appear in the more diffusive TVDLF scheme (Keppens et al. 2012). Nonetheless, except for the minor dips which appear only several times on some lines, all the curves are quite close to each other.
To further show the impact of the numerical scheme, we show the morphology of AGN bubbles and cold filaments in the HLLC run in Figure A2. Compared to the TVDLF scheme (run Jfth9 in Figure 1), the formed AGN bubble in the HLLC run has more small turbulent structures due to Kelvin-Helmholz instability, which is smoothed in the more diffusive TVDLF run similar to the effect of viscosity (LeVeque 1998; Reynolds et al. 2005; Duan & Guo 2018). The formed cold filament in the HLLC run is also slightly longer than that in the TVDLF run (run Jfth9; see Figures 1 and 3). However, the HLLC scheme is too time-consuming for us to conduct these high-resolution cluster-sized AMR simulations with high-velocity flows (jets) and radiative cooling. Instead of investigating the impact of numerical methods in jet feedback simulations (see, e.g., Martizzi et al. 2019; Weinberger et al. 2023), here we choose the TVDLF scheme, which allows us to perform long-duration simulations to investigate the entire formation history of cold filaments and compare the results in various runs with different jet parameters.
Appendix B Temperature-Density Phase Plot and Formation of the Second Short Filament
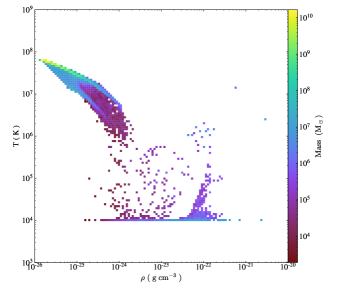
In Figure B1, we present the temperature-density phase diagram in run Jfth9 at t = 500 Myr, when the cold filament reaches the highest mass. One can clearly see that the amount of the gas located in the temperature range between K to K is very small, which is due to rapid gas cooling within this temperature range. Thus, our adopted cold gas temperature criterion of K is reasonable.
In Figure B2, we show the short filaments near the cluster center in run Jfth9 and run Jfth1 at very late times and Myr, respectively, corresponding to the second bumps of the mass and length () of cold filaments shown in Figure 3. From the streamline plots, one can see that this phenomenon is caused by gas motions near the cluster center, long after the major part of the wake flow falls down to the cluster center. This phenomenon also occurs in other runs (see Figure 5) and in our previous study (Duan & Guo 2018; see Figures 4 and 5 therein), and is not the focus of the current study.
References
- Abdulla et al. (2019) Abdulla, Z., Carlstrom, J. E., Mantz, A. B., et al. 2019, ApJ, 871, 195
- Beckmann et al. (2019) Beckmann, R. S., Dubois, Y., Guillard, P., et al. 2019, A&A, 631, A60
- Best et al. (1996) Best, P. N., Longair, M. S., & Rottgering, H. J. A. 1996, MNRAS, 280, L9
- Blandford et al. (2019) Blandford, R., Meier, D., & Readhead, A. 2019, ARA&A, 57, 467
- Boehringer et al. (1993) Boehringer, H., Voges, W., Fabian, A. C., Edge, A. C., & Neumann, D. M. 1993, MNRAS, 264, L25
- Bourne & Yang (2023) Bourne, M. A., & Yang, H.-Y. K. 2023, Galaxies, 11, 73
- Brighenti et al. (2015) Brighenti, F., Mathews, W. G., & Temi, P. 2015, ApJ, 802, 118
- Brüggen (2003) Brüggen, M. 2003, ApJ, 592, 839
- Calzadilla et al. (2022) Calzadilla, M. S., McDonald, M., Donahue, M., et al. 2022, ApJ, 940, 140
- Chambers et al. (1987) Chambers, K. C., Miley, G. K., & van Breugel, W. 1987, Nature, 329, 604
- Churazov et al. (2001) Churazov, E., Brüggen, M., Kaiser, C. R., Böhringer, H., & Forman, W. 2001, ApJ, 554, 261
- Churazov et al. (2013) Churazov, E., Ruszkowski, M., & Schekochihin, A. 2013, MNRAS, 436, 526
- Conselice et al. (2001) Conselice, C. J., Gallagher, John S., I., & Wyse, R. F. G. 2001, AJ, 122, 2281
- Croston et al. (2018) Croston, J. H., Ineson, J., & Hardcastle, M. J. 2018, MNRAS, 476, 1614
- Dabhade et al. (2023) Dabhade, P., Saikia, D. J., & Mahato, M. 2023, Journal of Astrophysics and Astronomy, 44, 13
- Dabiri (2006) Dabiri, J. O. 2006, Journal of Fluid Mechanics, 547, 105
- Darwin (1953) Darwin, C. 1953, Proceedings of the Cambridge Philosophical Society, 49, 342
- Donahue & Voit (2022) Donahue, M., & Voit, G. M. 2022, Phys. Rep., 973, 1
- Duan & Guo (2018) Duan, X., & Guo, F. 2018, ApJ, 861, 106
- Duan & Guo (2020) —. 2020, ApJ, 896, 114
- Fabian (2012) Fabian, A. C. 2012, ARA&A, 50, 455
- Fabian et al. (2003) Fabian, A. C., Sanders, J. S., Crawford, C. S., et al. 2003, MNRAS, 344, L48
- Fabian et al. (2016) Fabian, A. C., Walker, S. A., Russell, H. R., et al. 2016, MNRAS, 461, 922
- Fan et al. (2018) Fan, X.-L., Wu, Q., & Liao, N.-H. 2018, ApJ, 861, 97
- Faucher-Giguere & Oh (2023) Faucher-Giguere, C.-A., & Oh, S. P. 2023, arXiv e-prints, arXiv:2301.10253
- Gaspari et al. (2012) Gaspari, M., Ruszkowski, M., & Sharma, P. 2012, ApJ, 746, 94
- Gronke & Oh (2020) Gronke, M., & Oh, S. P. 2020, MNRAS, 492, 1970
- Guo (2015) Guo, F. 2015, ApJ, 803, 48
- Guo (2020) —. 2020, ApJ, 903, 3
- Guo et al. (2018) Guo, F., Duan, X., & Yuan, Y.-F. 2018, MNRAS, 473, 1332
- Hamer et al. (2016) Hamer, S. L., Edge, A. C., Swinbank, A. M., et al. 2016, MNRAS, 460, 1758
- Hardcastle & Croston (2020) Hardcastle, M. J., & Croston, J. H. 2020, New A Rev., 88, 101539
- Hatch et al. (2006) Hatch, N. A., Crawford, C. S., Johnstone, R. M., & Fabian, A. C. 2006, MNRAS, 367, 433
- Heckman & Best (2014) Heckman, T. M., & Best, P. N. 2014, ARA&A, 52, 589
- Huško & Lacey (2023a) Huško, F., & Lacey, C. G. 2023a, MNRAS, 520, 5090
- Huško & Lacey (2023b) —. 2023b, MNRAS, 521, 4375
- Ineson et al. (2017) Ineson, J., Croston, J. H., Hardcastle, M. J., & Mingo, B. 2017, MNRAS, 467, 1586
- Keppens et al. (2012) Keppens, R., Meliani, Z., van Marle, A. J., et al. 2012, Journal of Computational Physics, 231, 718
- Kirkpatrick et al. (2009) Kirkpatrick, C. C., Gitti, M., Cavagnolo, K. W., et al. 2009, ApJ, 707, L69
- Kirkpatrick & McNamara (2015) Kirkpatrick, C. C., & McNamara, B. R. 2015, MNRAS, 452, 4361
- Kirkpatrick et al. (2011) Kirkpatrick, C. C., McNamara, B. R., & Cavagnolo, K. W. 2011, ApJ, 731, L23
- LeVeque (1998) LeVeque, R. J. 1998, Nonlinear Conservation Laws and Finite Volume Methods, ed. O. Steiner & A. Gautschy (Berlin, Heidelberg: Springer Berlin Heidelberg), 1–159
- LeVeque (2002) —. 2002, Finite Volume Methods for Hyperbolic Problems, Cambridge Texts in Applied Mathematics (Cambridge University Press)
- Li & Bryan (2012) Li, Y., & Bryan, G. L. 2012, ApJ, 747, 26
- Li & Bryan (2014a) —. 2014a, ApJ, 789, 54
- Li & Bryan (2014b) —. 2014b, ApJ, 789, 153
- Martizzi et al. (2019) Martizzi, D., Quataert, E., Faucher-Giguère, C.-A., & Fielding, D. 2019, MNRAS, 483, 2465
- McCarthy et al. (1987) McCarthy, P. J., van Breugel, W., Spinrad, H., & Djorgovski, S. 1987, ApJ, 321, L29
- McDonald & Veilleux (2009) McDonald, M., & Veilleux, S. 2009, ApJ, 703, L172
- McDonald et al. (2012) McDonald, M., Veilleux, S., & Rupke, D. S. N. 2012, ApJ, 746, 153
- McDonald et al. (2010) McDonald, M., Veilleux, S., Rupke, D. S. N., & Mushotzky, R. 2010, ApJ, 721, 1262
- McNamara & Nulsen (2007) McNamara, B. R., & Nulsen, P. E. J. 2007, ARA&A, 45, 117
- McNamara & Nulsen (2012) —. 2012, New Journal of Physics, 14, 055023
- McNamara et al. (2016) McNamara, B. R., Russell, H. R., Nulsen, P. E. J., et al. 2016, ApJ, 830, 79
- Nelson et al. (2020) Nelson, D., Sharma, P., Pillepich, A., et al. 2020, MNRAS, 498, 2391
- Olivares et al. (2019) Olivares, V., Salome, P., Combes, F., et al. 2019, A&A, 631, A22
- Omma et al. (2004) Omma, H., Binney, J., Bryan, G., & Slyz, A. 2004, MNRAS, 348, 1105
- Oosterloo et al. (2023) Oosterloo, T., Morganti, R., & Murthy, S. 2023, arXiv e-prints, arXiv:2312.00917
- Perucho et al. (2019) Perucho, M., Martí, J.-M., & Quilis, V. 2019, MNRAS, 482, 3718
- Pope et al. (2010) Pope, E. C. D., Babul, A., Pavlovski, G., Bower, R. G., & Dotter, A. 2010, MNRAS, 406, 2023
- Qiu et al. (2020) Qiu, Y., Bogdanović, T., Li, Y., McDonald, M., & McNamara, B. R. 2020, Nature Astronomy, 4, 900
- Qiu et al. (2019) Qiu, Y., Bogdanović, T., Li, Y., Park, K., & Wise, J. H. 2019, ApJ, 877, 47
- Revaz et al. (2008) Revaz, Y., Combes, F., & Salomé, P. 2008, A&A, 477, L33
- Reynolds et al. (2005) Reynolds, C. S., McKernan, B., Fabian, A. C., Stone, J. M., & Vernaleo, J. C. 2005, MNRAS, 357, 242
- Roediger et al. (2007) Roediger, E., Brüggen, M., Rebusco, P., Böhringer, H., & Churazov, E. 2007, MNRAS, 375, 15
- Russell et al. (2017) Russell, H. R., McNamara, B. R., Fabian, A. C., et al. 2017, MNRAS, 472, 4024
- Russell et al. (2019) —. 2019, MNRAS, 490, 3025
- Saikia (2022) Saikia, D. J. 2022, Journal of Astrophysics and Astronomy, 43, 97
- Salomé et al. (2008) Salomé, P., Revaz, Y., Combes, F., et al. 2008, A&A, 483, 793
- Salomé et al. (2006) Salomé, P., Combes, F., Edge, A. C., et al. 2006, A&A, 454, 437
- Saxton et al. (2001) Saxton, C. J., Sutherland, R. S., & Bicknell, G. V. 2001, ApJ, 563, 103
- Schure et al. (2009) Schure, K. M., Kosenko, D., Kaastra, J. S., Keppens, R., & Vink, J. 2009, A&A, 508, 751
- Sharma et al. (2012) Sharma, P., McCourt, M., Quataert, E., & Parrish, I. J. 2012, MNRAS, 420, 3174
- Simionescu et al. (2009) Simionescu, A., Werner, N., Böhringer, H., et al. 2009, A&A, 493, 409
- Su et al. (2021) Su, K.-Y., Hopkins, P. F., Bryan, G. L., et al. 2021, MNRAS, 507, 175
- Sutherland & Dopita (1993) Sutherland, R. S., & Dopita, M. A. 1993, ApJS, 88, 253
- Tamhane et al. (2023) Tamhane, P. D., McNamara, B. R., Russell, H. R., et al. 2023, MNRAS, 519, 3338
- Townsend (2009) Townsend, R. H. D. 2009, ApJS, 181, 391
- Vernaleo & Reynolds (2006) Vernaleo, J. C., & Reynolds, C. S. 2006, ApJ, 645, 83
- Weinberger et al. (2018) Weinberger, R., Springel, V., Pakmor, R., et al. 2018, MNRAS, 479, 4056
- Weinberger et al. (2023) Weinberger, R., Su, K.-Y., Ehlert, K., et al. 2023, MNRAS, 523, 1104
- Xia et al. (2018) Xia, C., Teunissen, J., El Mellah, I., Chané, E., & Keppens, R. 2018, ApJS, 234, 30
- Zhang et al. (2022) Zhang, C., Zhuravleva, I., Gendron-Marsolais, M.-L., et al. 2022, MNRAS, 517, 616