Novel Dipole-Lattice coupling in the Quantum-Spin-Liquid Material -(BEDT-TTF)2Cu2(CN)3
Abstract
A family of molecular Mott insulators on triangular lattice provided a few S=1/2 triangular quantum spin liquid candidates, with -(BEDT-TTF)2Cu2(CN)3 being the most studied material of this group. The large number experimental works present a conflicting set of evidence, with some suggesting spin liquid behavior, while others point towards a valence bond solid with orphan spins. In this work we use Raman scattering spectroscopy to probe both local charge on molecular sites and lattice phonons as a function of temperature down to 6 K. Based on the analysis of the line shape of the BEDT-TTF charge sensitive vibration on cooling below 40 K, we suggest a development of disordered fluctuating charge disproportionation on (BEDT-TTF)2 dimers of amplitude as small as 0.06. The lattice phonons show strong anomalous broadening on cooling only in the (c,c) scattering channel, associated with the developing charge disproportionation. We suggest an interpretation, where the coupling of disordered charge dipoles on dimers to the lattice results in anisotropic modulation of charge transfer integrals between dimer lattice sites. Such fluctuations would result in modulation of magnetic coupling between spins which can produce fluctuating charge ordered spin-singlet pairs.
I Introduction
In strongly correlated systems, exotic physics and critical behavior emerge at the junction of geometric frustration and competing interactions. One example is the quantum spin liquid (QSL), where emergent fractional spin excitations arise from the infinitely-degenerate collective electronic quantum state. Ever since Anderson suggested a Resonating Valence Bond (RVB) ground state Anderson (1973), Mott insulators with spins on a triangular lattice with nearest-neighbor anitferromagnetic interactions have been studied in hopes of realizing the QSL. However, further studies have shown that realizing the QSL requires interactions beyond nearest neighbors Huse and Elser (1988); Misguich et al. (1999); Zhu and White (2015). Molecular spin liquid candidates, one of which we discuss in the present work, were suggested as providing an alternative way for competing interactions, involving charge degree of freedom in addition to magnetic one Hotta (2010). The discussion if these degrees of freedom would compete or interact, resulting in a new type of spin liquid is still ongoing.
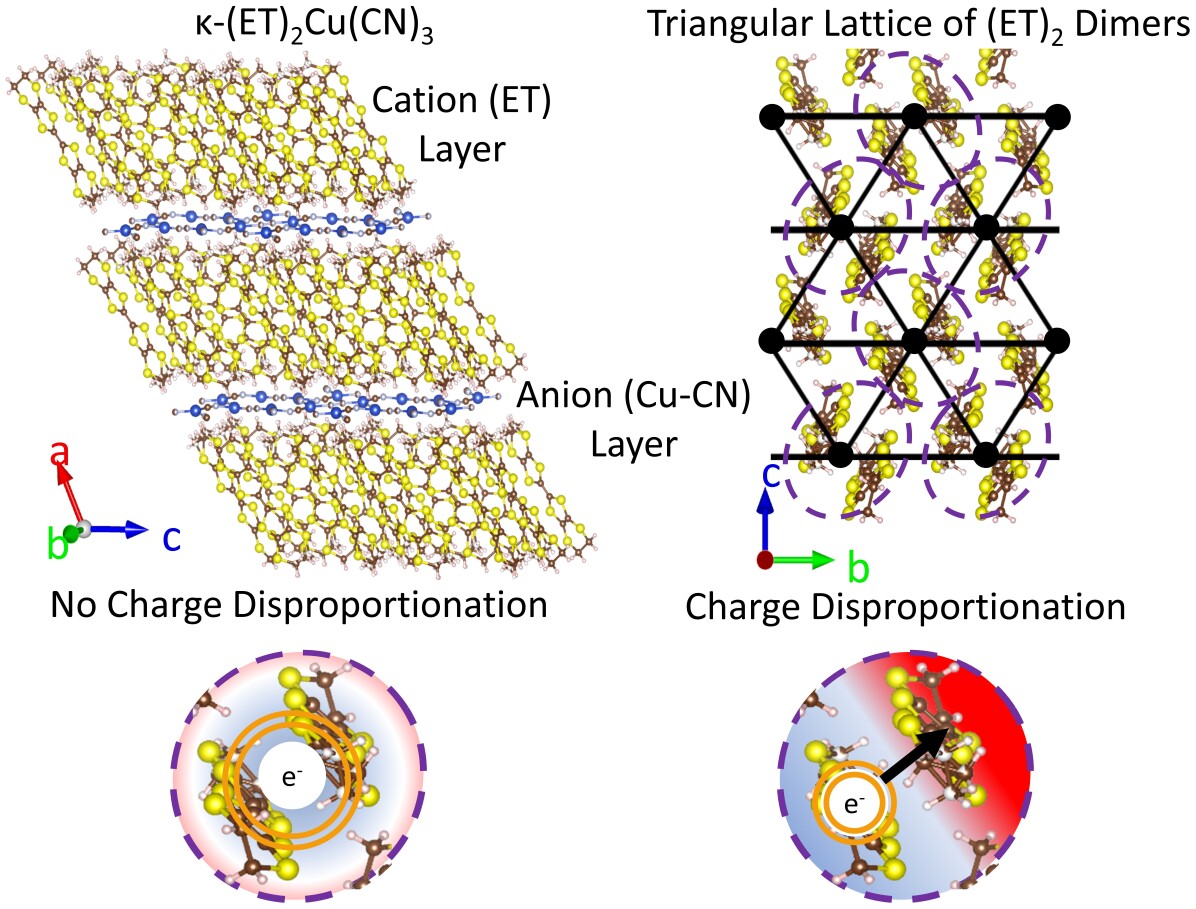
Molecular Mott insulators with so-called -phase structure can realize QSL candidates on a triangular lattice. In these layered molecular materials the lattice of the functional layer is formed by pairs of ET molecules 111ET refers to bis(ethylenedithio)tetrathiafuvalene that share one hole (+1). These dimer ET spin units form a crystal layer, where overlapping -orbitals of ET molecules result in electronic bands. The large ratio of the electronic overlap between the dimers to on-site electron repulsion results in a a Mott insulator state for some of these materials, with anitferrmagnetic interaction between S=1/2. Two possible scenarios are proposed for these materials to realize QSL state, one is a ring exchange preventing 120 degree order Misguich et al. (1999); Holt et al. (2014). Another is an exotic “quantum dipole liquid” Hotta (2010), where spins are coupled to the fluctuating electric dipoles formed on molecular (ET)2 as a result of electronic correlations (see Fig. 1 for the illustration of the charge degree of freedom). The quantum dipole liquid, first suggested in connection with the non-trivial dielectric behavior of -(ET)2Cu2(CN)3 Abdel-Jawad et al. (2010); Pinterić et al. (2014); Yakushi et al. (2015), was observed in another molecular Mott insulator Hassan et al. (2018a).
-(ET)2Cu2(CN)3 (-Cu-CN) is the most thoroughly studied of these materials. Spins in the magnetic lattice of -Cu-CN experience antiferromagnetic (AF) interactions on the order of 200 K Shimizu et al. (2003). The QSL ground state of this material was suggested based on the lack of magnetic ordering observed down to 32 mK Shimizu et al. (2003), despite large AF interactions. Robustness of a description by S=1/2 magnetism on a triangular lattice with of about 200 K was confirmed by observation of spin excitations in Raman scattering Nakamura et al. (2014); Hassan et al. (2018a). A linear contribution to the specific heat that is insensitive to magnetic field was attributed to gapless fermionic excitations Yamashita et al. (2008).
The QSL nature of -Cu-CN has been actively discussed recently, starting with the thermal transport Yamashita et al. (2009) measurements. The nuclear magnetic resonance (NMR) Shimizu et al. (2006) and electron spin resonance (ESR) Miksch et al. (2021) measurements indicate a low-temperature decrease in spin susceptibility reminiscent of spin-singlet formation with a finite residual susceptibility, which was argued to come from orphan spins Riedl et al. (2019); Miksch et al. (2021); Pustogow et al. (2020). Multiple spectroscopic studies of -Cu-CN material Elsässer et al. (2012); Yakushi et al. (2015); Sedlmeier et al. (2012); Dressel et al. (2016); Matsuura et al. (2022) pointed on possible unconventional behavior of the charge degree of freedom and the lattice, but have not produced conclusive results.
Presented in this work Raman scattering measurements of -Cu-CN conducted in a broad frequency range from 12 up to 2000 cm-1 down to 6 K allowed us to uncover glassy (disordered) charge fluctuations on the ET2 dimers and their interaction with the lattice. The quantitative analysis of the line shapes of lattice and molecular vibrations allow us to follow the temperature dependence of the frequency of charge fluctuations . Our observations are consistent with the emergence of a charge dipole glass state in -Cu-CN. We speculate that the dipole glass state corresponds to disorder in the magnetic exchange constant , which promotes spin-singlet formation and a valence bond glass state.
II Results
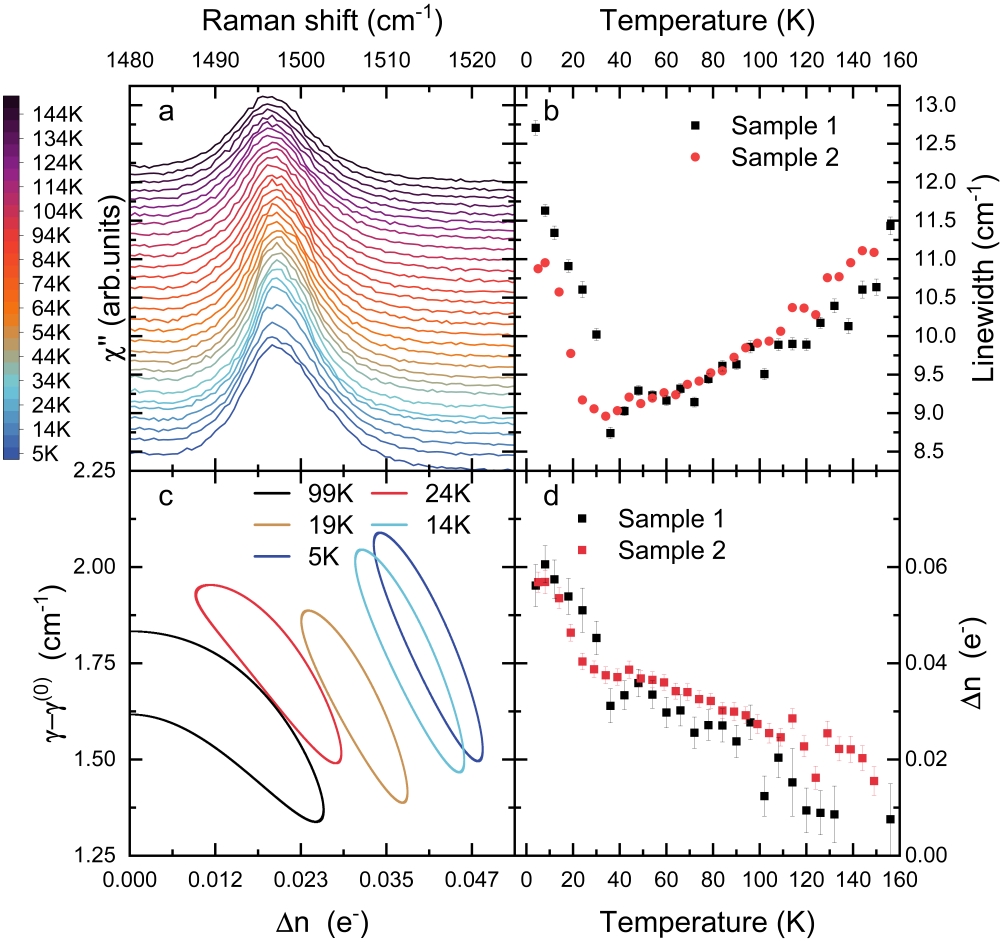
As the first step, we re-examine the line shape of a vibration of the central C=C bond of ET molecules , which is an accepted tool to study the distribution of the charge on the Highest Occupied Molecular Orbital (HOMO) of an ET molecule. For a detailed explanation of the line shape analysis and fitting procedure, see SI. The frequency of (in cm-1) satisfies the relation
| (1) |
where is the average charge on the ET molecule, with in most ET-based material Yamamoto et al. (2005). As shown in the Fig. 2 a, we observe that narrows on cooling down to approximately 40 K, but broadens on cooling below this temperature, as estimated by a temperature dependence of the Full-Width-Half-Maximum (FWHM) (see Fig. 2b). In Fig. 2 we show results obtained for two samples, which show a similar behaviour with small discrepancies in temperature behavior and linewidth. Its frequency does not show any anomaly or splitting upon cooling, in agreement with the previous studies Yakushi et al. (2015). In our analysis of the line shape of , we considered two possible scenarios:
(i) Static or fluctuating charge order between sites A and B with a well-defined charge separation, , which results in a frequency splitting, . Charge disproportionation within an (ET)2 dimer creates an electric dipole, as shown in Fig. 1. We assume each component possesses a similar life time as the non-perturbed vibration, which provides “natural” linewidth (in our case, 5 cm-1). A frequency of fluctuations, , is defined as the hopping rate between sites Kubo (1969); Sue et al. (1986); Yakushi (2012); Hassan et al. (2018a). Static charge order is the case with =0. The static and dynamic cases result in a renormalized Lorentzian lineshape of the response.
(ii) Charge glass: A Gaussian parameter describes a random distribution of charge by charge fluctuations with a stochastic decay process. The charge glass is modeled by the autocorrelation function of charge fluctuations
| (2) |
where is the amplitude of charge fluctuations and is the inverse lifetime of charge fluctuations Kubo (1969); Sue et al. (1986); Yakushi (2012). In the dimerized -phase, we expect in general, that for the A and B molecules of a dimer, . We can use the simplified version of the Eq. 2, since this rule imposed by dimerization only influences the amplitude the charge separation , which is an experimentally fit parameter. The resulting lineshape is a renormalized Voigt profile, characterized by a Lorentzian width determined by decay frequency .
| (3) |
and Gaussian variance
| (4) |
where is the natural lifetime of the pure vibration, is a constant, , and is the spectral resolution. Following this model, as the static limit is approached, the Lorentzian width diverges as . Once the dynamic process freezes out entirely , the Lorentzian width renormalizes to . In a static case the Gaussian variance determined by will define the line shape.
For the case of a relatively weak broadening of , the analysis of the experimental spectra with both models has the following limitation: we cannot uniquely determine the charge separation and fluctuation rate, which may be both temperature dependent, and have large covariance. The increase of charge separation leads to an increase of the the linewidth (Lorenzian for model (i) and Gaussian for model (ii)), while the increase of fluctuation frequency leads to a decrease of the Lorentzian linewidth.
A static case of both models provides a lower limit estimate of the charge separation. A fit with the static charge order (model (i)) yields = 0.05 at the lowest measured temperature of 6 K, which is shown in SI. The static case () of the charge glass (model (ii)) yields a standard deviation of charge disproportionation of 0.03, corresponding to an average charge separation of 0.05e in a dimer. Fig. 2 d shows the temperature dependence of the average charge separation for a static case. However, the static case provides worse fit quality than dynamic charge disproportionation.
To identify the best fit parameters we used the total squared error as a measure of goodness of fit (see SI ) calculated as . While the error is quantitatively different for the two measured samples, the final result is that the best fit is provided by the Gaussian shape (charge glass model). The values of and suggested by 95% fit confidence regions Efron and Tibshirani (1994) are shown in Fig. 2c. The range of parameters narrows on cooling; Charge disproportionation shows an increase. The best fit provides a broad range for fluctuation frequencies with a temperature variation of frequency smaller than this range, as shown by the 95% confidence regions at few different temperatures (see Fig. 2c).
The main result of this analysis is that the charge disproportionation abruptly increases below 40 K and begins to flatten near 20 K, remaining flat below 10 K, in agreement with the results of Ref. Yamamoto et al. (2005); Sedlmeier et al. (2012). We find that this charge disproportionation is disordered and slowly fluctuating. Vibrational analysis cannot follow the frequency of fluctuations precisely. The average charge separation at the lowest temperatures measured about 6 K, is estimated to be 0.06e, which is very close to the estimate provided by dielectric measurements in Ref. Abdel-Jawad et al. (2010). This is significantly smaller than the charge separation observed in the only material -ET2Hg(SCN)2Cl with static charge ordered state Drichko et al. (2014); Hassan et al. (2020).
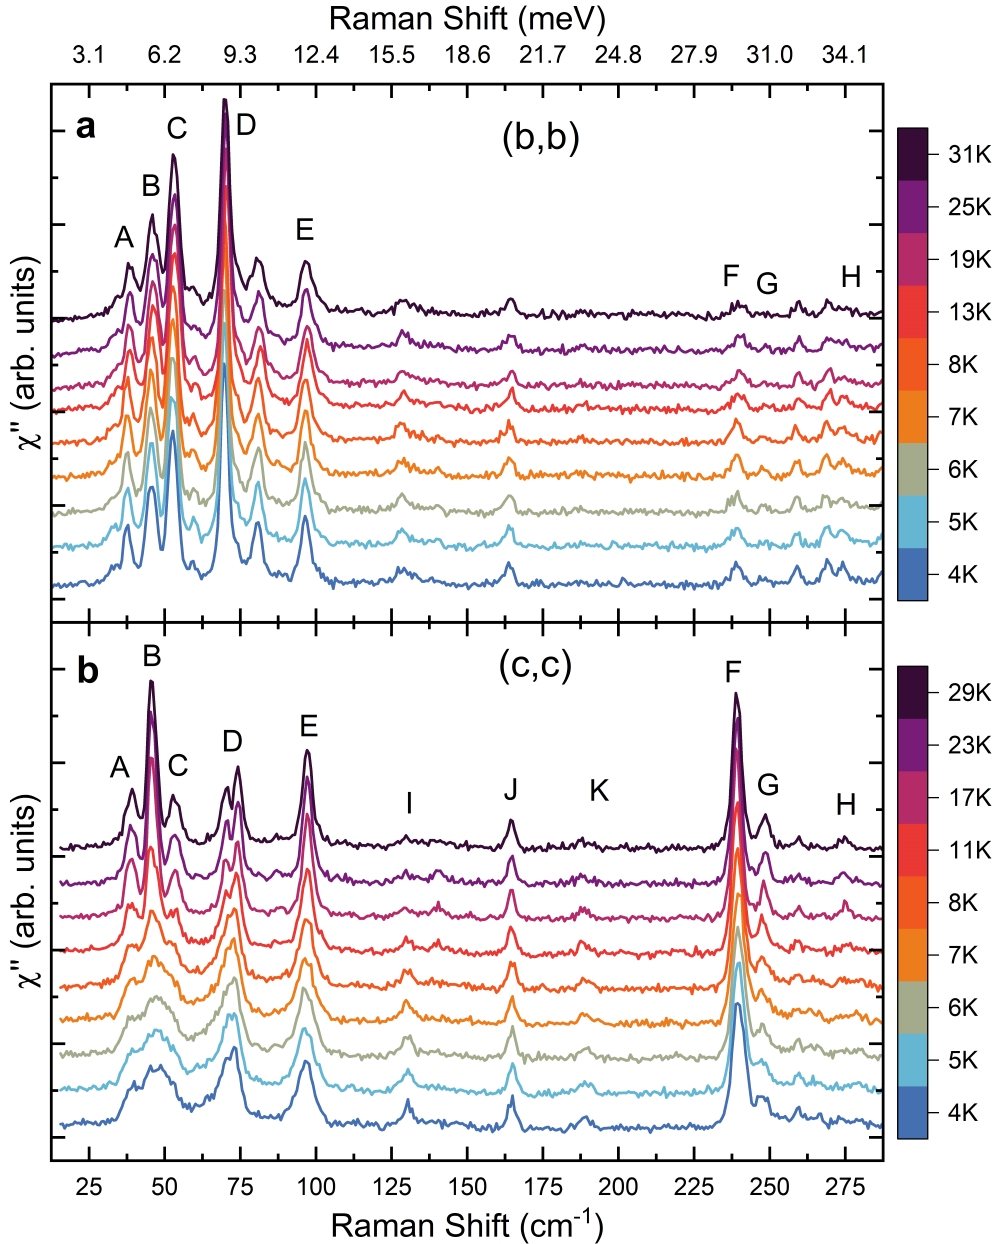
Next, we examine the lattice response of -Cu-CN by analysing the Raman scattering spectra in the (b,b), (b,c), and (c,c) scattering channels at low frequencies. Lattice phonons in ET-based compounds are typically observed in the frequency below approximately 100 cm-1 Dressel et al. (2016). In Fig. 3 we show the Raman spectra in the (b,b), (c,c), and (b,c) polarizations from 12.5 cm-1 to 112.5 cm-1, the spectra in the higher frequency range are shown in Fig. 4, and the assignment of the observed modes based on calculations Dressel et al. (2016) is presented in SI. One has to keep in mind, that these lattice modes are superimposed on the continuum of the magnetic excitations, which is about an order of magnitude weaker than the observed phonons and detected in low resolution broad range measurements Nakamura et al. (2014); Hassan et al. (2018b).
The lattice modes in this spectral region are overdamped and weak at room temperature, but can be distinctly observed at temperatures below approximately 150 K. The changes of phonons on cooling in the (b,b) and (b,c) channels are conventional: The phonons harden and narrow on cooling, their width described by anharmonic decay according to the Klemens model Klemens (1966) (see Fig. 5 a). All the modes increase in intensity on cooling. In (b,c) channel we observe an appearance of the mode A at 38 cm-1 below approximately 20 K.
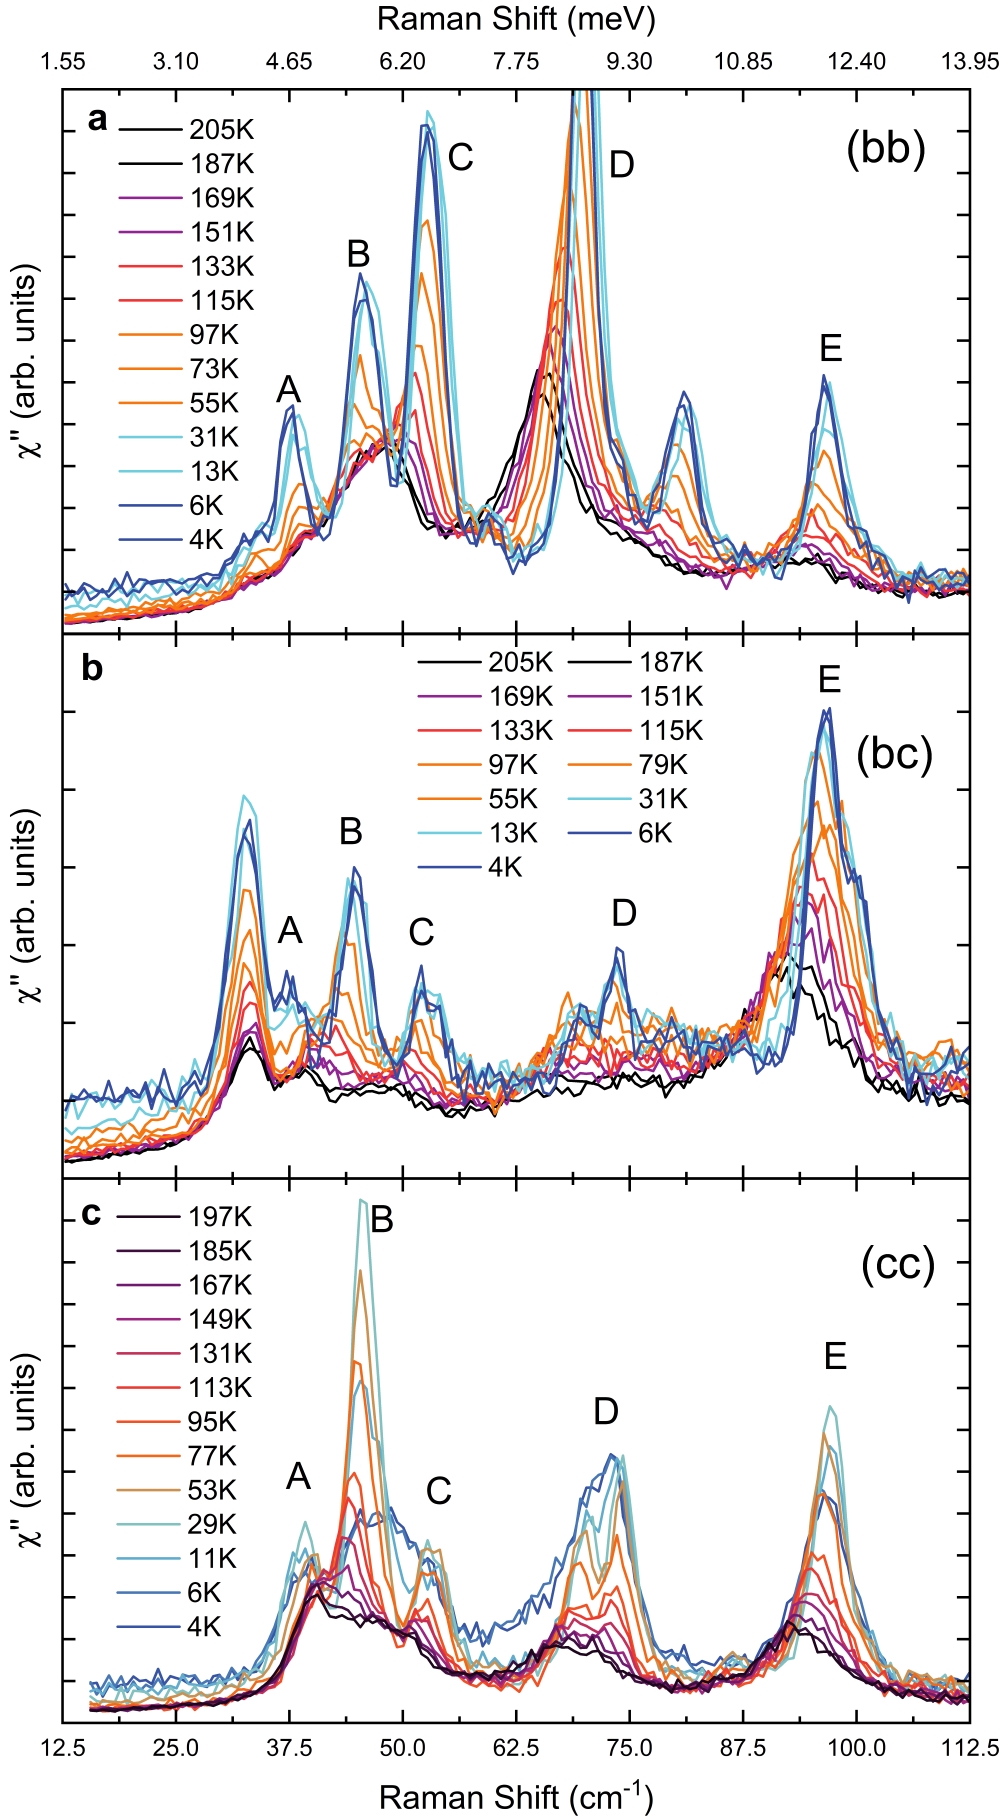
In the (c,c) scattering channel we observe conventional behavior of the width and frequencies of the lattice modes only down to approximately 20 K. Below 20 K the modes labeled A-H broaden and lose coherent spectral weight, with the strongest effect observed for the mode B at 46 cm-1 (Fig. 3c). The linewidth increases on cooling below 20 K to 6 K. (Fig. 5 b) Several of the modes, notably B, C, and D become so broad and incoherent below 10 K that one cannot isolate their line shape. The fit parameters are therefore not definitive, but represent a best fit with appropriate uncertainties.
All of the modes A-H correspond to motion of ET molecules Dressel et al. (2016). For some there is coupled anion motion, but the mode F corresponds to purely ET motion.
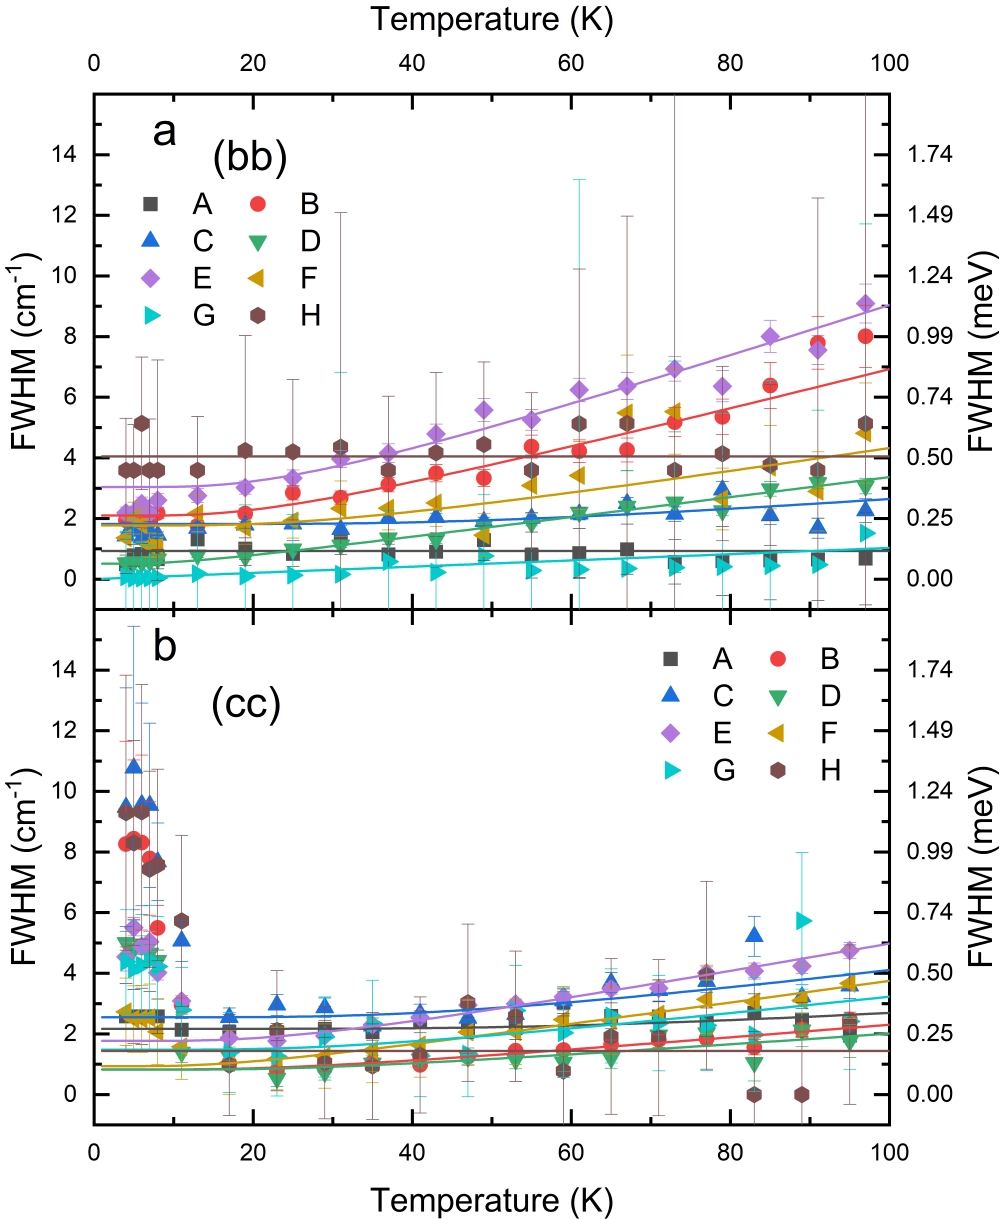
The anisotropy of the broadening of phonons at low temperatureswhich is observed only in the (c,c) polarization, is the most striking result. We do not observe recovery of the width the phonons down to the lowest measured temperature of 6 K, while neutron scattering results, though measured with lower energy resolution, were suggesting such a drop below 6 K Matsuura et al. (2022).
III Discussion
The local probe of charge on ET molecules provided by the analysis of line shape of the molecular vibration , compared to the the behavior of the lattice phonons which reflect the collective response, reveals the following picture. Below 40-60 K, the local probe signals an increasing amplitude of charge fluctuations. Both the onset temperature of charge separation of 60 K and its amplitude, estimated at =0.06, observed by us is in agreement with the dielectric measurements Abdel-Jawad et al. (2010); Pinterić et al. (2014) and the broadening of the charge sensitive mode observed by IR measurements Sedlmeier et al. (2012).
On further cooling, we can identify two characteristic temperatures: At 20 K lattice modes in (c,c) channel demonstrate broadening, which saturates at 6 K. This coincides with the appearance of mode A at 38 cm-1 in (b,c) channel, demonstrating the loss of local inversion symmetry. These temperature scales also correspond to the ones observed in the measurements of dielectric properties. Below 20 K, a freezing out of the high-temperature dielectric process with glassy relaxation is suggested Pinterić et al. (2014), where the 6 K anomaly could be a transition into spin-singlet glassy state Miksch et al. (2021); Riedl et al. (2019).
The anion layer was previously suggested as a source of the disorder potential Nakamura et al. (2021); Pinterić et al. (2014), which can be a candidate for the origin of a glassy state. However, we cannot attribute the lattice phonons broadening to the structural disorder: The increase in linewidth of the lattice modes is observed only in the (c,c) channel and only in the (ET)2 phonons, without broadening vibrations of the anion layer, such as the lattice modes I, J, and K. This anisotropy suggests that the origin of the charge order fluctuations and the anisotropic broadening of phonons are competing interactions in this complex material.
Theoretical understanding of charge ordering in -ET-based dimer Mott insulators has been suggested either within an extended Hubbard model for 1/4 filled bands with electron-phonon coupling Dayal et al. (2011) or within a model which maps the charge degree of freedom within dimer lattice sites onto a S=1 Ising model coupled to S=1/2 Heisenberg spin-interactions in a Kugel-Khomskii model Hotta (2010); Naka and Ishihara (2010, 2013). The basic parameters of the extended Hubbard model with each ET+0.5 molecule counted as a lattice site are electron repulsion , and charge transfer integrals , where is a charge transfer integral between the molecules in a (ET)2 dimer (see Fig. 6). The hybridization of the ET HOMO within (ET)2 dimers renormalizes nearest neighbor repulsion within a dimer to an effective on-site Coulombic interaction:
| (5) |
This allows a mapping of a 1/4-filled model on 1/2-filling with the Hamiltonian describing interactions between dimer lattice sites:
| (6) |
where (next) nearest neighboring lattice sites have Coulombic repulsion () and charge transfer integrals () . The spin interactions are described by magnetic exchange parameters and Hotta (2010). The Dimer-Mott Insulator to Charge-Order Insulator transition has been parameterized via competition between intramolecular hopping () and interdimer Coulomb Repulsion () Dayal et al. (2011); Naka and Ishihara (2010); Hotta (2010), and the anisotropy of interdimer hopping () Dayal et al. (2011). In -Cu-CN, is slightly above 0.8 Nakamura et al. (2009); Kandpal et al. (2009); Jeschke et al. (2012), where numerical simulations cannot predict charge order Dayal et al. (2011). The most basic tuning of the dipole liquid to dipole solid transition is provided by the increase of parameters Hotta (2010); Naka and Ishihara (2010). In the dipole solid phase (static charge order) and are renormalized due to unequal occupation within (ET)2 dimers, resulting in electronic anisotropy Jacko et al. (2020).
To the best of our knowledge, theoretical considerations have not accounted for dynamic renormalization of transfer integrals by charge fluctuations in a dipole liquid state. We expect that this modulation of transfer integrals would result in electron-phonon coupling to the lattice phonons. Lattice phonons A-H modulate the distance between the planes of ET molecules, the angle between ET molecules, and the relative orientation of ethylene endgroups. Dynamic changes to these structural parameters with modulation of charge transfer integrals Mori et al. (1984) is the microscopic mechanism of this electron-phonon coupling.
The emerging charge disproportionation occurs within (ET)2 dimers, so at his point we do not consider fluctuations in the amplitude of . Charge fluctuations dynamically renormalize the charge transfer integral Jacko et al. (2020), thus resulting in corresponding fluctuations of :
| (7) |
where and is the average of , and is the average decay rate of charge fluctuations.
In a limit where fluctuation frequency is small, (see Fig. 2 c), we can express phonon frequency as a function of the change of transfer integral .
| (8) |
where is a lattice phonon frequency at the average value of , or . is a strength of electron-phonon coupling which can be different for every lattice mode. Such coupling will result in a deviation in frequency arising from the amplitude of charge transfer integral fluctuations , so that .
The line width of the lattice vibrations can be expressed then as
| (9) |
where is the “natural” line width unperturbed by the charge fluctuations Klemens (1966), is a constant different for every lattice mode. Lorenzian shape of lattice vibrations A-H in scattering channel suggests that the broadening due to the decreased life-time determined by the of charge fluctuations is a larger effect for the lattice modes than at least above 20 K. This is in contrast to the mode, which is very sensitive to the redistribution of changes on the ET molecule and changes of as the result, meaning large and a Gaussian line shape.
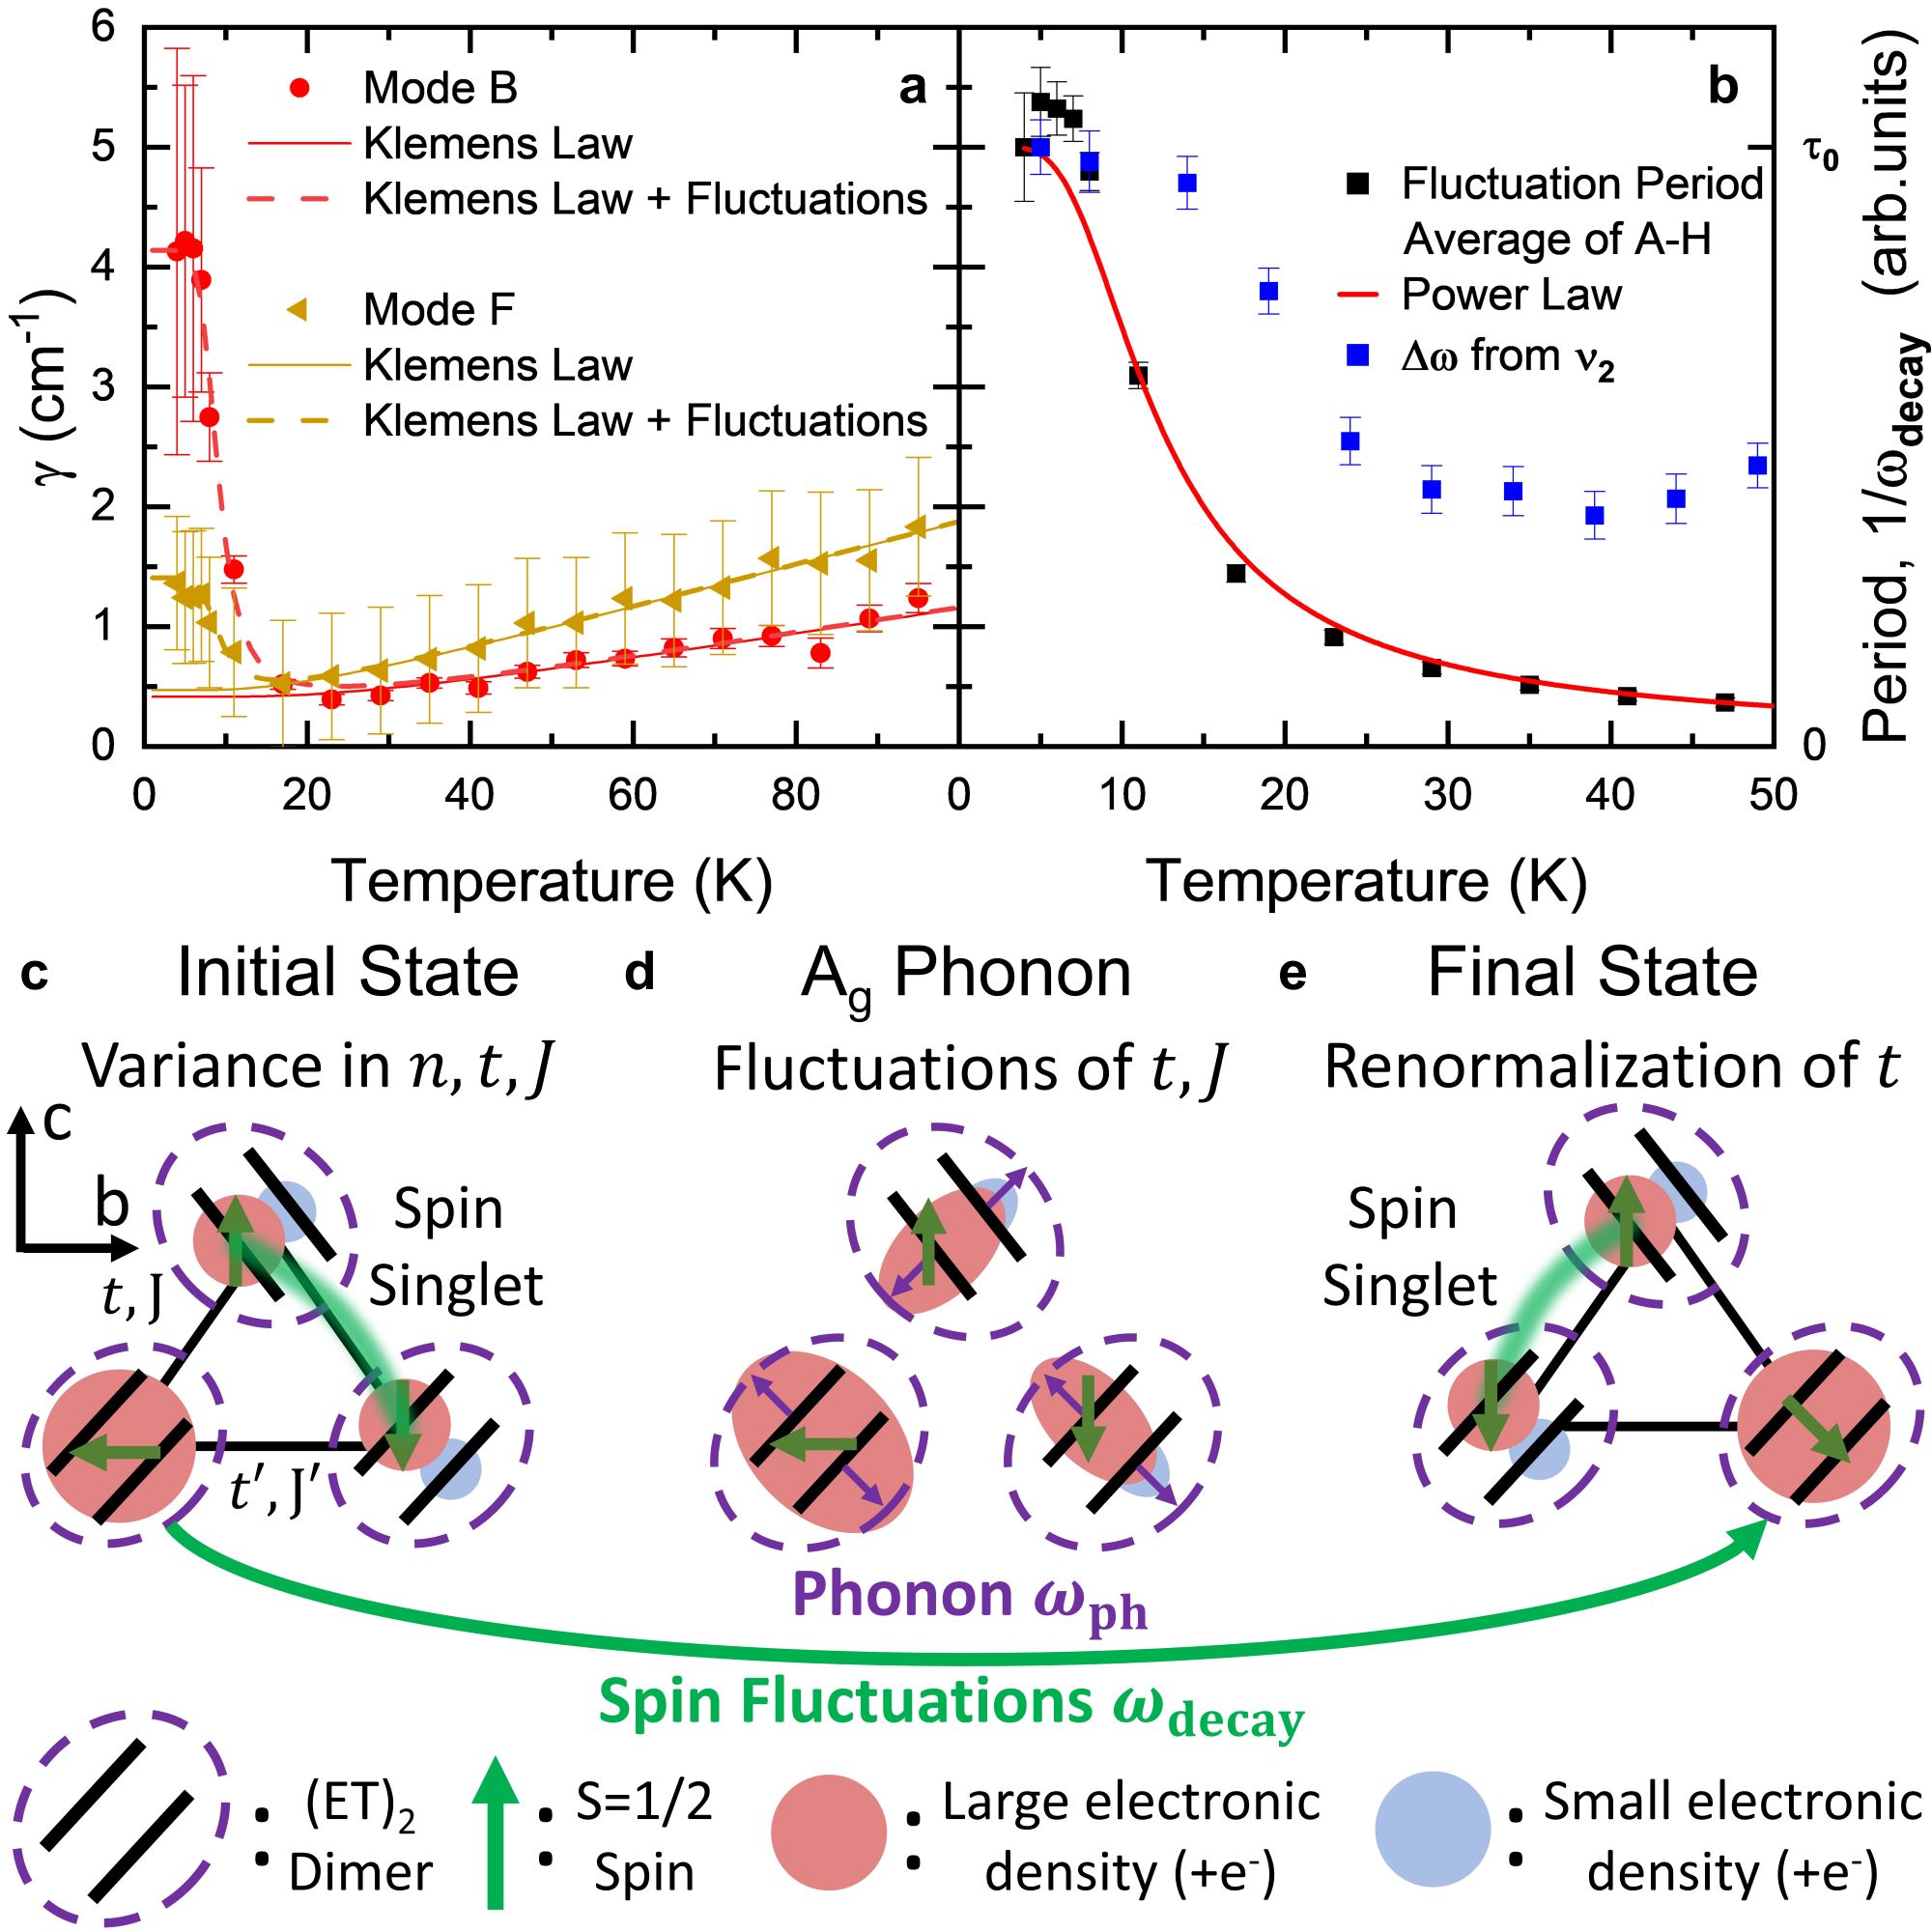
Fig. 6a shows the temperature dependence of the line width of two lattice modes, B and F, in (c,c) scattering channel. At higher temperatures the modes narrow on cooling following the Klemens model, while the broadening below 20 K is determined by the increased scattering on charge fluctuations, as suggested above.
For each mode, a deviation from the Klemens’ Law due to the enhancement of a phonon scattering rate is
| (10) |
In order to determine the independently of and which we assume to be temperature independent for the modes A-H, we can express
Such averaging provides a reliable result for the temperature dependence of . Fig. 6b demonstrated that the fluctuation life time increases as temperature decreases and reaches saturation as temperatures approach 6 K.
We have to keep in mind, that if fluctuation frequency is small enough we would not be able to distinguish it from a fully static case. A new phonon at 38 cm-1continuously increases the intensity in scattering channel below 20 K, suggesting possible local symmetry breaking.
The extreme broadening of low frequency modes as temperature approaches 6 K (see Fig. 4) suggests the higher electron-phonon coupling for these modes and an importance of this term at low frequencies. The increase of is in agreement with the increase of the amplitude of charge disproportionation probed by the mode below approximately 20 K (see Fig. 2).
The coupling of phonons to the charge fluctuations as discussed above is observed only in (c,c) scattering channel. Such anisotropy suggest anisotropic charge fluctuations. The anisotropy detected by us is in agreement with the stronger dielectric response in Ec Pinterić et al. (2014) and enhanced optical conductivity, where an additional electronic response, strongly coupled to lattice phonons, increases on cooling below approximately 20 K in Ec polarization Dressel et al. (2016); Itoh et al. (2013). While the authors of Ref. Dressel et al. (2016) have left the interpretation of the low frequency continuum open, the best candidate for these excitations are the charge order fluctuations.
Previously, strong anisotropy of the electronic structure was observed only in a charge ordered state of a -phase material by infrared and Raman spectroscopies Drichko et al. (2014); Hassan et al. (2020) and was in agreement with the theoretically demonstrated renormalization of overlap integrals in the charge ordered state Jacko et al. (2020). Our results as well as Ref. Dressel et al. (2016); Itoh et al. (2013); Pinterić et al. (2014) show that already in a fluctuating regime charge disproportionation shows some anisotropy.
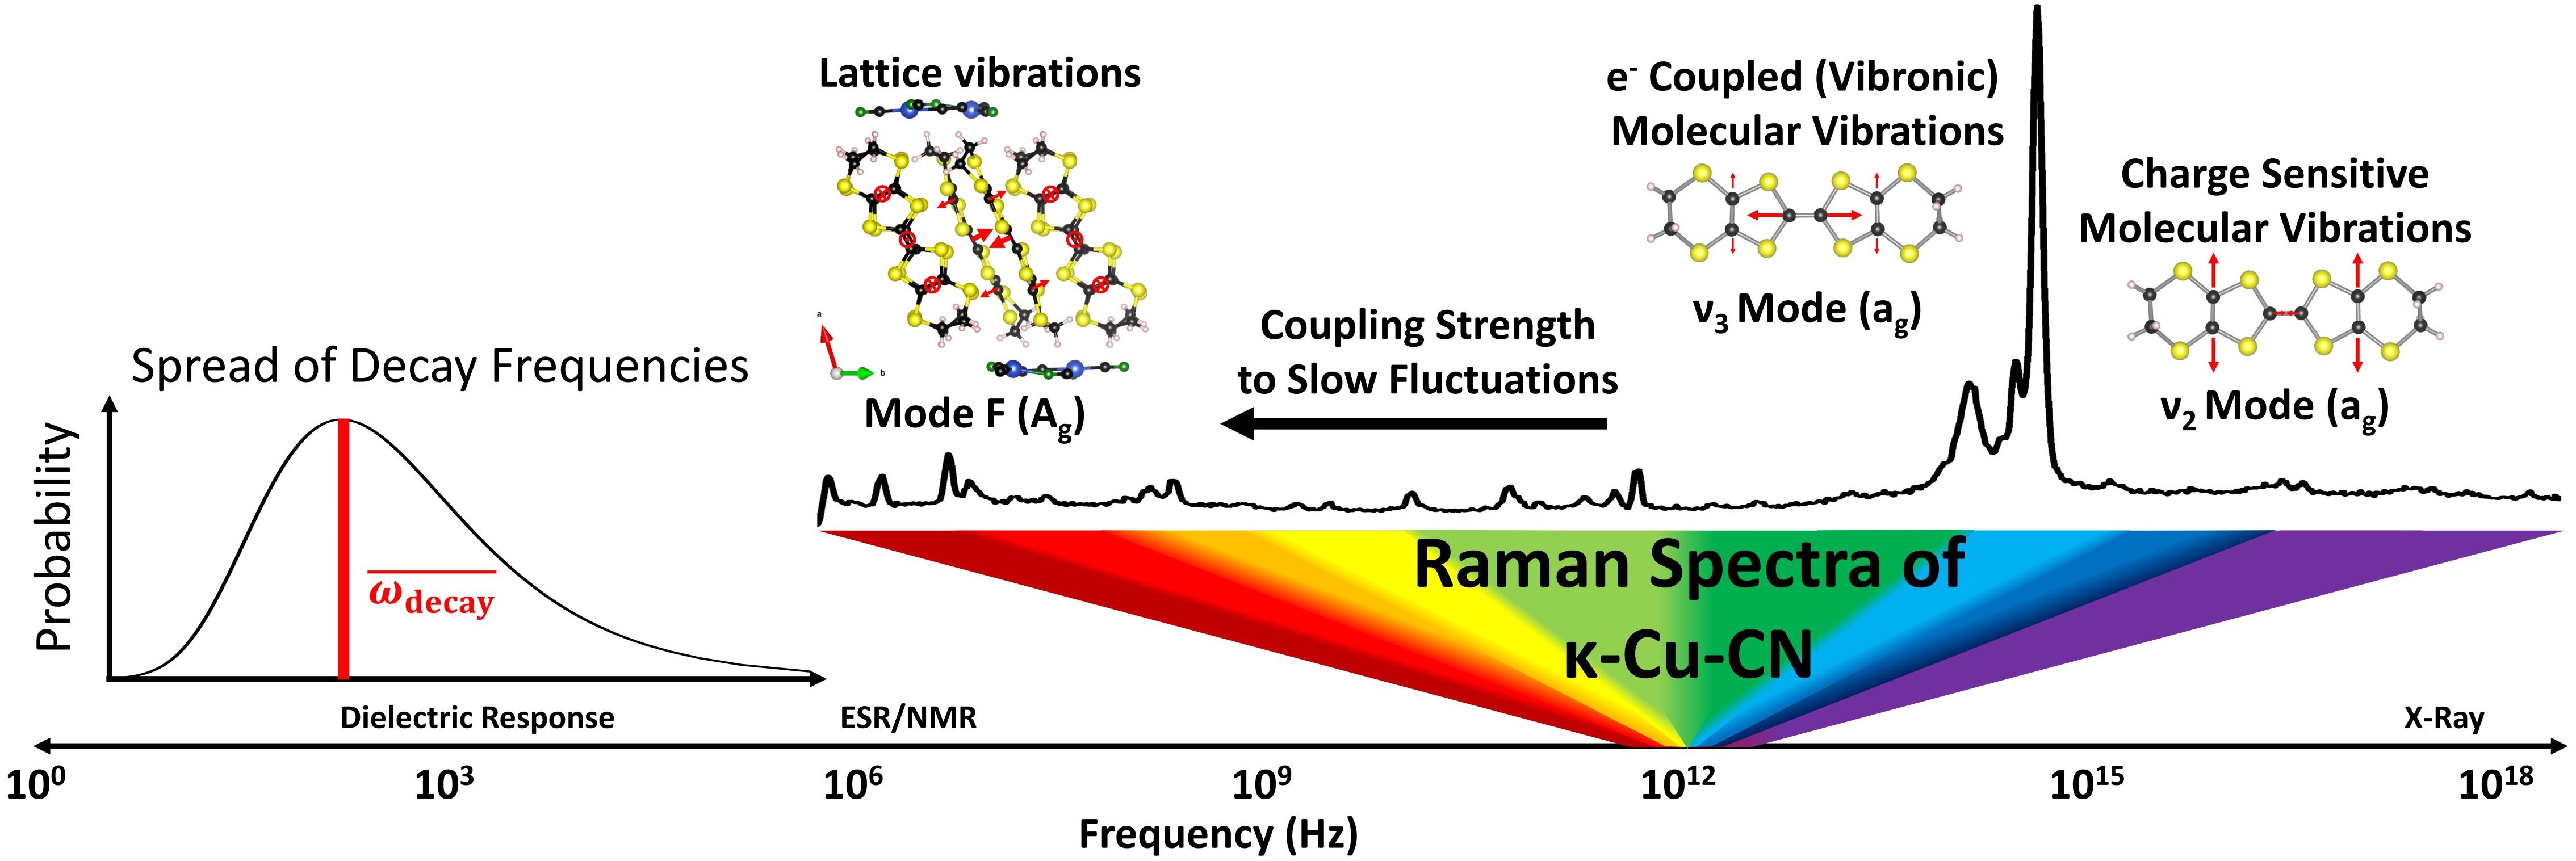
Our conclusions are in agreement with the dielectric measurements in Ref. Pinterić et al. (2014), which suggest a slow down of dipole fluctuations on cooling the samples from 60 K. Mean relaxation time of the dielectric response 10-8 s observed at high temperatures decreases down to the average timescale of 10-5 s. While the relaxation time at around 50 K is close to the characteristic time of lattice phonons, 10-11 s, the low-temperature behavior where indeed could be indistinguishable from static regime by Raman scattering. In comparison of the results obtained in different frequency ranges (Fig. 7), we have to keep in mind that in any relaxation process described by correlation functions is stochastic. Our correlation function, which is determined by an exponential decay, has an average timescale of and standard deviation of decay times Kingman (1992). The increase of naturally leads to the increase of , which can cover a range of frequencies from dielectric to Raman and optical measurements, see Fig. 7. Additionally, a large distribution of frequencies is a natural consequence of localized defects emerging from disorder. Such broadening of the characteristic time scales as well as a broad frequency range of the spectroscopic probes applied to the studies of -Cu-CN (see Fig. 7 ) can explain the rich and at times conflicting experimental results for this material. At finite temperatures below 6 K, defects corresponding to structure, dipoles, and spin can exhibit responses that cover a wide range of frequencies, resembling gapless features.
Extended Hubbard Model is a framework to understand a transition from Dimer Mott Insulator to Charge order, with fluctuations of electrical dipoles and intrinsic inhomogeniety of a system arising from competing interactions close to a phase transitions Yamashita et al. (2020); Urai et al. (2022). Our experimental data suggest that a glassy state formed by the dipole moments within the (ET)2 dimers can be additionally a consequence of the electron-phonon coupling in -Cu-CN. For understanding of charge and magnetic state in this material, a model, for example a Kugel-Khomskii model Kugel’ and Khomskiĭ (1982), used to describe this transition, should include dynamic electron-phonon coupling.
Some models which describe similar physical effects already exists. With electric dipoles on (ET)2 dimers being mapped on an Ising model Hotta (2010); Naka and Ishihara (2010, 2013), it is useful to relate to recent theoretical work on disordered Transverse Ising Model. In our case, the disorder can be present both in the amplitude and orientation of Ising-like dipoles. It was shown that when bond randomness is introduced to the Transverse Ising model, it can stabilize a structural-spin-glass state Hotta et al. (2022, 2023). This is consistent with our experimental results of disordered electric dipoles with strong coupling to the lattice in -Cu-CN. The model has been already successfully applied to different experimental systms, the pyrochlore molybdates, an Ising systems where the Jahn-Teller effect is expected to drive glassy dynamics Mitsumoto et al. (2022). These experimental systems carry similarity to -Cu-CN, for example in cooling rate effects Yakushi et al. (2015). Such so called “quantum-mechanically driven structural-spin-glass” exhibits non-trivial thermodynamics, such as a Berezinskii-Kosterlitz-Thouless transition Hotta et al. (2022), which can be further studied in -Cu-CN.
It is important to note, that the observed by us anisotropic broadening of lattice phonons is so far unique for -Cu-CN among molecular Mott insulators despite charge fluctuations observed in other systems Hassan et al. (2018a); Urai et al. (2022); Hassan et al. (2018b). This could be a consequence of the difference in electronic parameters and anisotropy, which also results in the smallest observed charge disproportionation in -Cu-CN. Magnetic exchange Raman scattering observed in the spectra of -Cu-CN Nakamura et al. (2014); Hassan et al. (2018a, b) shows that despite finite , the system still behaves as S=1/2 Mott insulator (Dimer Mott insulator) on a triangular lattice, in contrast to other organic Mott insulators with charge fluctuations and charge order Hassan et al. (2018a); Yamashita et al. (2020); Drichko et al. (2022).
Since the magnetic exchange is , we expect that fluctuations of , correspond to fluctuations of , . These fluctuations, which have a broad range of low frequencies below 6 K, can explain the origin of the disordered magnetic ground state and spin singlet pairs with life time of , as measured in ESR Miksch et al. (2021), NMR, and magnetic torque Isono et al. (2016); Riedl et al. (2019), and remind the RVB model.
In summary, we used Raman spectroscopy to probe the electronic state and lattice dynamics of -Cu-CN. We observe a developing of slowly fluctuating charge disproportionation at temperatures below 60 K. On temperature decrease, the charge disproportionation increases in amplitude and the fluctuations slow down. We observe strong and highly anisotropic coupling of these charge fluctuations to the lattice. Our observation are in agreement with a large number of measurements of electrodynamic response of -Cu-CN, which probed some manifestations of this complex effect. We review theoretical work which shows that this coupling of dipole fluctuations to the lattice can lead to a formation of glassy state. Since dipole fluctuations dynamically renormalize magnetic interactions, our observation suggest the understanding of magnetic properties of -Cu-CN as slowly fluctuating spin dimers, reminiscent of RVB state.
IV Acknowledgments
The authors are grateful to C. Hotta and S. Winter for fruitful discussions. The work at JHU was supported by NSF Award No. DMR-2004074. This work was performed in part at Aspen Center for Physics, which is supported by NSF grant PHY-2210452.
References
- Anderson (1973) P. Anderson, Materials Research Bulletin 8, 153 (1973).
- Huse and Elser (1988) D. A. Huse and V. Elser, Phys. Rev. Lett. 60, 2531 (1988).
- Misguich et al. (1999) G. Misguich, C. Lhuillier, B. Bernu, and C. Waldtmann, Phys. Rev. B 60, 1064 (1999).
- Zhu and White (2015) Z. Zhu and S. R. White, Phys. Rev. B 92, 041105 (2015).
- Hotta (2010) C. Hotta, Physical Review B 82, 241104(R) (2010).
- Note (1) ET refers to bis(ethylenedithio)tetrathiafuvalene.
- Holt et al. (2014) M. Holt, B. J. Powell, and J. Merino, Phys. Rev. B 89, 174415 (2014).
- Abdel-Jawad et al. (2010) M. Abdel-Jawad, I. Terasaki, T. Sasaki, N. Yoneyama, N. Kobayashi, Y. Uesu, and C. Hotta, Physical Review B 82, 125119 (2010).
- Pinterić et al. (2014) M. Pinterić, M. Čulo, O. Milat, M. Basletić, B. Korin-Hamzić, E. Tafra, A. Hamzić, T. Ivek, T. Peterseim, K. Miyagawa, K. Kanoda, J. A. Schlueter, M. Dressel, and S. Tomić, Phys. Rev. B 90, 195139 (2014).
- Yakushi et al. (2015) K. Yakushi, K. Yamamoto, T. Yamamoto, Y. Saito, and A. Kawamoto, Journal of the Physical Society of Japan 84, 084711 (2015).
- Hassan et al. (2018a) N. Hassan, S. Cunningham, M. Mourigal, E. I. Zhilyaeva, S. A. Torunova, R. N. Lyubovskaya, J. A. Schlueter, and N. Drichko, Science 360, 1101 (2018a).
- Shimizu et al. (2003) Y. Shimizu, K. Miyagawa, K. Kanoda, M. Maesato, and G. Saito, Physical review letters 91, 107001 (2003).
- Nakamura et al. (2014) Y. Nakamura, N. Yoneyama, T. Sasaki, T. Tohyama, A. Nakamura, and H. Kishida, Journal of the Physical Society of Japan 83, 074708 (2014).
- Yamashita et al. (2008) S. Yamashita, Y. Nakazawa, M. Oguni, Y. Oshima, H. Nojiri, Y. Shimizu, K. Miyagawa, and K. Kanoda, Nature Physics 4, 459 (2008).
- Yamashita et al. (2009) M. Yamashita, N. Nakata, Y. Kasahara, T. Sasaki, N. Yoneyama, N. Kobayashi, S. Fujimoto, T. Shibauchi, and Y. Matsuda, Nature Physics 5, 44 (2009).
- Shimizu et al. (2006) Y. Shimizu, K. Miyagawa, K. Kanoda, M. Maesato, and G. Saito, Physical Review B 73, 140407 (2006).
- Miksch et al. (2021) B. Miksch, A. Pustogow, M. J. Rahim, A. A. Bardin, K. Kanoda, J. A. Schlueter, R. Hübner, M. Scheffler, and M. Dressel, Science 372, 276 (2021).
- Riedl et al. (2019) K. Riedl, R. Valentí, and S. M. Winter, Nature communications 10, 1 (2019).
- Pustogow et al. (2020) A. Pustogow, T. Le, H.-H. Wang, Y. Luo, E. Gati, H. Schubert, M. Lang, and S. Brown, Physical Review B 101, 140401 (2020).
- Elsässer et al. (2012) S. Elsässer, D. Wu, M. Dressel, and J. A. Schlueter, Phys. Rev. B 86, 155150 (2012).
- Sedlmeier et al. (2012) K. Sedlmeier, S. Elsässer, D. Neubauer, R. Beyer, D. Wu, T. Ivek, S. Tomić, J. A. Schlueter, and M. Dressel, Phys. Rev. B 86, 245103 (2012).
- Dressel et al. (2016) M. Dressel, P. Lazić, A. Pustogow, E. Zhukova, B. Gorshunov, J. A. Schlueter, O. Milat, B. Gumhalter, and S. Tomić, Phys. Rev. B 93, 081201 (2016).
- Matsuura et al. (2022) M. Matsuura, T. Sasaki, M. Naka, J. Müller, O. Stockert, A. Piovano, N. Yoneyama, and M. Lang, Phys. Rev. Res. 4, L042047 (2022).
- Yamamoto et al. (2005) T. Yamamoto, M. Uruichi, K. Yamamoto, K. Yakushi, A. Kawamoto, and H. Taniguchi, The Journal of Physical Chemistry B 109, 15226 (2005).
- Kubo (1969) R. Kubo, Advances in Chemical Physics 15, 101 (1969).
- Sue et al. (1986) J. Sue, Y. J. Yan, and S. Mukamel, The Journal of Chemical Physics 85, 462 (1986).
- Yakushi (2012) K. Yakushi, Crystals 2, 1291 (2012).
- Efron and Tibshirani (1994) B. Efron and R. Tibshirani, “An introduction to the bootstrap,” (Chapman and Hall/CRC, New York, 1994) Chap. 12, 1st ed.
- Drichko et al. (2014) N. Drichko, R. Beyer, E. Rose, M. Dressel, J. A. Schlueter, S. A. Turunova, E. I. Zhilyaeva, and R. N. Lyubovskaya, Phys. Rev. B 89, 075133 (2014).
- Hassan et al. (2020) N. M. Hassan, K. Thirunavukkuarasu, Z. Lu, D. Smirnov, E. I. Zhilyaeva, S. Torunova, R. N. Lyubovskaya, and N. Drichko, npj Quantum Materials 5, 1 (2020).
- Hassan et al. (2018b) N. Hassan, S. Cunningham, E. I. Zhilyaeva, S. A. Torunova, R. N. Lyubovskaya, J. A. Schlueter, and N. Drichko, Crystals 8, 233 (2018b).
- Klemens (1966) P. G. Klemens, Phys. Rev. 148, 845 (1966).
- Nakamura et al. (2021) Y. Nakamura, N. Yoneyama, T. Sasaki, T. Hiramatsu, Y. Yoshida, G. Saito, and H. Kishida, Journal of the Physical Society of Japan 90, 054703 (2021), https://doi.org/10.7566/JPSJ.90.054703 .
- Dayal et al. (2011) S. Dayal, R. T. Clay, H. Li, and S. Mazumdar, Phys. Rev. B 83, 245106 (2011).
- Naka and Ishihara (2010) M. Naka and S. Ishihara, Journal of the Physical Society of Japan 79, 063707 (2010).
- Naka and Ishihara (2013) M. Naka and S. Ishihara, Journal of the Physical Society of Japan 82, 023701 (2013).
- Nakamura et al. (2009) K. Nakamura, Y. Yoshimoto, T. Kosugi, R. Arita, and M. Imada, Journal of the Physical Society of Japan 78, 083710 (2009), https://doi.org/10.1143/JPSJ.78.083710 .
- Kandpal et al. (2009) H. C. Kandpal, I. Opahle, Y.-Z. Zhang, H. O. Jeschke, and R. Valentí, Phys. Rev. Lett. 103, 067004 (2009).
- Jeschke et al. (2012) H. O. Jeschke, M. de Souza, R. Valentí, R. S. Manna, M. Lang, and J. A. Schlueter, Phys. Rev. B 85, 035125 (2012).
- Jacko et al. (2020) A. C. Jacko, E. P. Kenny, and B. J. Powell, Phys. Rev. B 101, 125110 (2020).
- Mori et al. (1984) H. Mori, A. Kobayashi, Y. Sasaki, H. Kobayashi, G. Saito, and H. Inokuchi, Bulletin of the Chemical Society of Japan 57, 627 (1984).
- Itoh et al. (2013) K. Itoh, H. Itoh, M. Naka, S. Saito, I. Hosako, N. Yoneyama, S. Ishihara, T. Sasaki, and S. Iwai, Physical review letters 110, 106401 (2013).
- Kingman (1992) J. Kingman, Poisson Processes, Oxford Studies in Probability (Clarendon Press, 1992).
- Yamashita et al. (2020) M. Yamashita, S. Sugiura, A. Ueda, S. Dekura, T. Terashima, S. Uji, Y. Sunairi, H. Mori, E. I. Zhilyaeva, S. A. Torunova, et al., arXiv preprint arXiv:2006.05221 (2020).
- Urai et al. (2022) M. Urai, K. Miyagawa, Y. Watanabe, E. I. Zhilyaeva, S. A. Torunova, R. N. Lyubovskaya, N. Drichko, and K. Kanoda, Science Advances 8, eabn1680 (2022).
- Kugel’ and Khomskiĭ (1982) K. I. Kugel’ and D. I. Khomskiĭ, Soviet Physics Uspekhi 25, 231 (1982).
- Hotta et al. (2022) C. Hotta, K. Ueda, and M. Imada, “Quantum mechanically driven structural-spin glass in two dimensions at finite temperature,” (2022).
- Hotta et al. (2023) C. Hotta, T. Yoshida, and K. Harada, Phys. Rev. Res. 5, 013186 (2023).
- Mitsumoto et al. (2022) K. Mitsumoto, C. Hotta, and H. Yoshino, Phys. Rev. Res. 4, 033157 (2022).
- Drichko et al. (2022) N. Drichko, S. Sugiura, M. Yamashita, A. Ueda, S. Uji, N. Hassan, Y. Sunairi, H. Mori, E. I. Zhilyaeva, S. Torunova, and R. N. Lyubovskaya, Phys. Rev. B 106, 064202 (2022).
- Isono et al. (2016) T. Isono, T. Terashima, K. Miyagawa, K. Kanoda, and S. Uji, Nature communications 7, 1 (2016).