An Experimentally Benchmarked Geant4 SiPM-Based Scintillator Detector Simulation Platform for Gamma Ray Detection
Lysander Miller
Airlie Chapman
Katie Auchettl
Jeremy M. C. Brown
Abstract
Radiation detection is vital for naturally occurring radioactive material detection, port and border monitoring, and homeland security operations. SiPM-based single-volume scintillator detectors offer a cost-effective and robust solution that enables timely radioactive site surveys, while retaining accuracy and sensitivity sufficient for isotope identification. Enhanced site surveying can be achieved by optimising scintillator detector design. In this work, a detailed GAGG:Ce, CLLBC:Ce, BGO, NaI:Tl, and CsI:Tl SiPM-based scintillator detector simulation platform was developed with the Monte Carlo radiation transport toolkit, Geant4, and experimentally benchmarked. This simulation platform successfully predicted the spectral features for selected gamma ray emitting isotopes with energies between 30 keV to 2 MeV. The full width half maximum (FWHM) and normalised cross-correlation coefficient (NCCC) between simulated and experimental energy spectra were also compared. The majority of simulated FWHM values reproduced the experimental results within 2% and the NCCC values demonstrated agreement between the simulated and experimental energy spectra. Discrepancies in these figures of merit can be attributed to detector signal processing electronics modelling, geometry approximations, and multiple Compton scattering within the detector and surrounding environment.
[label1]organization=Department of Mechanical Engineering,
addressline=The University of Melbourne,
city=Parkville,
state=VIC 3010,
country=Australia
\affiliation
[label2]organization=School of Physics,
addressline=The University of Melbourne,
city=Parkville,
state=VIC 3010,
country=Australia
\affiliation
[label3]organization=Optical Sciences Centre, Department of Physics and Astronomy,
addressline=Swinburne University of Technology,
city=Hawthorn,
state=VIC 3122,
country=Australia
1 Introduction
Uncontrolled radiological and nuclear (R&N) material dispersion pose a significant threat to civil and military environments [1, 2, 3]. Radiation detection capabilities play an important role in large-area R&N surveying as they provide first responders with prompt situational awareness. Recent developments in new scintillator crystals, such as CLLBC:Ce [4, 5], and silicon photomultiplier (SiPM) technology allow for compact, lightweight, and rugged detectors that are suitable for large-area radiation detection. An important aspect of detector design is optimising the scintillator geometry and material for accurate radiation measurements given different R&N surveying modalities (e.g., hand-held, ground vehicle mounted, and aerial drone mounted). This can be achieved by simulating the underlying gamma ray and optical scintillation transport processes as they have a significant effect on detector performance.
This work presents the development of a SiPM-based scintillator detector simulation platform in Geant4 version 11.1.2 [6, 7, 8]. Geant4 is the state-of-the-art Monte Carlo radiation transport toolkit that simulates the underlying physical process of interaction and production of particles through matter. The response of five different single-volume scintillator crystal materials to the gamma ray emissions from five radioactive isotopes was simulated. Scintillator crystals GAGG:Ce, CLLBC:Ce, BGO, NaI:Tl, and CsI:Tl were explored as they offer a range of desirable properties for R&N applications. For example, CLLBC:Ce has a high energy resolution, BGO provides a high sensitivity, GAGG:Ce offers a high sensitivity and good energy resolution, and NaI:Tl and CsI:Tl are cost effective. Radioactive sources 109Cd (1 Ci), 57Co (1 Ci), 137Cs (0.1 Ci), 152Eu (0.5 Ci), and 22Na (1 Ci) were considered in this study as they are commonly found in R&N scenarios and provide a 30 keV to 2 MeV energy range where major spectral features such as photopeaks, Compton edges, Compton backscatter peaks, and Compton plateaus can be investigated. The simulation platform was experimentally benchmarked by comparison to the energy spectrum obtained for each scintillator crystal and isotope combination.
2 Method
2.1 Experimental Platform and Acquisition of Radiation Energy Spectra
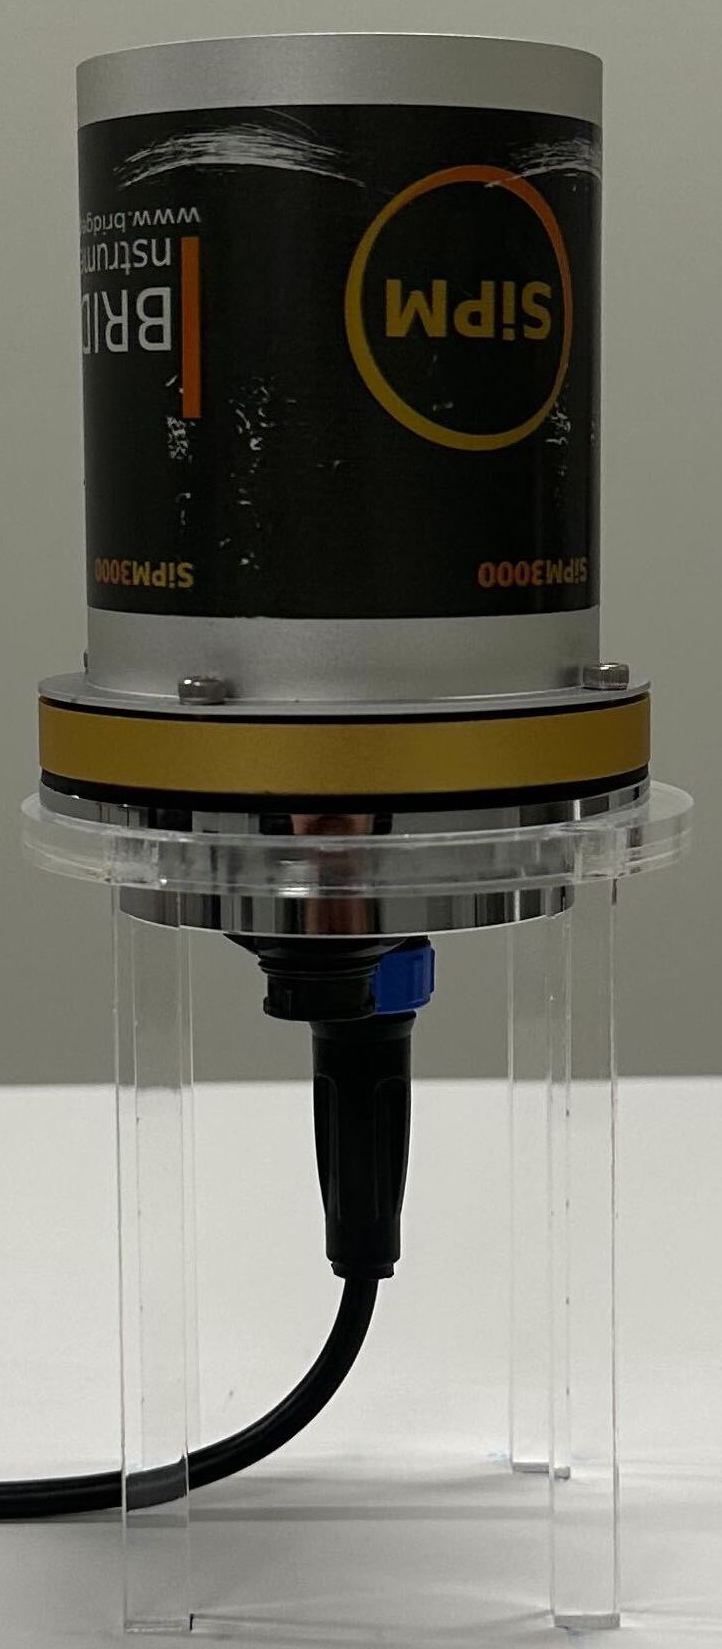
An off-the-shelf SiPM-3000 from Bridgeport Instruments was chosen as the SiPM and MCA platform for this work [9]. Motivated by R&N surveying applications, the SiPM-3000 is desirable as it is operated using open-source interface software and is composed of a rugged detector housing, read-out electronics, and a Broadcom AFBR-S4N66C013 SiPM array, which has a maximum photodetection efficiency (PDE) over 55% [10]. The SiPM array consisted of a 4 4 array of SiPMs, each with a 6.14 mm side length and 0.32 mm gap between neighbouring SiPMs. Individual SiPMs were composed of a 0.2 mm thick glass plate attached to a 0.1 mm thick silicon plate. Scintillator crystals GAGG:Ce, CLLBC:Ce, BGO, NaI:Tl, and CsI:Tl were optically bonded to the SiPM array in the SiPM-3000 using 1 mm thick EJ-560 optical pads. Table (4) in the appendix summarises the dimensions, reflective materials, crystal housing, optical window, and manufacturer for each scintillator crystal.
The system was placed in a custom-made detector holder and positioned in the lab to minimise the chance of Compton scattering with the surrounding environment (see Fig. (1(a))). The five radioactive check sources (109Cd, 57Co, 137Cs, 152Eu, and 22Na) were placed on top of the scintillator crystal within the detector housing to further minimise scattering. After allowing an hour for the SiPM-3000 to thermalise, the detector was calibrated for each crystal type. The integration time, dead time, electronic gain, pulse trigger, and noise trigger were optimised to minimise the noise and low-level detection threshold. For this work, the low-level detection threshold was defined as the minimum energy where the count rate exceeded 5% relative counts to prevent detector noise defining the threshold. An integration time of 2 s was set for GAGG:Ce, BGO, and NaI:Tl, whereas CLLBC:Ce and CsI:Tl used 3 s due to their longer optical decay times (see Table (4) in the appendix). The SiPM-3000 operating voltage was fixed at 33 V (default), yielding an overvoltage of 4.5 V. For each scintillator crystal and radioactive source combination, data acquisition occurred over 30 minutes to reduce statistical noise in the energy spectrum and ensure each photopeak could be resolved. Background measurements were also recorded over 30 minutes at standard temperature and pressure and subtracted from each energy spectrum during post-processing.
2.2 Geant4 Simulation Platform Geometry, Materials, and Optical Data Tables
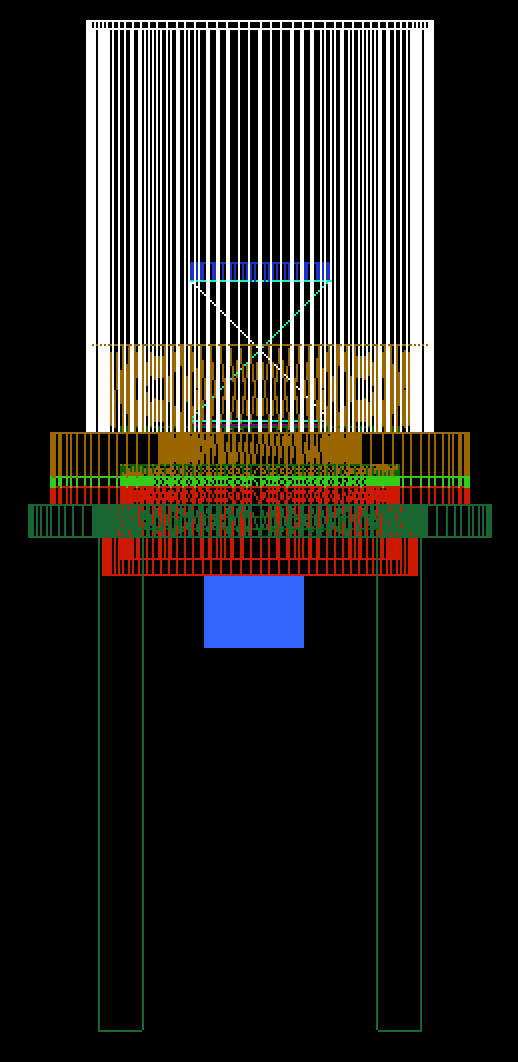
The Geant4 simulation platform was designed to emulate the experimental platform described in Sec. (2.1). Scintillator crystal dimensions, material properties, and encapsulation implemented in the simulation platform are summarised in Table (4). The SiPM array and optical pad dimensions were consistent with the experimental platform described in Sec. (2.1). Table (5) displays the optical material properties for the SiPM, optical pad, and reflective materials implemented in the simulation platform. SiPM-3000 read-out electronics, detector housing, detector holder, radioactive check source, and lab environment were included in the Geant4 application. The description, dimensions, and materials for each geometry are summarised in Table (1). Other lab components, e.g., the remaining walls, were disregarded as their contribution of Compton scattering was assumed to be negligible as they were further away from the detector. Surrounding environmental air was modelled using the builtin Geant4 material G4AIR [11]. A wire trace visualisation of the detector, detector holder, and each radioactive check source implemented in Geant4 is shown in Fig. (1(b)).
GeometryName
ComponentName
Dimensions
Materials
SiPM-3000
SiPM arrayPCB
Disc (radius, z):25.4, 1 mm
FR4
InternalPCBs (2x)
Disc (radius, z):25.4, 2 mm
Gasket
Annulus (thickness, radius, z):12.5, 38, 2 mm
RubberH8C4 gcm3
Pinconnector
Annulus (thickness, radius, z):1, 6.5, 12 mm
PlasticH6C6O2 gcm3
Plugconnector
Annulus (thickness, radius, z):3.5, 9, 13 mm
Fixture
Annulus (thickness, radius, z):20, 38, 8 mm
G4Al
Lip
Annulus (thickness, radius, z):1, 30.5, 16 mm
Join
Annulus (thickness, radius, z):12.5, 38, 3 mm
Bulk
Annulus (thickness, radius, z):3, 28.5, 13 mm
Detectorcover
Annulus (thickness, radius, z):1.25, 31.75, 75 mm
Table
Legs (4x)
Box (x, y, z):26, 26, 91 mm
Body
Annulus (thickness, x, y, z):18, 520, 520, 708 mm
MDFC:H:O50%:6%:44% gcm3
Detectorholder
Base
Annulus (thickness, radius, z):12, 42, 6 mm
PerspexH8C5O gcm3
Legs (4x)
Box (x, y, z):6, 8, 90 mm
Radioactivecheck source
–
Disc (radius, z):12.7, 3.2 mm
Environment
Wall 1
Box (x, y, z):1, 1.45, 3 m
G4CONCRETE
Wall 2
Box (x, y, z):1, 3, 3 m
Floor
Box (x, y, z):world x, world y, 1 m
Table 1: Name, dimensions, and materials of the SiPM-3000 and surrounding geometries implemented in the Geant4 application.
2.3 Geant4 Application Physics and Optical Surface Modelling
The Geant4 physics constructor QGSPBICHPEMZ was used to model the gamma ray, X-ray, and electron transport in the simulation platform [8, 11, 12]. The settings for radioactive decay, atomic de-excitation, PIXE, auger electrons, and fluorescence were enabled. Moreover, the particle production length cut was set to 100 m and the low energy cut off was fixed at 100 eV. Optical photon generation and transportation through scintillation, absorption, refraction, and reflection were modelled using the Geant4 implementation of the Unified model [11, 13]. Optical surfaces in contact with the Teflon tape, ESR, and GORE diffuse reflector were defined as ‘dielectric-to-metal’, whereas the remaining surfaces were defined using the ‘dielectric-to-dielectric’ surface type. All optical surfaces were assumed to be highly polished and characterised by a ground finish featuring a 0.1-degree surface roughness [12, 14, 15].
2.4 Geant4 Application Validation Simulations and Figures of Merit
The simulation platform was used to model twenty million radioactive decays for each radioactive source and scintillator crystal combination, totaling 25 simulations. For these simulations, the isotope particle gun was positioned at the centre of each radioactive check source to approximate the isotope location. The optical photons produced by the scintillator crystals were scored by the SiPM array according to the integration time and wavelength-dependent PDE. The integration times were consistent with the experiments as described in Sec. (2.1), and the PDE data was interpolated for an overvoltage of 4.5 V using the 3.5 V and 8 V overvoltage from the AFBR-S4N66C013 SiPM array data sheet [10]. Energy calibration was implemented by least squares fitting photopeak centroids to the corresponding gamma ray energy and setting the minimum energy for the simulated data as the experimental low-level detection threshold. Quadratic functions were fit to the centroids of 109Cd, 137Cs, and 22Na for GAGG:Ce, CLLBC:Ce, NaI:Tl, and CsI:Tl. A linear function was fit to the 137Cs and 22Na centroids for BGO as the 109Cd centroid was filtered by the low-level detection threshold.
Two figures of merit were selected to benchmark the Geant4 application: full width half maximum (FWHM) and normalised cross-correlation coefficient (NCCC). The FWHM was used to quantify the performance of photopeaks in the simulation platform. It was calculated from the standard deviation of a Gaussian function with a quadratic background that was fit to each photopeak using linear least squares. The NCCC was used to quantify the overall performance of the simulated energy spectrum compared to the experimental energy spectrum :
(1)
where values greater than 0.995, 0.999, and 0.9999 indicate ‘fair’, ‘good’, and ‘excellent’ fits respectively [16, 17]. For the NCCC calculations, the experimental energies were used as the spectral channels in Eq. (1) and the corresponding simulation counts were determined via interpolation.
3 Results and Discussion
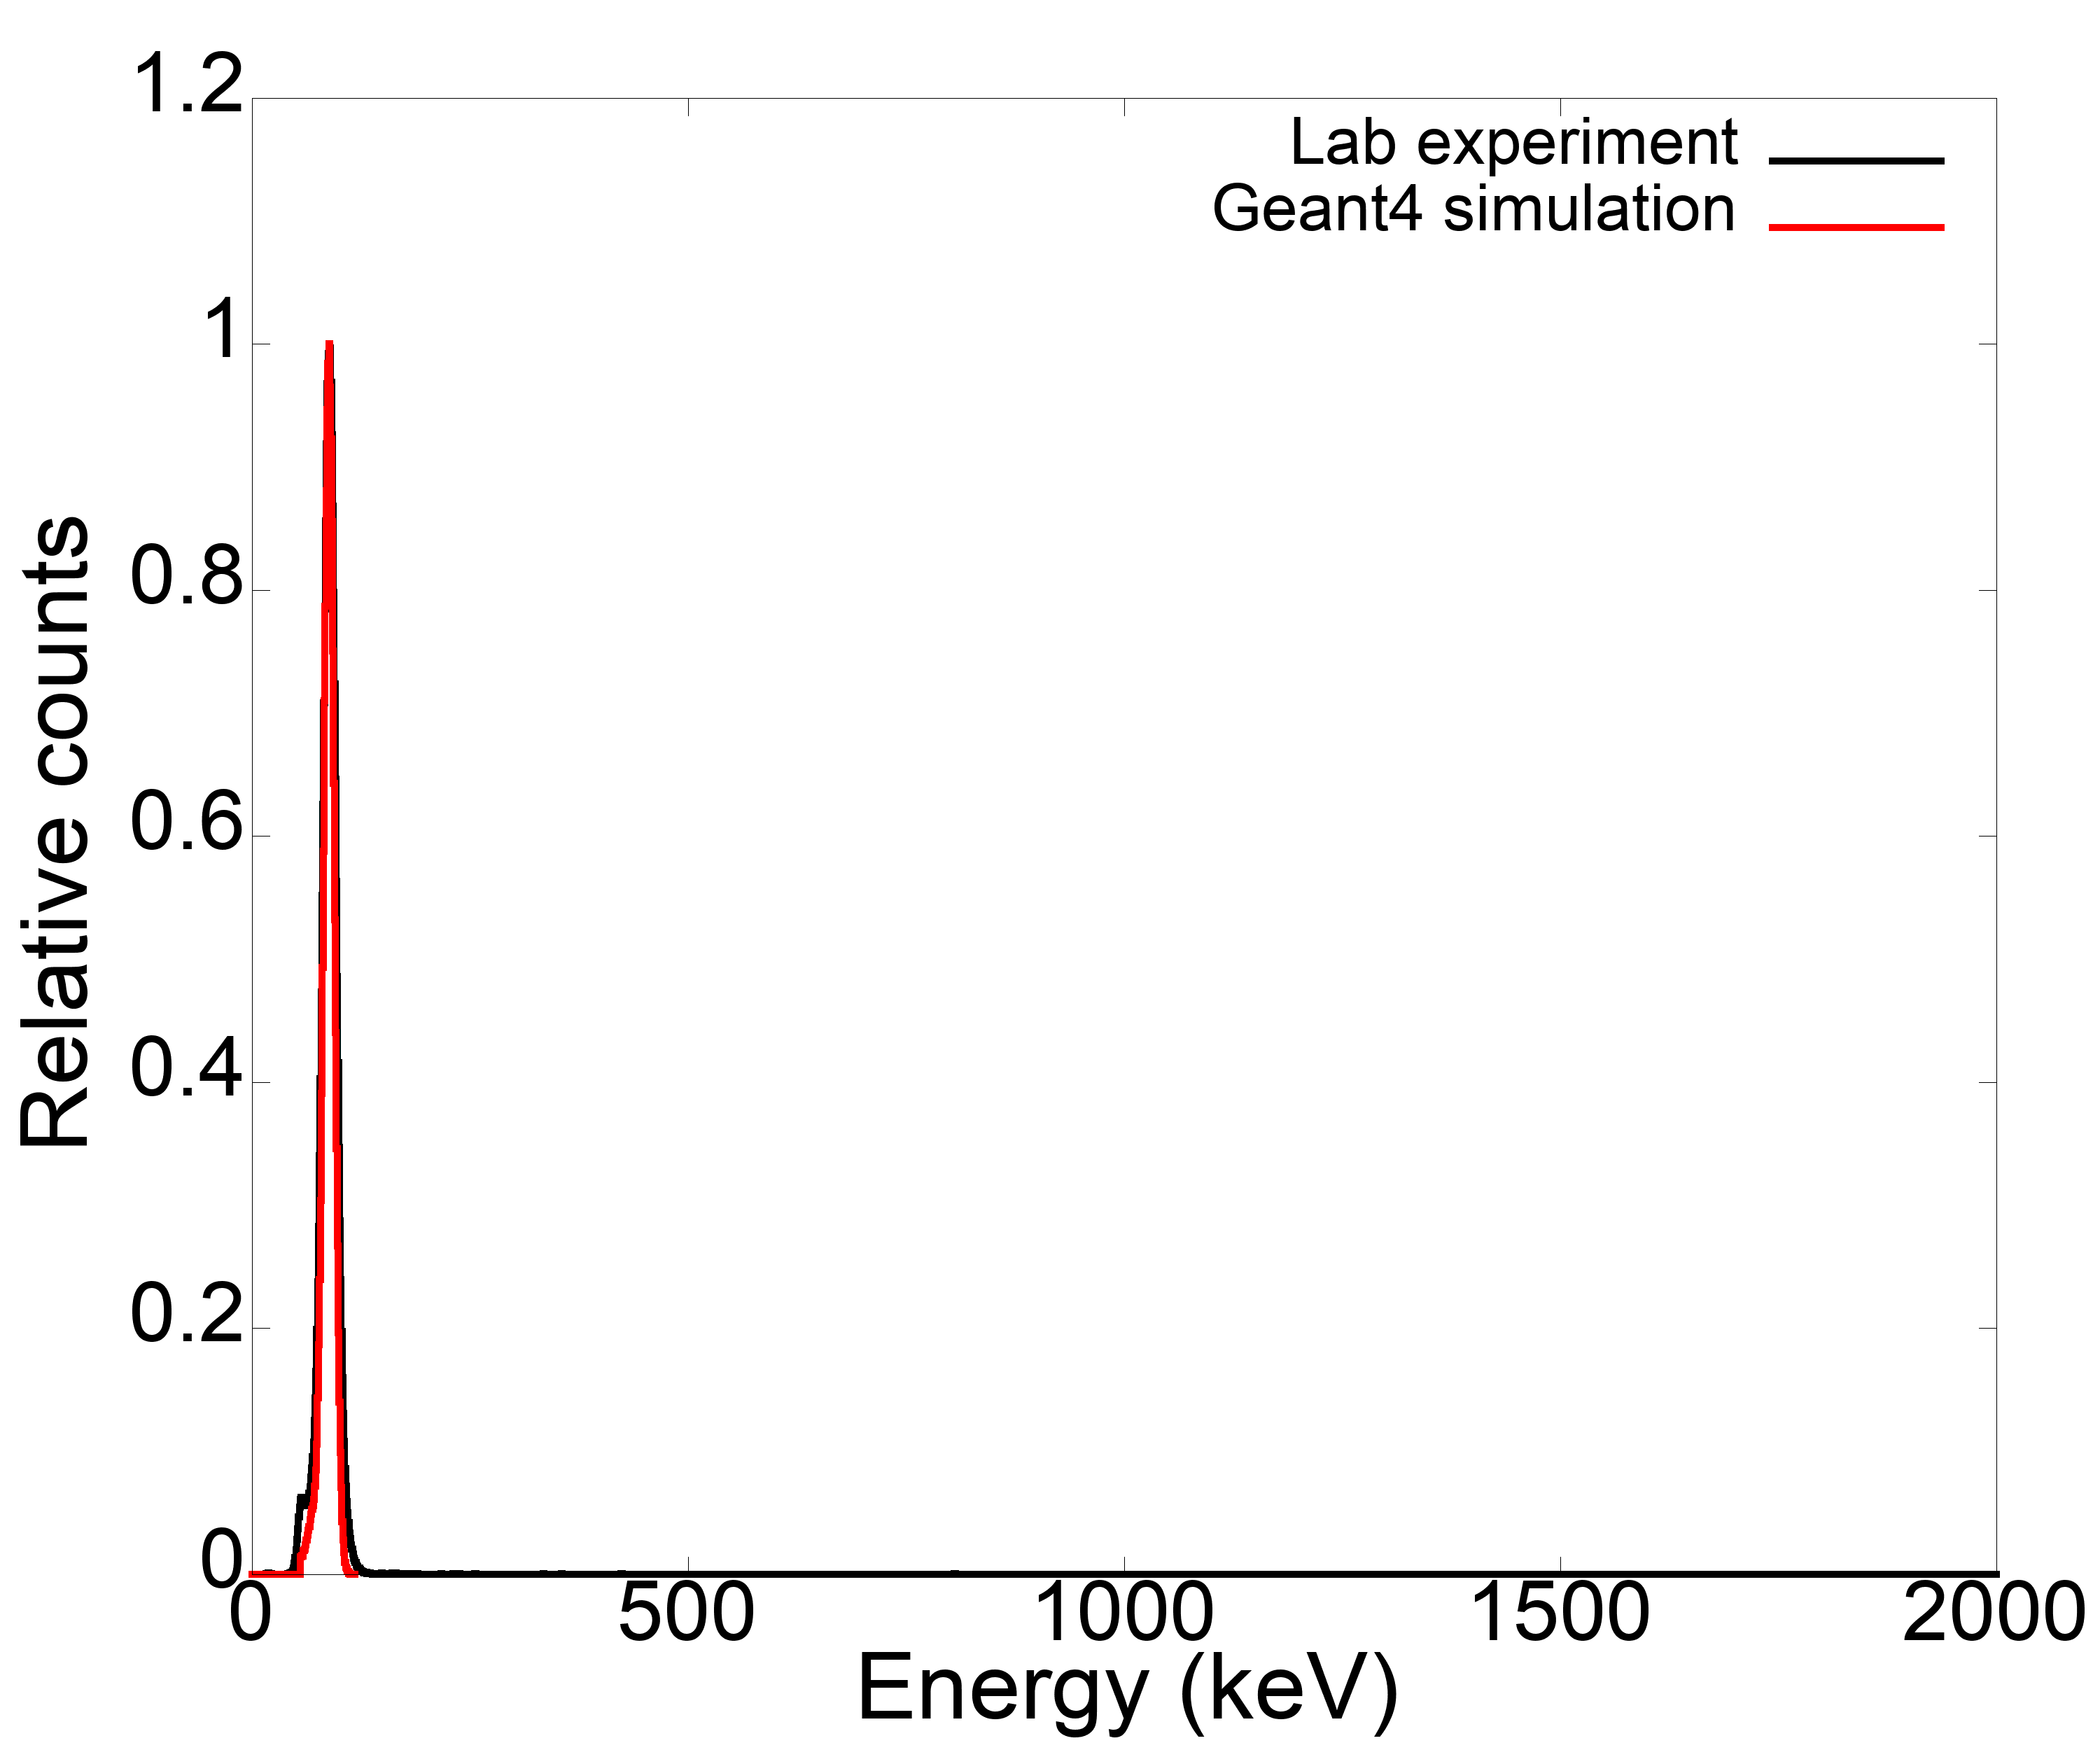
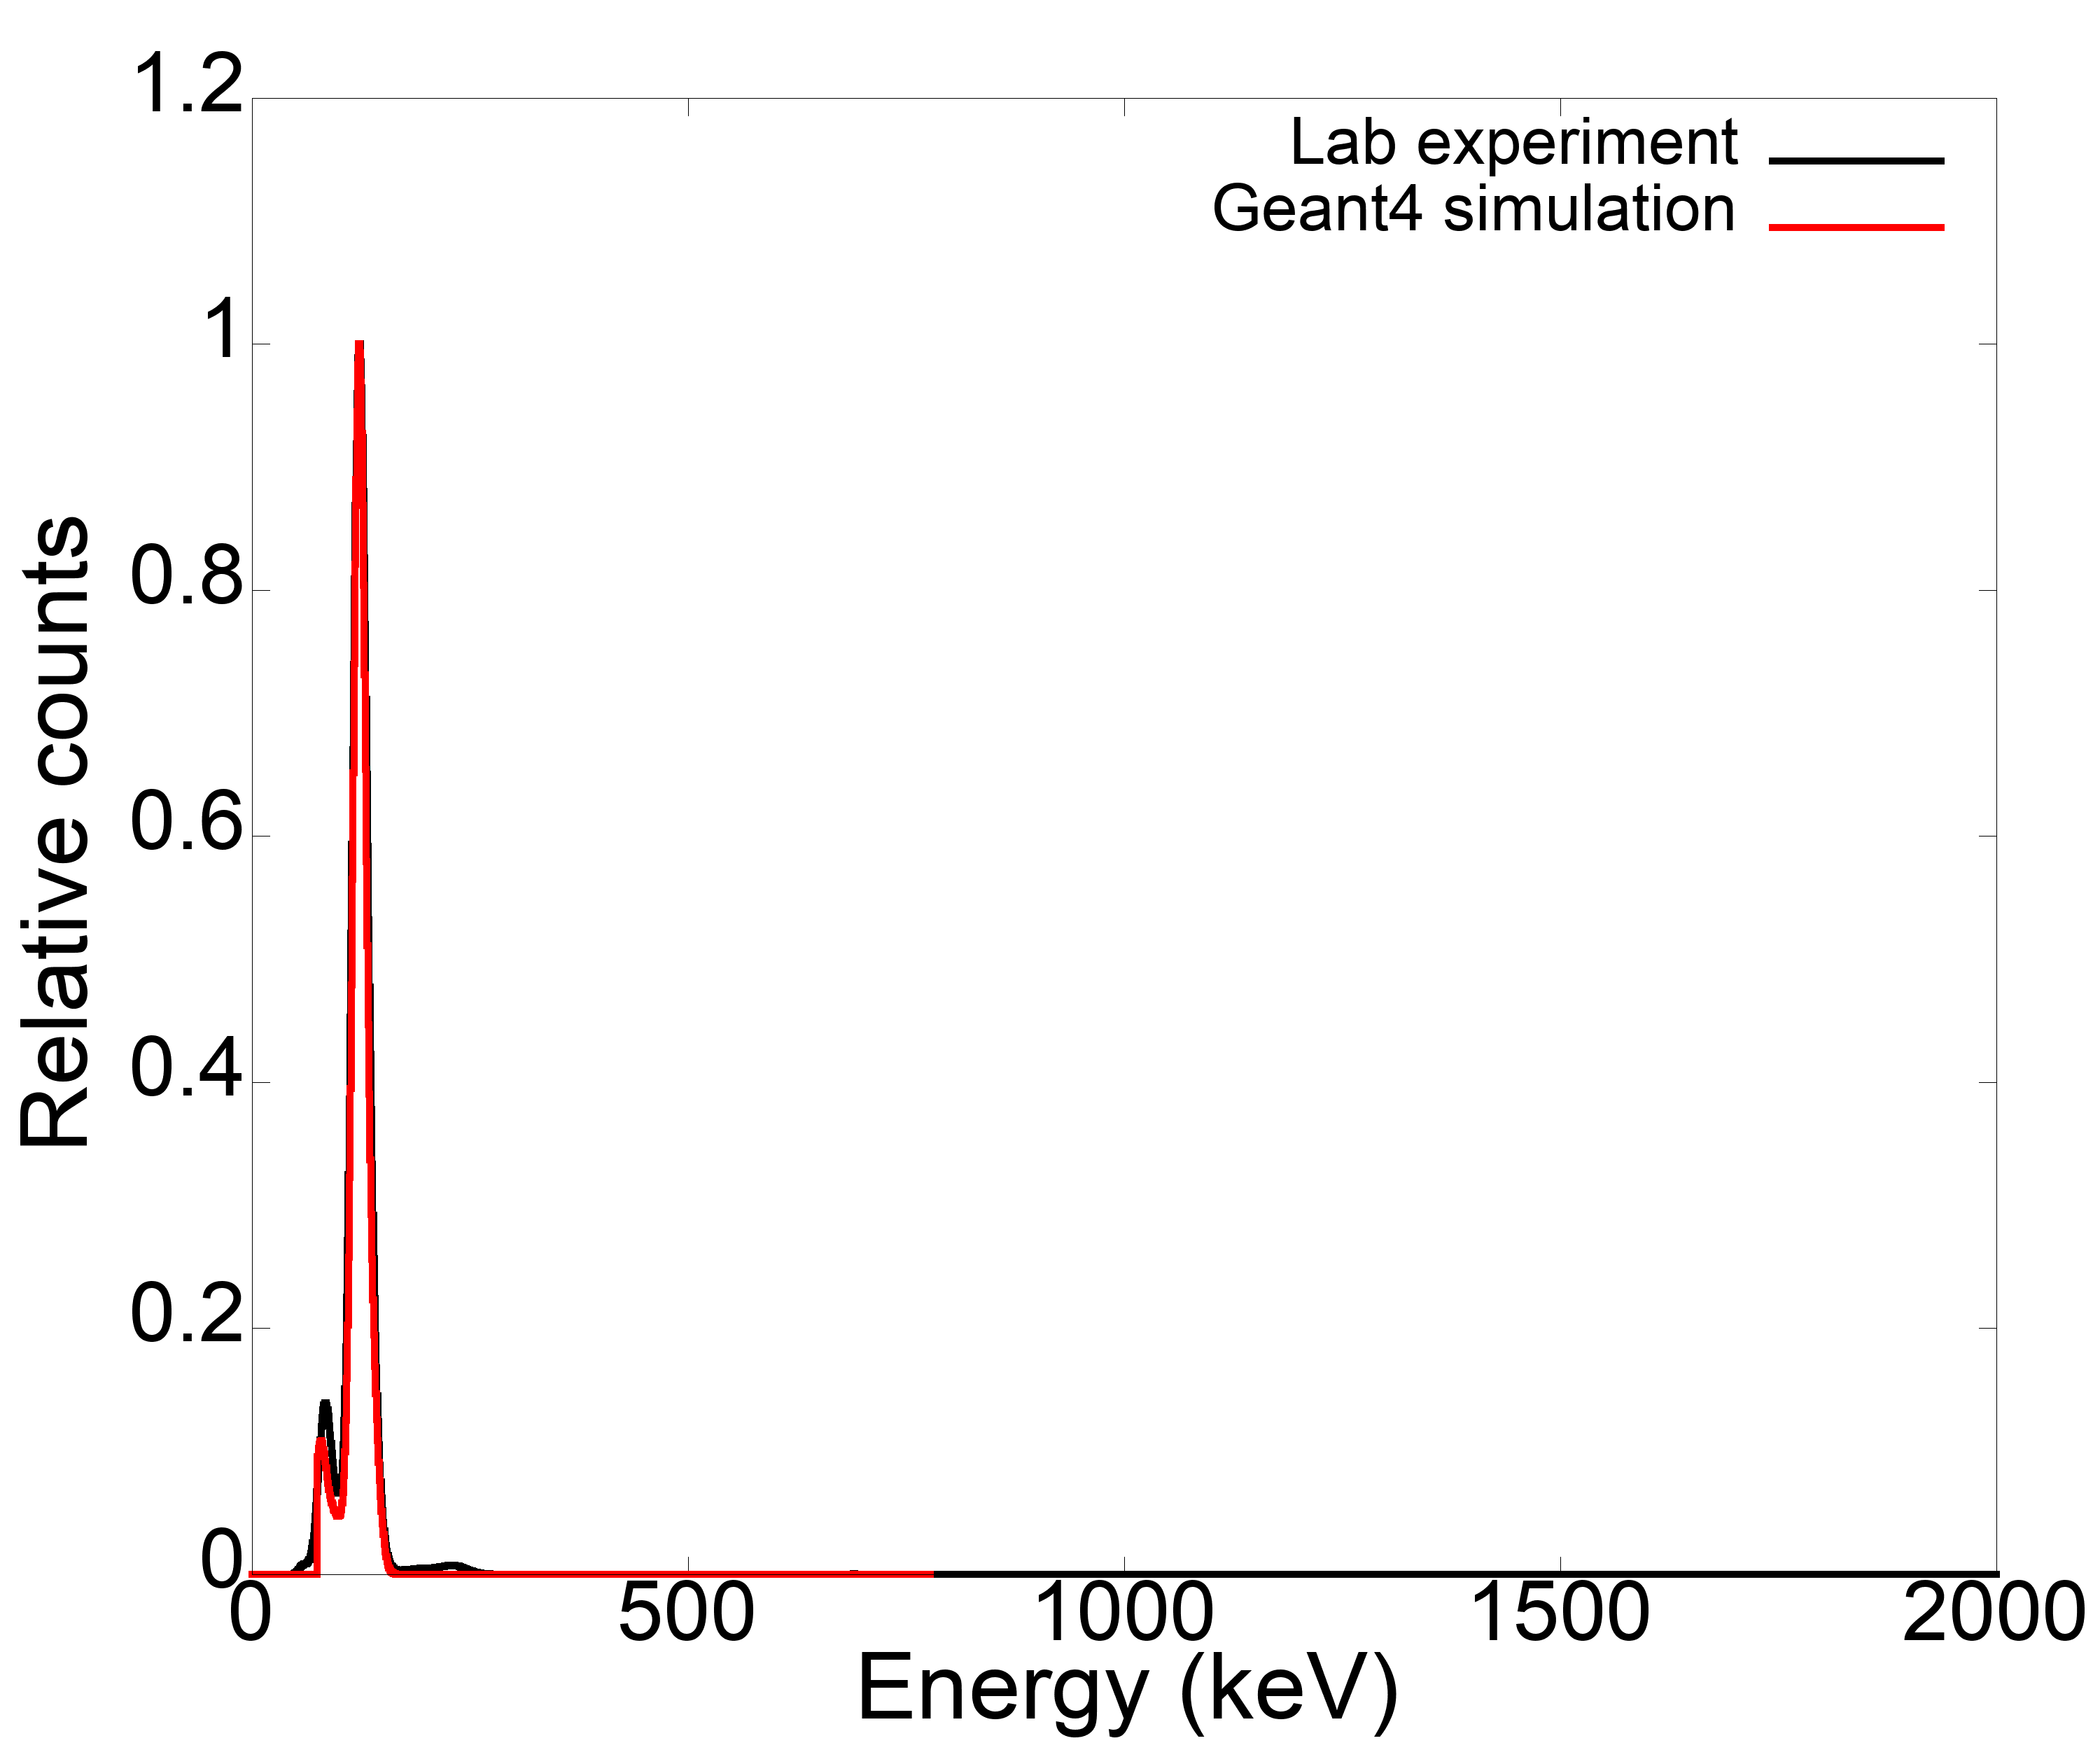
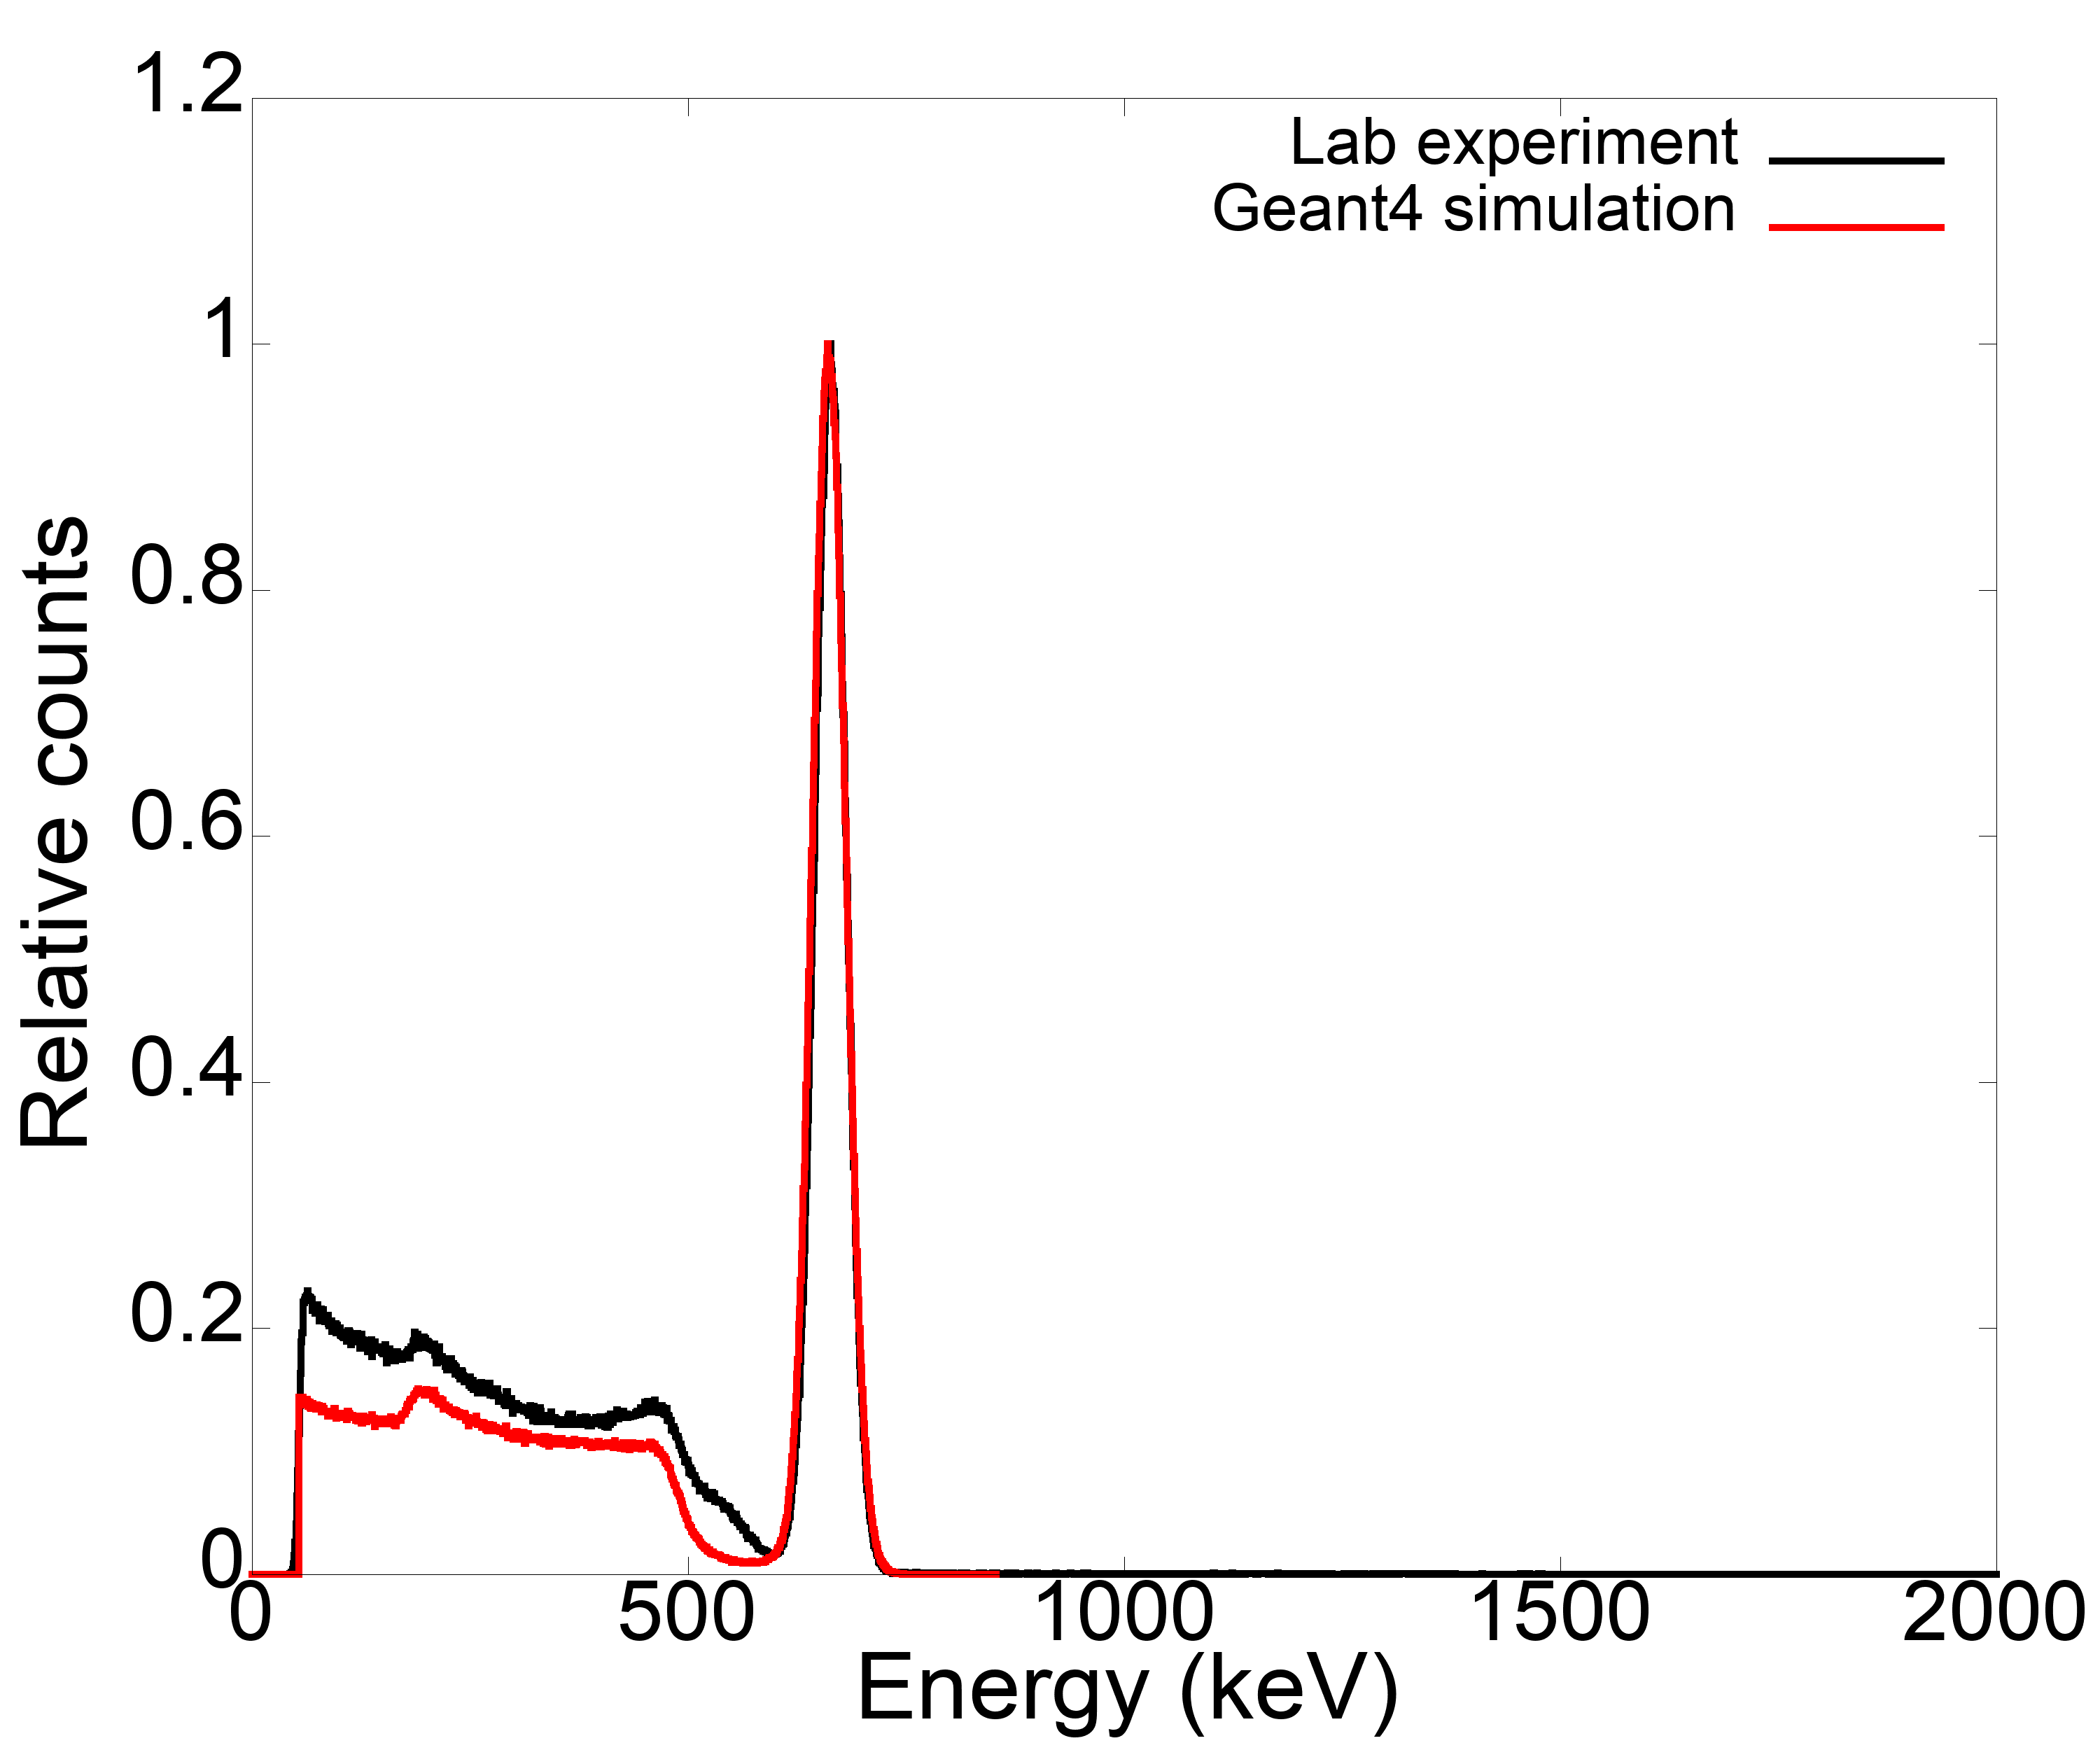
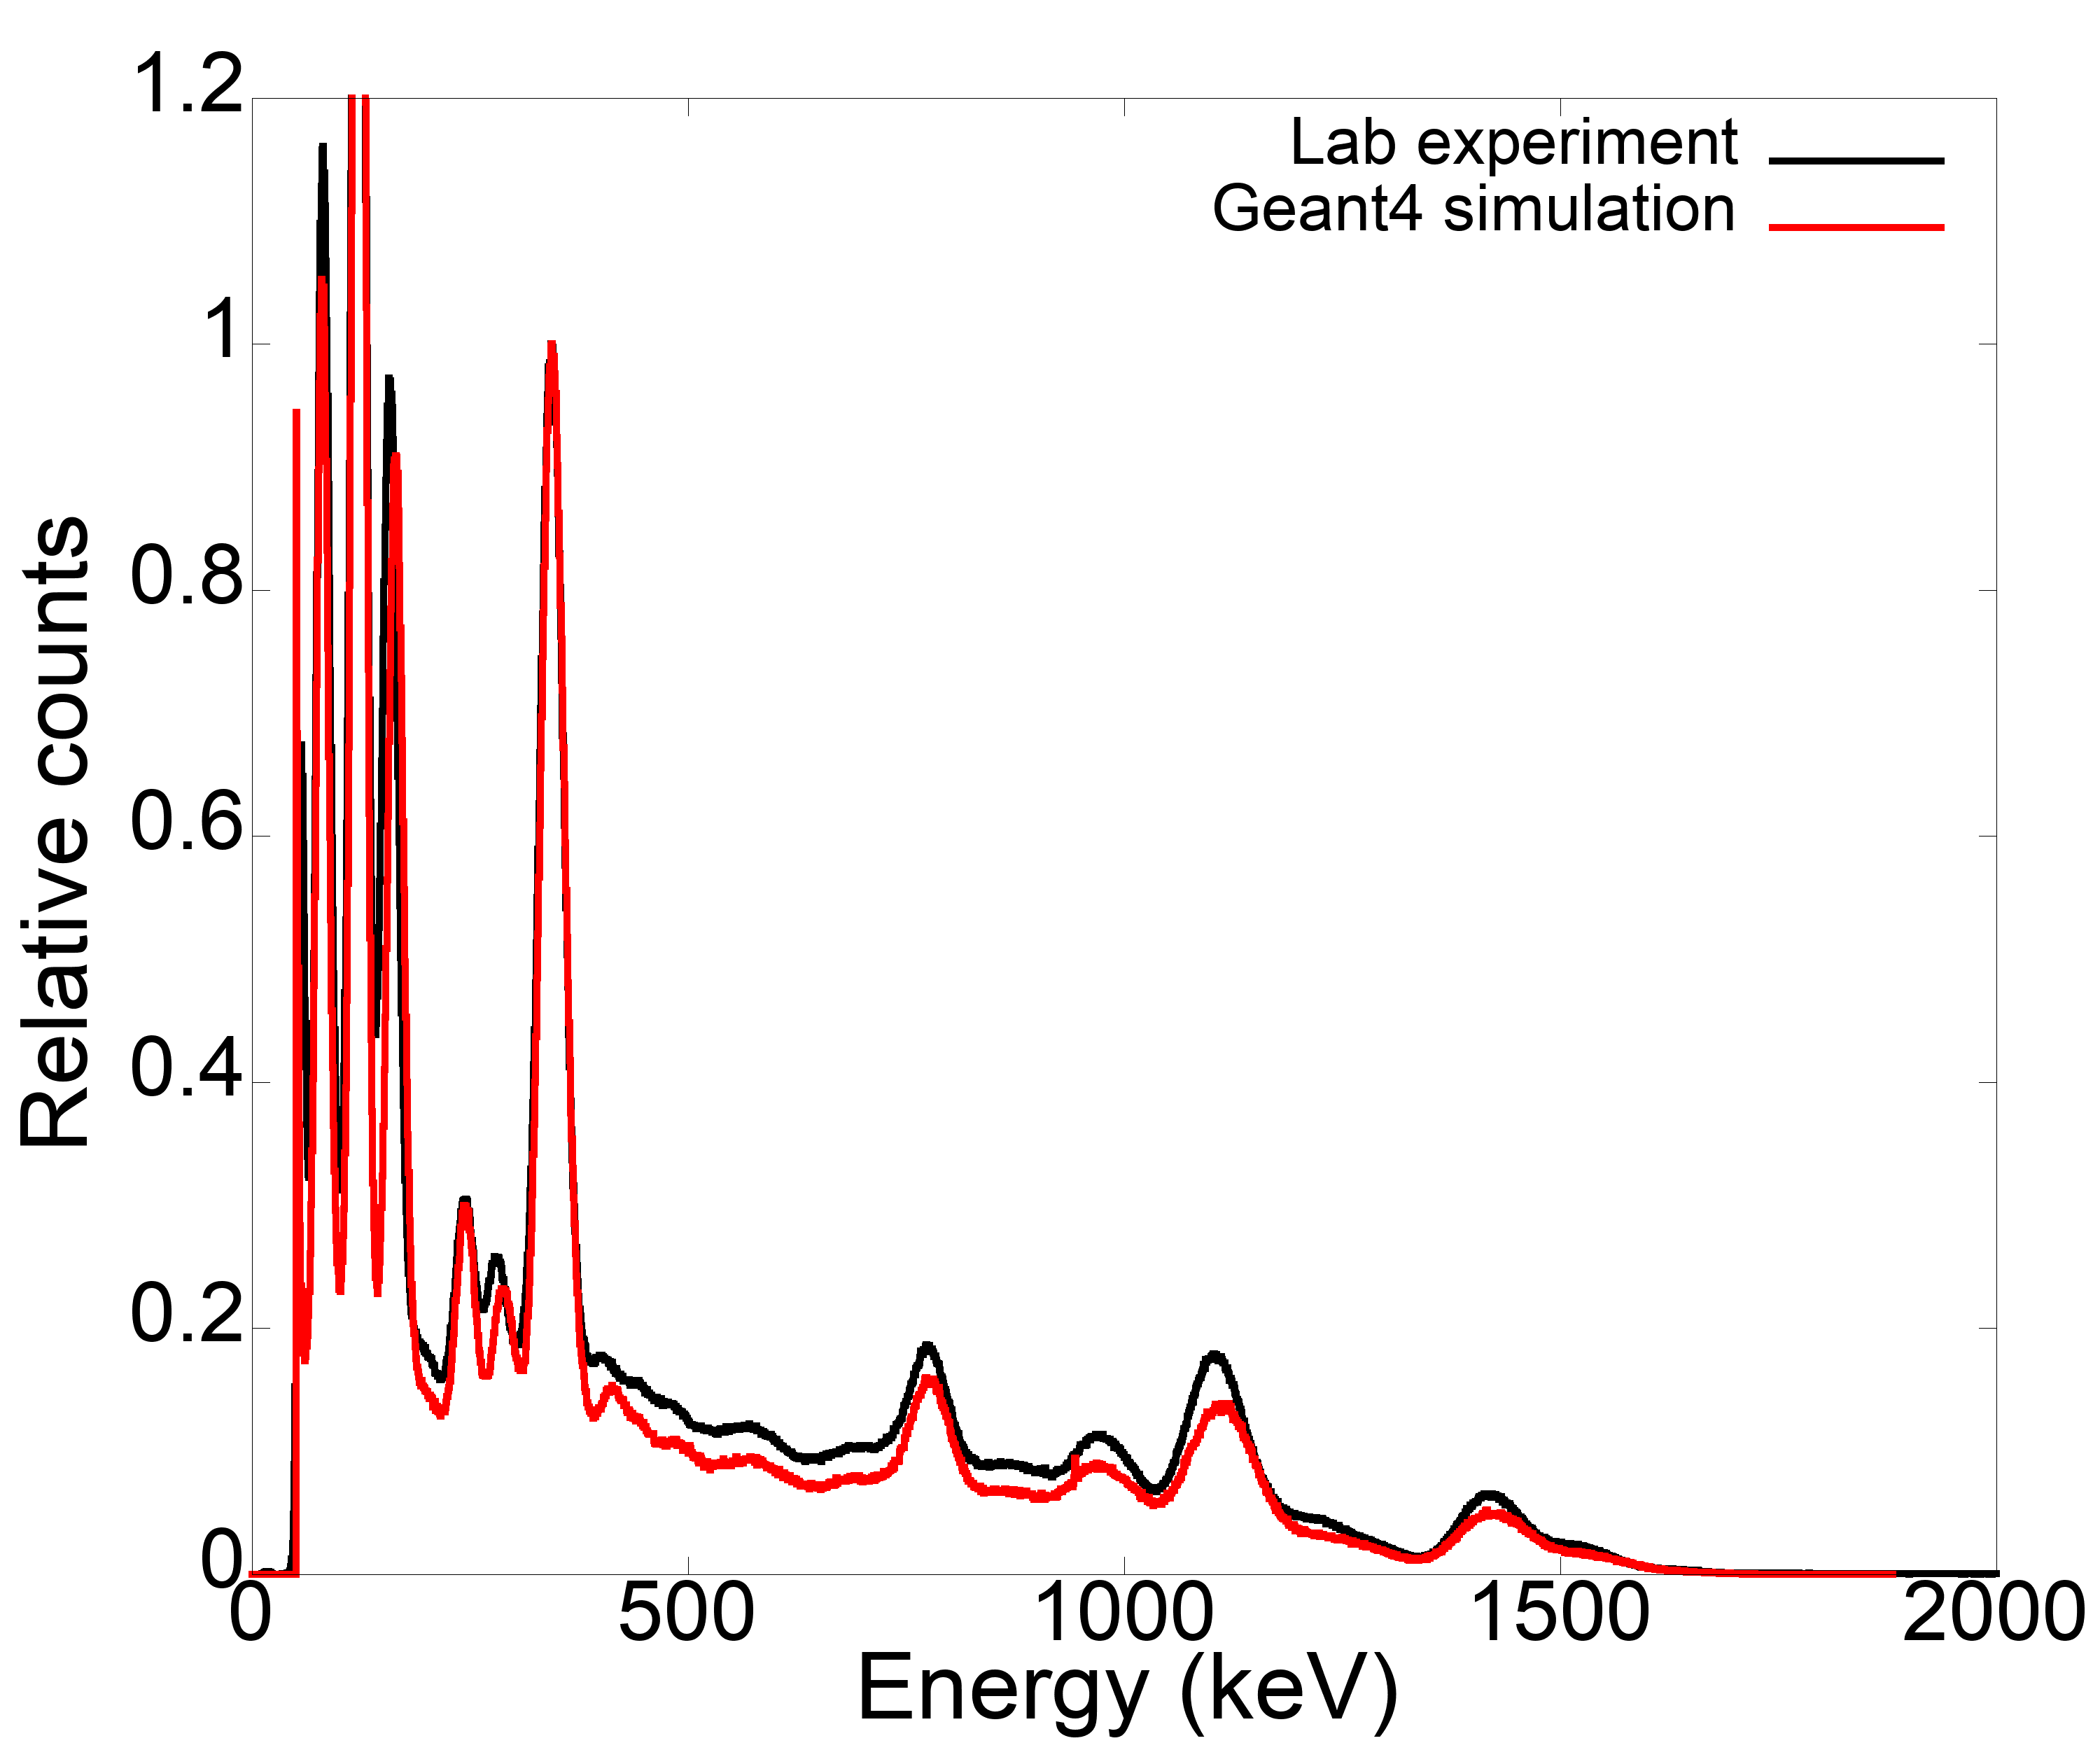
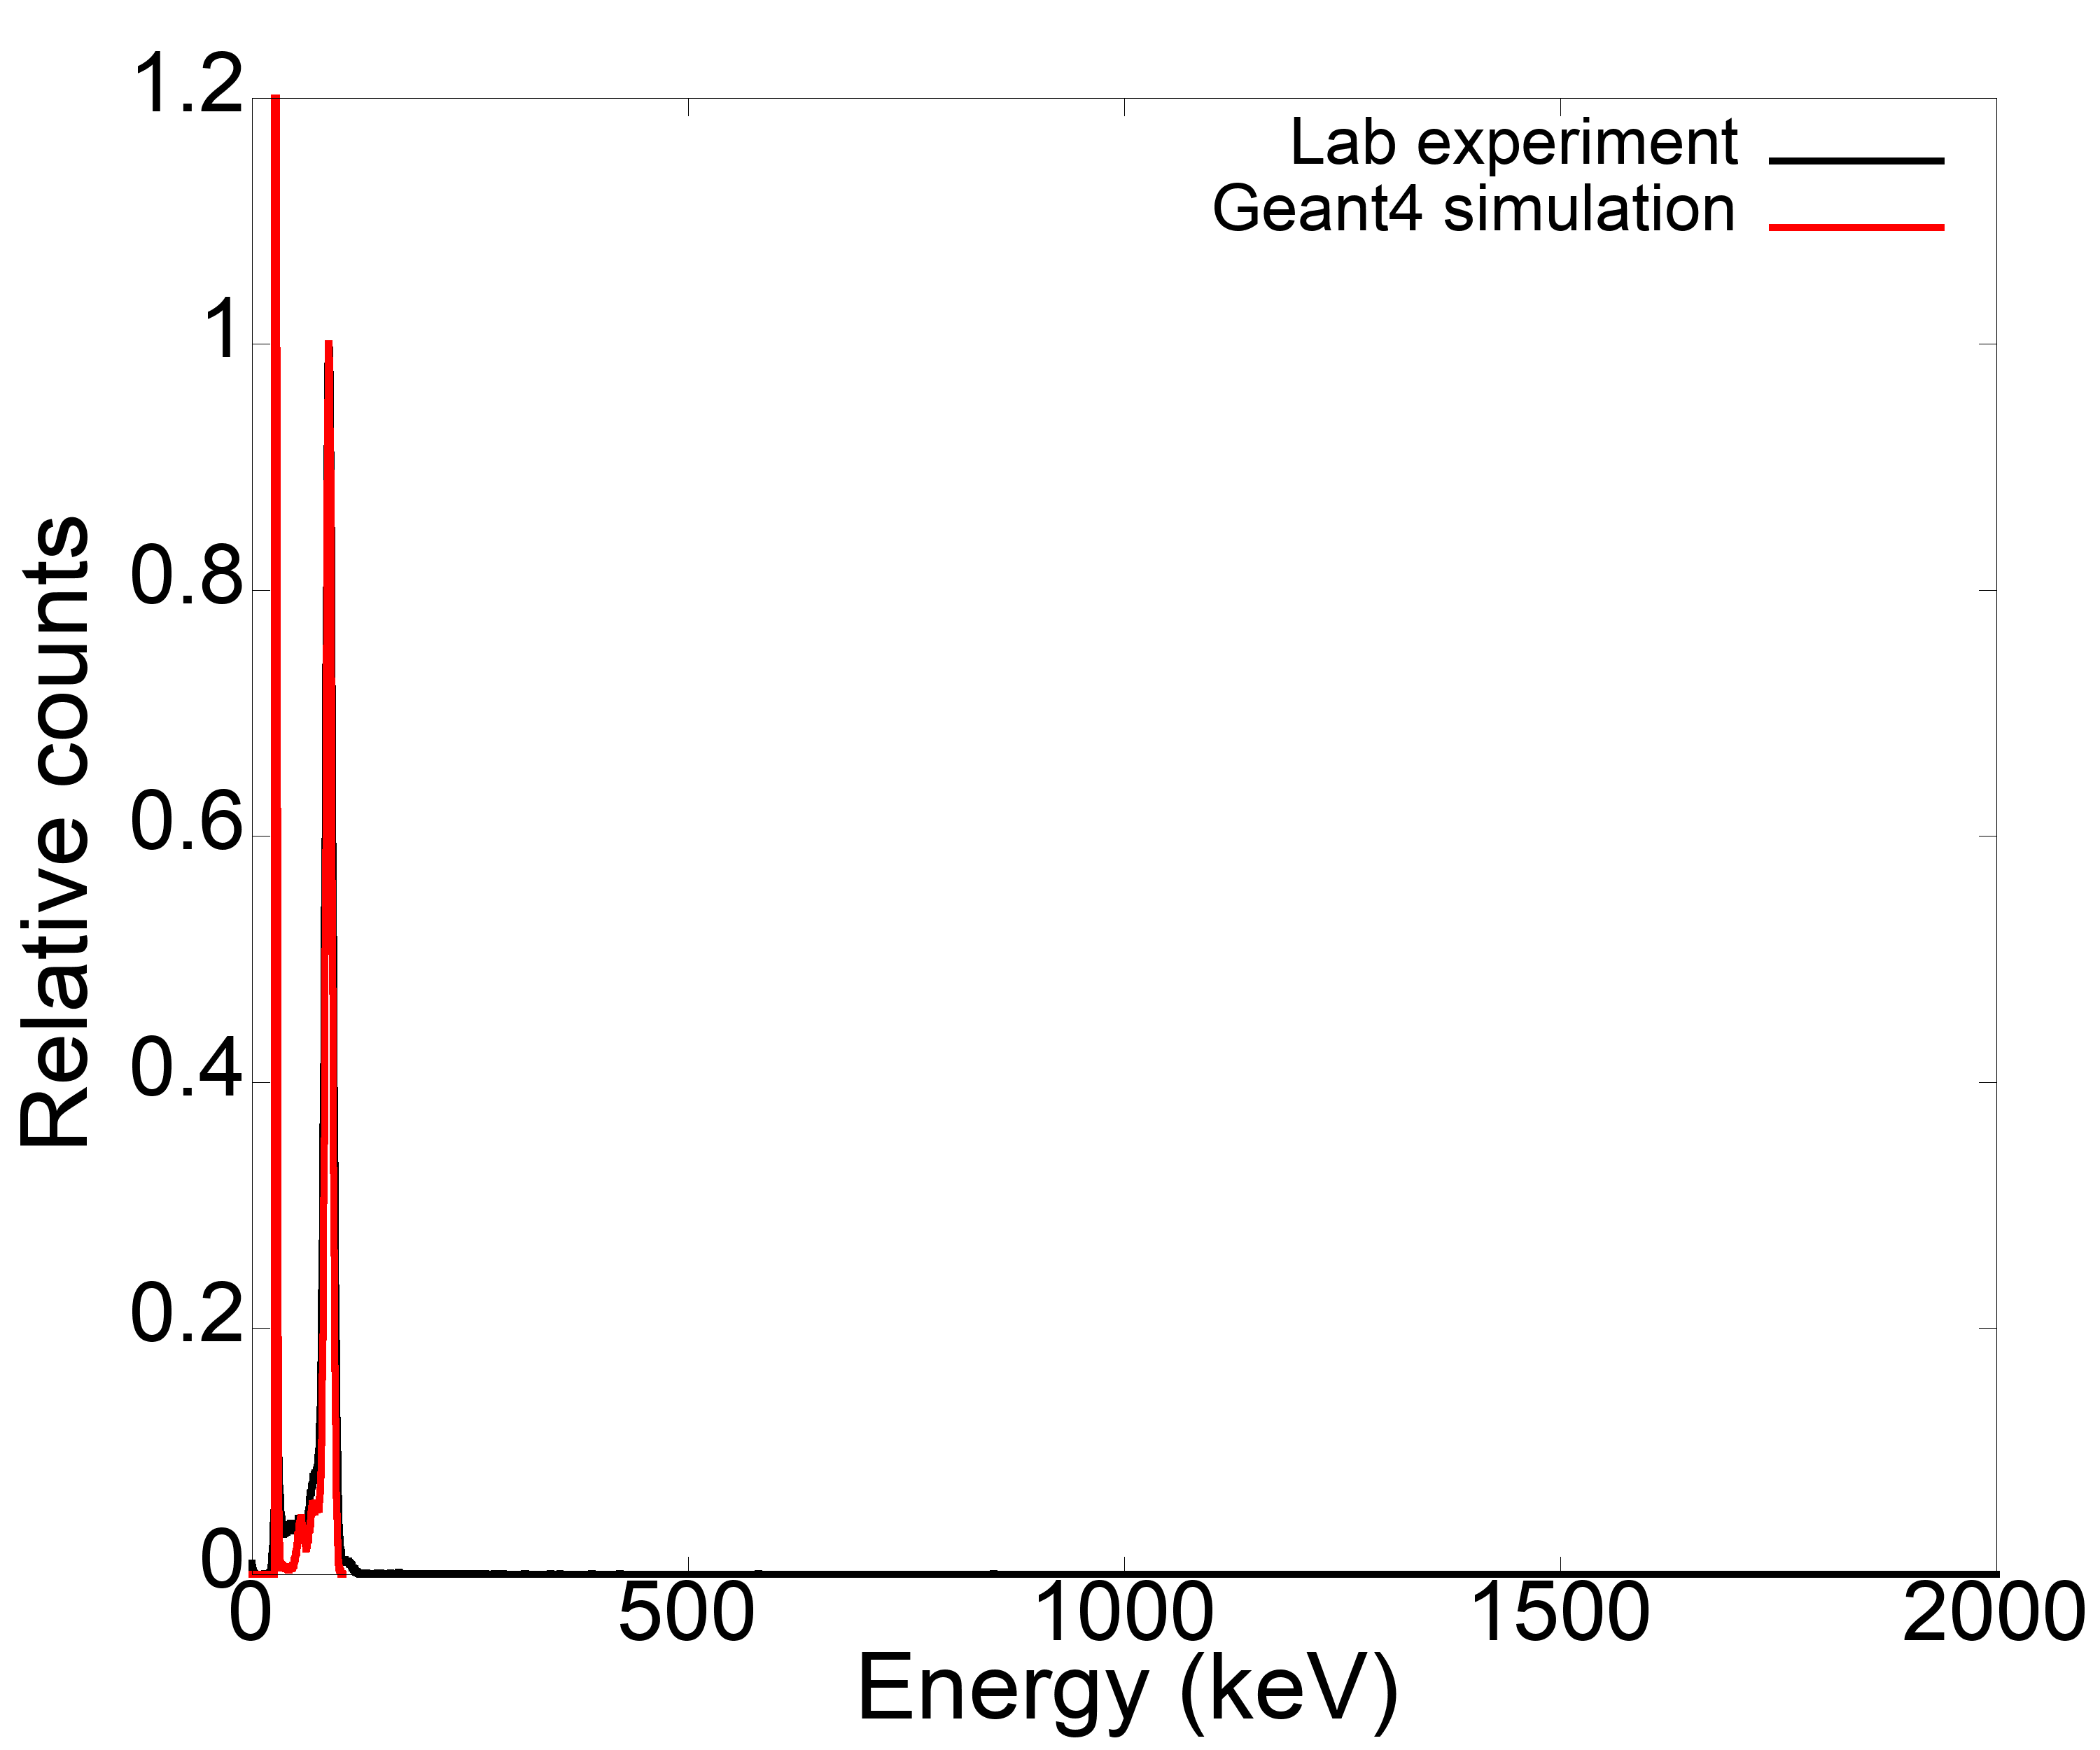
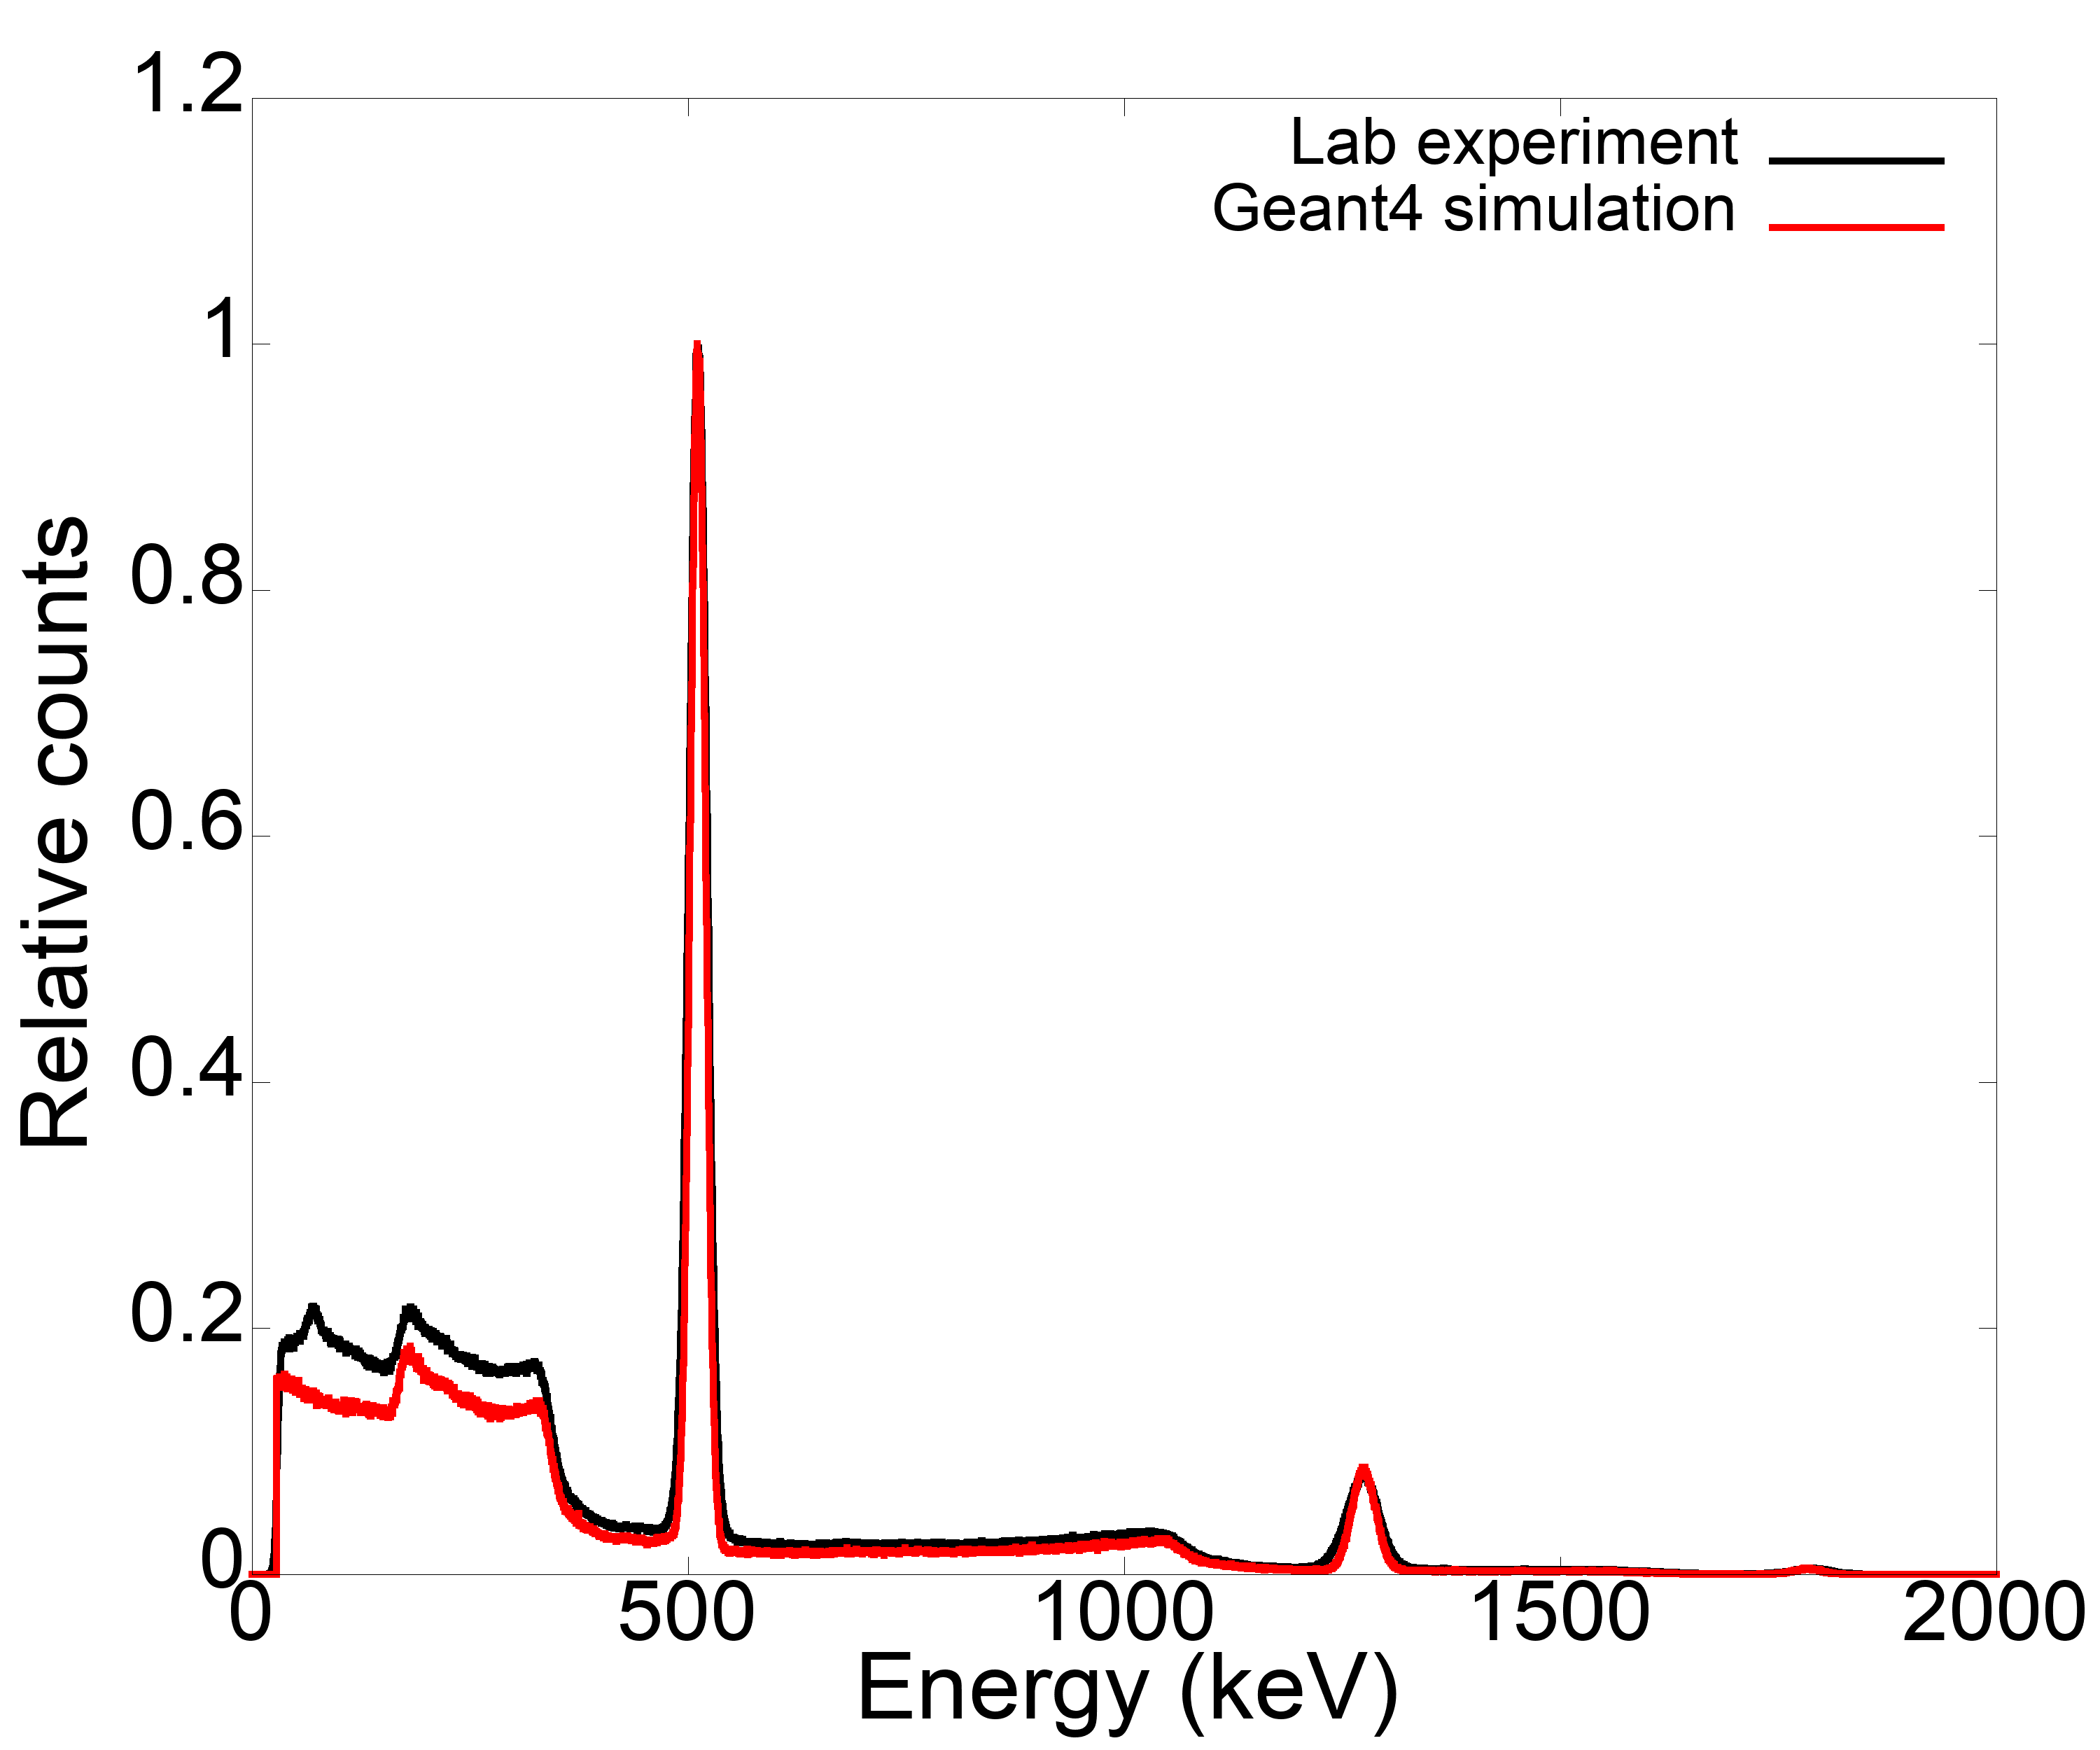
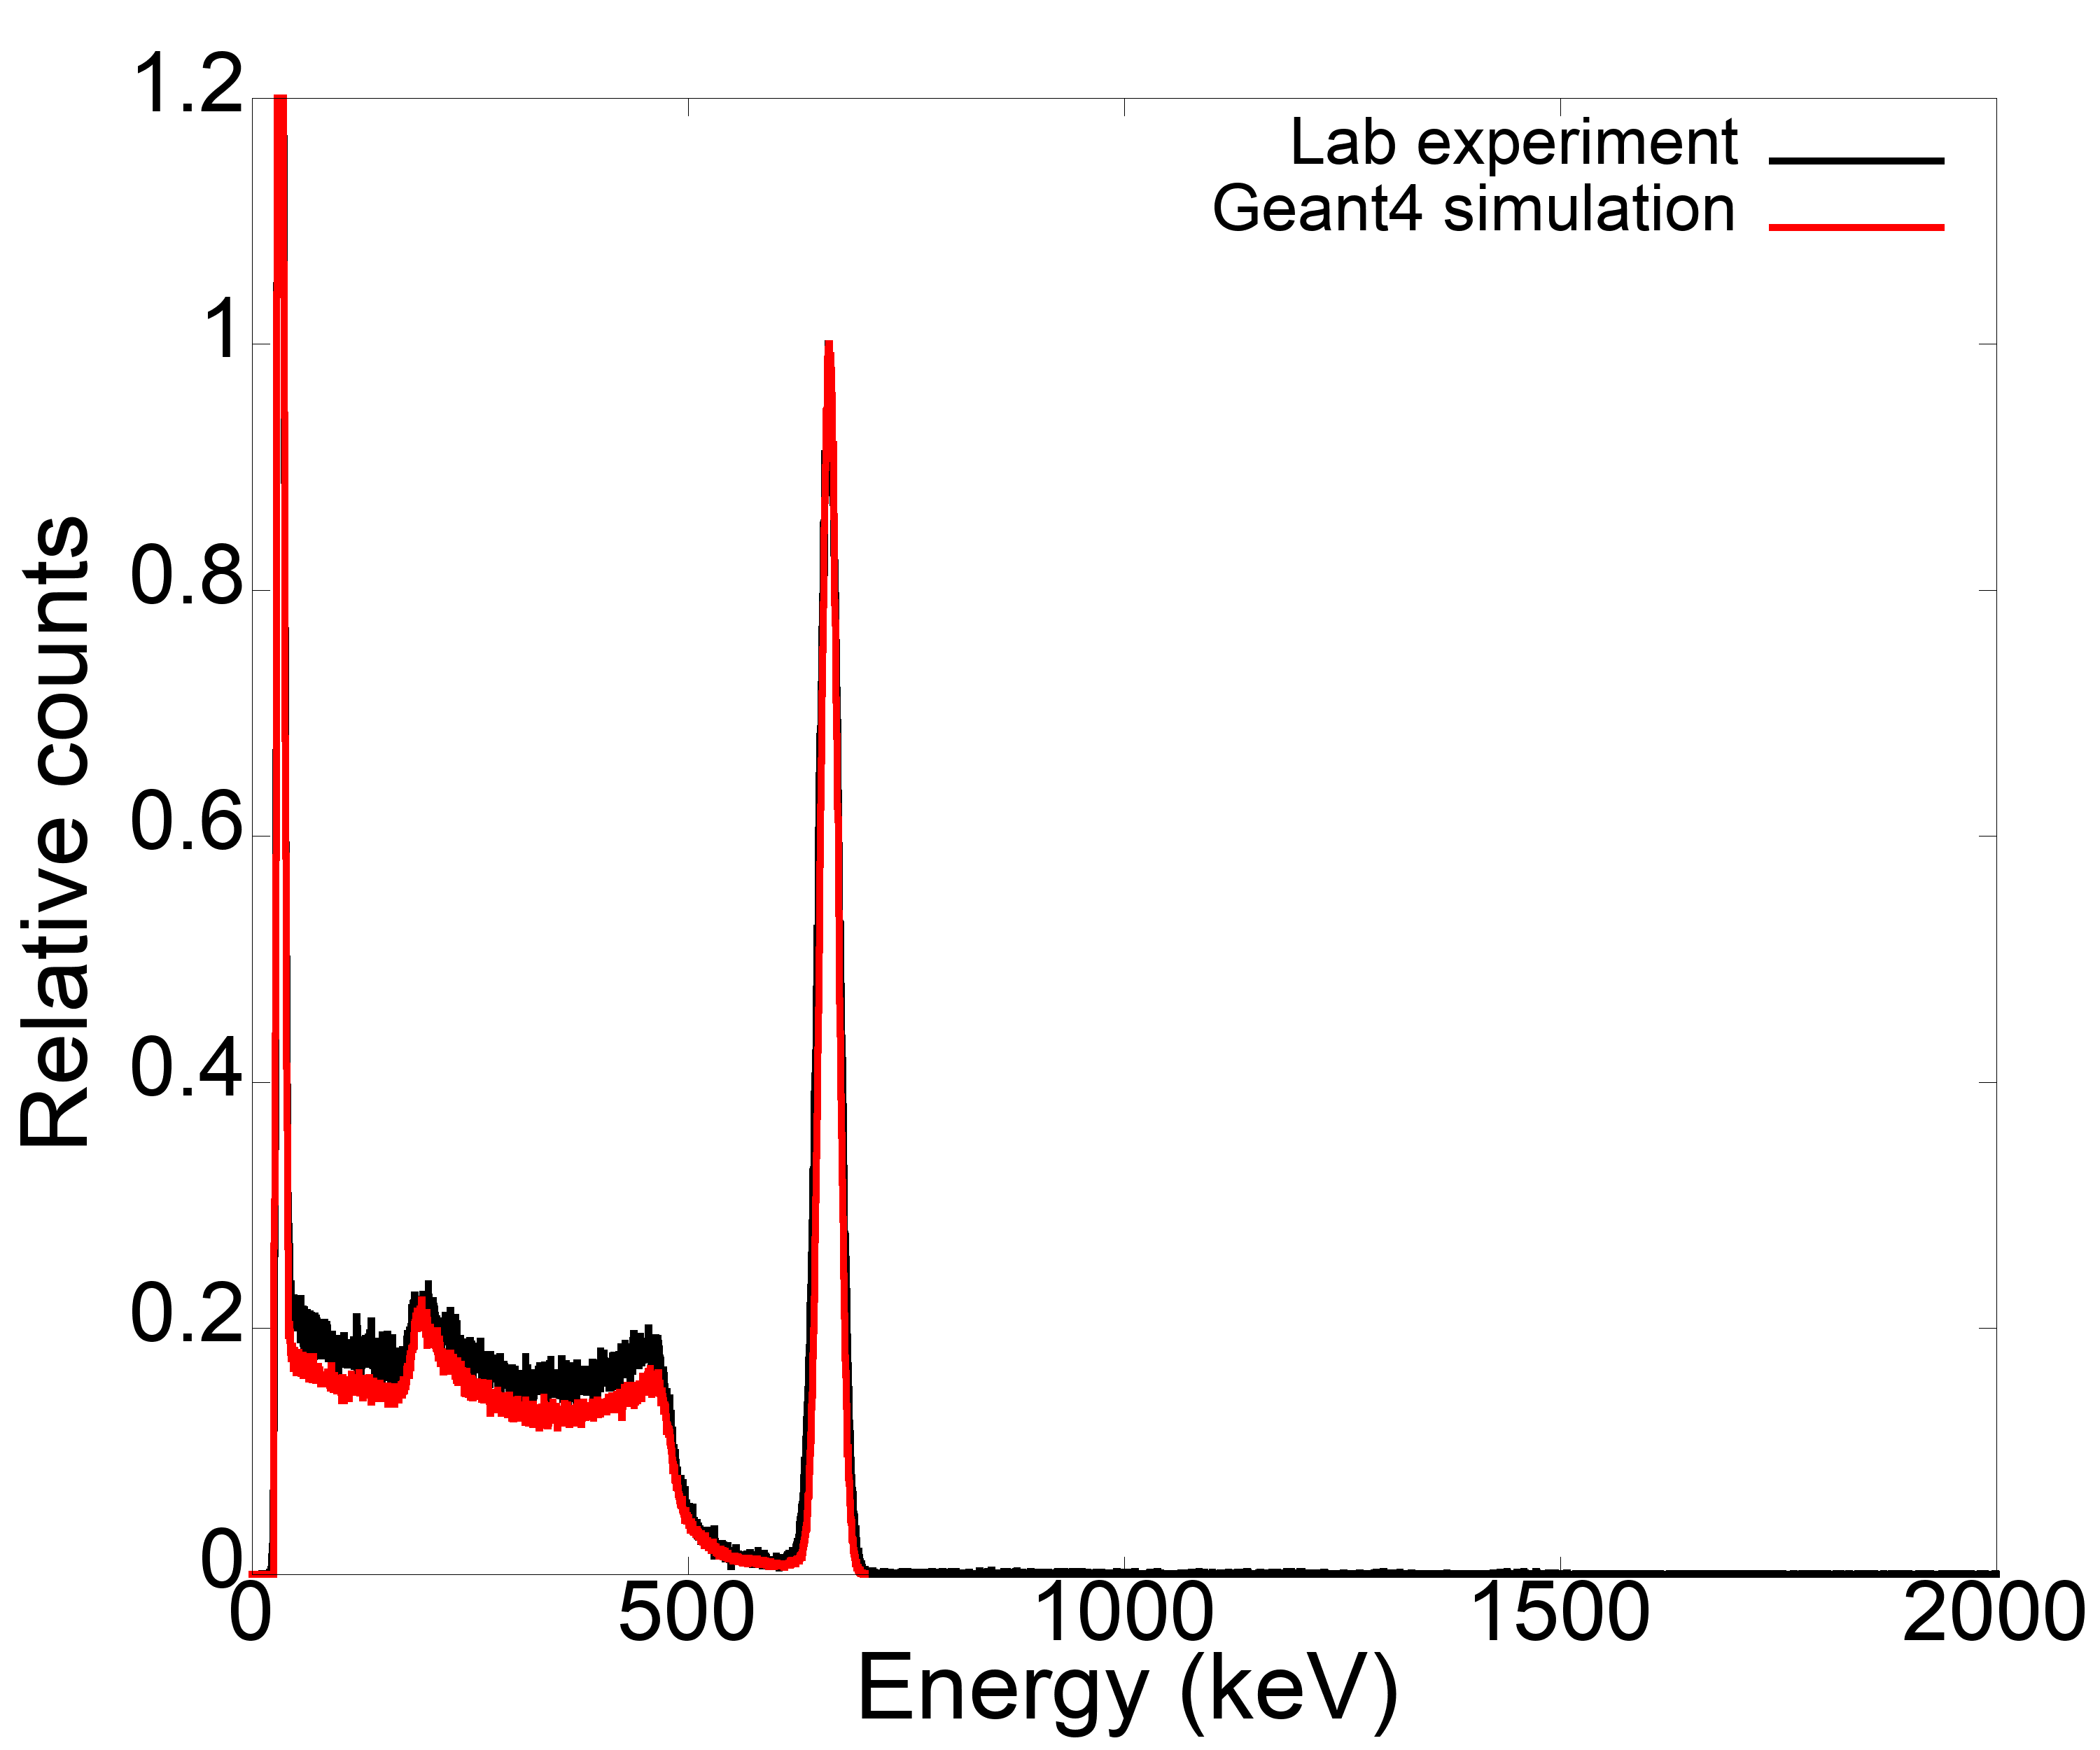
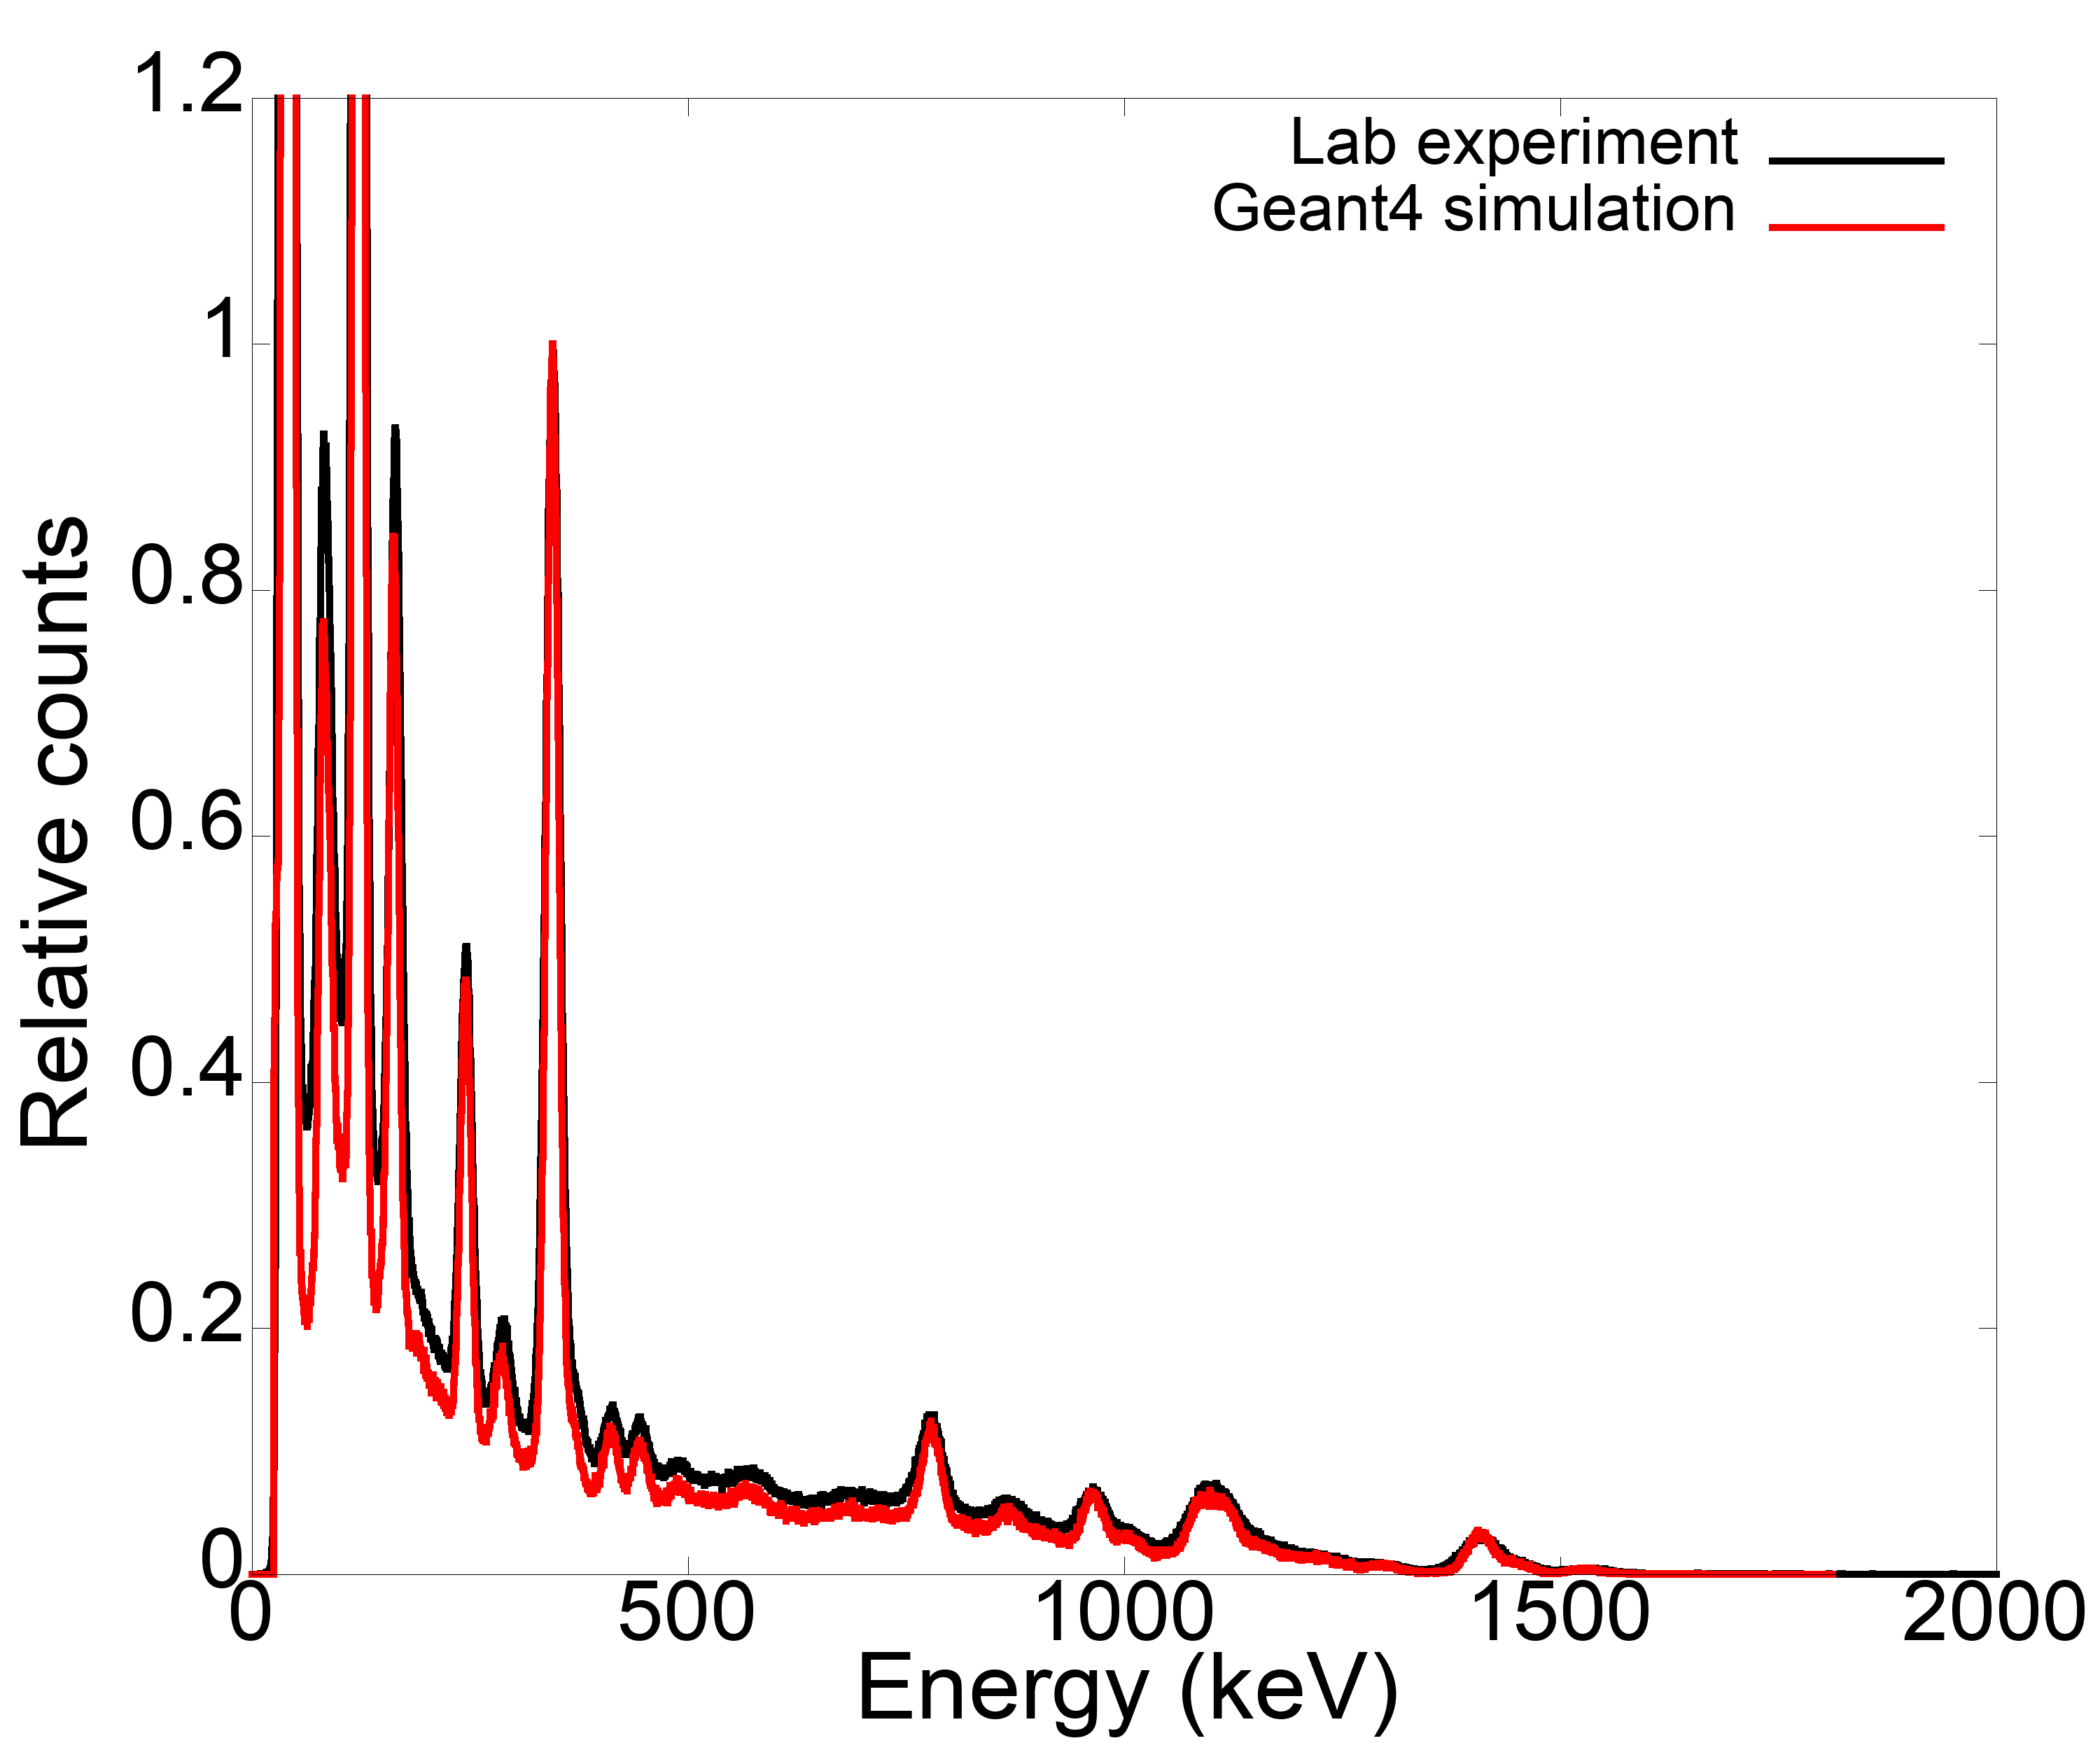
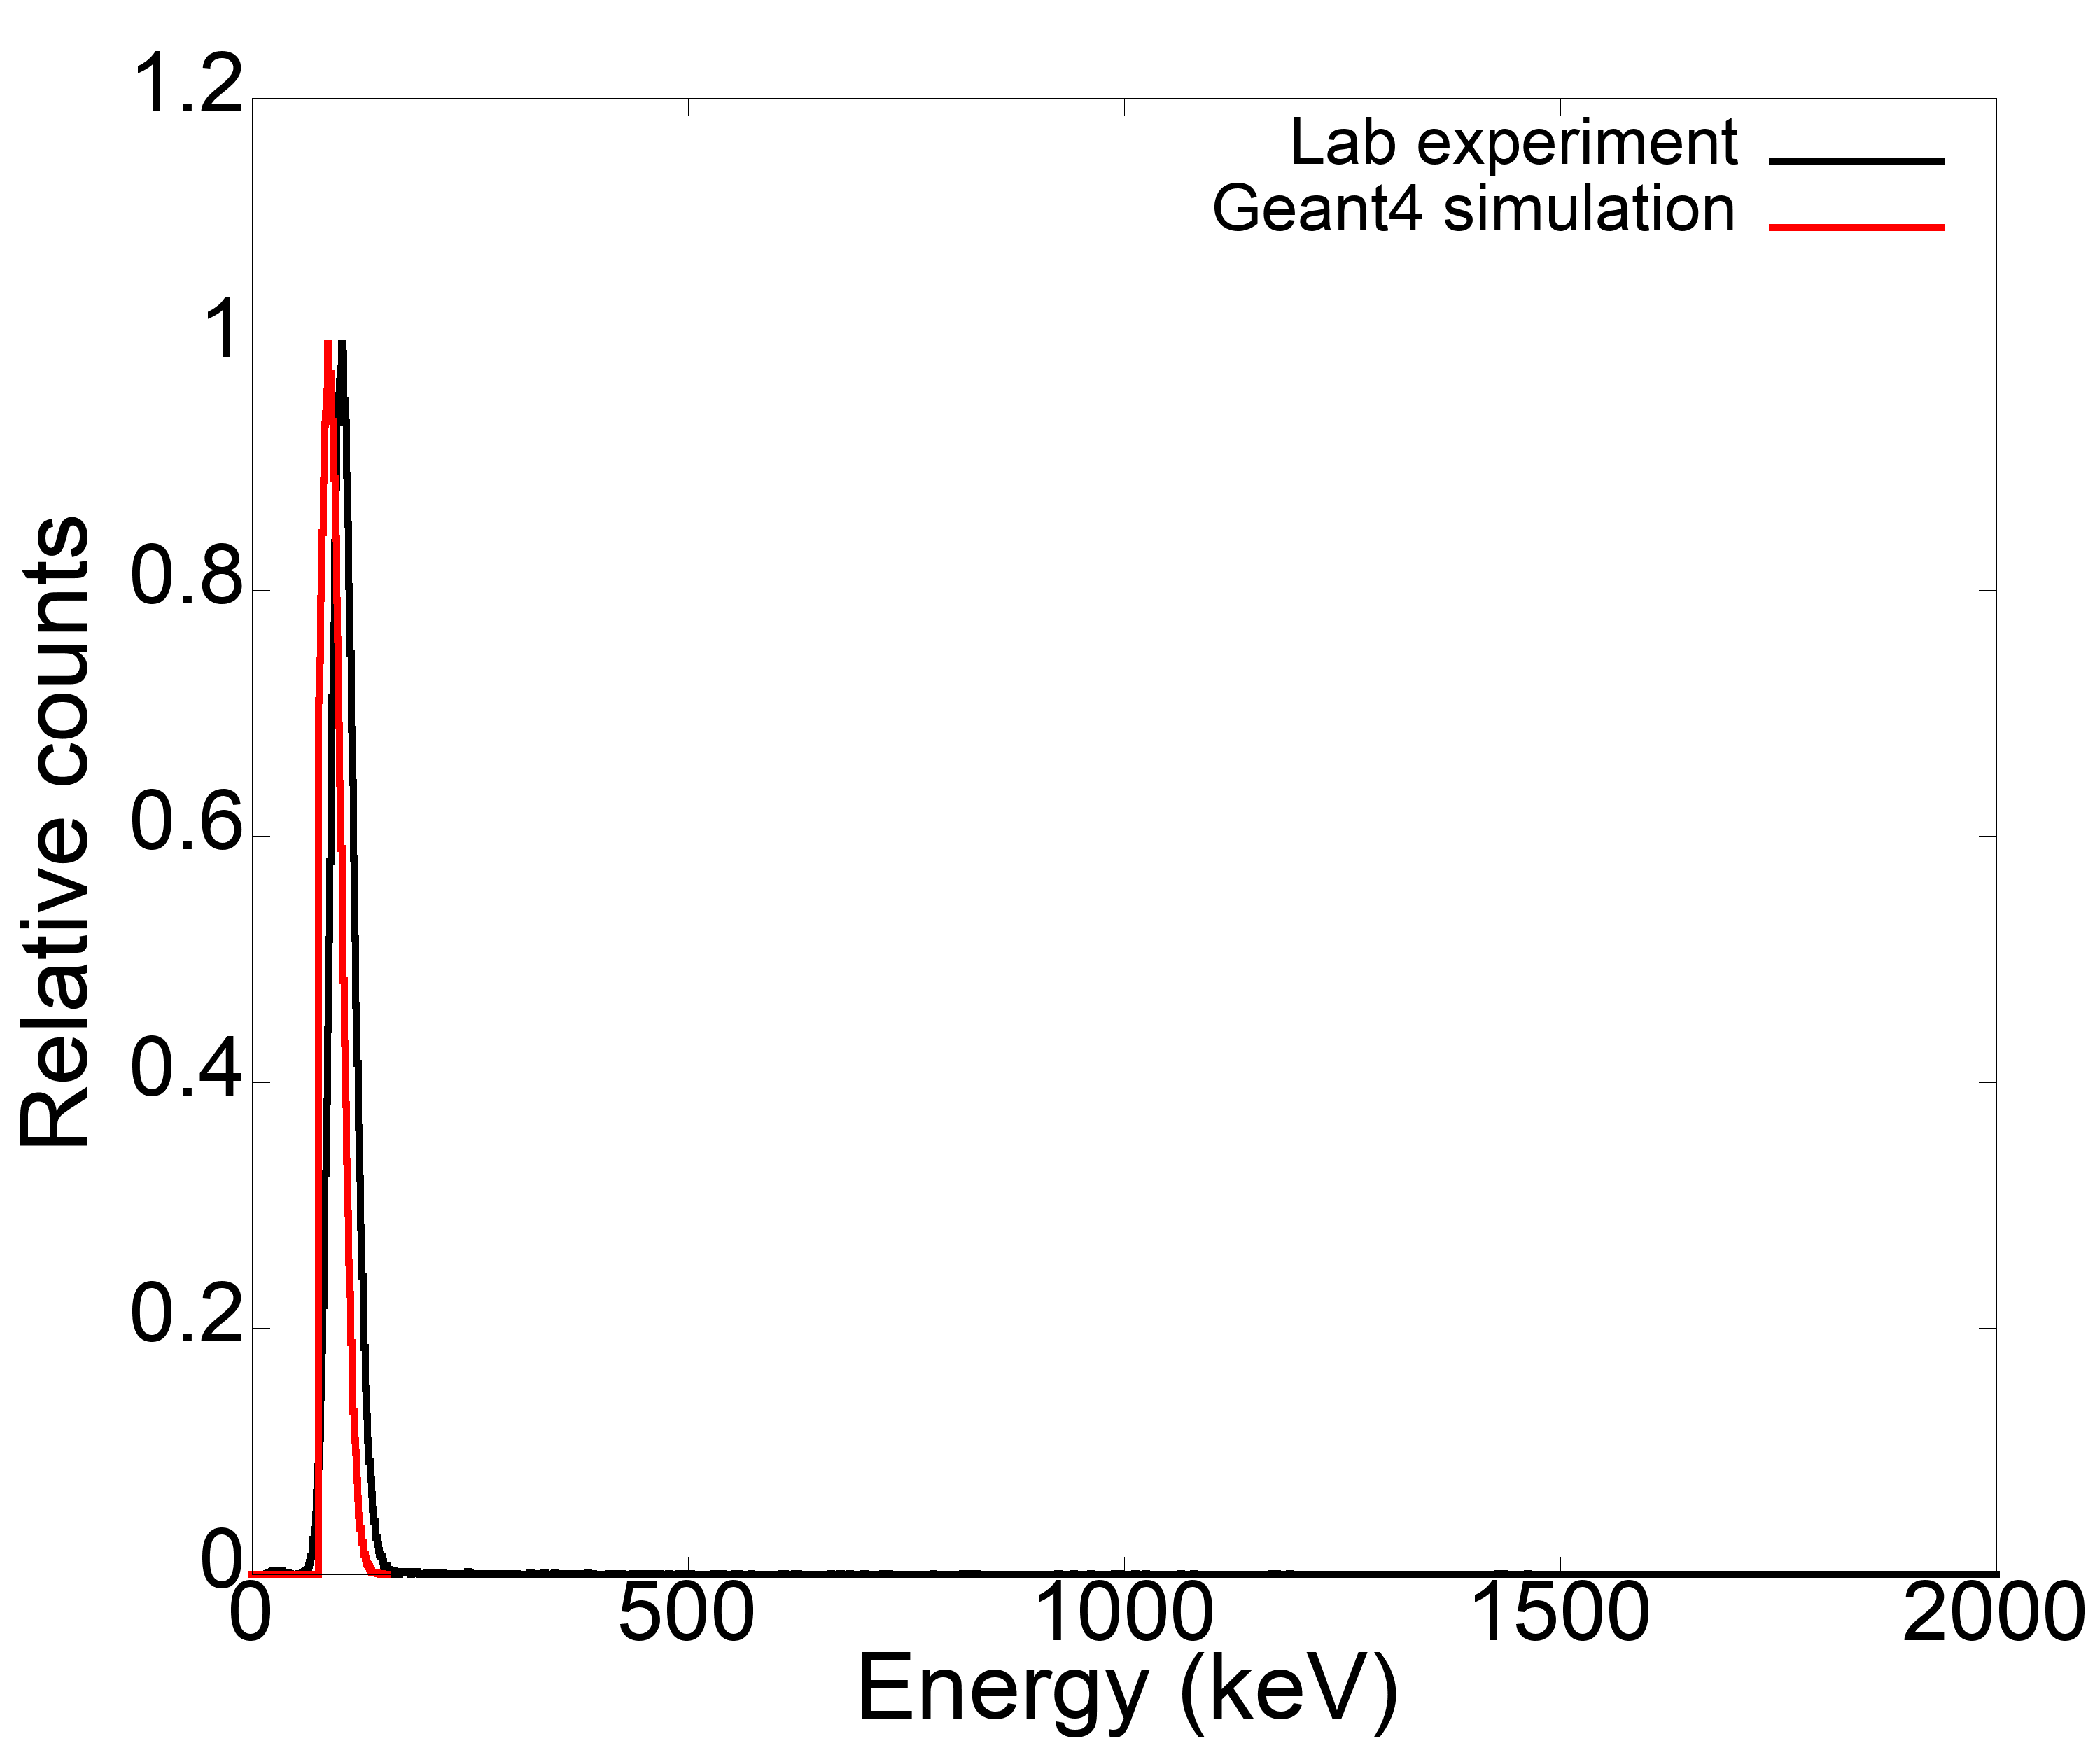
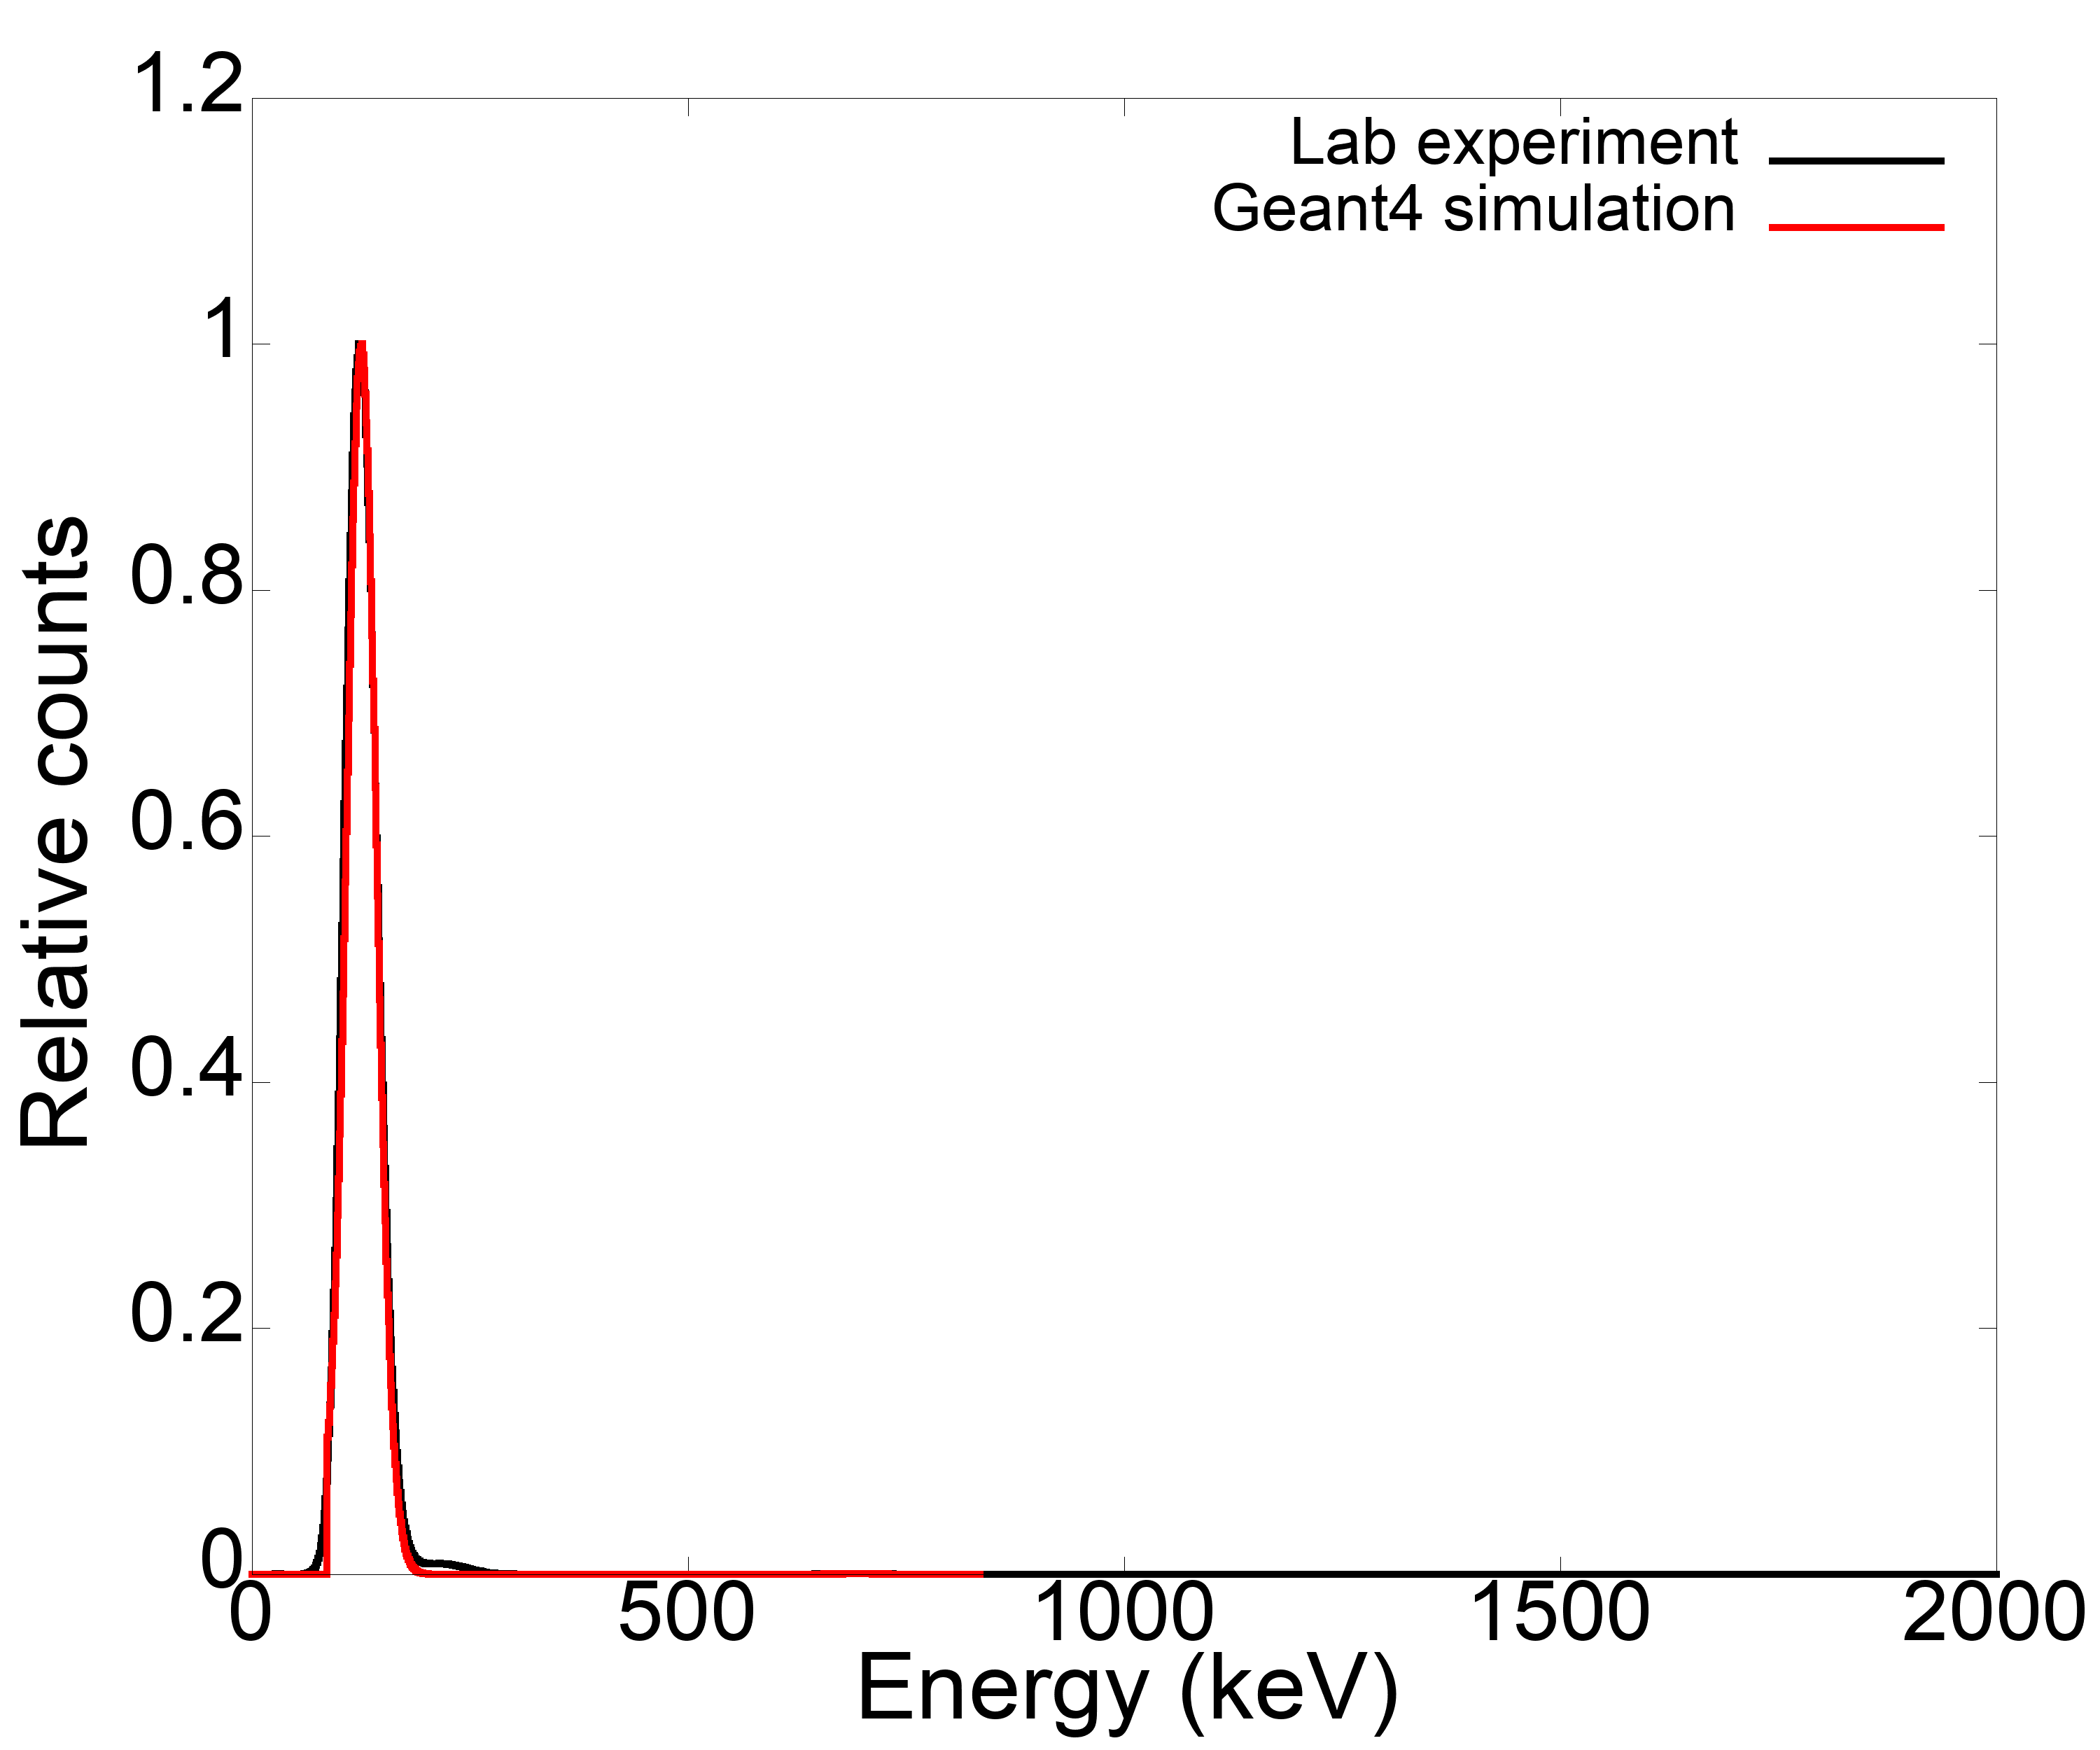
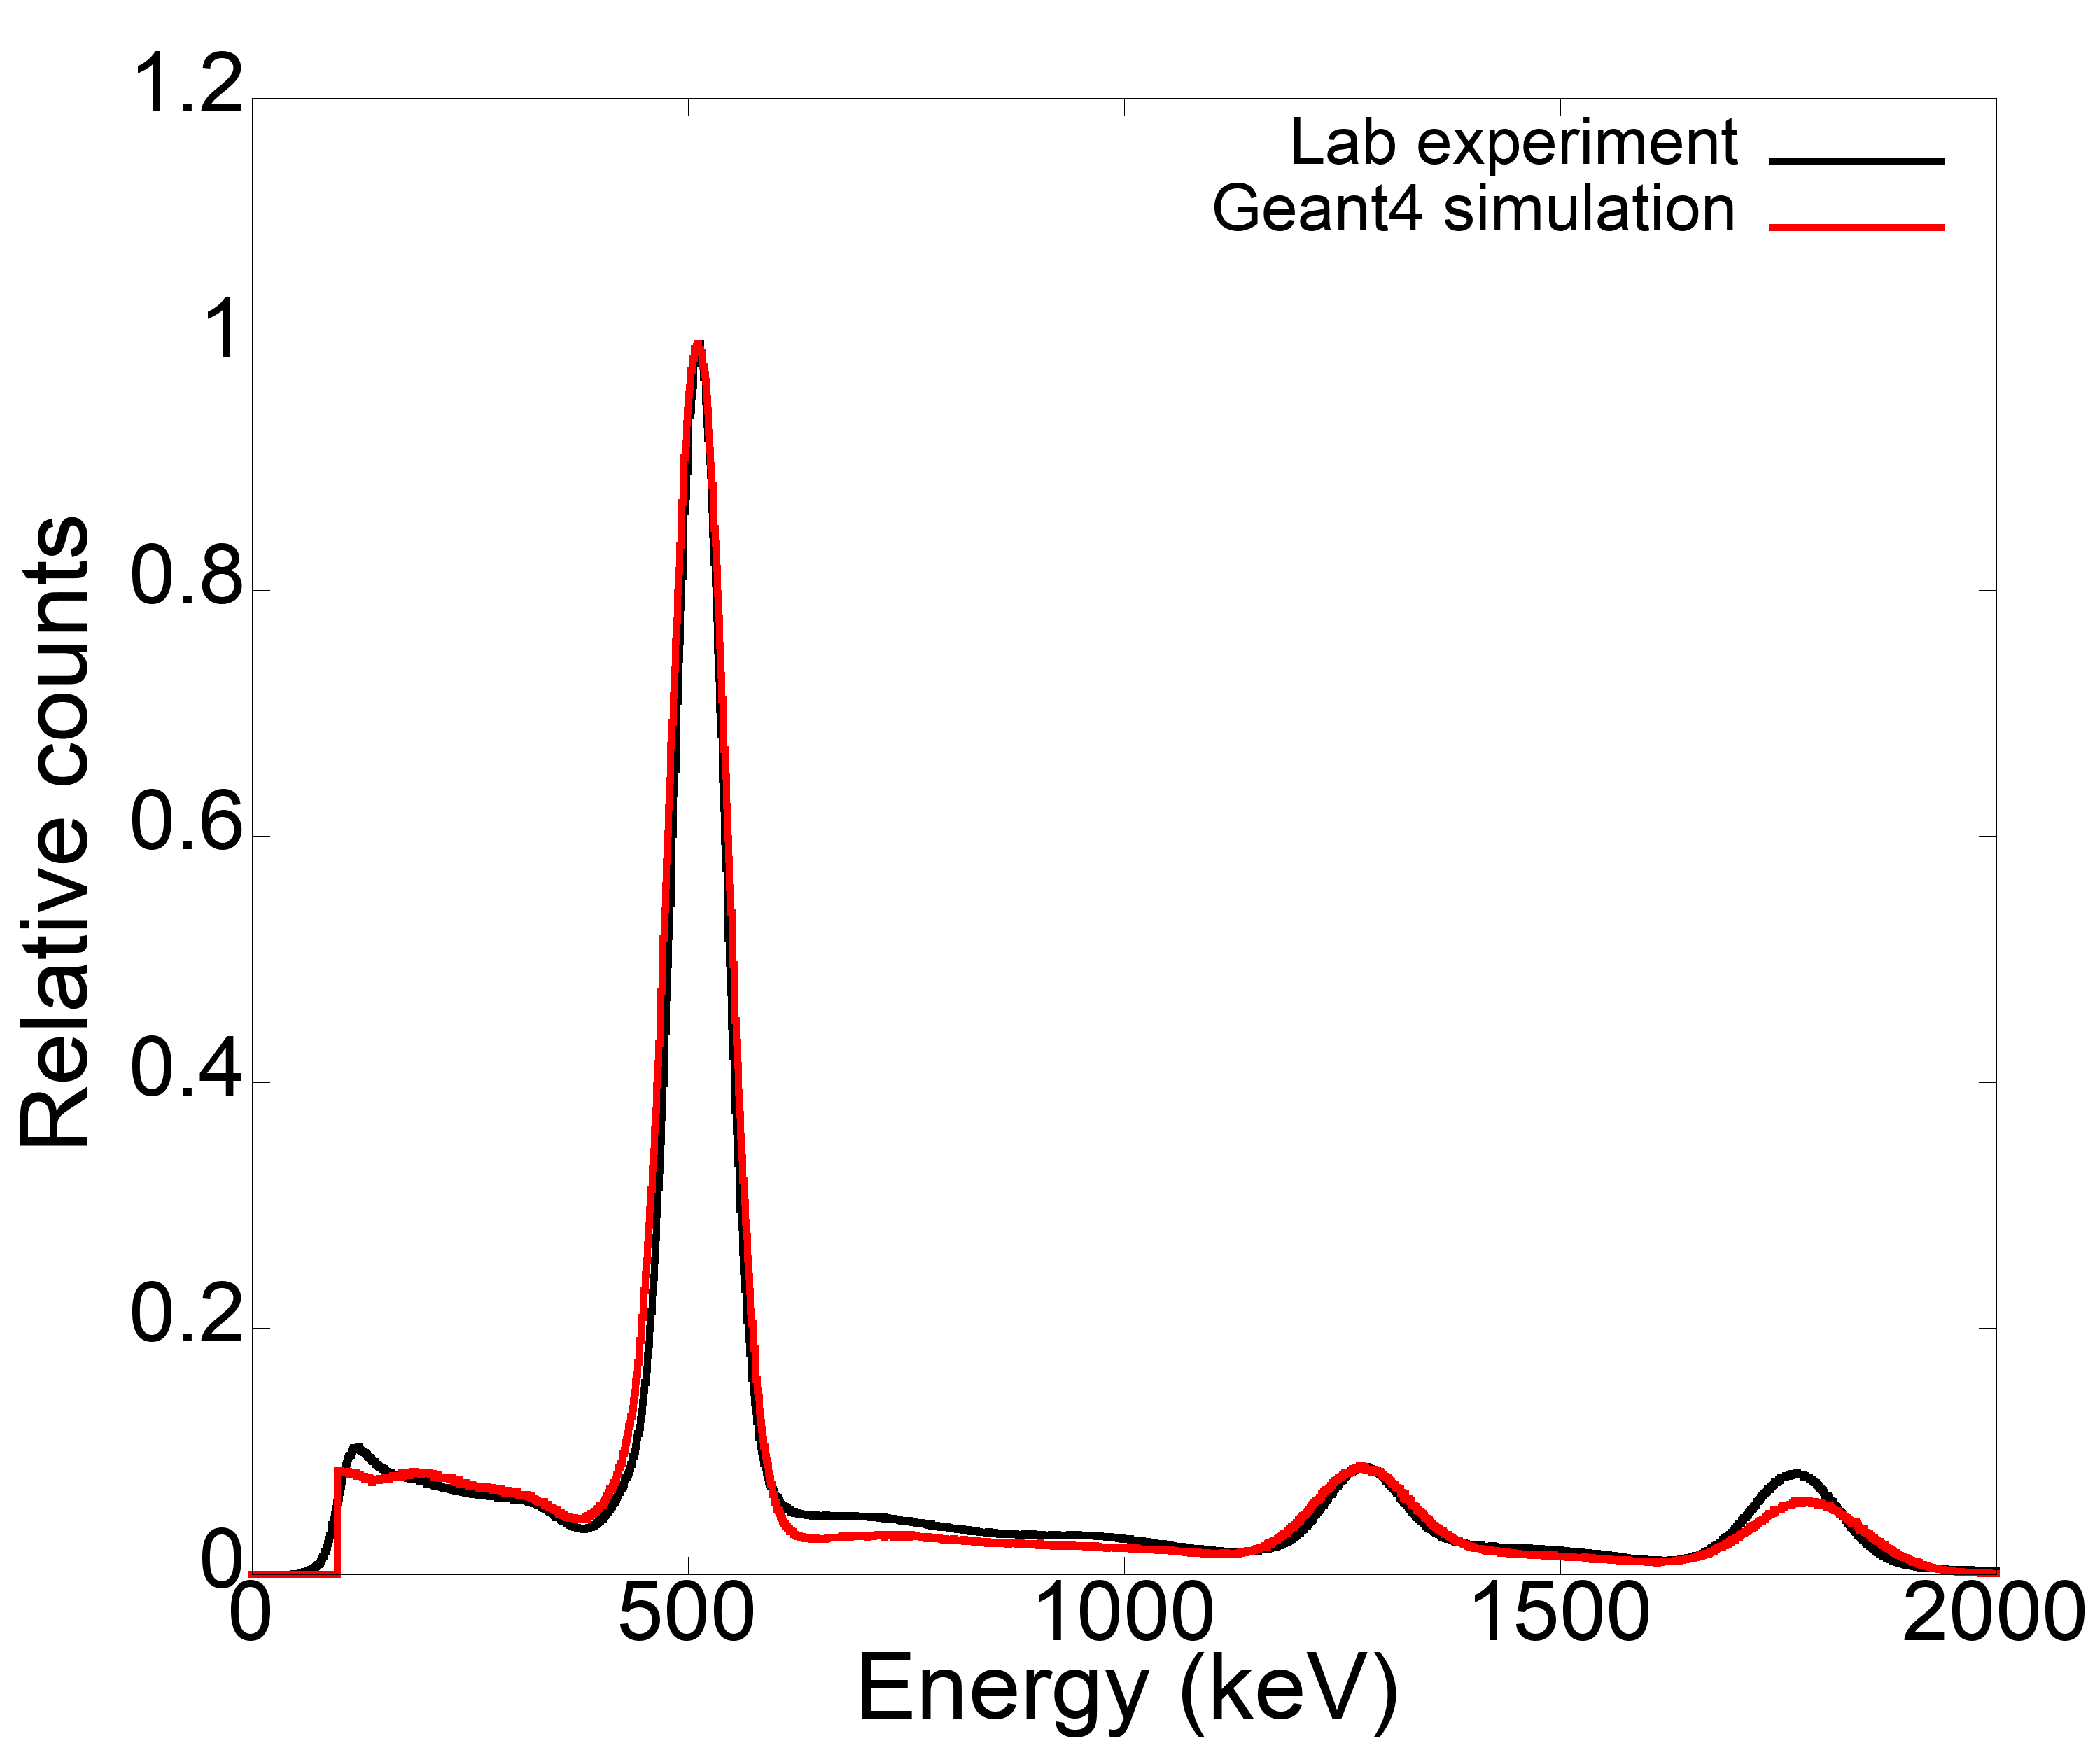
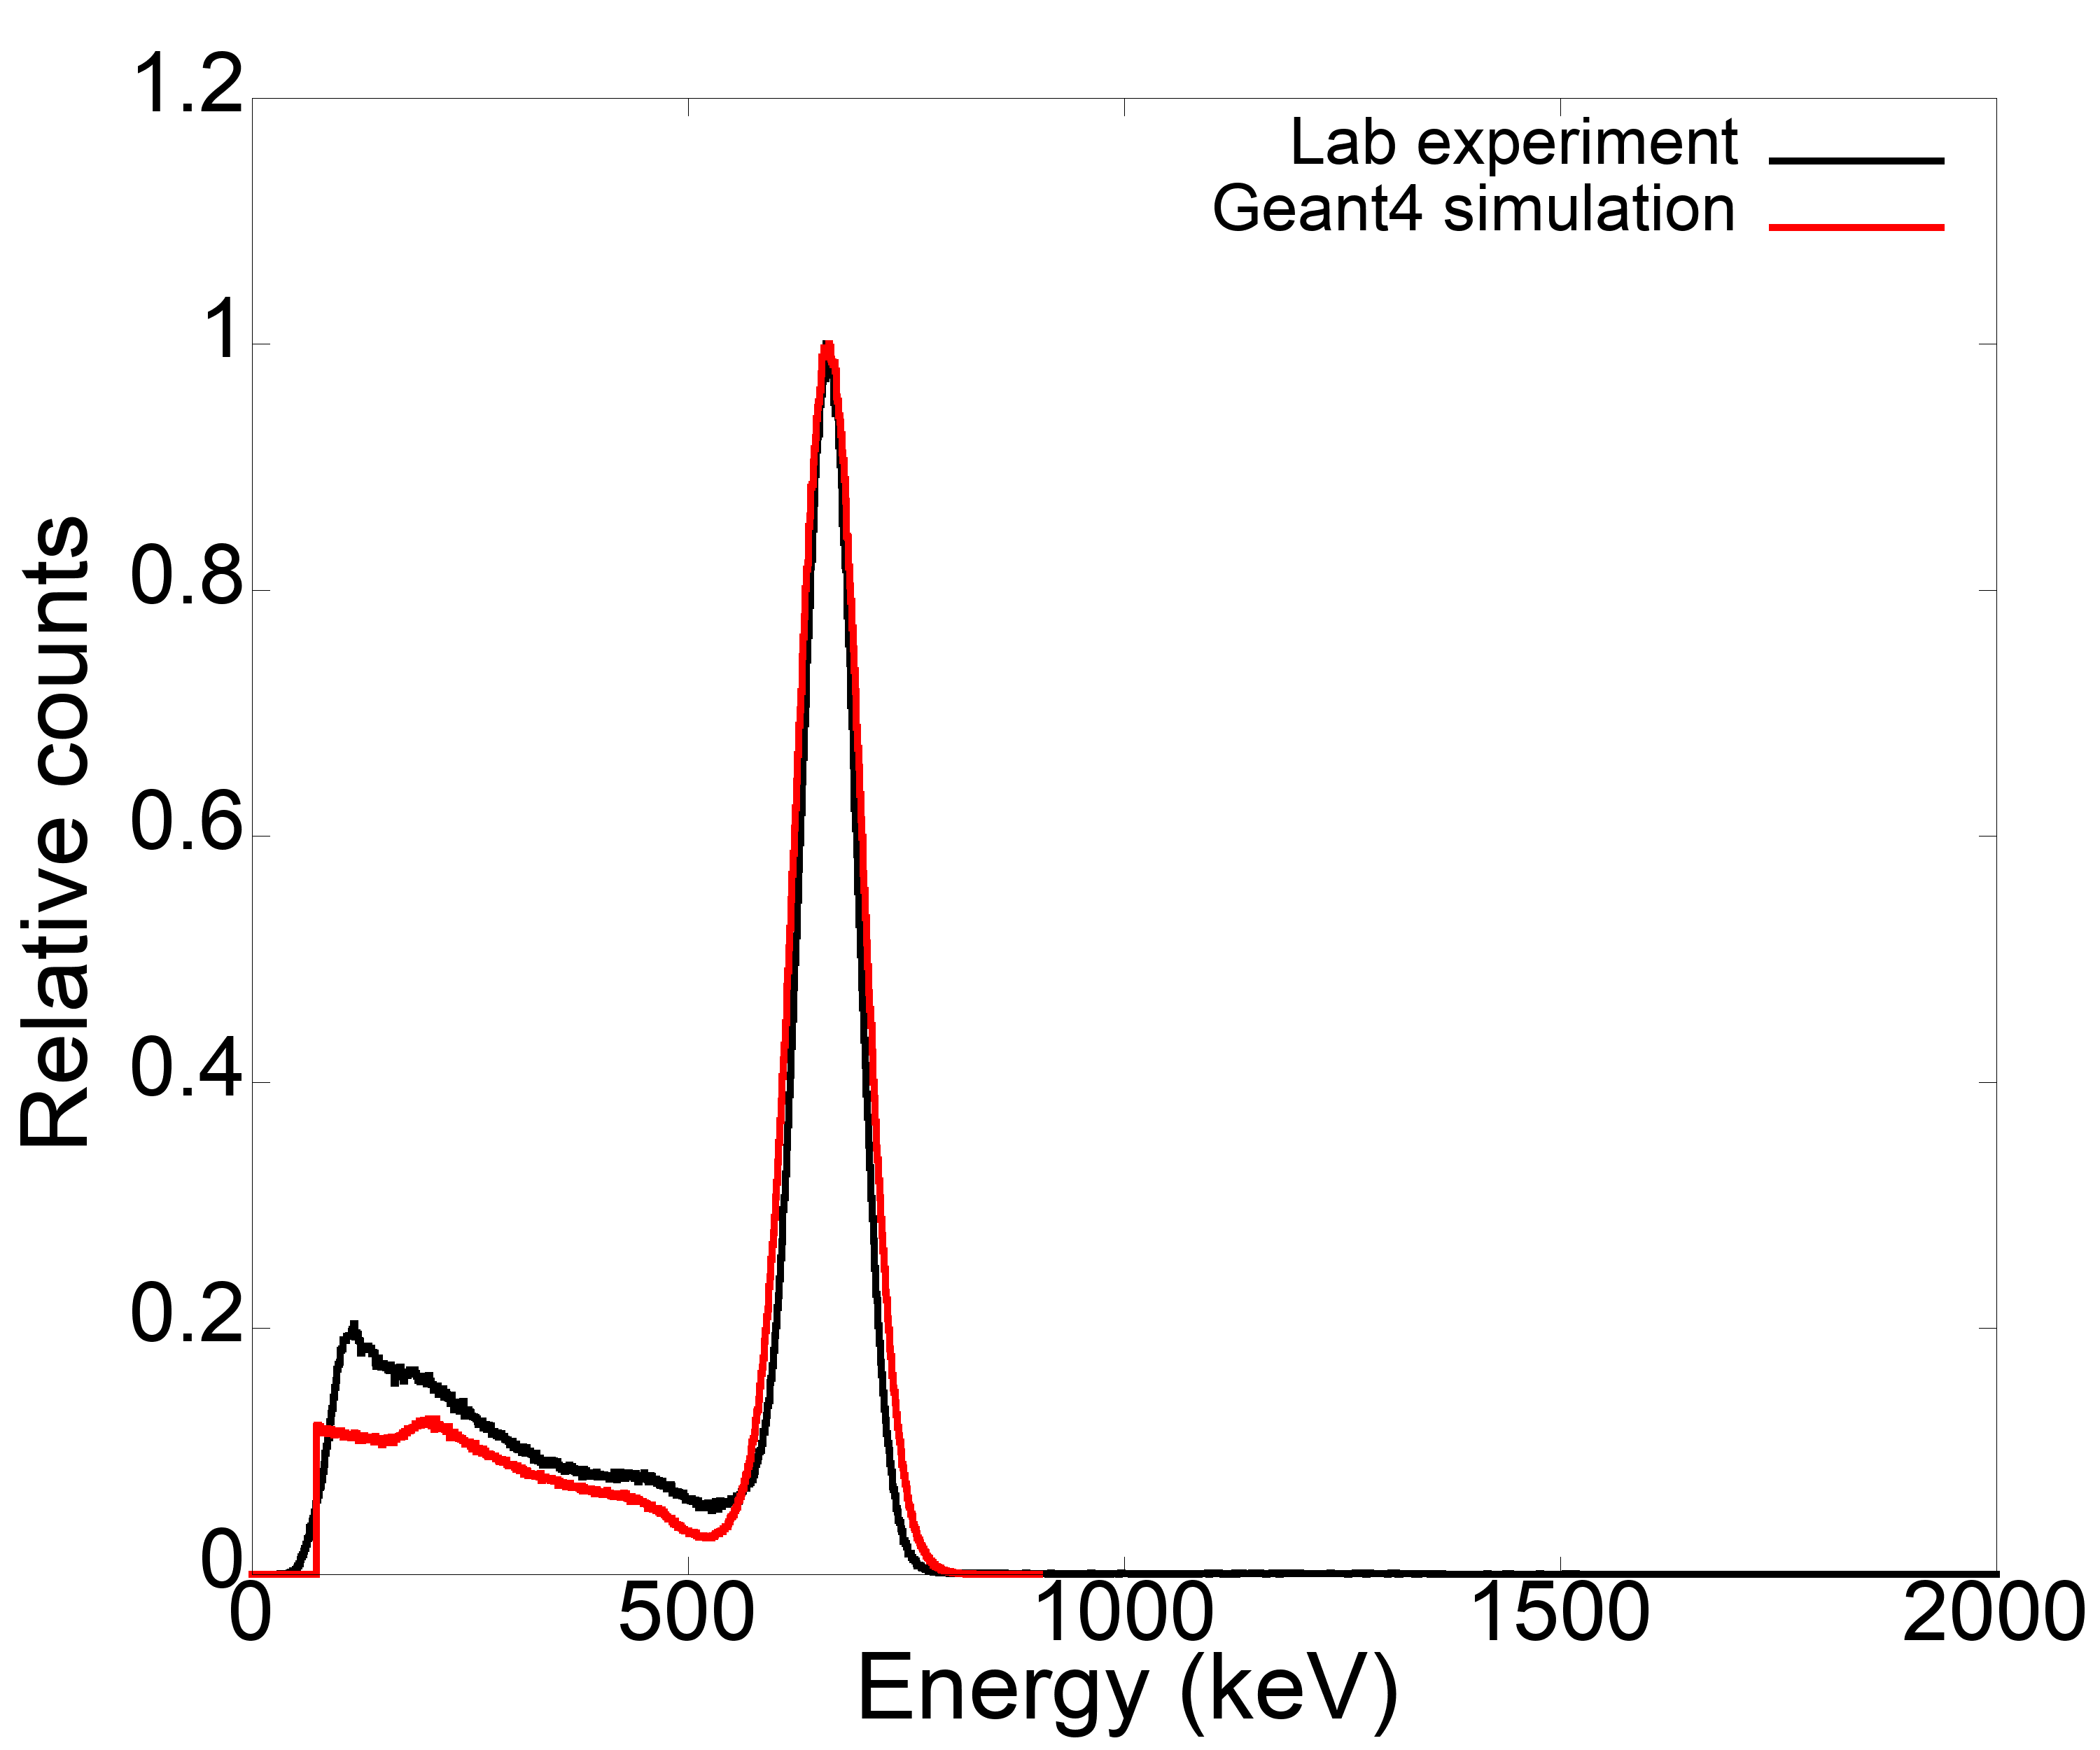
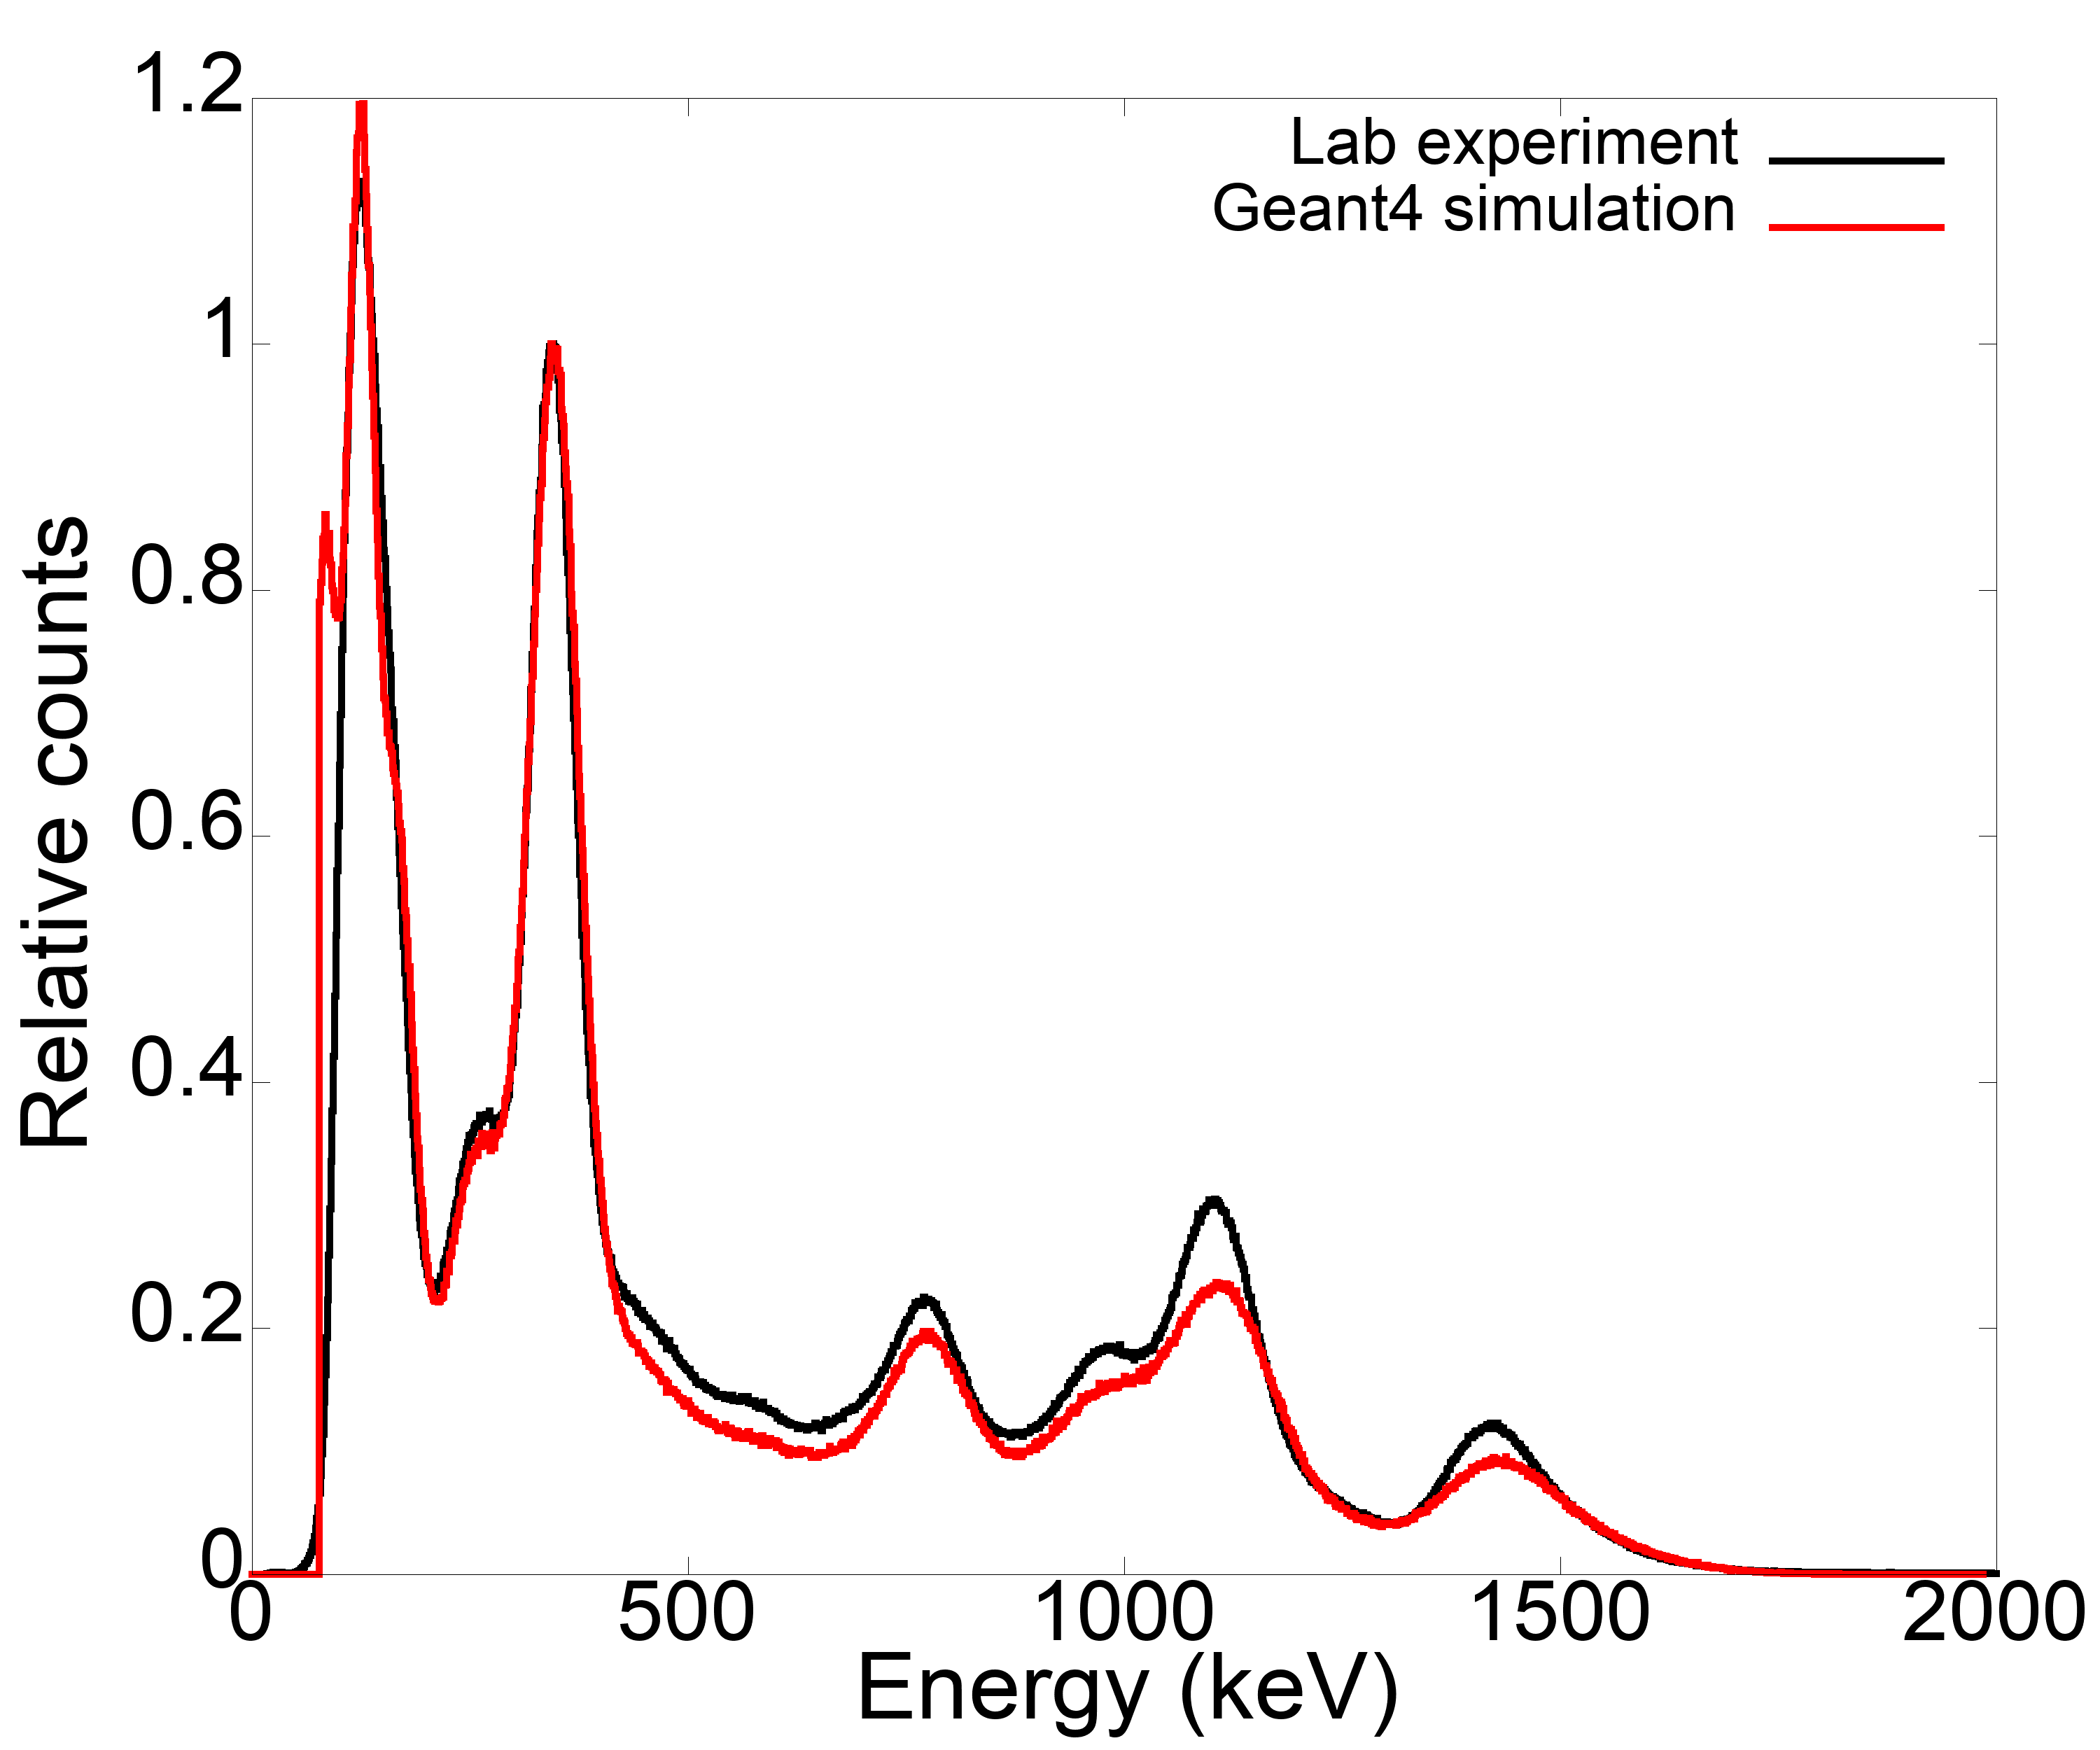
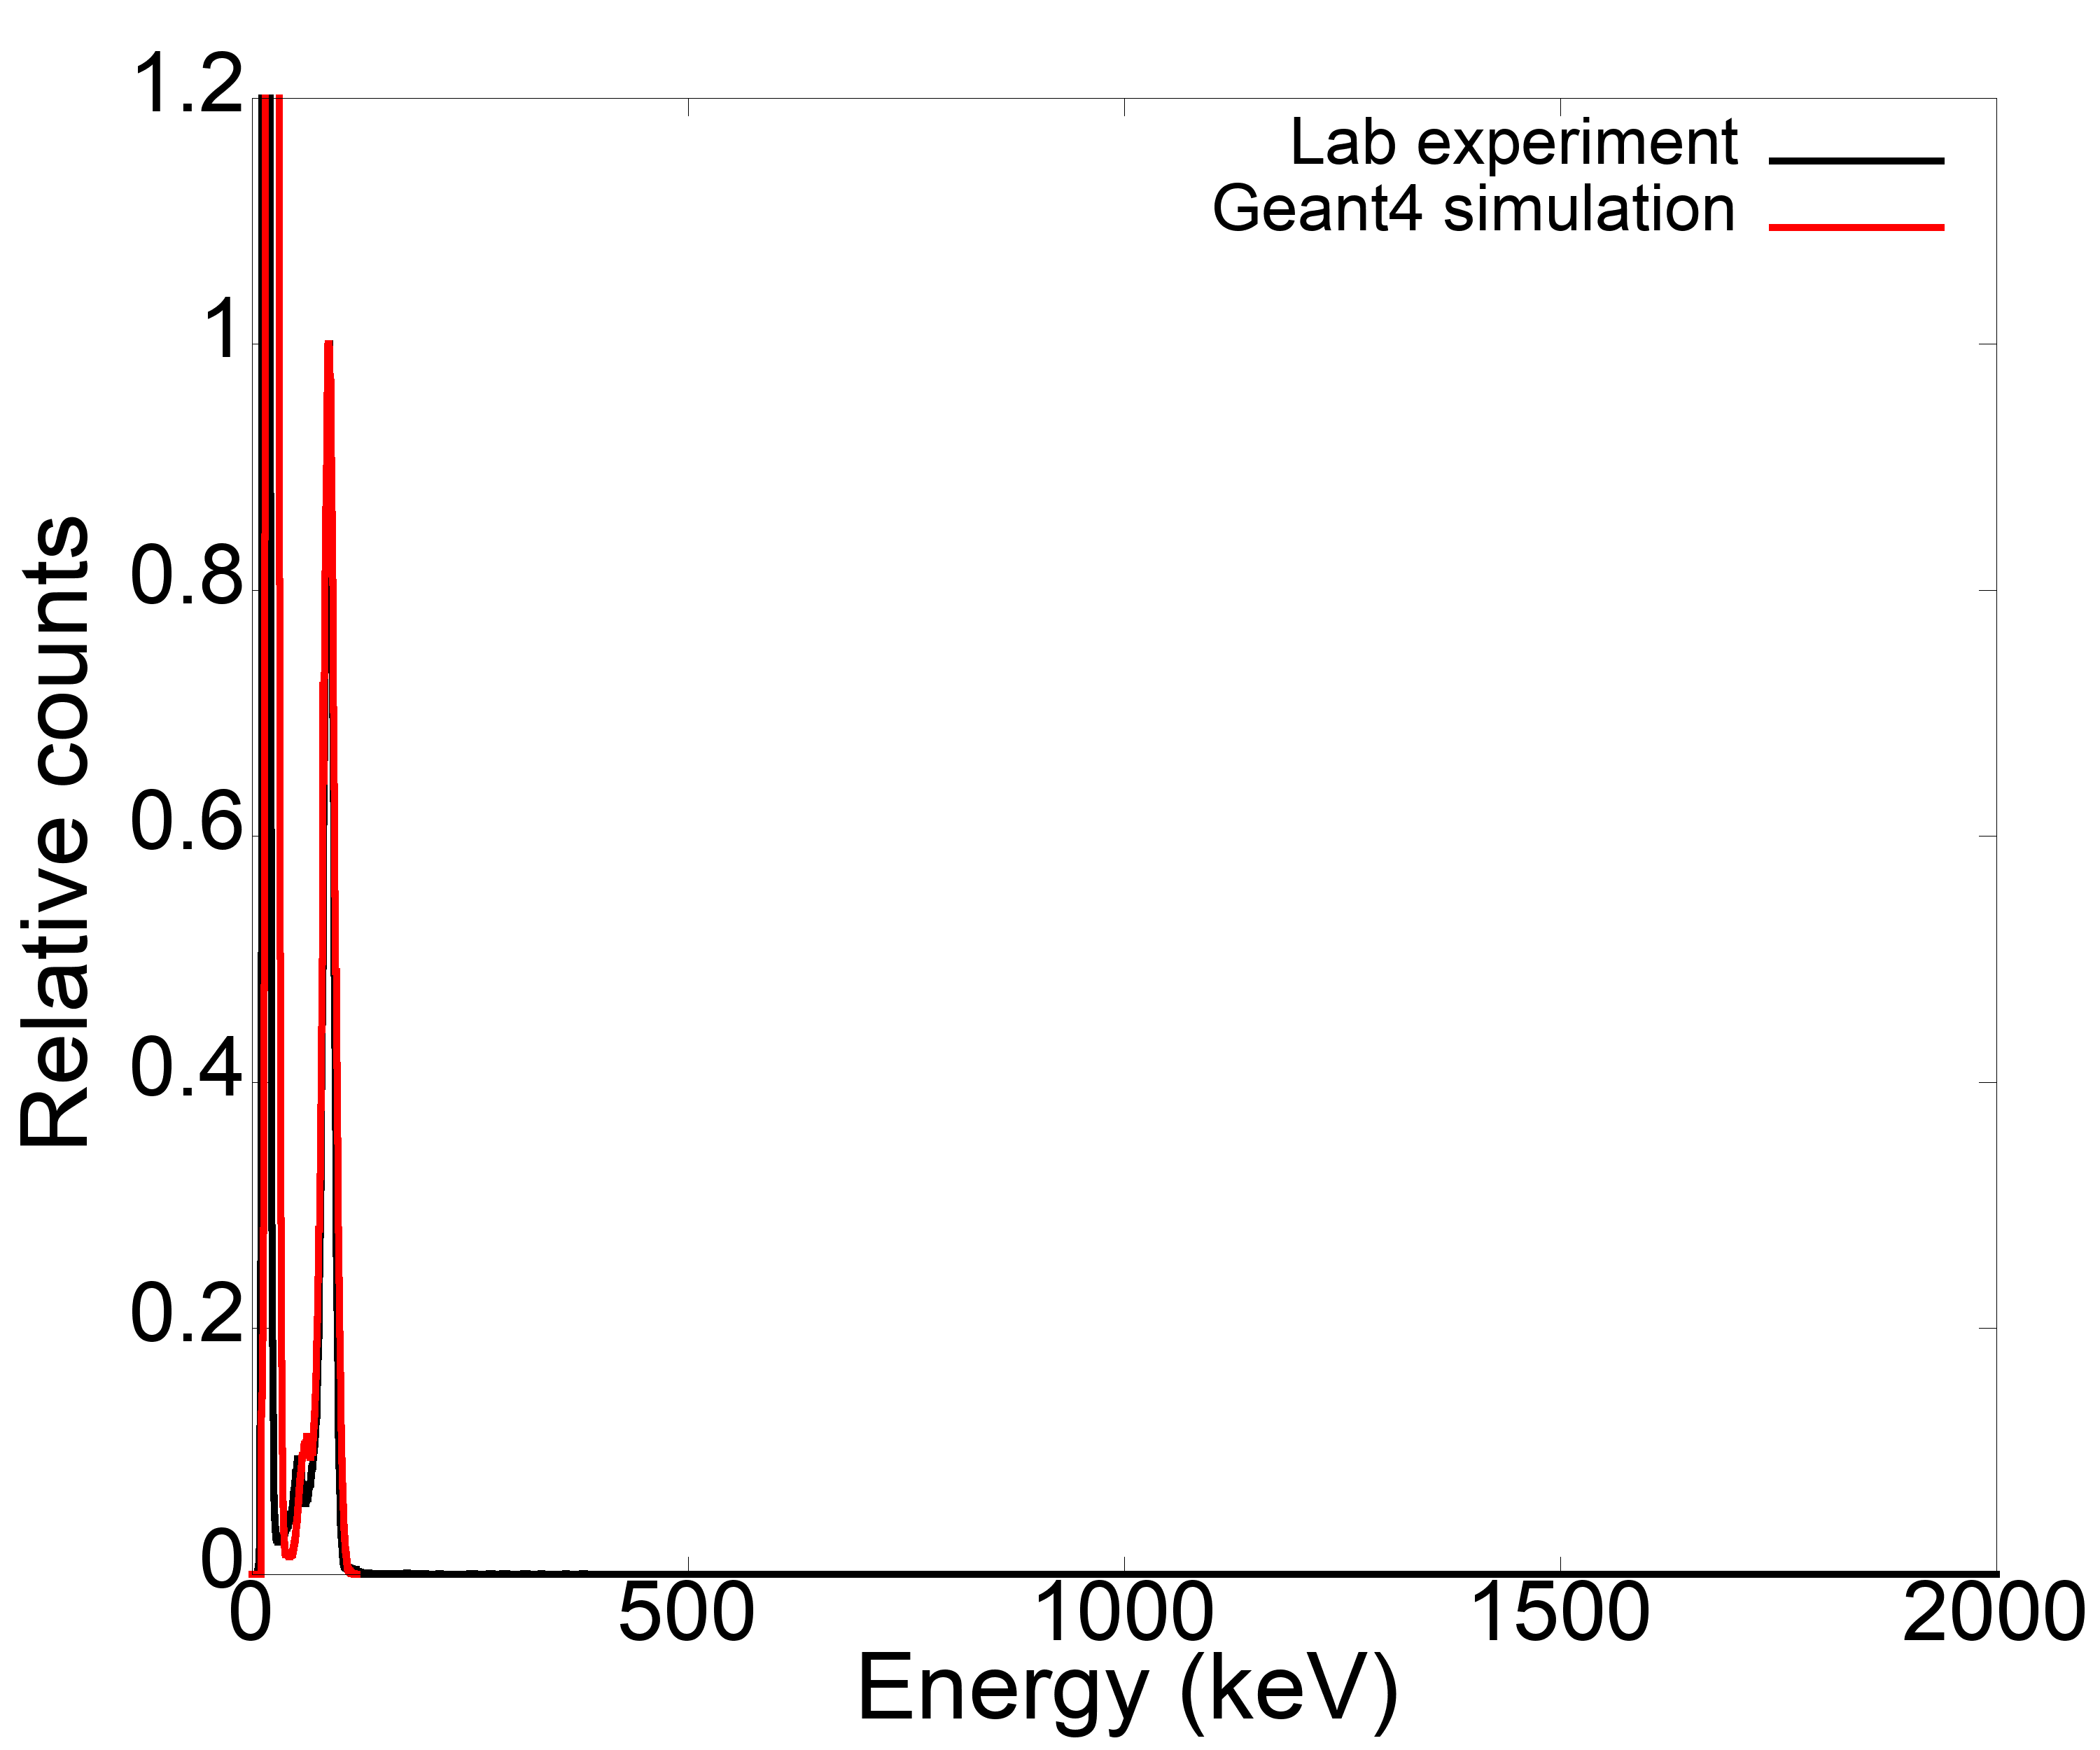
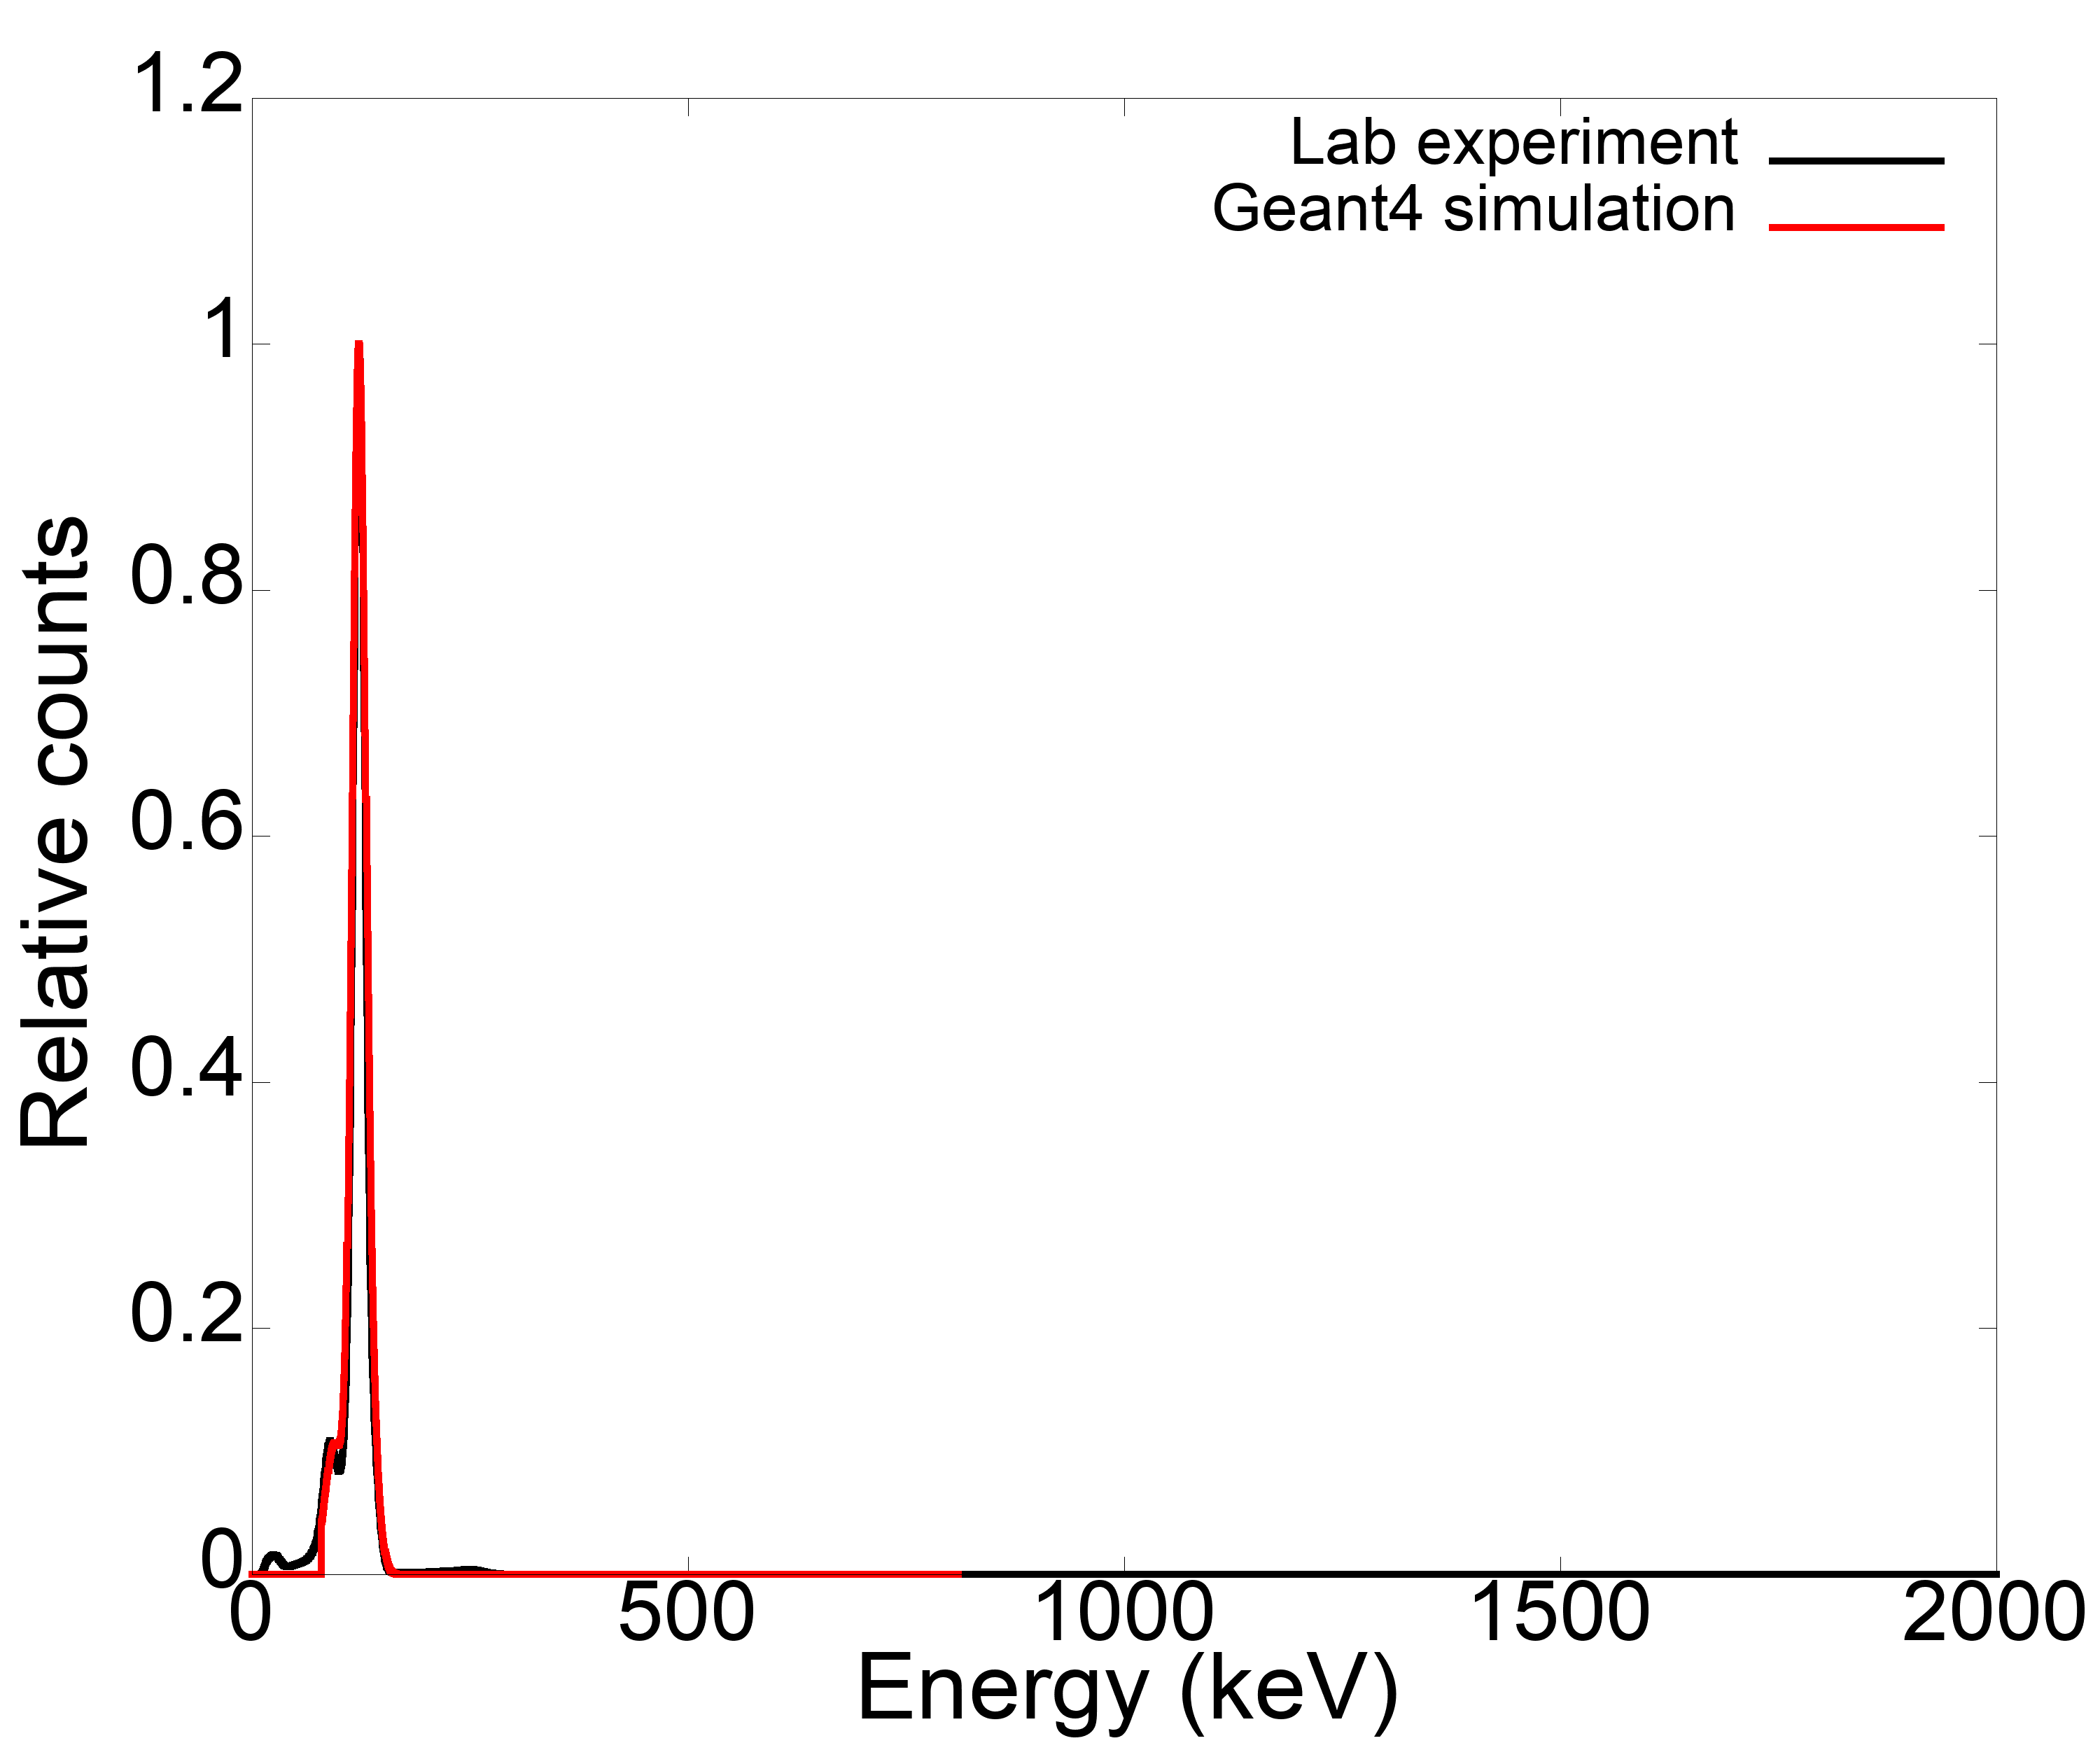
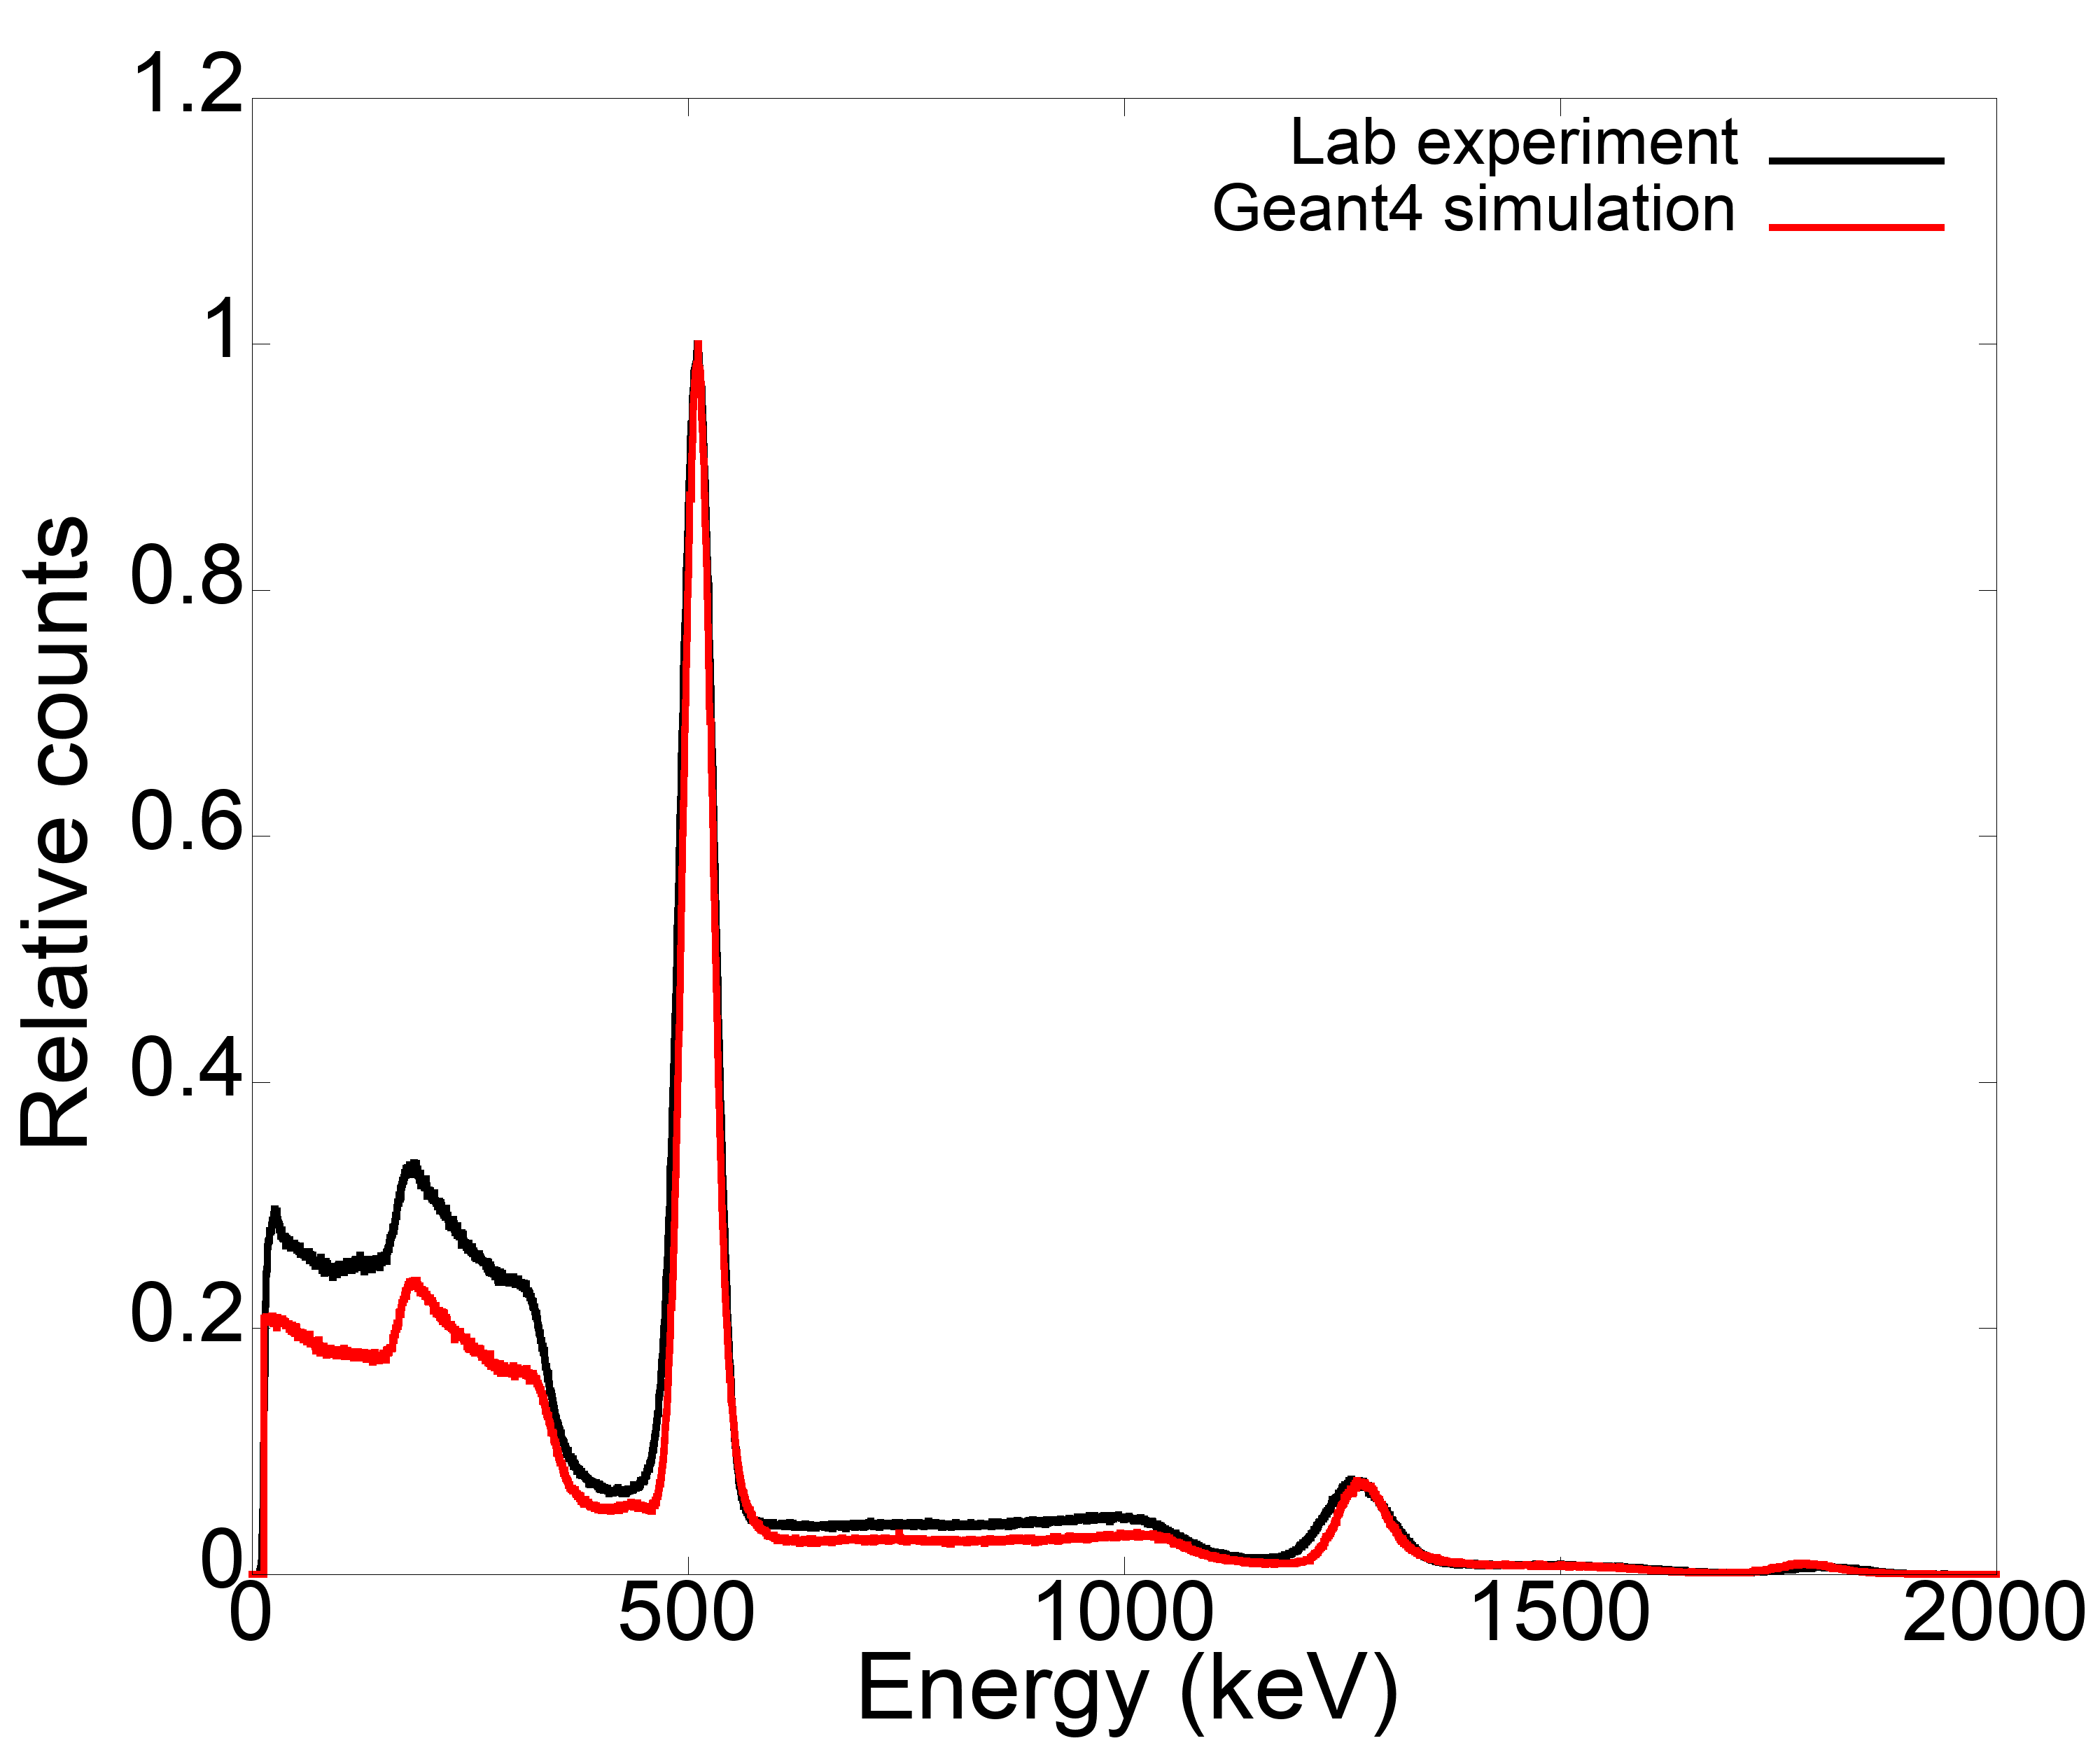
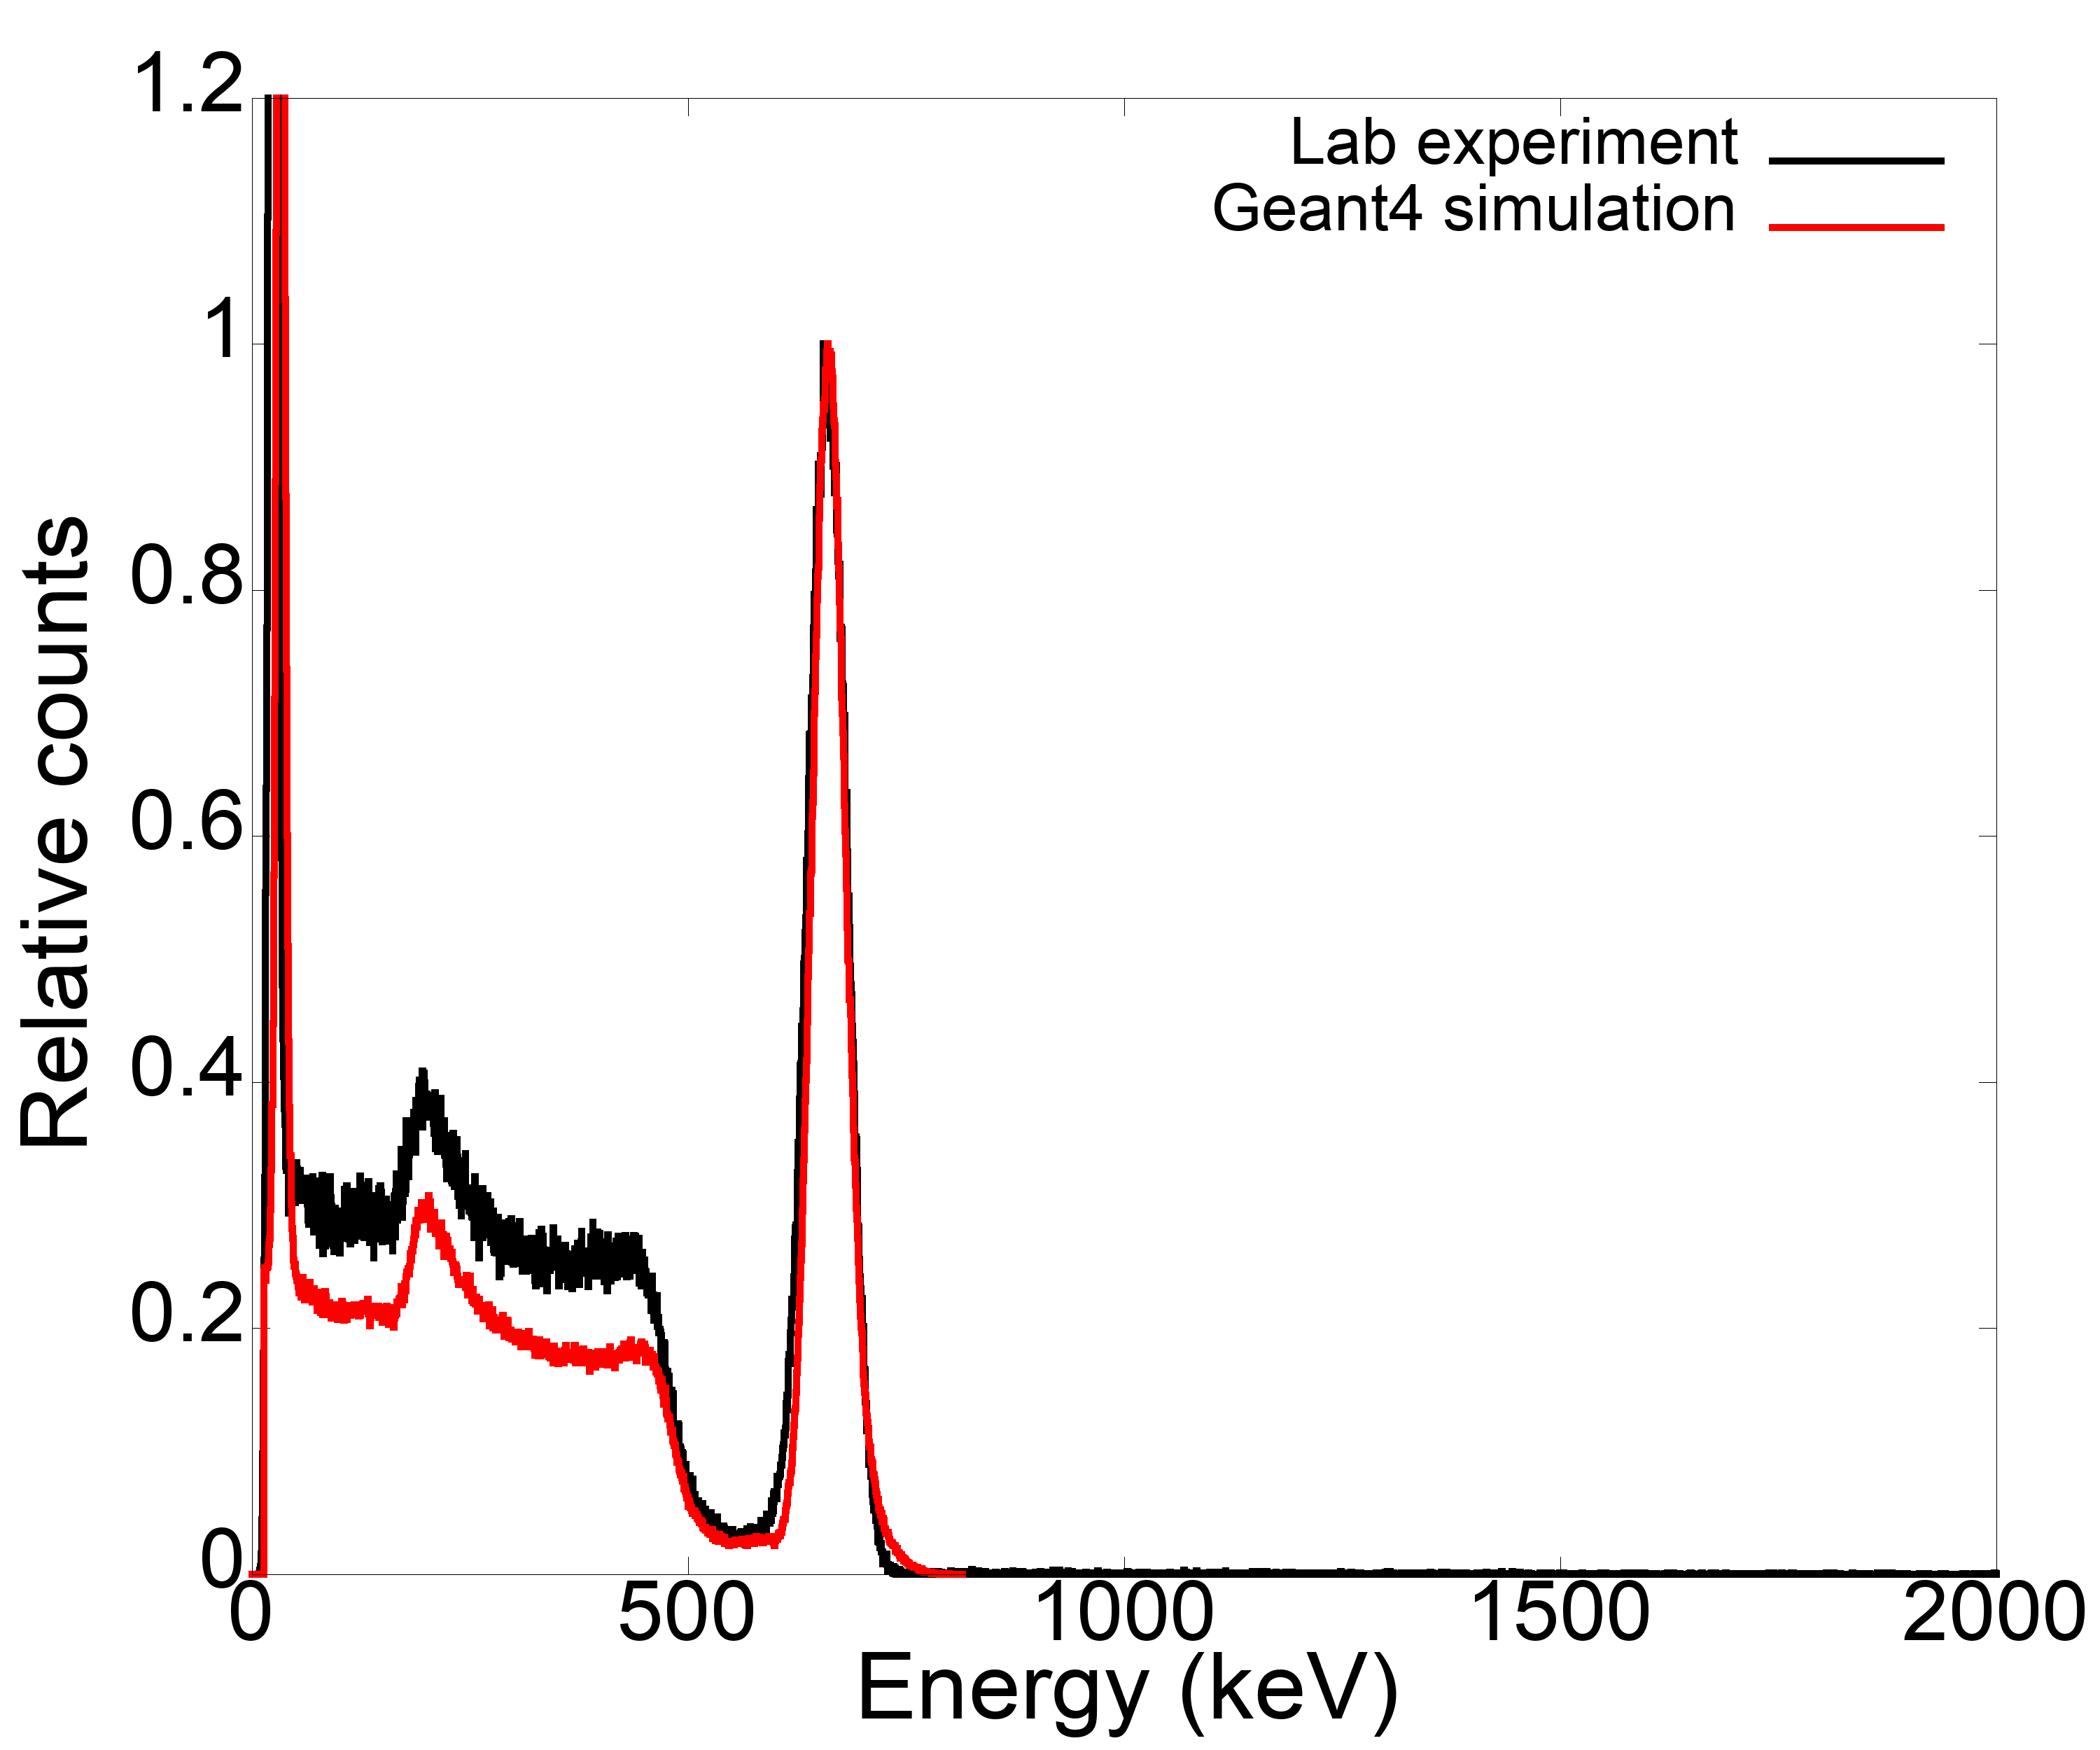
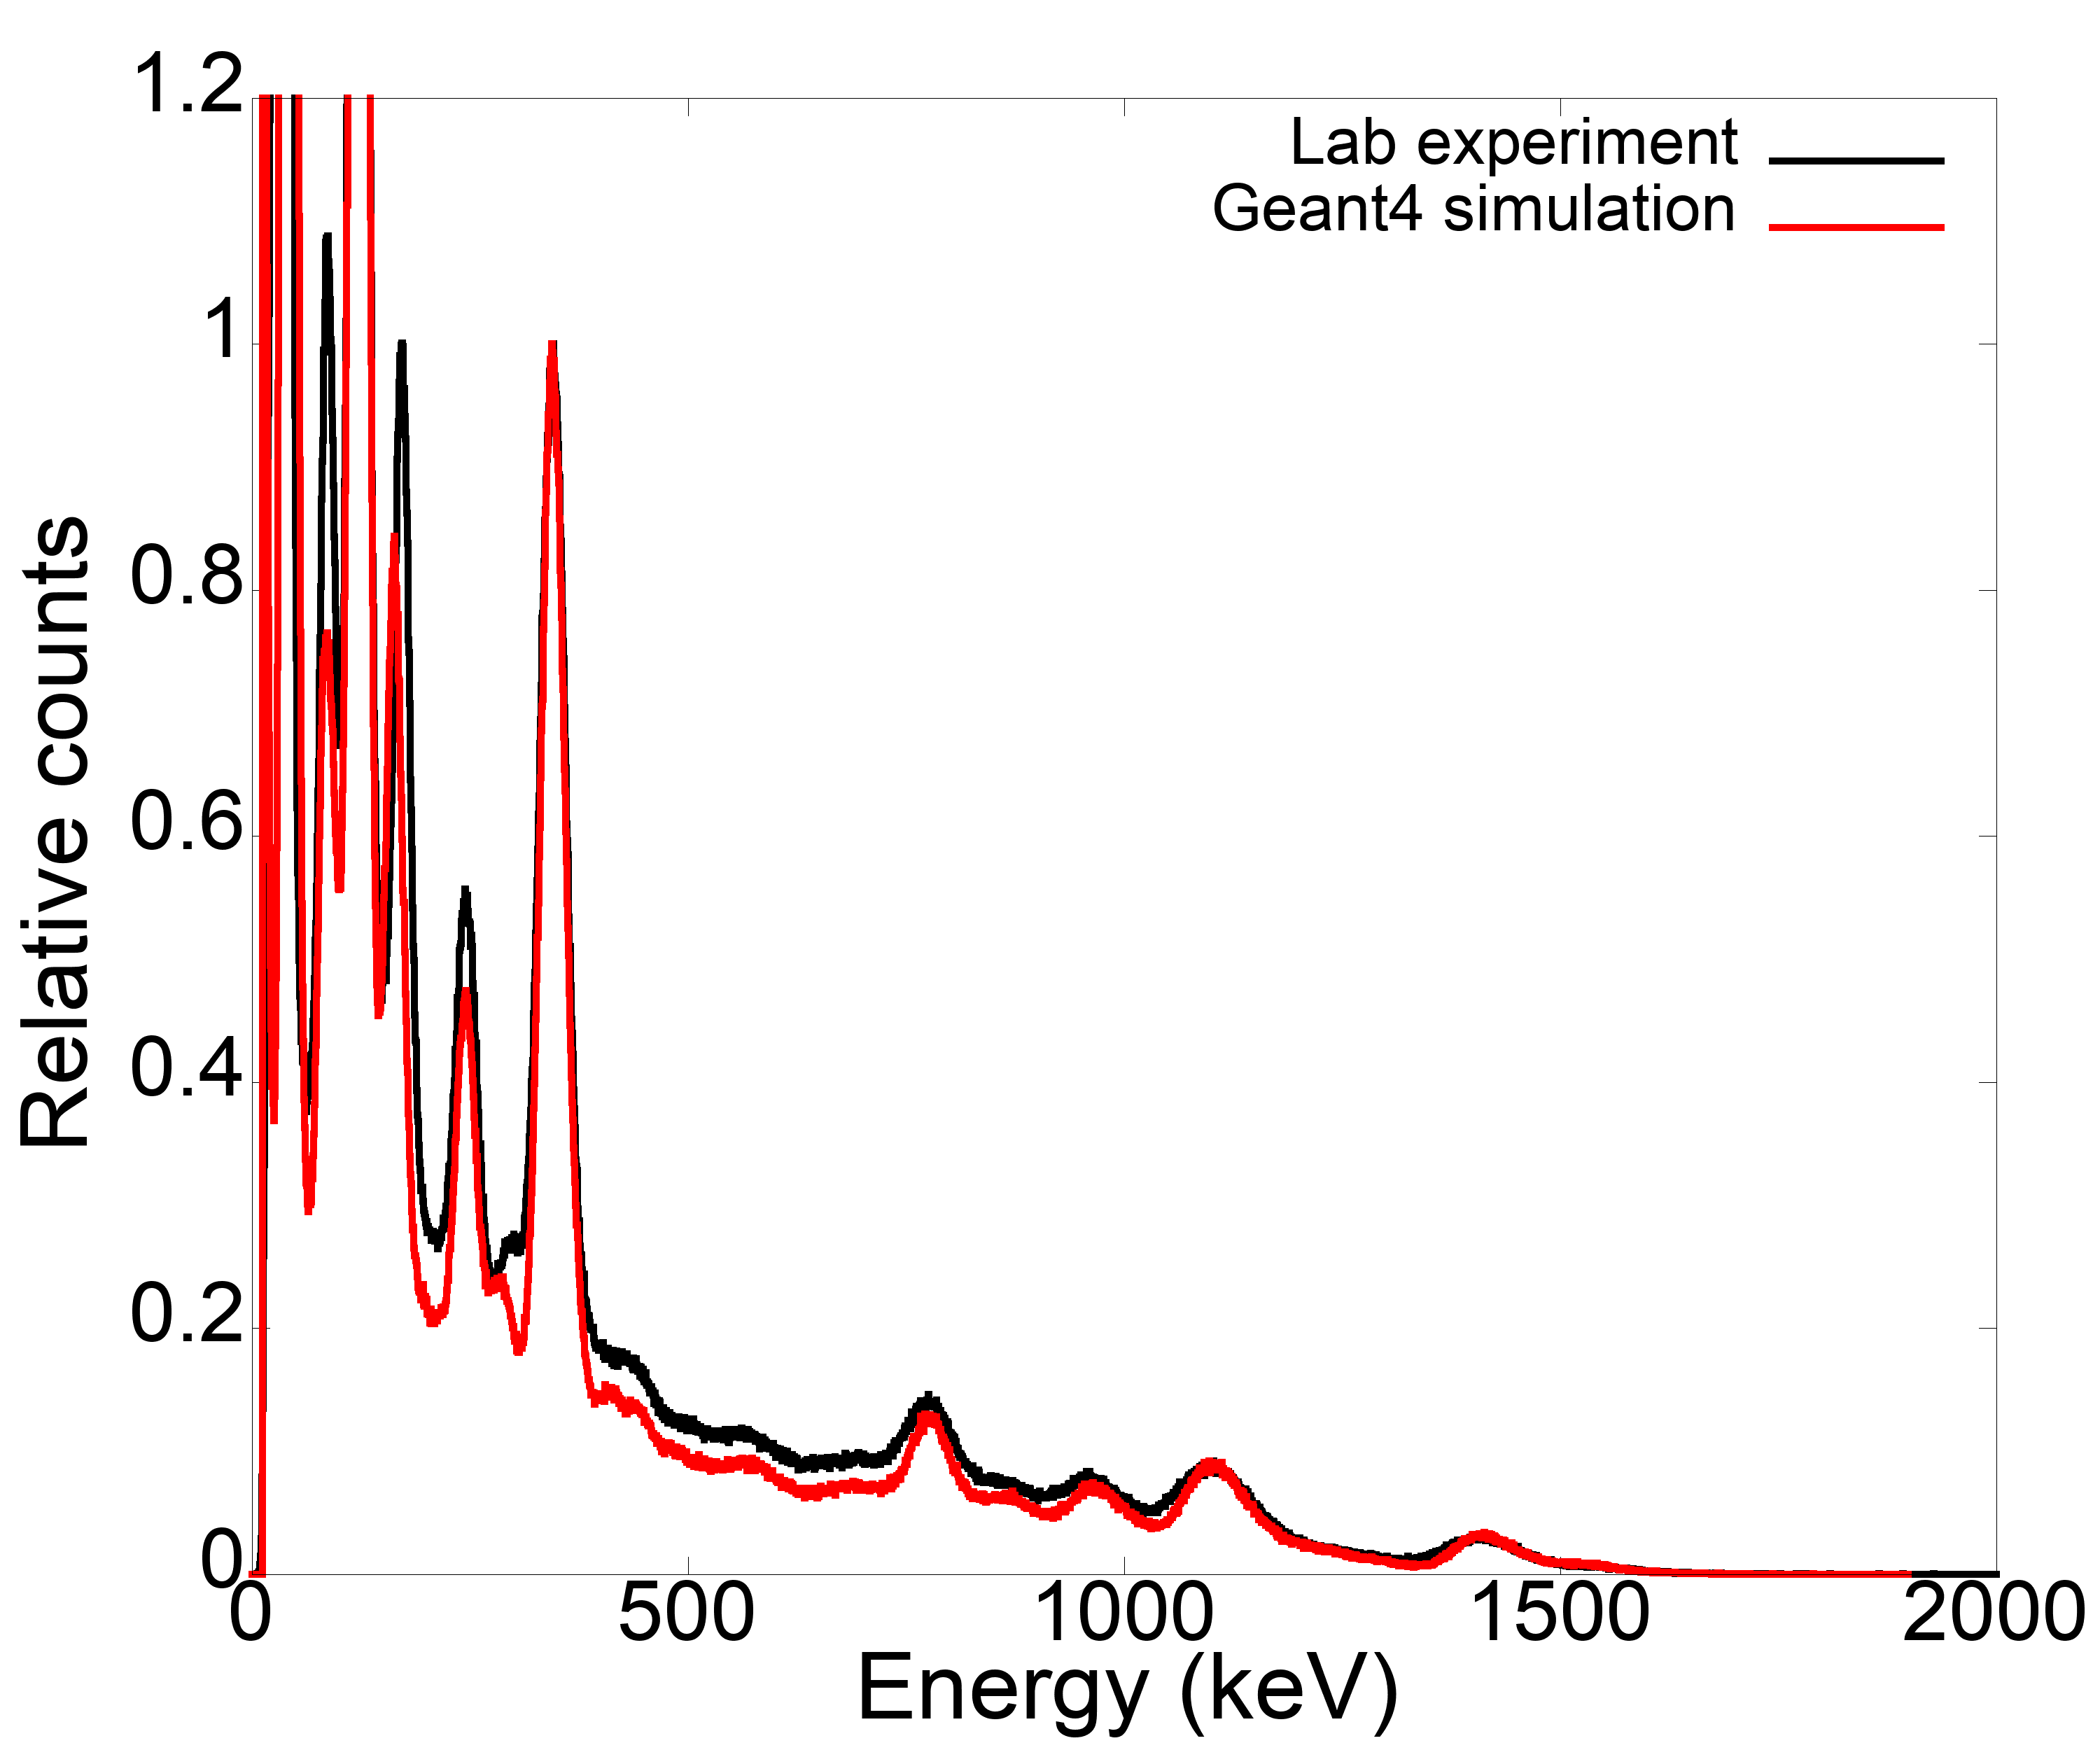
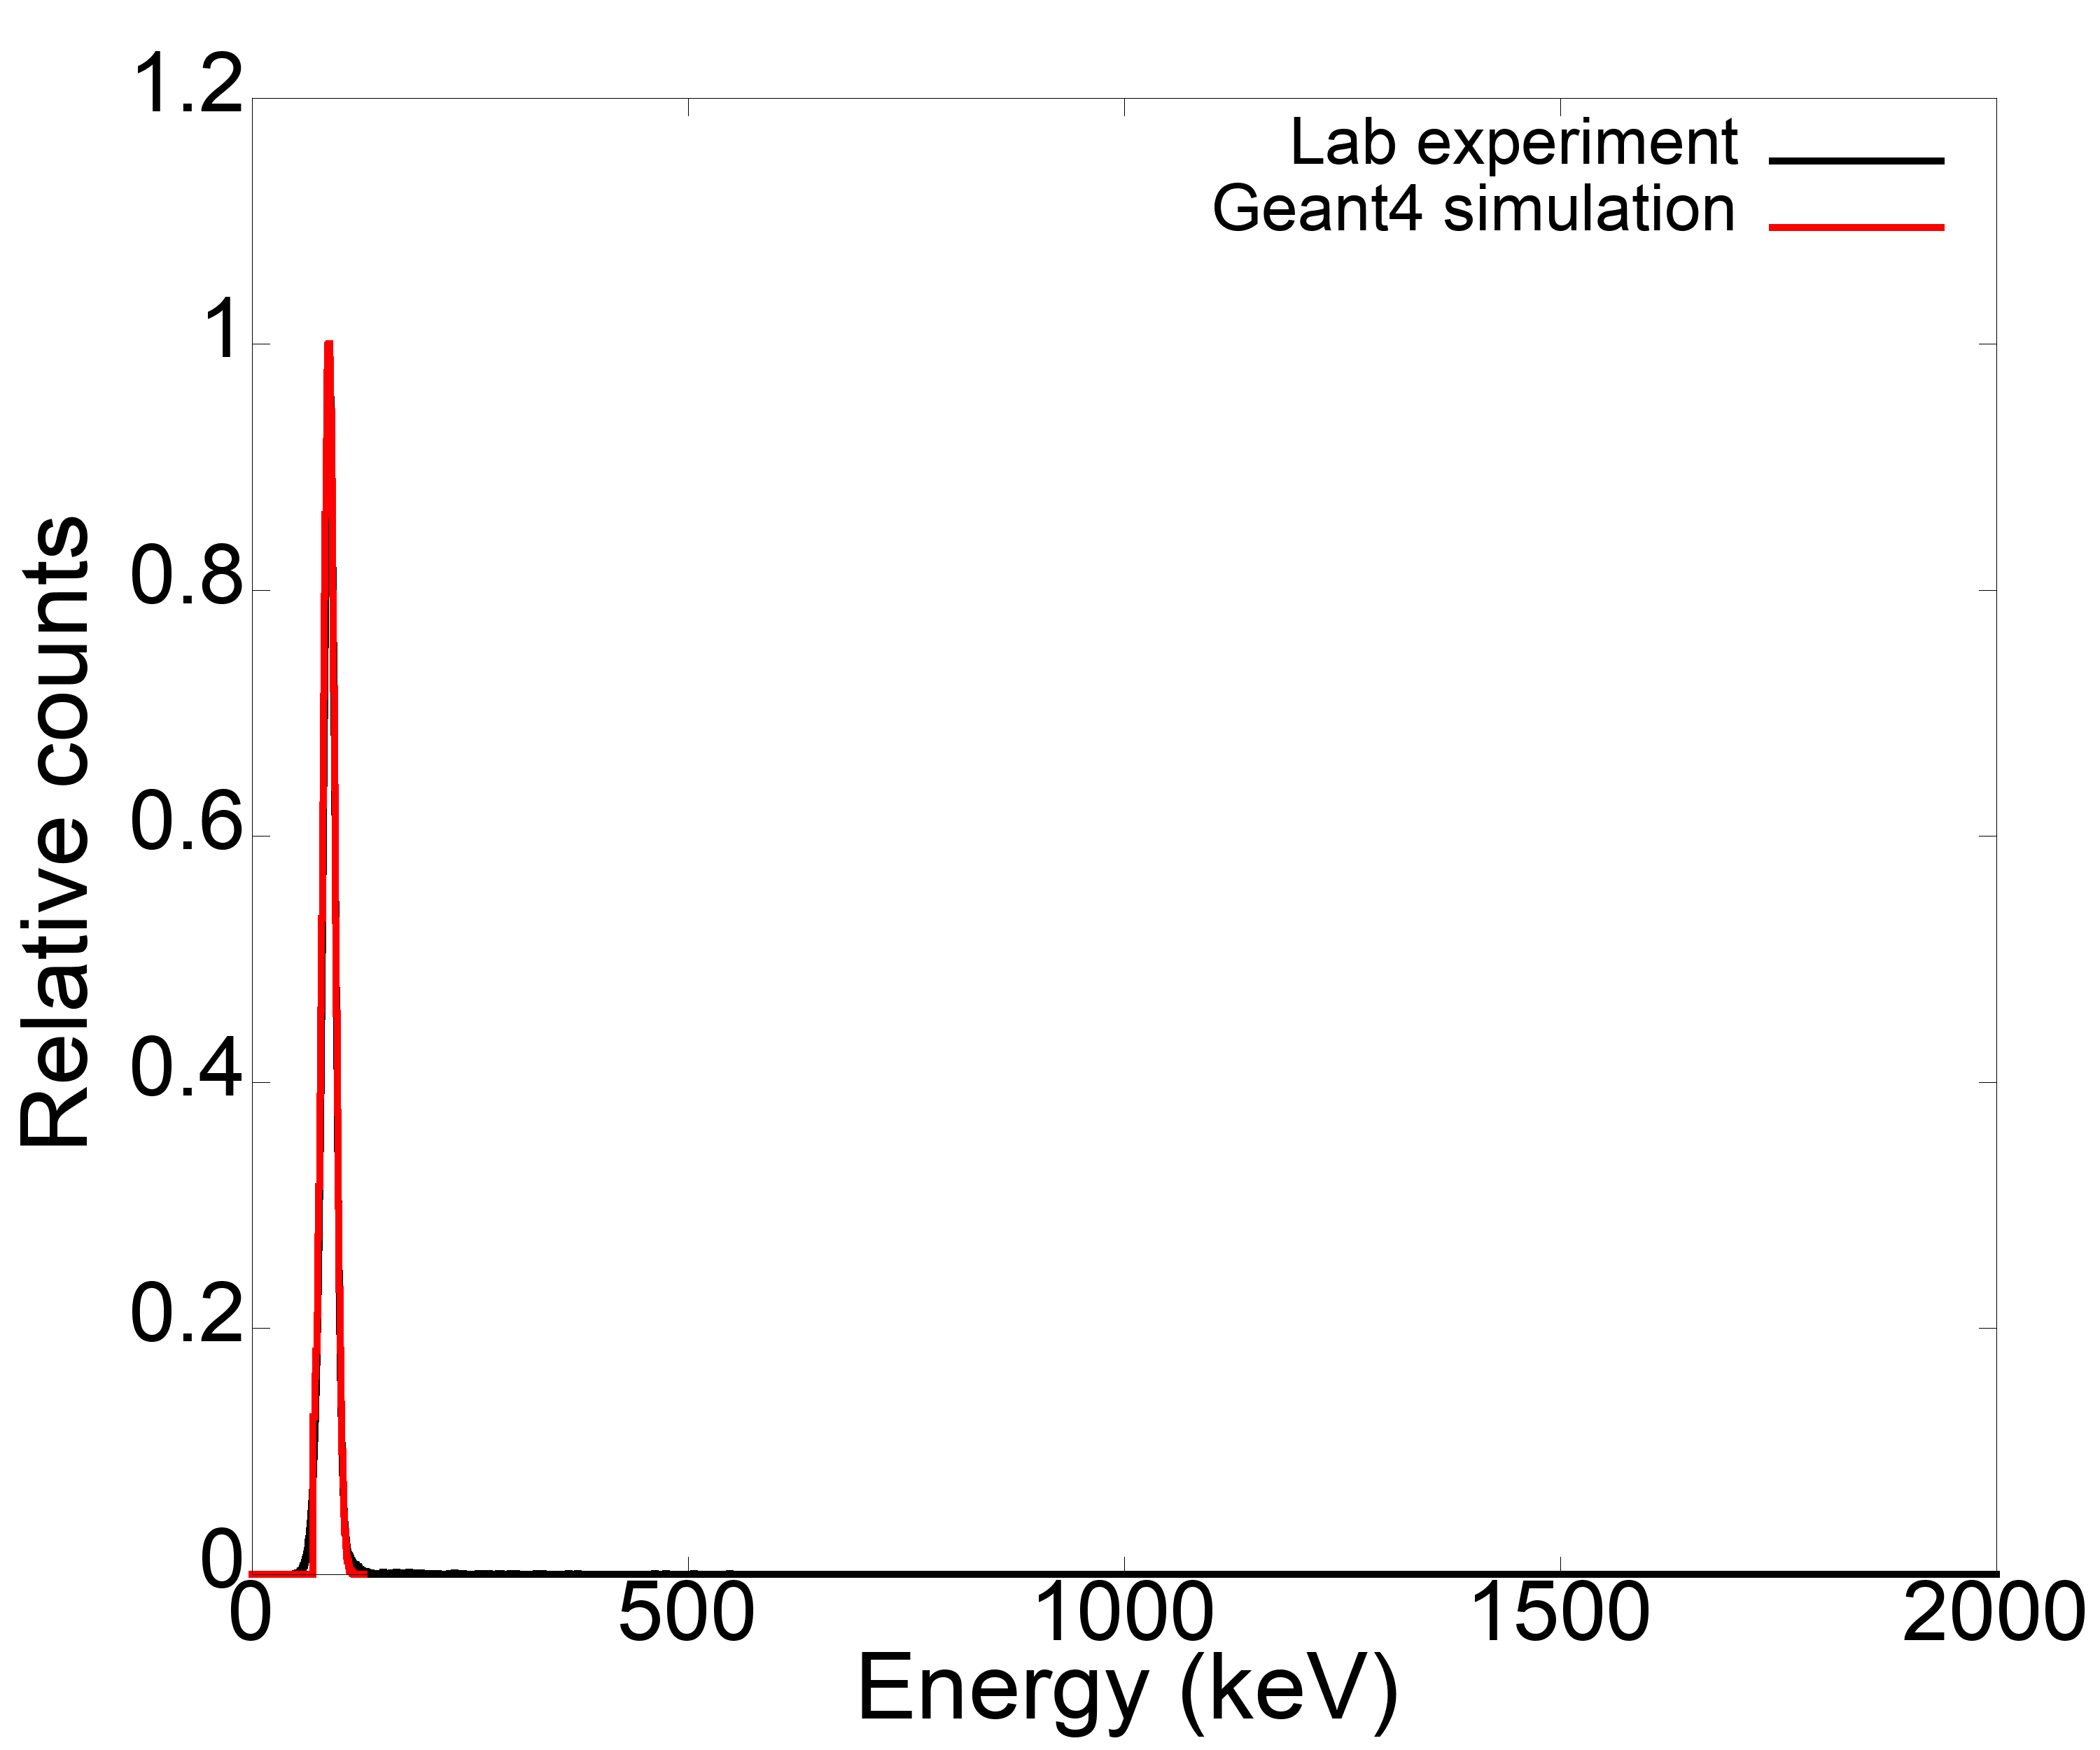
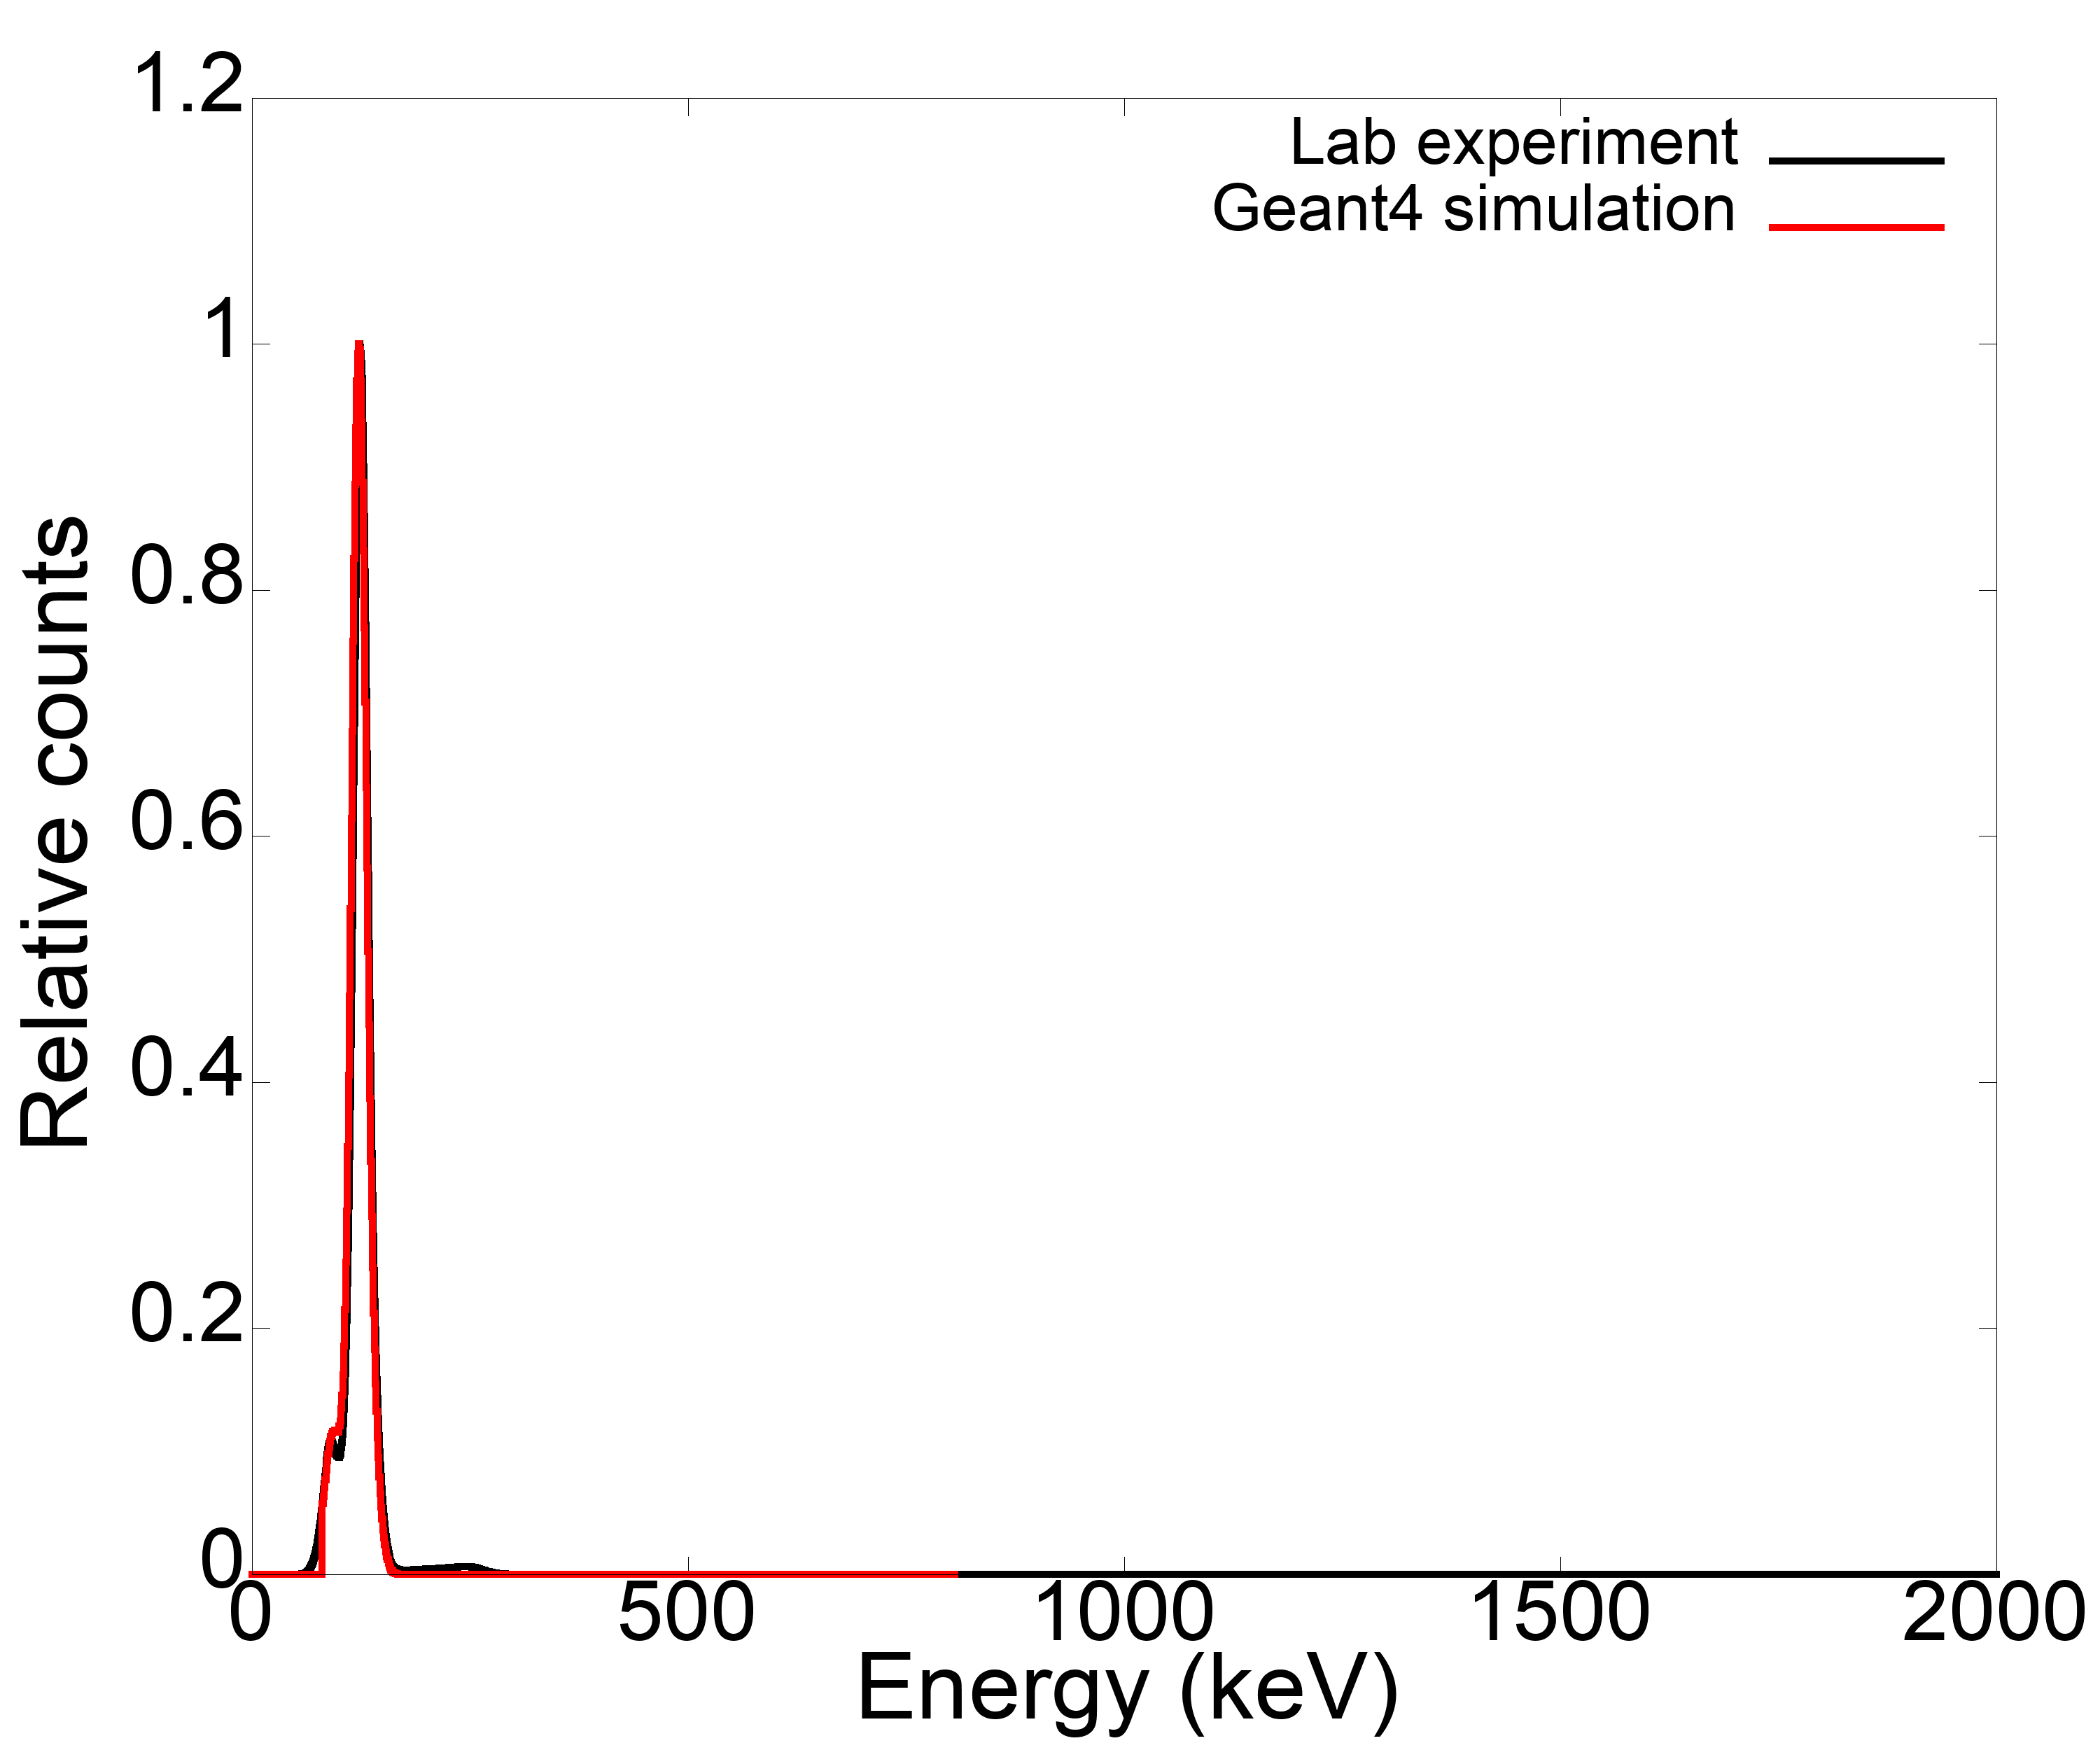
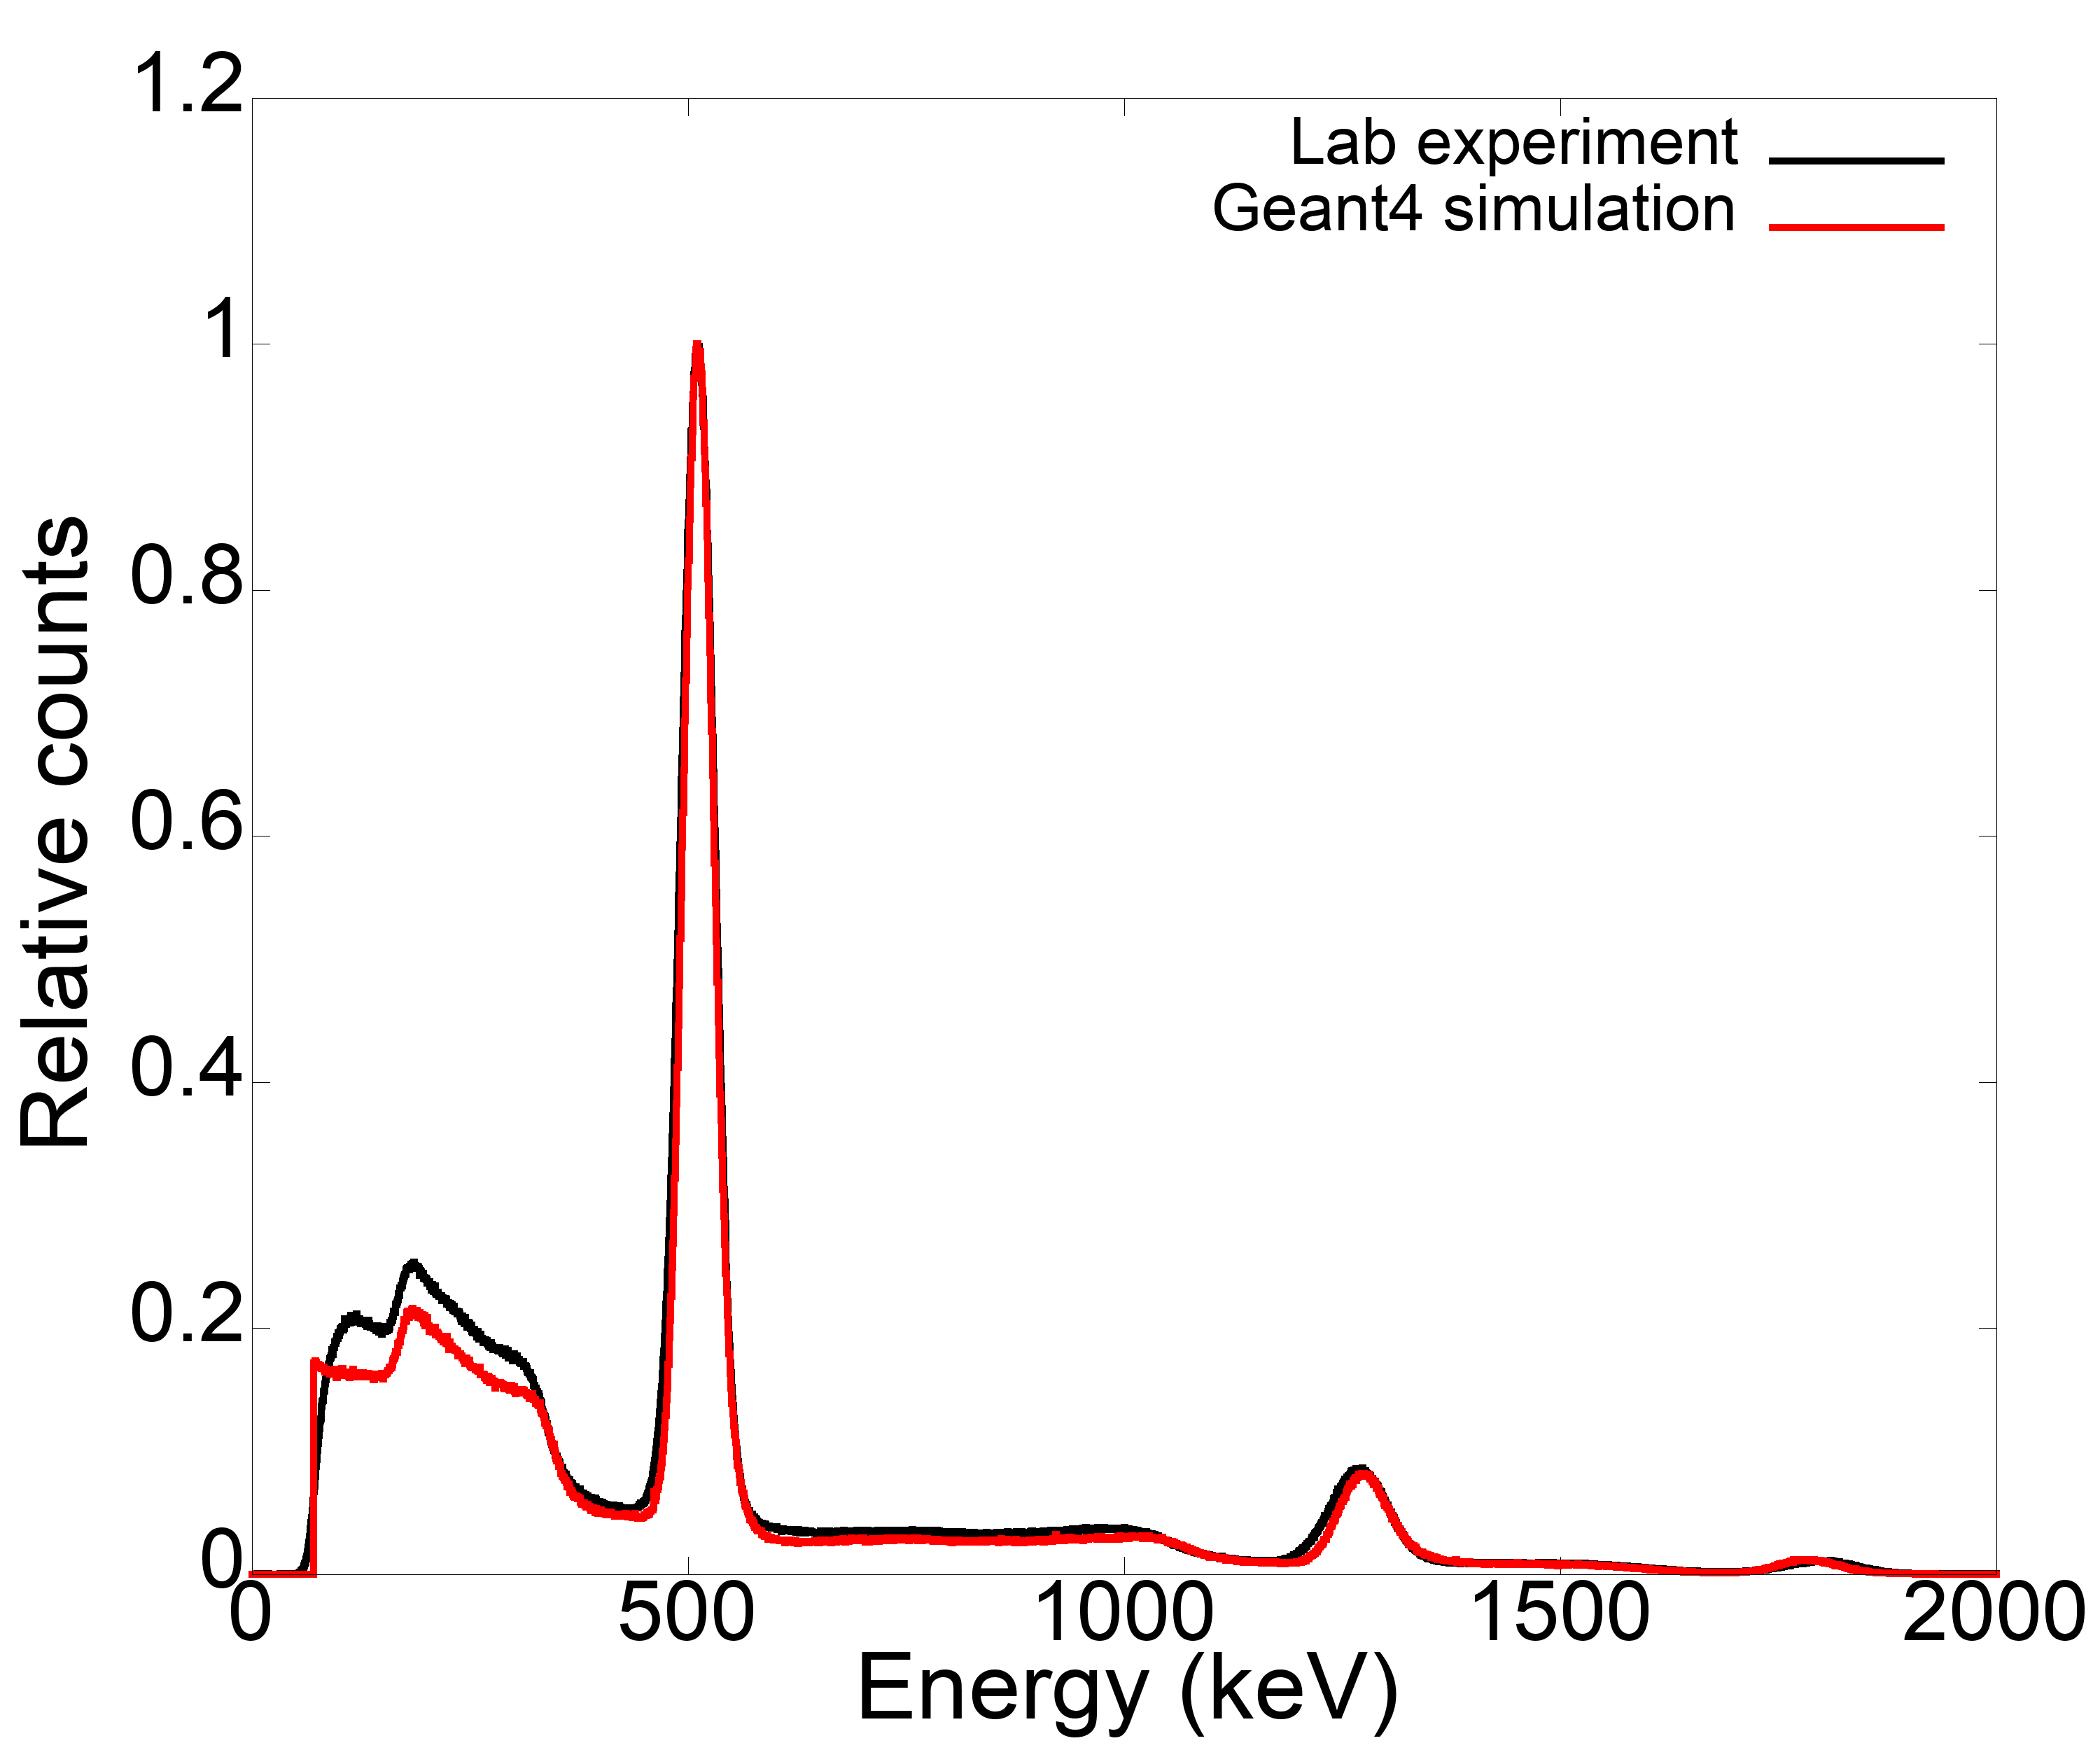
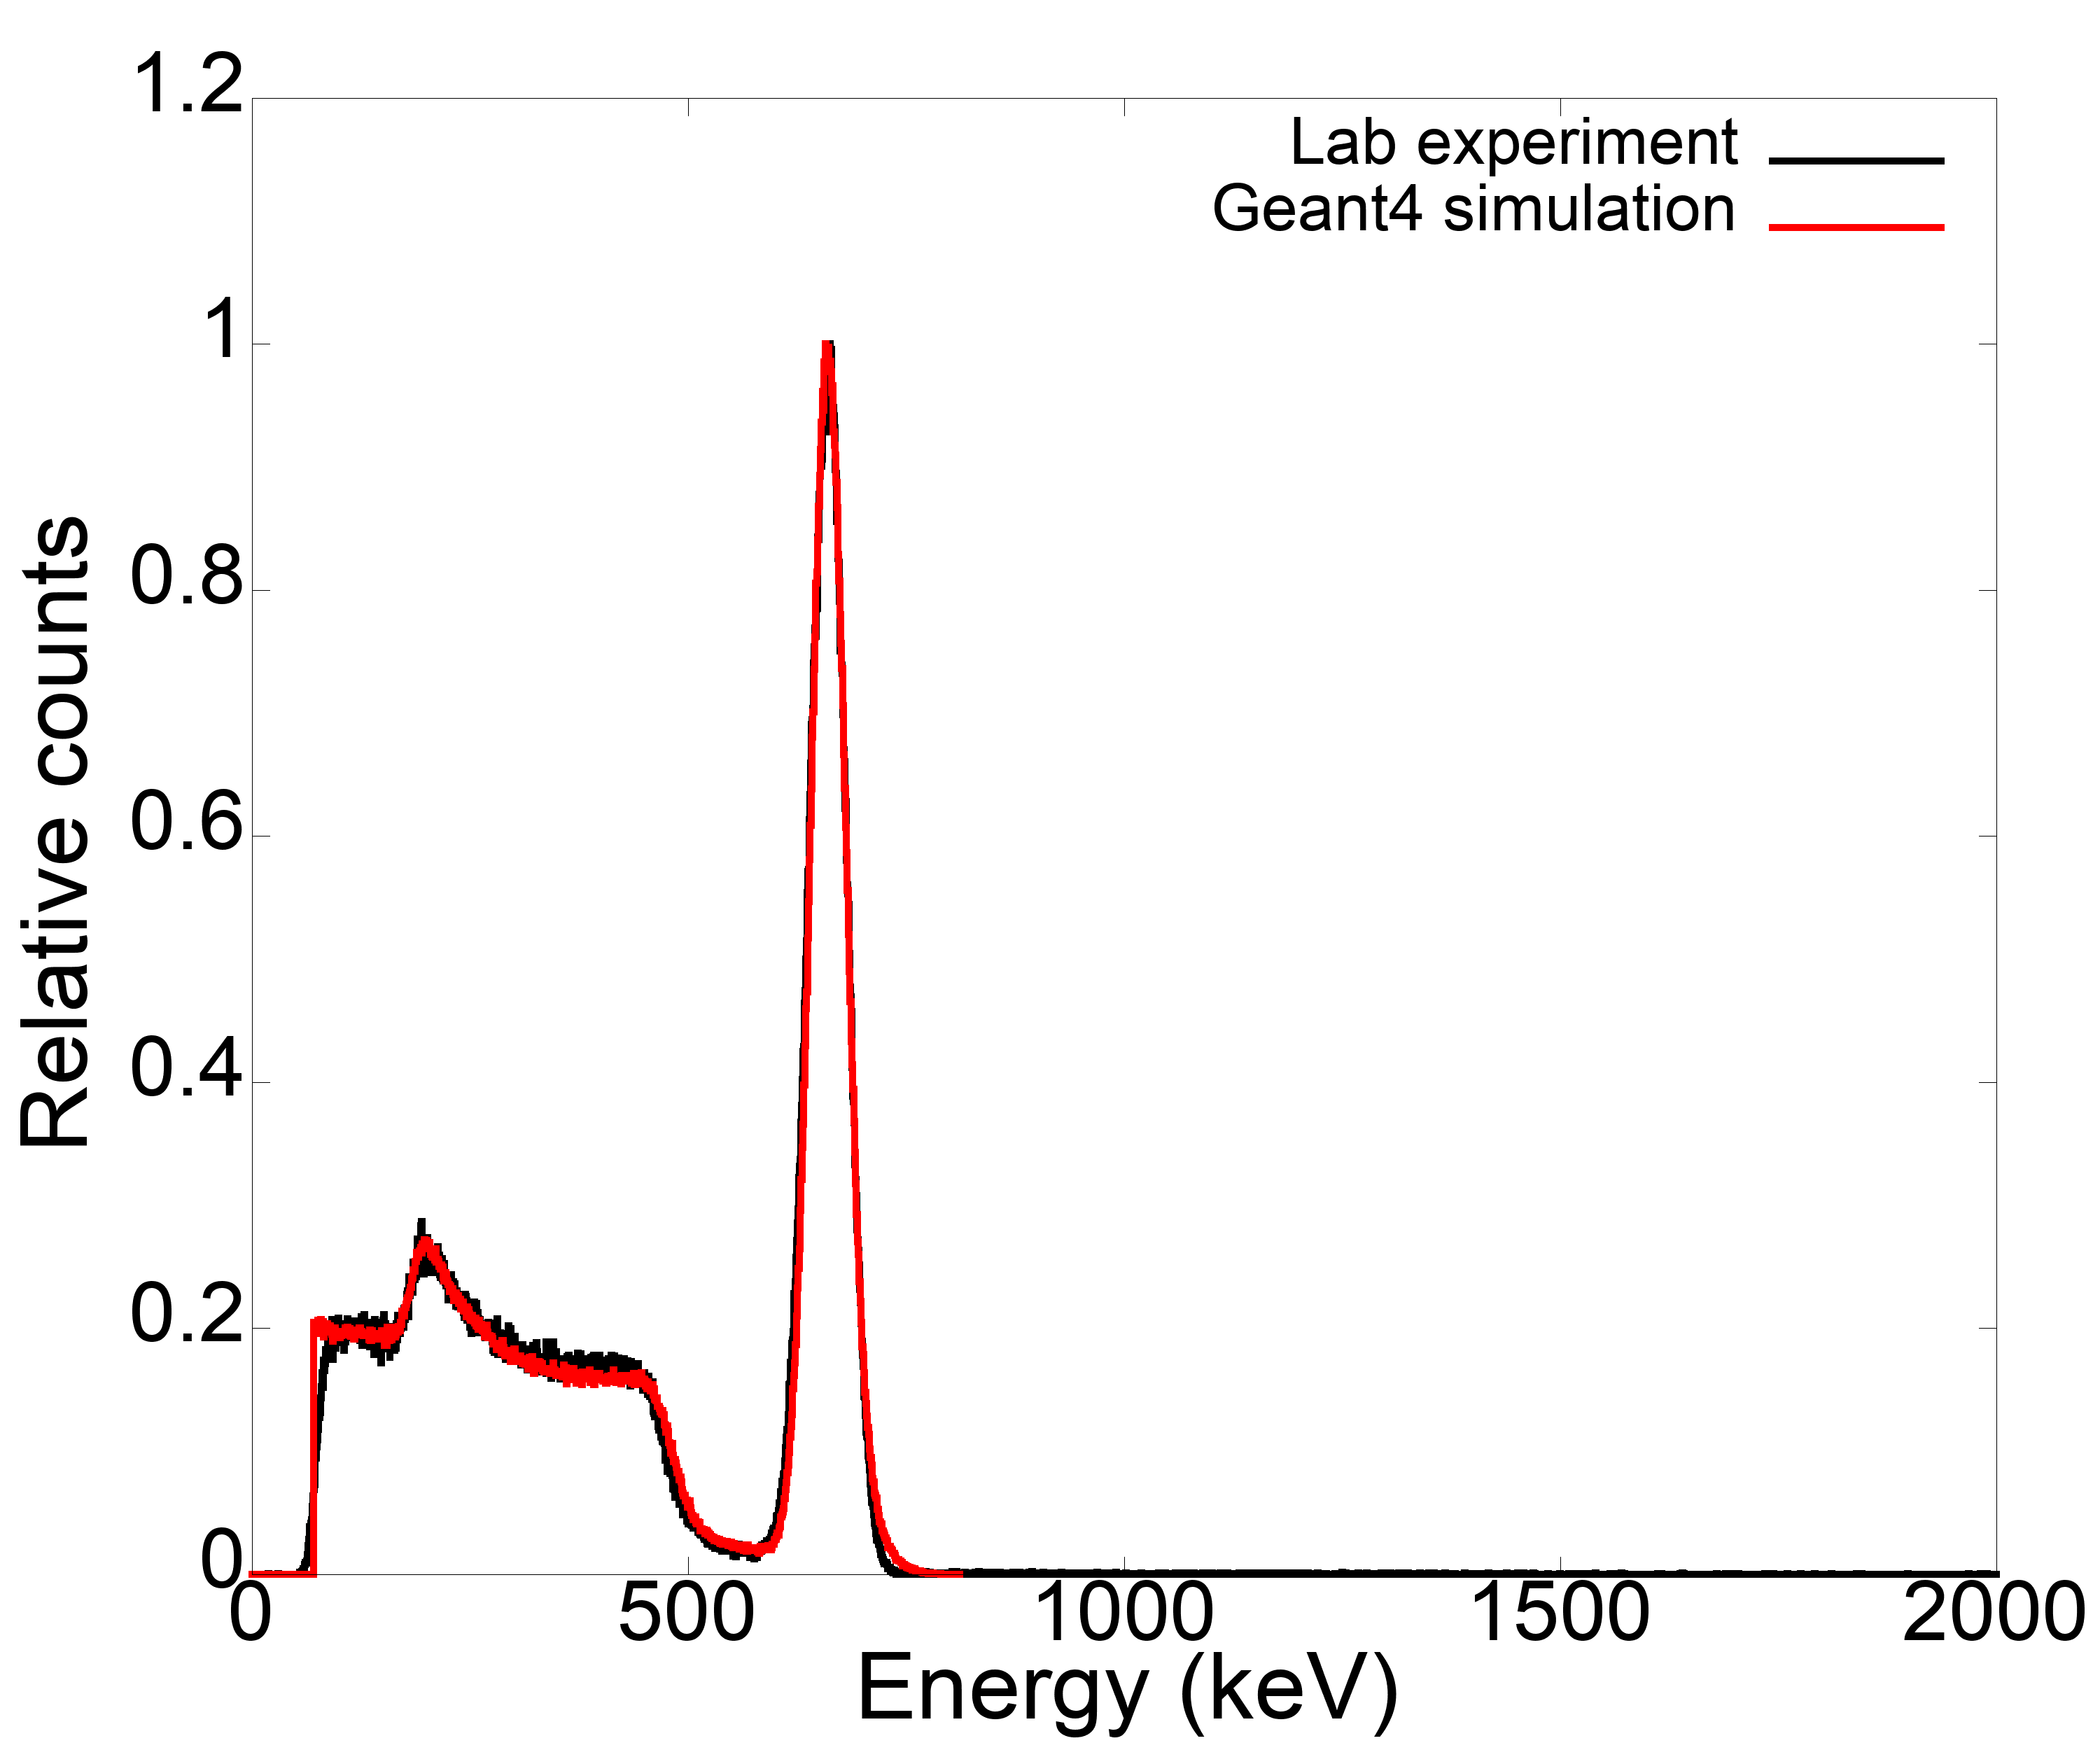
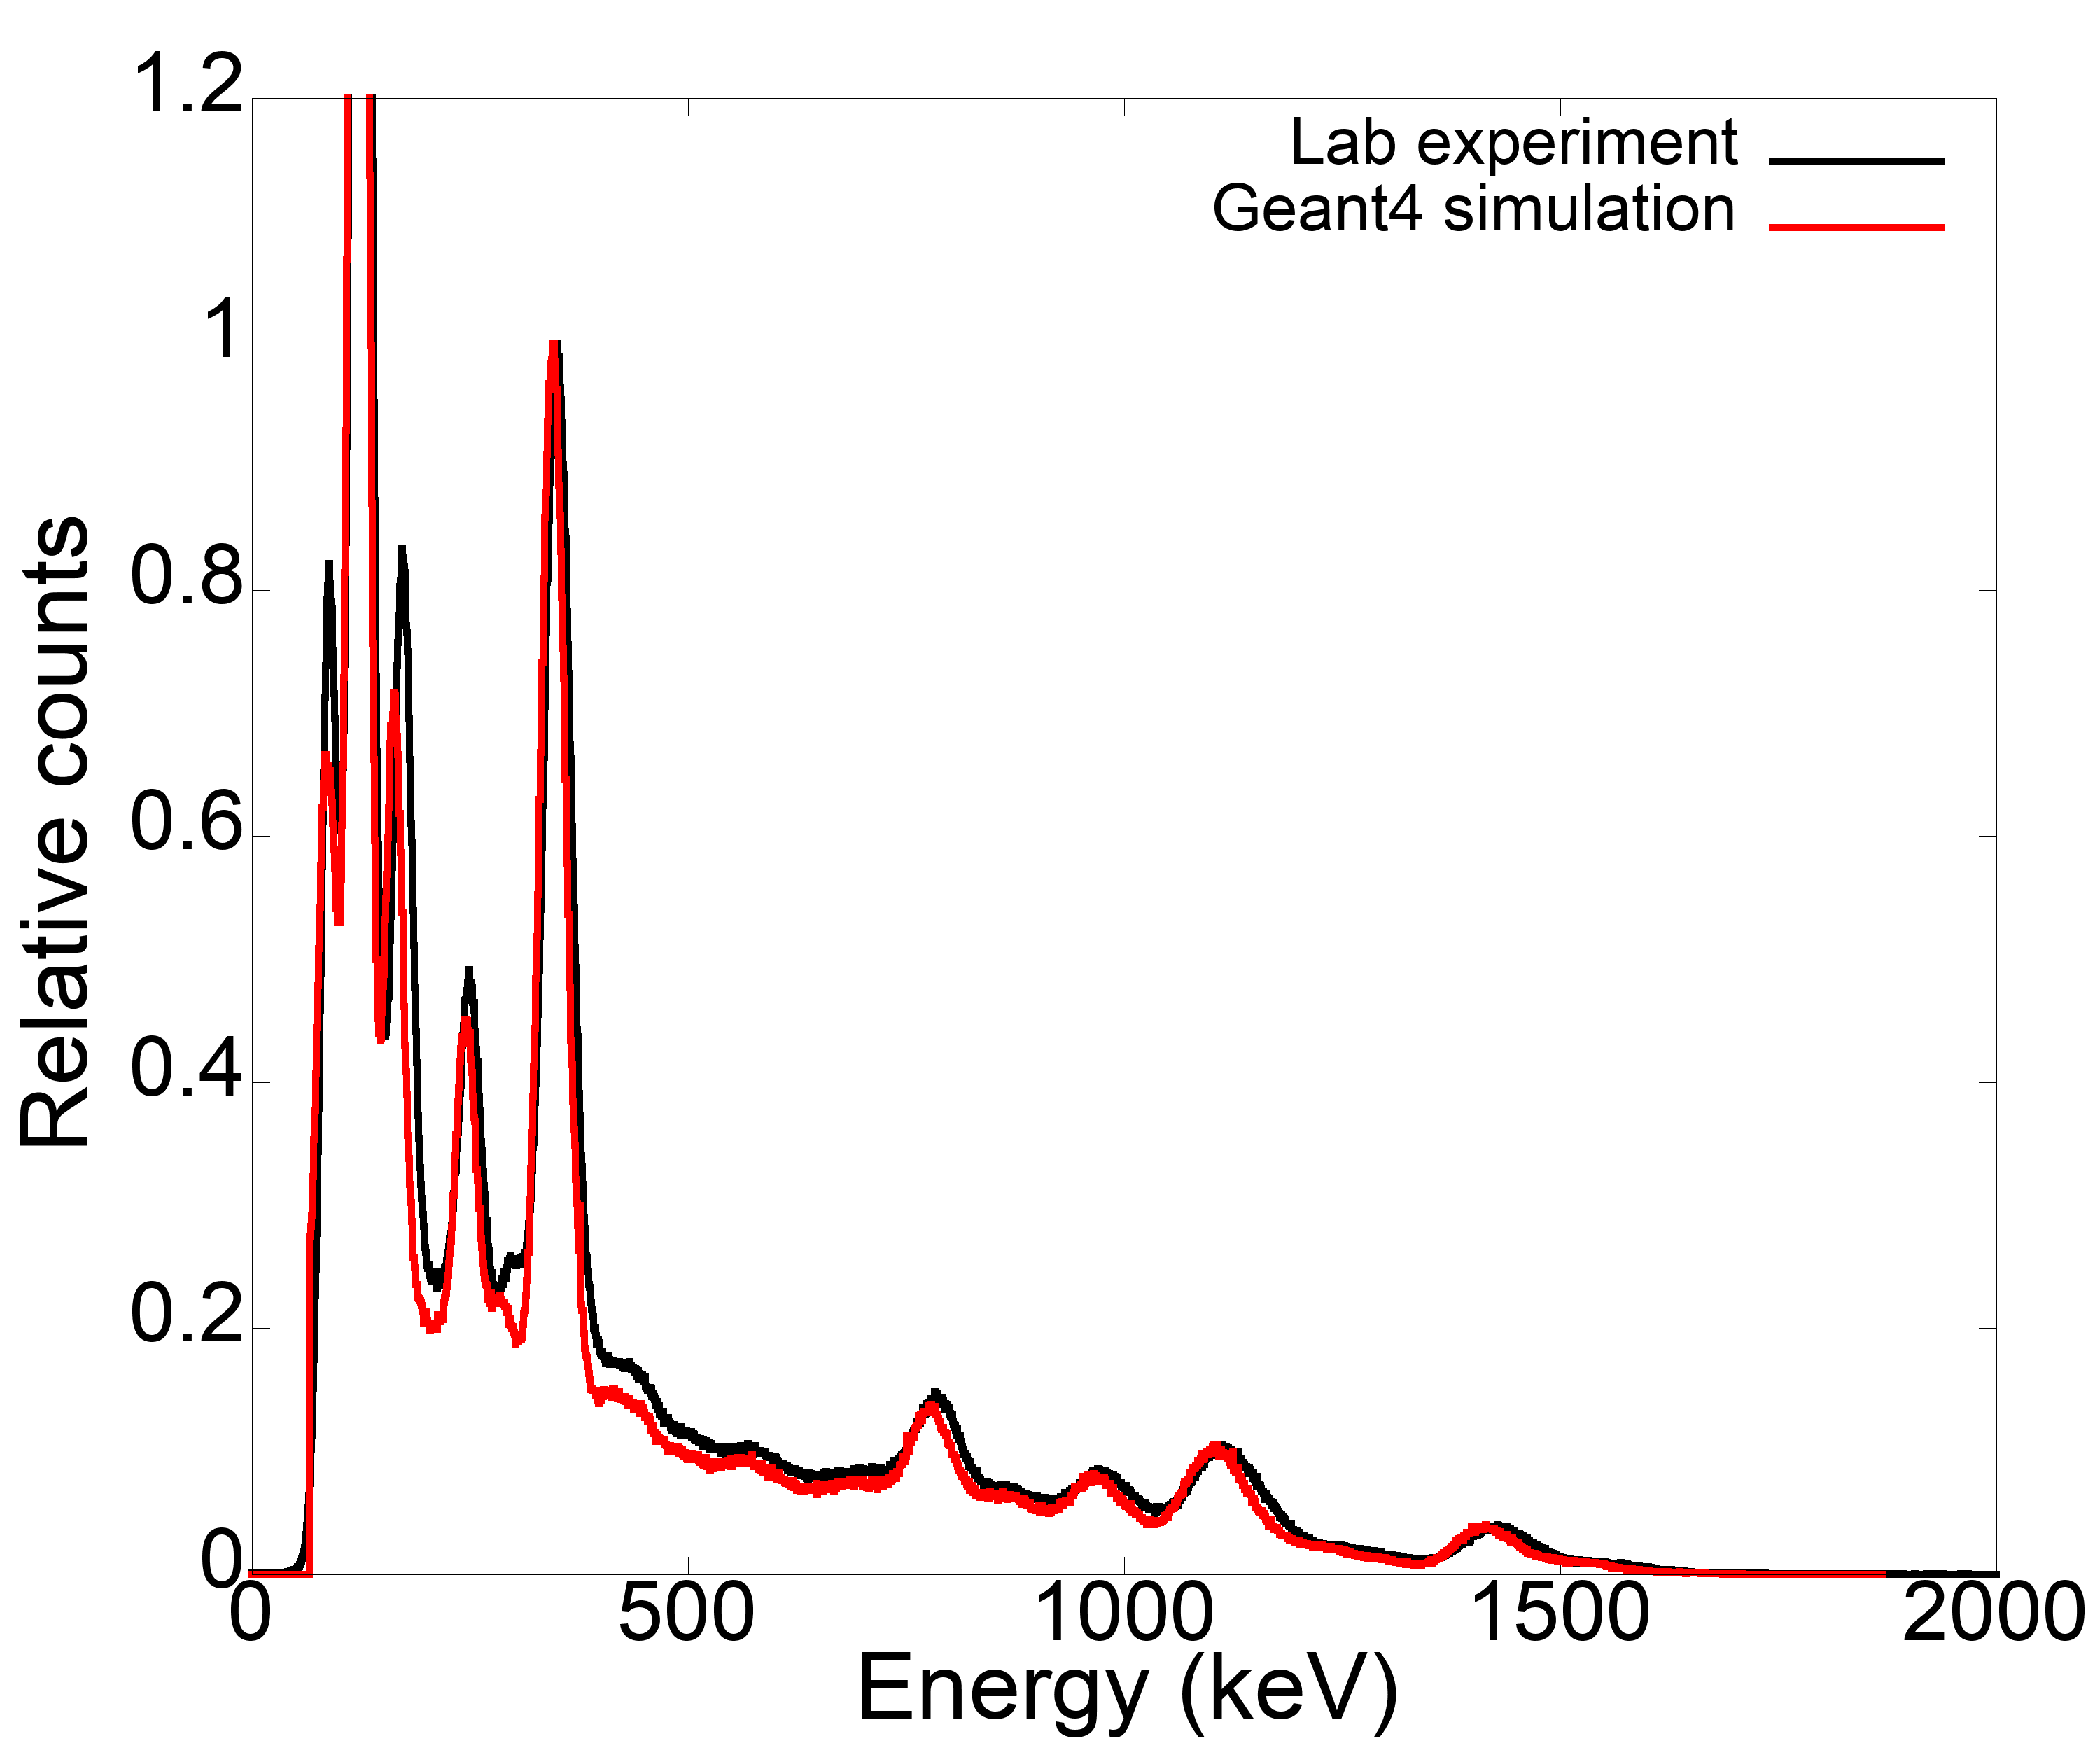
Figs. (2) to (6) present the simulated and experimental energy spectra for the five scintillation materials. Overall, the Geant4 application accurately predicted the spectral features observed in the experimental energy spectra. These features included the Compton continuum, Compton edge, photopeaks, annihilation peaks, double-sum peaks, and, in cases with sufficient low-level detection, X-ray peaks. The average difference between simulated and experimental photopeak FWHM was less than 2%, as shown in Table (2). Moreover, NCCC values demonstrated overall agreement between the experimental and simulated detector platforms (see Table (3)). This section discusses the performance of the simulation platform in more detail by comparing spectral features and figures of merit to the energy spectra generated from the experimental platform.
The experimental 22Na spectra for GAGG:Ce and BGO revealed a double-sum peak at 1766 keV and 1769 keV (see Figs. (2(c)) and (4(c))). This was caused by the 511 keV and 1275 keV gamma ray interacting with the SiPM in the same time window. As the double-sum peaks were not 1786 keV (511 keV + 1275 keV), the SiPM did not fully capture the optical response from the scintillator crystals. This was most likely caused by X-ray escape. Double-sum peaks were negligible in the 22Na energy spectra for CLLBC:Ce, NaI:Tl, and CsI:Tl (Figs. (3(c)), (5(c)), and (6(c))) due to their lower stopping power, making it less likely for both gamma rays to interact with them in the same time window. GAGG:Ce and BGO’s high stopping power corresponded to less statistical noise in the 137Cs spectra (Figs. (2(d)) and (4(d))) compared to the other scintillators. Statistical noise was more prevalent for 137Cs compared to other isotopes because 137Cs had the lowest radioactivity. The peak immediately above the low-level detection threshold observed in the 22Na and 137Cs experimental spectra (e.g., GAGG:Ce in Figs. (2(c)) and (2(d))) can be attributed to electronic noise. This peak was not observed in the simulated spectra because electronic noise was not accounted for in the simulation platform.
The average difference between simulated and experimental photopeak FWHM was 1% for CsI:Tl, 1% for GAGG:Ce and CLLBC:Ce, 2% for NaI:Tl, and 4% for BGO. For each scintillator, the energy resolution generally improved as the characteristic gamma ray energy increased. Although this was true for 152Eu within the photopeaks for the same source, it was not true between photopeaks of other isotopes. For example, the 344 keV and 964 keV 152Eu photopeaks for CsI:Tl had a FWHM of 9.55% and 7.17% respectively, however the FWHM for the 662 keV photopeak was 6.93%. This phenomena can be attributed to X-ray escape peak broadening and cascade summing from multiple 152Eu radioactive decays. The poor energy resolution of BGO blurred the 122 keV and 136 keV 57Co photopeaks together so that the 136 keV photopeak could not be resolved, as shown in Fig. (4(b)) and Table (2). Moreover, the poor energy resolution of BGO was attributed to the 16% difference between the simulated and experimental 245 keV 152Eu photopeak FWHM. Overall, CLLBC:Ce had the best energy resolution (lowest photopeak FWHM) across the 30 keV to 2 MeV energy range. For the simulated 662 keV photopeak, CLLBC:Ce had an energy resolution of 3.52%, NaI:Tl with 6.70%, GAGG:Ce with 6.83%, CsI:Tl with 6.93%, and BGO with 13.4%.
The NCCC values for NaI:Tl were for the 57Co and 22Na energy spectra but 0.308, 0.798, and 0.758 for 109Cd, 137Cs, and 152Eu. Across all isotopes, the NCCC value for CsI:Tl was . The differences in NCCC values between the NaI:Tl and CsI:Tl simulations were attributed to the differences in gamma ray interaction between sodium and caesium in the scintillators. As sodium is a low material, the gamma ray is more likely to Compton scatter out of the NaI:Tl and interact with the detector and surrounding environment. Smaller NCCC values were observed in the scintillators where more Compton scattering occurred, indicating a discrepancy in the likelihood of Compton scattering in the simulation platform compared to the experimental platform. This can be attributed to lower fidelity electronic modelling and geometry approximations made in the Geant4 application. Discrepancies in NCCC values for BGO can also be attributed to scintillator non-proportionality, which was not accounted for in the energy calibration process due to limited low energy photopeaks. For example, the 109Cd energy spectrum had an NCCC value of 0.750, caused by the misaligned 88 keV photopeaks (see Fig. (4(a))).
4 Conclusion
A detailed SiPM-based scintillator detector simulation platform was developed in Geant4. The response of GAGG:Ce, CLLBC:Ce, BGO, NaI:Tl, and CsI:Tl to characteristic gamma rays with energies between 30 keV to 2 MeV were simulated. These results were benchmarked against experiments. The simulation platform successfully predicted the spectral features measured in the experiments. Moreover, the average simulated photopeak FWHM was within 2% of the experiments and the NCCC values indicated overall agreement between simulated and experimental energy spectra. There were minor discrepancies in the simulated FWHM and NCCC values, which can be attributed to: (1) variations in the Compton continuum caused by geometry approximations, and (2) detector signal processing electronics modelling.
Acknowledgements
L. Miller would like to acknowledge the Optical Sciences Centre at Swinburne University of Technology for support of the project. This research was supported by The University of Melbourne’s Research Computing Services, the Petascale Campus Initiative, and an Australian Government Research Training Program (RTP) Scholarship.
(a)109Cd
(b)57Co
(c)22Na
(d)137Cs
(e)152Eu
Figure 2: Experimental and simulated gamma ray energy spectra for the GAGG:Ce scintillator detector.
(a)109Cd
(b)57Co
(c)22Na
(d)137Cs
(e)152Eu
Figure 3: Experimental and simulated gamma ray energy spectra for the CLLBC:Ce scintillator detector.
(a)109Cd
(b)57Co
(c)22Na
(d)137Cs
(e)152Eu
Figure 4: Experimental and simulated gamma ray energy spectra for the BGO scintillator detector.
(a)109Cd
(b)57Co
(c)22Na
(d)137Cs
(e)152Eu
Figure 5: Experimental and simulated gamma ray energy spectra for the NaI:Tl scintillator detector.
(a)109Cd
(b)57Co
(c)22Na
(d)137Cs
(e)152Eu
Figure 6: Experimental and simulated gamma ray energy spectra for the CsI:Tl scintillator detector.
Characteristicgamma ray(keV)
GAGG:Ce
CLLBC:Ce
BGO
NaI:Tl
CsI:Tl
Exp
Sim
Exp
Sim
Exp
Sim
Exp
Sim
Exp
Sim
109Cd: 88.03
18.7
16.0
11.8
9.62
30.2
34.4
14.2
17.8
17.2
18.2
57Co: 122.06
15.4
13.6
9.59
8.20
34.8
31.4
12.9
14.5
15.2
15.4
57Co: 136.47
13.9
12.2
8.58
7.33
N/A
N/A
11.4
13.1
13.5
13.9
152Eu: 244.70
10.4
10.4
6.64
5.95
38.4
54.9
11.0
10.8
11.0
11.1
152Eu: 344.28
8.96
8.67
5.48
4.75
16.9
18.5
10.3
8.61
10.4
9.55
22Na: 511.00
7.32
7.55
4.72
4.00
13.0
15.1
8.78
7.59
8.72
7.88
137Cs: 661.66
6.43
6.83
4.19
3.52
11.2
13.4
8.09
6.70
7.72
6.93
152Eu: 778.90
6.38
6.66
4.18
3.36
11.3
12.6
7.69
6.15
7.00
6.63
152Eu: 964.06
7.34
9.18
3.50
2.49
12.4
16.0
7.86
6.91
6.73
7.17
22Na: 1274.54
4.62
5.37
3.27
2.55
7.83
11.1
6.32
4.89
5.94
5.06
152Eu: 1408.01
6.33
7.57
3.29
2.29
9.58
11.7
7.69
5.79
6.31
6.76
Table 2: Experimental and simulated full width half maximum (%) extracted from the energy spectra.
Radioactivesource
GAGG:Ce
CLLBC:Ce
BGO
NaI:Tl
CsI:Tl
109Cd
0.987
0.275
0.750
0.308
0.999
57Co
0.996
0.993
0.998
0.996
0.989
137Cs
0.987
0.978
0.987
0.798
0.997
152Eu
0.965
0.962
0.972
0.758
0.982
22Na
0.996
0.991
0.995
0.988
0.995
Table 3: NCCC between experimental and simulated energy spectra.
Vetter et al. [2018]
K. Vetter, R. Barnowksi,
A. Haefner, T. H. Joshi,
R. Pavlovsky, B. J. Quiter,
Gamma-ray imaging for nuclear security and safety:
Towards 3-d gamma-ray vision,
Nuclear Instruments and Methods in Physics Research
Section A: Accelerators, Spectrometers, Detectors and Associated Equipment
878 (2018) 159–168.
URL: https://linkinghub.elsevier.com/retrieve/pii/S0168900217309269.
doi:10.1016/j.nima.2017.08.040.
Hawrami et al. [2016]
R. Hawrami, L. S. Pandian,
E. Ariesanti, J. Glodo,
J. Finkelstein, J. Tower,
K. Shah,
Cs2LiLa(Br,Cl)6 crystals for nuclear security
applications,
IEEE Transactions on Nuclear Science
63 (2016) 509–512.
URL: http://ieeexplore.ieee.org/document/7454852/.
doi:10.1109/TNS.2016.2522188.
Geant4 Collaboration [2022]
Geant4 Collaboration,
Book for application developers
(2022). URL: https://geant4.web.cern.ch/.
Brown et al. [2023]
J. M. Brown, L. Chartier,
D. Boardman, J. Barnes,
A. Flynn,
Modelling the response of CLLBC(Ce) and TLYC(Ce)
SiPM-based radiation detectors in mixed radiation fields with Geant4,
Nuclear Instruments and Methods in Physics Research
Section A: Accelerators, Spectrometers, Detectors and Associated Equipment
1057 (2023) 168726.
URL: https://linkinghub.elsevier.com/retrieve/pii/S0168900223007179.
doi:10.1016/j.nima.2023.168726.
Levin and Moisan [1996]
A. Levin, C. Moisan,
A more physical approach to model the surface
treatment of scintillation counters and its implementation into DETECT,
volume 2, IEEE,
1996, pp. 702–706. URL: http://ieeexplore.ieee.org/document/591410/.
doi:10.1109/NSSMIC.1996.591410.
Laan et al. [2010]
D. J. V. D. Laan, D. R. Schaart,
M. C. Maas, F. J. Beekman,
P. Bruyndonckx, C. W. V. Eijk,
Optical simulation of monolithic scintillator
detectors using GATE/GEANT4,
Physics in Medicine and Biology
55 (2010) 1659–1675.
doi:10.1088/0031-9155/55/6/009.
Brown et al. [2014]
J. Brown, M. Dimmock,
J. Gillam, D. Paganin,
A low energy bound atomic electron compton scattering
model for Geant4,
Nuclear Instruments and Methods in Physics Research
Section B: Beam Interactions with Materials and Atoms 338
(2014) 77–88. URL: https://linkinghub.elsevier.com/retrieve/pii/S0168583X14006934.
doi:10.1016/j.nimb.2014.07.042.
Hernández-Andrés et al. [2001]
J. Hernández-Andrés, J. Romero,
R. L. Lee,
Colorimetric and spectroradiometric characteristics
of narrow-field-of-view clear skylight in Granada, Spain,
Journal of the Optical Society of America A
18 (2001) 412. URL: https://opg.optica.org/abstract.cfm?URI=josaa-18-2-412.
doi:10.1364/JOSAA.18.000412.
Brown et al. [2020]
J. M. C. Brown, S. E. Brunner,
D. R. Schaart,
A high count-rate and depth-of-interaction resolving
single-layered one-side readout pixelated scintillator crystal array for
PET applications,
IEEE Transactions on Radiation and Plasma Medical
Sciences 4 (2020)
361–370. URL: https://ieeexplore.ieee.org/document/8876605/.
doi:10.1109/TRPMS.2019.2948106.
Kobayashi et al. [2012]
M. Kobayashi, Y. Tamagawa,
S. Tomita, A. Yamamoto,
I. Ogawa, Y. Usuki,
Significantly different pulse shapes for -
and -rays in Gd3Al2Ga3O12:Ce3+ scintillating
crystals,
Nuclear Instruments and Methods in Physics Research
Section A: Accelerators, Spectrometers, Detectors and Associated Equipment
694 (2012) 91–94.
URL: https://linkinghub.elsevier.com/retrieve/pii/S0168900212008479.
doi:10.1016/j.nima.2012.07.055.
Mao et al. [2008]
R. Mao, L. Zhang, R.-Y.
Zhu,
Optical and scintillation properties of inorganic
scintillators in high energy physics,
IEEE Transactions on Nuclear Science
55 (2008) 2425–2431.
URL: http://ieeexplore.ieee.org/document/4636955/.
doi:10.1109/TNS.2008.2000776.
Moszynski et al. [1997]
M. Moszynski, M. Kapusta,
M. Mayhugh, D. Wolski,
S. Flyckt,
Absolute light output of scintillators,
IEEE Transactions on Nuclear Science
44 (1997) 1052–1061.
URL: https://ieeexplore.ieee.org/document/603803/.
doi:10.1109/23.603803.
Grodzicka-Kobylka et al. [2017]
M. Grodzicka-Kobylka, T. Szczesniak,
M. Moszyński,
Comparison of SensL and Hamamatsu 4×4 channel
SiPM arrays in gamma spectrometry with scintillators,
Nuclear Instruments and Methods in Physics Research
Section A: Accelerators, Spectrometers, Detectors and Associated Equipment
856 (2017) 53–64.
URL: https://linkinghub.elsevier.com/retrieve/pii/S0168900217303388.
doi:10.1016/j.nima.2017.03.015.
Appendix A Geant4 Material Properties
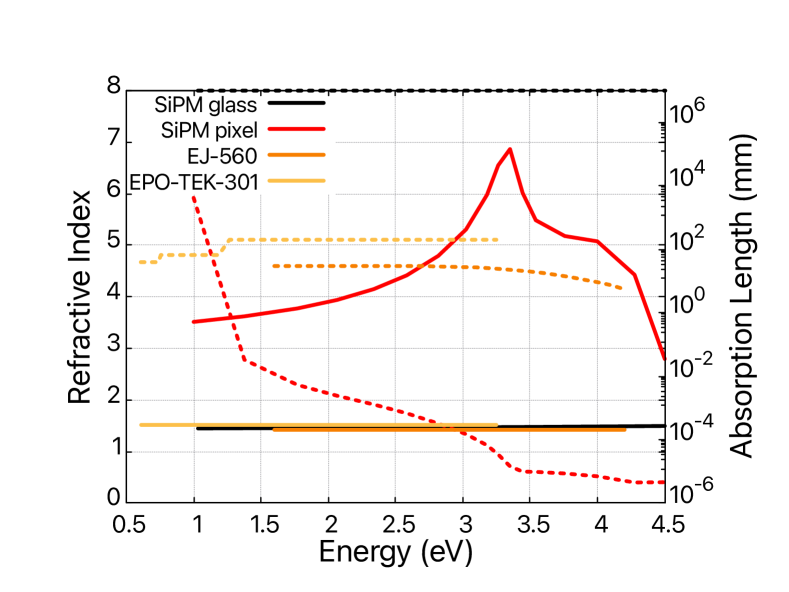
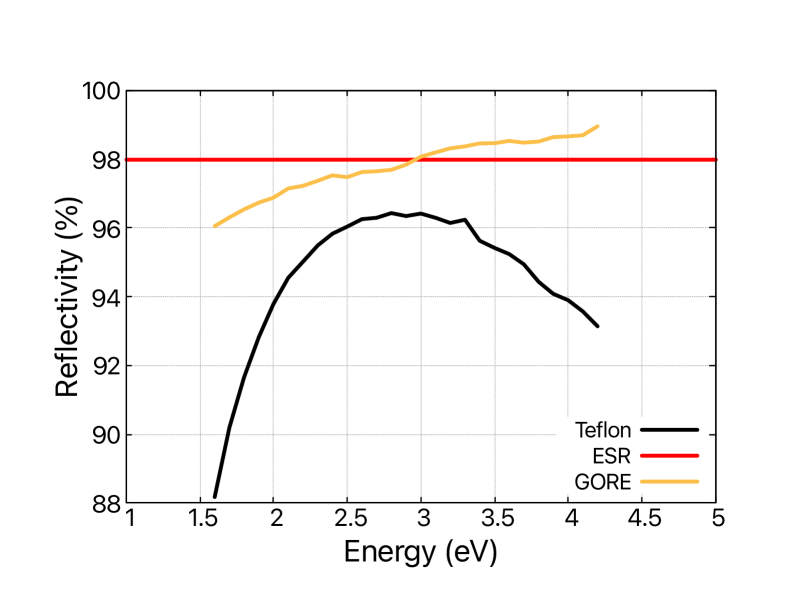
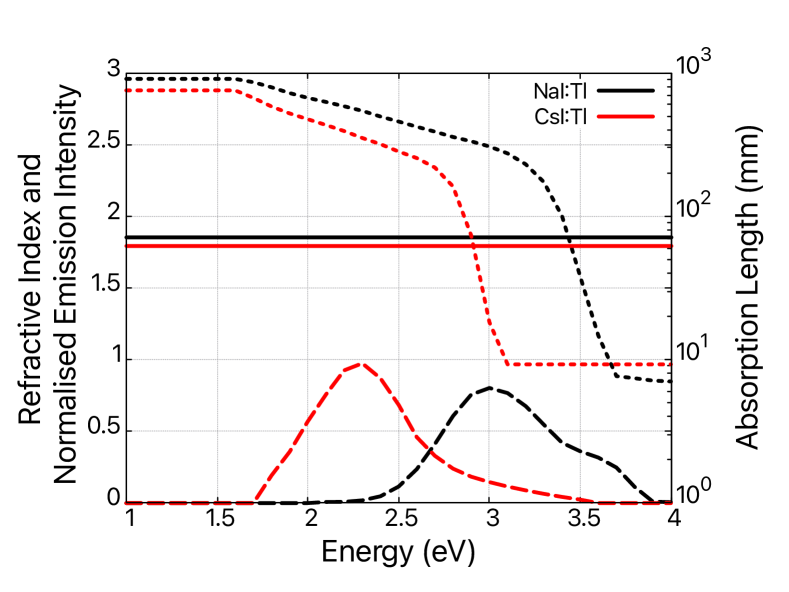
This appendix contains the density, elemental composition, and optical/ scintillation properties of all materials used in the Geant4 simulation platform. Scintillator material properties for GAGG:Ce, CLLBC:Ce, BGO, NaI:Tl, and CsI:Tl are summarised in Table (4) with reference to scintillator refractive index, emission spectrum, and absorption length data in Figs. (7(c)) and (7(d)). Material properties for EPO-TEK-301, Teflon tape, ESR, GORE diffuse reflector, glass, SiPM pixel, and EJ-560 optical pad can be seen in Table (5) with refractive index and optical reflectivity/ efficiency data presented in Figs. (7(a)) and (7(b)).
(a)Refractive index and absorption length for the glass [12, 18], SiPM pixel [12, 19], EJ-560 [12, 20], and EPO-TEK-301 [21].
(b)Reflectivity for the Teflon tape [22], ESR [23, 24, 25], and GORE diffuse reflector [12, 22].
(c)Refractive index, emission intensity, and absorption length for GAGG:Ce [23, 24, 26] and BGO [27, 28]. Refractive index and emission intensity for CLLBC:Ce [12, 5].
(d)Refractive index, emission intensity, and absorption length for NaI:Tl and CsI:Tl [23, 24, 27].
Figure 7: Material refractive index and reflectivity (solid line), normalised emission intensity (dashed line), and absorption length (dotted line) data implemented in the Geant4 simulation platform.