DT-DDNN: A Physical Layer Security Attack Detector in 5G RF Domain for CAVs
Abstract
The Synchronization Signal Block (SSB) is a fundamental component of the 5G New Radio (NR) air interface, crucial for the initial access procedure of Connected and Automated Vehicles (CAVs), and serves several key purposes in the network’s operation. However, due to the predictable nature of SSB transmission, including the Primary and Secondary Synchronization Signals (PSS and SSS), jamming attacks are critical threats. These attacks, which can be executed without requiring high power or complex equipment, pose substantial risks to the 5G network, particularly as a result of the unencrypted transmission of control signals. Leveraging RF domain knowledge, this work presents a novel deep learning-based technique for detecting jammers in CAV networks. Unlike the existing jamming detection algorithms that mostly rely on network parameters, we introduce a double-threshold deep learning jamming detector by focusing on the SSB. The detection method is focused on RF domain features and improves the robustness of the network without requiring integration with the pre-existing network infrastructure. By integrating a preprocessing block that extracts PSS correlation and energy per null resource elements (EPNRE) characteristics, our method distinguishes between normal and jammed received signals with high precision. Additionally, by incorporating of Discrete Wavelet Transform (DWT), the efficacy of training and detection are optimized. A double-threshold double Deep Neural Network (DT-DDNN) is also introduced to the architecture complemented by a deep cascade learning model to increase the sensitivity of the model to variations of signal-to-jamming noise ratio (SJNR). Results show that the proposed method achieves 96.4% detection rate in extra low jamming power, i.e., SJNR between 15 to 30 dB which outperforms the single threshold DNN design with 86.0% detection rate and unprocessed IQ sample DNN design with 83.2% detection rate. Ultimately, the performance of DT-DDNN is validated through the analysis of real 5G signals obtained from a practical testbed, demonstrating a strong alignment with the simulation results.
Index Terms:
RF domain jamming detection, 5G security, SSB jamming, synchronization signals, deep learningI Introduction
The evolution in transformative technologies such as Connected and Automated Vehicles (CAVs), the Internet of Things (IoT), and Edge Computing, necessitates the development of next-generation wireless networks to guarantee the Quality of Service (QoS) for communication processes [1]. Given the impact of security attacks on QoS, various defense strategies are proposed to provide detection mechanisms and countermeasures to reduce the impact of these attacks [2][3][4][5]. Among these, machine learning-based defense strategies including decentralized and centralized are rising due to their performance in increasing the robustness of the wireless networks [6]. Moreover, proper operation of critical elements of the network, such as synchronization signal block (SSB), is required to ensure the integrity and security of the communication. SSB is an essential component in 5G wireless communication systems, as it enables device synchronization with the network and access to the services that are available [7]. The SSB functions as a reference signal that provides the establishment and maintenance of connections between mobile devices and the base station (gNB). Assisting user equipment (UE), including smartphones and other devices, in synchronizing with the 5G network is the main function of the SSB. Effective communication requires synchronization, which guarantees that the UE and the base station operate at the same time and frequency. It is crucial that 5G SSBs are robust and resilient to a variety of channel conditions in order to guarantee synchronization that is reliable despite the complexity of the environment. In addition, 5G enables the configuration of SSBs to be more adaptable to various deployment scenarios and facilitates more effective network management.
SSB is transmitted based on predetermined frequency and timing resources in 5G networks [8]. Due to this predictability, an attacker can target these established locations. By identifying the subcarrier spacing and getting synchronized with the cell in the time domain, an attacker is able to extract the cell identity and as a result, locates and targets PSS or SSS which prevents UE from receiving critical signals required for synchronization [9], [10]. By detecting PSS and SSS, and learning about the PCI, the adversary can execute a jamming attack on PBCH [11], [12], [10]. Jamming attacks targeting PBCH in SSB, unable UEs to access necessary information and new connections to cells. Authors in [13] suggested using localization-based detection techniques as a solution, however, these techniques are not efficient in a mobile jammer scenario. Another reason behind the vulnerability of SSB is the lack of encryption through initial access. Unlike user data which is encrypted to ensure confidentiality in 5G networks, control signals such as PSS and SSS are transmitted without encryption [12]. Thus, SSB can potentially be jammed by anyone without the requirement of deciphering or authentication. Furthermore, an attacker which performs jamming attack on SSB does not require to consume high energy to successfully disrupt the communication [14]. Utilizing less jamming power enables the jammer to minimize its impact on the monitoring and detection systems as most of the detection systems rely on identifying anomalous high-energy patterns. On the other hand, it helps the attacker to perform the attack with simple and inexpensive equipment. Traditional jamming detection methods rely on the received signal intensity, or the performance of the network [15]. The signal level detection methods are incapable of maintaining the detection accuracy in high signal-to-jamming and noise ratio (SJNR) scenarios, and are mostly efficient in constant jamming cases [16], [13]. The detection techniques based on the network metrics such as packet delivery ratio (PDR) or bit error rate (BER) may be unsuccessful when facing advanced jammers utilizing selective or intelligent techniques which may not have a significant impact on the error rate or performance metrics.
This research presents a jamming detection technique for 5G networks based on a deep learning approach operating solely in the RF domain which eliminates the need for the jamming detector to be an entity of the network. A key discriminator that sets our work apart from existing jamming detection algorithms is its focus on the analysis of 5G SSB using the design of a double threshold double DNN model (DT-DDNN) to enable the system to detect both smart and barrage jammers effectively. This expands the algorithm’s applicability and impact by covering a wider range of jamming scenarios. To enhance the precision of the detection algorithm and reduce its time and energy consumption, a preprocessing block is integrated into the design in which correlation and EPNRE characteristics of the PSS are extracted. This step provides a more precise discrimination between normal and jammed receive signals. As the deep learning algorithms require advanced computational resources, we incorporate the Discrete Wavelet Transform (DWT) into our design. The DWT magnifies the features that were extracted during the preprocessing phase, and provides a more detailed representation of the signal attributes. This not only improves the performance of the detection model but also optimizes the training procedure. A significant enhancement to our architecture is the integration of double threshold DNN which has been used to improve precision in the scenarios indicated by higher SJNR values in which the detector faces challenges to make a final decision. The additional DNN is supported by a deep cascade learning model to increase the sensitivity of the design in a high SJNR regime. Therefore, the main contributions of this study are summarized as follows.
-
•
Utilize over-the-air 5G signal features without the need for higher layer KPIs such as Block Error Rate (BLER), Bad Packet Ratio (BPR), throughput, and other metrics in higher layers of 5G protocol stack. This enables the jamming detection module to be implemented independently in 5G networks,.i.e., the proposed method does not need to be implemented on 5G network entities such as gNB, UE, or 5GC.
-
•
Exploit salient features in the SSB that are relevant to jamming signal through preprocessing of the received 5G waveform. Particularly, PSS correlation, DWT, and energy per null subcarriers in SSB are employed. Furthermore, Log transformation is applied to adjust the dynamic range of the extracted energy so that the jamming signal can be better distinguished from environmental noise.
-
•
Implement a double-threshold deep learning structure to improve the detection performance in a high SJNR regime and optimize their thresholds. In particular, a double deep learning structure is proposed in which the first DNN uses two thresholds at its output to best determine any uncertainties in the detection process. Exploiting deep cascaded structure, the second DNN decides on the observations with high uncertainty in which the UE experiences very low jamming power.
The two thresholds at the output of the first DNN are optimized in a way that 100% empirical detection rate for the two classes is achieved, and the threshold for the second DNN is chosen empirically based on the target false alarm probability. Using the proposed techniques enables DT-DDNN to attain a 96.4% detection rate in low jamming power conditions when SJNR is between 15 dB to 30 dB. The performance improvement is significant when compared to 86.0% detection rate of the single threshold DNN approach and 83.2% detection rate of the unprocessed IQ sample DNN method. Furthermore, a testbed is developed for experimental evaluation of the proposed approach which validates the performance of the system in real-world applications.
The rest of this work is organized as follows: Section II discusses the existing works in jamming detection in 5G. Section III provides a brief introduction to the 5G SSB and formulates the problem. Section IV includes detailed information on the jamming detector design and each component of the architecture. Section V presents the results of the detection technique. Finally, conclusions are provided in section VI.
II Related Work
The primary aim of physical layer security (PLS) is to fulfill the security demands of wireless networks by leveraging the unique characteristics of the physical layer [17]. There has been significant research dedicated to developing techniques for detecting attacks that specifically target the physical layer of wireless communication systems. In the context of the vulnerabilities associated with 5G Non-Orthogonal Multiple Access (NOMA), [18] discusses challenges that arise when a near-end user (NU) engages in eavesdropping activities. To address this, modifications to the serial interference cancellation (SIC) process through cooperative jamming have been suggested. These modifications aim to devise optimal power allocation strategies tailored to various situations, enhancing the secrecy rates without compromising the data throughput of legitimate users, ensuring it remains within acceptable limits.
[18] discusses the challenges of 5G Non-Orthogonal Multiple Access (NOMA) while a near-end user (NU) performs an eavesdropping attack. The authors proposed modifying the order of serial interference cancellation (SIC) using cooperative jamming. Optimal power allocation strategies are designed for different scenarios to improve secrecy rates while maintaining the data rate of authorized users within the specific threshold. Authors in [19] analyze how the reusability of resources compromises the physical layer security in multiple-input multiple-output NOMA (MIMO-NOMA) scenario in cognitive radio network (CRN). Thus, a transmit-zero-forcing beamforming (ZFBF) method is proposed alongside signal alignment in an environment while primary and secondary users share cells. Furthermore, the eigen beamforming method is used to maximize the signal-to-information-leakage-plus-noise ratio (SLNR) and therefore improve the physical layer security. AN innovative minimal angle-difference user pairing scheme is provided in [20] to mitigate the impact of eavesdroppers in the millimeter wave (mmWave) NOMA network. This work also presents and assesses two secrecy beamforming models, NMRT and CMRT, which increase the secrecy performance by taking advantage of the spatial correlation between the user and eavesdropper. The efficacy of physical layer security of the integration of reconfigurable intelligent surface (RIS) and Radio Frequency-Underwater Optical Wireless Communication (UOWC) in a scenario including an eavesdropper is investigated in [21]. [22] increases the secrecy rate of mmWave vehicular communication in response to eavesdropping attacks by using a multiantenna transmission technique and a robust beamforming model. The beamforming vectors are optimized to guarantee the QoS for authorized users and maximize the secrecy rate at the same time. Authors in [23] present a novel anti-jamming technique based on federated deep reinforcement learning (DRL) which is based on a joint beamforming and power allocation optimization problem. By using the Markov decision process (MDP), the optimization problem is transformed into a multi-agent reinforcement learning (MARL) problem. The main purpose of the anti-jamming method is to improve the achievable rate of femtocell users (FUs) during a jamming attack targeting 5G Heterogeneous Networks (Het-Nets). [24] focuses on attack identification in air-to-ground communication links using deep attention recognition (DAtR) which detects security attacks using a small deep network embedded in legitimate unmanned aerial vehicles (UAVs). The system employs two metrics of received signal strength indicator (RSSI) and signal to interference plus noise ratio (SINR) to identify attacks in different scenarios such as non-line-of-sight (NLoS), line-of-sight (LoS), or a combination of both. In [25] a jamming detection and defense strategy is proposed by implementing pseudo-random blanking of resource elements within OFDM symbols based on statistical hypothesis testing. The work is focused on smart jammers which maximize their impacts by reducing spectral efficiency and BLER values, and minimize their detection probability. Through the detection algorithm, certain subcarriers are left blank across OFDM symbols in a pseudo-random fashion. Adopting a pseudo-random algorithm that determines the blanking pattern makes the system unpredictable and increases its robustness to jamming. The suggested approach incorporates the downlink data transmission system of 5G without necessitating adjustments to the current infrastructure. [16] and [26] present a novel approach that employs the sensitivity of Error Vector Magnitude (EVM) to detect the presence of tone and chirp jammers when the EVM value reaches a predetermined threshold. Besides the high sensitivity and minimal complexity, this approach offers spectral information about the jammer and affected frequency bands. [27] describes an adaptable, multidimensional strategy for detecting and classifying jamming attacks, considering power levels and frequency band variations. The detection technique is based on supervised learning and receives metrics such as channel quality indicator (CQI), bit rates, packet rates, power headroom, and power headroom. The dataset is generated using a 5G NR non-standalone (NSA) testbed from cross-layer key performance indicator (KPI) data. By combining instantaneous discriminative models along with sequential time series-based models, adaptability is obtained. The use of Reservoir Computing (RC) helps to achieve high accuracy and low false alarm rates while following the latency limits of real-time scenarios and requiring minimal computational and memory resources. The primary focus of [28] is the utilization of ensemble learning and the XGBOOST-ensemble learning combination as a machine learning-based jamming detection in C-RAN. Authors use the WSN-DS database to assess the performance of various machine learning algorithms. The WSN-DS database includes 374,661 samples as chosen features that encapsulate the behavioral patterns of network traffic under normal and jammed conditions. Data preprocessing is performed to set up the dataset for analysis by separating the independent and dependent variables. The feature extraction process is carried out using the XGBOOST algorithm which emphasizes important patterns within the data. Model training is then developed based on cross-validation with various algorithms to identify the most effective model for detection. The model is finally tested and validated using an independent dataset. [15] emphasizes the need for real-time detection and mitigation techniques. Hence, the authors make a contribution by introducing a technique for real-time detection of jamming attacks, utilizing the Hoeffding decision tree. This machine learning methodology facilitates real-time processing and addresses limitations encountered in conventional decision tree models. The jamming node in the simulation uses numerous antennas to simulate a smart jammer and a comprehensive dataset under congestion and normal conditions is created to feed to the Hoeffding algorithm. [29] presents a multi-stage machine learning-based intrusion detection system (ML-IDS) specifically designed for 5G Cloud Radio Access Network (C-RAN) which is designed to detect constant, random, deceptive, and reactive jammers. A Multilayer Perceptron (MLP), a deep learning algorithm, and a Kernelized Support Vector Machine (KSCM) compose the proposed ML-IDS. The MLP is implemented as the main classifier, and in situations where it produces a false negative, the KSVM functions as a supplementary verification mechanism to enhance the precision of jamming attack detection. The ML-IDS is incorporated into the Base-Band Unit (BBU) pool, an essential element of the C-RAN responsible for monitoring spectrum distribution and user information. This enables the ML-IDS to efficiently manage traffic between base stations. The integration of supervised and unsupervised learning methods for jamming detection is introduced in [30]. Known jamming attacks are detected using a supervised learning model while an unsupervised anomaly detection method using auto-encoders is applied for unknown jamming types. To enhance the accuracy of the detection algorithm, address the computational complexity, and causality analysis of KPI degradation, the Bayesian Network Model (BNM) is integrated into the design. The learning-based model is executed based on network parameters such as bitrate, packet rate, retransmission rate, and CQI. [12] concentrates on intelligent PBCH jamming (PBCH-IJ) attack in 5G NR which disrupts the MIB decoding by applying a sniffing attack to extract PCI information. Based on the observations, authors concluded that the PBCH-IJ has a substantial effect on the principal direction in low mobility scenarios. Thus, the introduced counteract is based on the Principal Direction of PBCH Dominant Space (PDPDS) and is executed at user side. To identify anomalies that can detect the jamming attack, sparse principal component analysis (SPCA) is used in the design along with an adaptive detection threshold. The study in [31] implements a machine learning-based detection technique using NS-3 simulator for constant, random, and reactive jammers. Received signal strength, carrier sense time, noise, and PDR are used as jamming detection metrics. The detection method is tested based on three different learning algorithms K nearest neighbor (KNN), decision tree, and random forest with the highest accuracy of 81%. This work distinguishes itself from the aforementioned research by focusing on smart SSB jamming detection in the RF domain using signal features of 5G network. The detection technique is a machine learning-based model using two DNN blocks one with a single threshold and the second one with double threshold characteristics to be able to detect the existence of the jammer in high SJNR conditions. To further enhance the performance of the DNN model deep cascade learning approach is adapted by the second DNN block. A summary of the current literature is provided in Table I.
| Ref. | Technical Approach / Network Model | Feature or Parameter | Attack Type | Real data test |
|---|---|---|---|---|
| [18] | Analytical (optimal power allocation)/NOMA | Transmit Power | NU Eavesdropper | ✗ |
| [19] | Analytical(ZFBF)/CRN | Beamforming Vectors | Eavesdropper | ✗ |
| [20] | Analytical (SOP111secrecy outage probability)/mmWave NOMA | Transmit Power | Eavesdropper | ✗ |
| [21] | Analytical (average secrecy capacity, SOP) | RIS element phases | Eavesdropper | ✗ |
| [22] | Analytical (optimal beamforming vector)/ mmWave V2V | CSI222channel state information, Transmit Power | Eavesdropper | ✗ |
| [23] | ML(DRL)/5G Het-Nets | channel, beamforming vectors | intermittent, constant, adaptive, reactive | ✗ |
| [24] | ML(CNN, LSTM)/5G UAV | SINR, RSSI | jamming | ✗ |
| [12] | statistical(SPCA) /5G | PBCH data | PBCH Jamming | ✗ |
| [15] | ML(Hoeffding Decision Tree)/5G | Received Signal | Barrage Jammer | ✗ |
| [16][26] | Statistical (EVM)/5G | EVM | Tone, Chirp Jammer | ✗ |
| [25] | Statistical (GLRT)/5G | NA | Smart Jammer | ✗ |
| [27] | ML(Supervised Learning)/5G | Cross-layer KPI | Various Jammer Types | ✓ |
| [28] | ML(Ensemble Learning)/5G | Network Traffic | Constant,Random,Deceptive,Reactive | ✗ |
| [29] | ML(DL with kernelized SVM)/5G C-RAN | Network Traffic | constant,random,deceptive,reactive | ✗ |
| [30] | ML(Supervised, Unsupervised Learning)/5G | Network Metrics | WiFi Interference, controlled jamming | ✓ |
| [31] | ML(KNN, Decision tree, Random Forest)/WiFi | Packet delivery rate, RSS | Constant, Random, Reactive | ✗ |
| This work | ML(DT-DDNN) / 5G RF-Domain | PSS Corr, EPNRE | Smart SSB & Barrage Jamemr | ✓ |
III System Model and Problem Formulation
III-A Background
The SSB is usually transmitted within the 5G radio frame using 4 OFDM symbols [32] and includes two synchronization signals: the primary synchronization signal (PSS) and secondary synchronization signal (SSS) [33]. The SSB comprises information necessary for the UE to establish synchronization with the cell, such as the physical cell identity (PCI) of the cell, and additional information provided by physical broadcast channel (PBCH) and physical downlink shared channel (PDSCH)[33]. PSS and SSS use the same time slots as the PBCH. PBCH symbols are concentrated in two or four slots, which gives the appearance of a low-duty cycle, particularly at higher subcarrier spacing. The Master Information BLock (MIB), containing critical data transported by the PBCH, comprises parameters that are vital for the UE to establish a connection with a cell. When a UE powers on or enters a new cell’s coverage area, it uses this information to discover the available SSBs. Scanning the predefined SSB locations within the radio frame, the UE executes an SSB discovery procedure to accomplish this. The UE is capable of decoding the information carried by an SSB, including the PCI, once it has been detected.
III-B Problem formulation
This section provides an introduction to SSB, as the focus of our detection algorithm is on analyzing information derived from this block. The rest of this section presents a detailed explanation of the 5G system model, along with the formulation of the jamming detection problem. The notations used in this paper are defined in Table II.
| Symbol | Description | Equation |
| PSS base sequences | 1, 3 | |
| Transmitted SSB in frequency domain | 3, 4 | |
| Transmitted SSB in time domain | 4, 5, 9, 7, 8 | |
| Received SSB in time domain | 5, 6, 7, 8, 13 | |
| Extracted PSS sequence from the received | 6, 9 | |
| signal in time domain | ||
| Received SSB in frequency domain | 13, 14 | |
| Correlation of extracted PSS sequence | 9, 11 | |
| from the received signal | ||
| and three m-sequences | ||
| Output of DWT stage | 11, 10, 17 | |
| Energy per null resource elements, | 14, 15, 16, 17 | |
| log transform of energy, vectorization | ||
| of log transform of energy, respectively | ||
| 3-D tensor of observation | 17, 19, 20, | |
| 21, 22 | ||
| Corresponding label for observation | 18, 21, 22 | |
| Score of the jamming detection algorithm | 19, 20, 21, | |
| for class | 22, 24, 25 | |
| DNN model threshold | 26, 27 |
In the first step of gaining access to a gNB, UE requires information called System Information Block 1 (SIB1) which depends on the decoding of Master Information Block (MIB) [34]. This procedure is achievable only through the detection of SSB. One or more SSBs are transmitted through an SS burst periodically based on a pre-determined periodicity at a five-millisecond window [35]. Each SSB contains cell ID information which is calculated by . Where represents group ID and is related to sector ID [8]. Sector ID is provided by PSS to help reach a coarse time and frequency synchronization. A 5G frame includes numerous slots, each being divided into a specific number of symbols which depends on the subcarrier spacing and numerology. SSB is transmitted through four OFDM symbols in the time domain and spans over subcarriers in the frequency domain (Fig. 1). 127 subcarriers in the first symbol are dedicated to PSS, and there are 113 unused subcarriers below and above PSS which are set to ’’. PSS follows on of the three base -symbols m-sequences in frequency domain. Each m-sequence is a circular shift version of the other two and their cross-correlation value is equal to zero [36]. The three base m-sequences are demonstrated in (1).
| (1) |
where demonstrates the PSS symbol at subcarrier , and is the length of the PSS sequence in the frequency domain. Furthermore, represents the m-sequences which are given as,
| (2) |
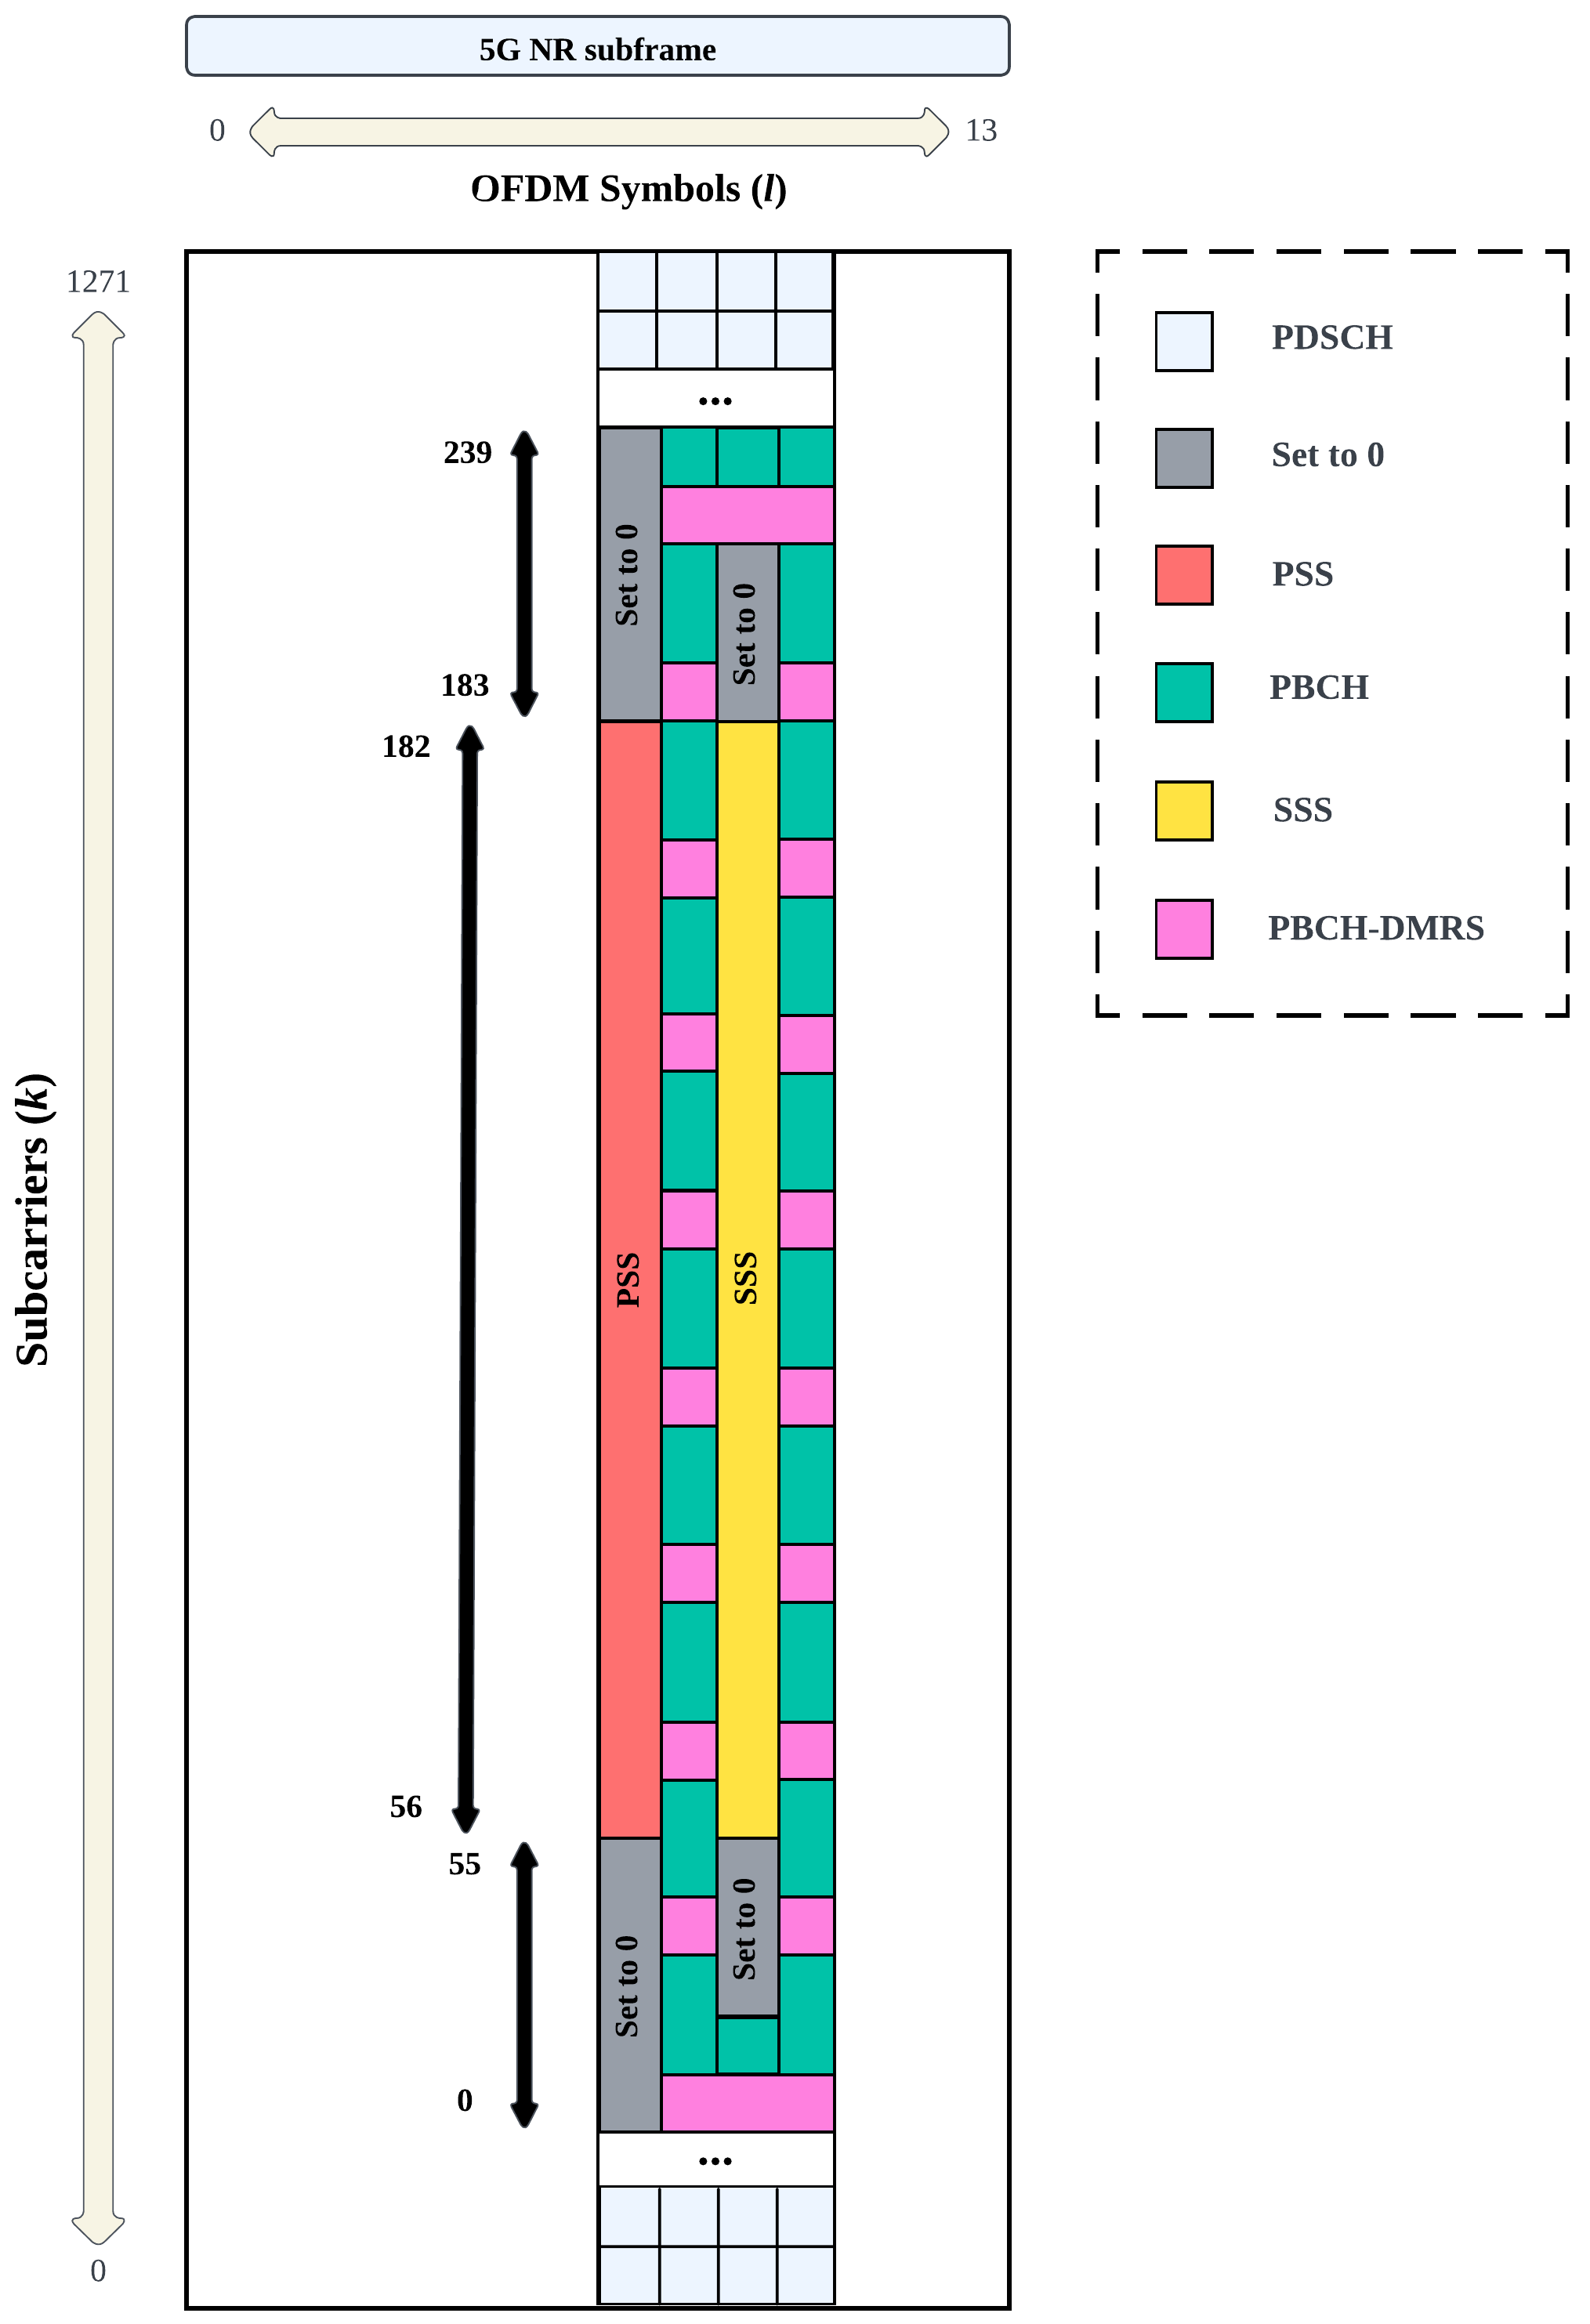
Consider a gNB generating a waveform in frequency domain containing the SSB, where denotes the OFDM symbol in 5G resource grid and represents the subcarrier data point. The transmitted SSB includes the PSS sequence in the first OFDM symbol as defined in (3).
| (3) |
The signal is subjected to modulation and after applying IFFT, the time domain signal (333t here indicates the time index for a discrete-time signal.) is formed as,
| (4) |
During the transmission, the transmitted signal experiences the impact of channel model and thermal noise, and it is degraded by the path loss attenuation. Therefore, the received SSB () having been subjected to the impact of thermal noise () and channel model () is represented in (5) where represents the number of FFT points.
| (5) |
As the received PSS sequence is transmitted through the first OFDM symbol (), it can be extracted by taking the first samples of the time domain signal as,
| (6) |
In the scenario where a jamming signal () is introduced, the received signal becomes susceptible to the impact of the jammer. Detection of the jamming signal can be represented as a binary hypothesis framework (7),(8), where we have a null hypothesis denoted as and an alternative hypothesis, , corresponding to the presence of the jamming signal.
| (7) | |||||
| (8) |
Let be the output of the test based on the observations. Two main performance metrics used in this work are the probability of jamming detection (), and the probability of false alarm ()
IV Proposed DNN-based jammer detection
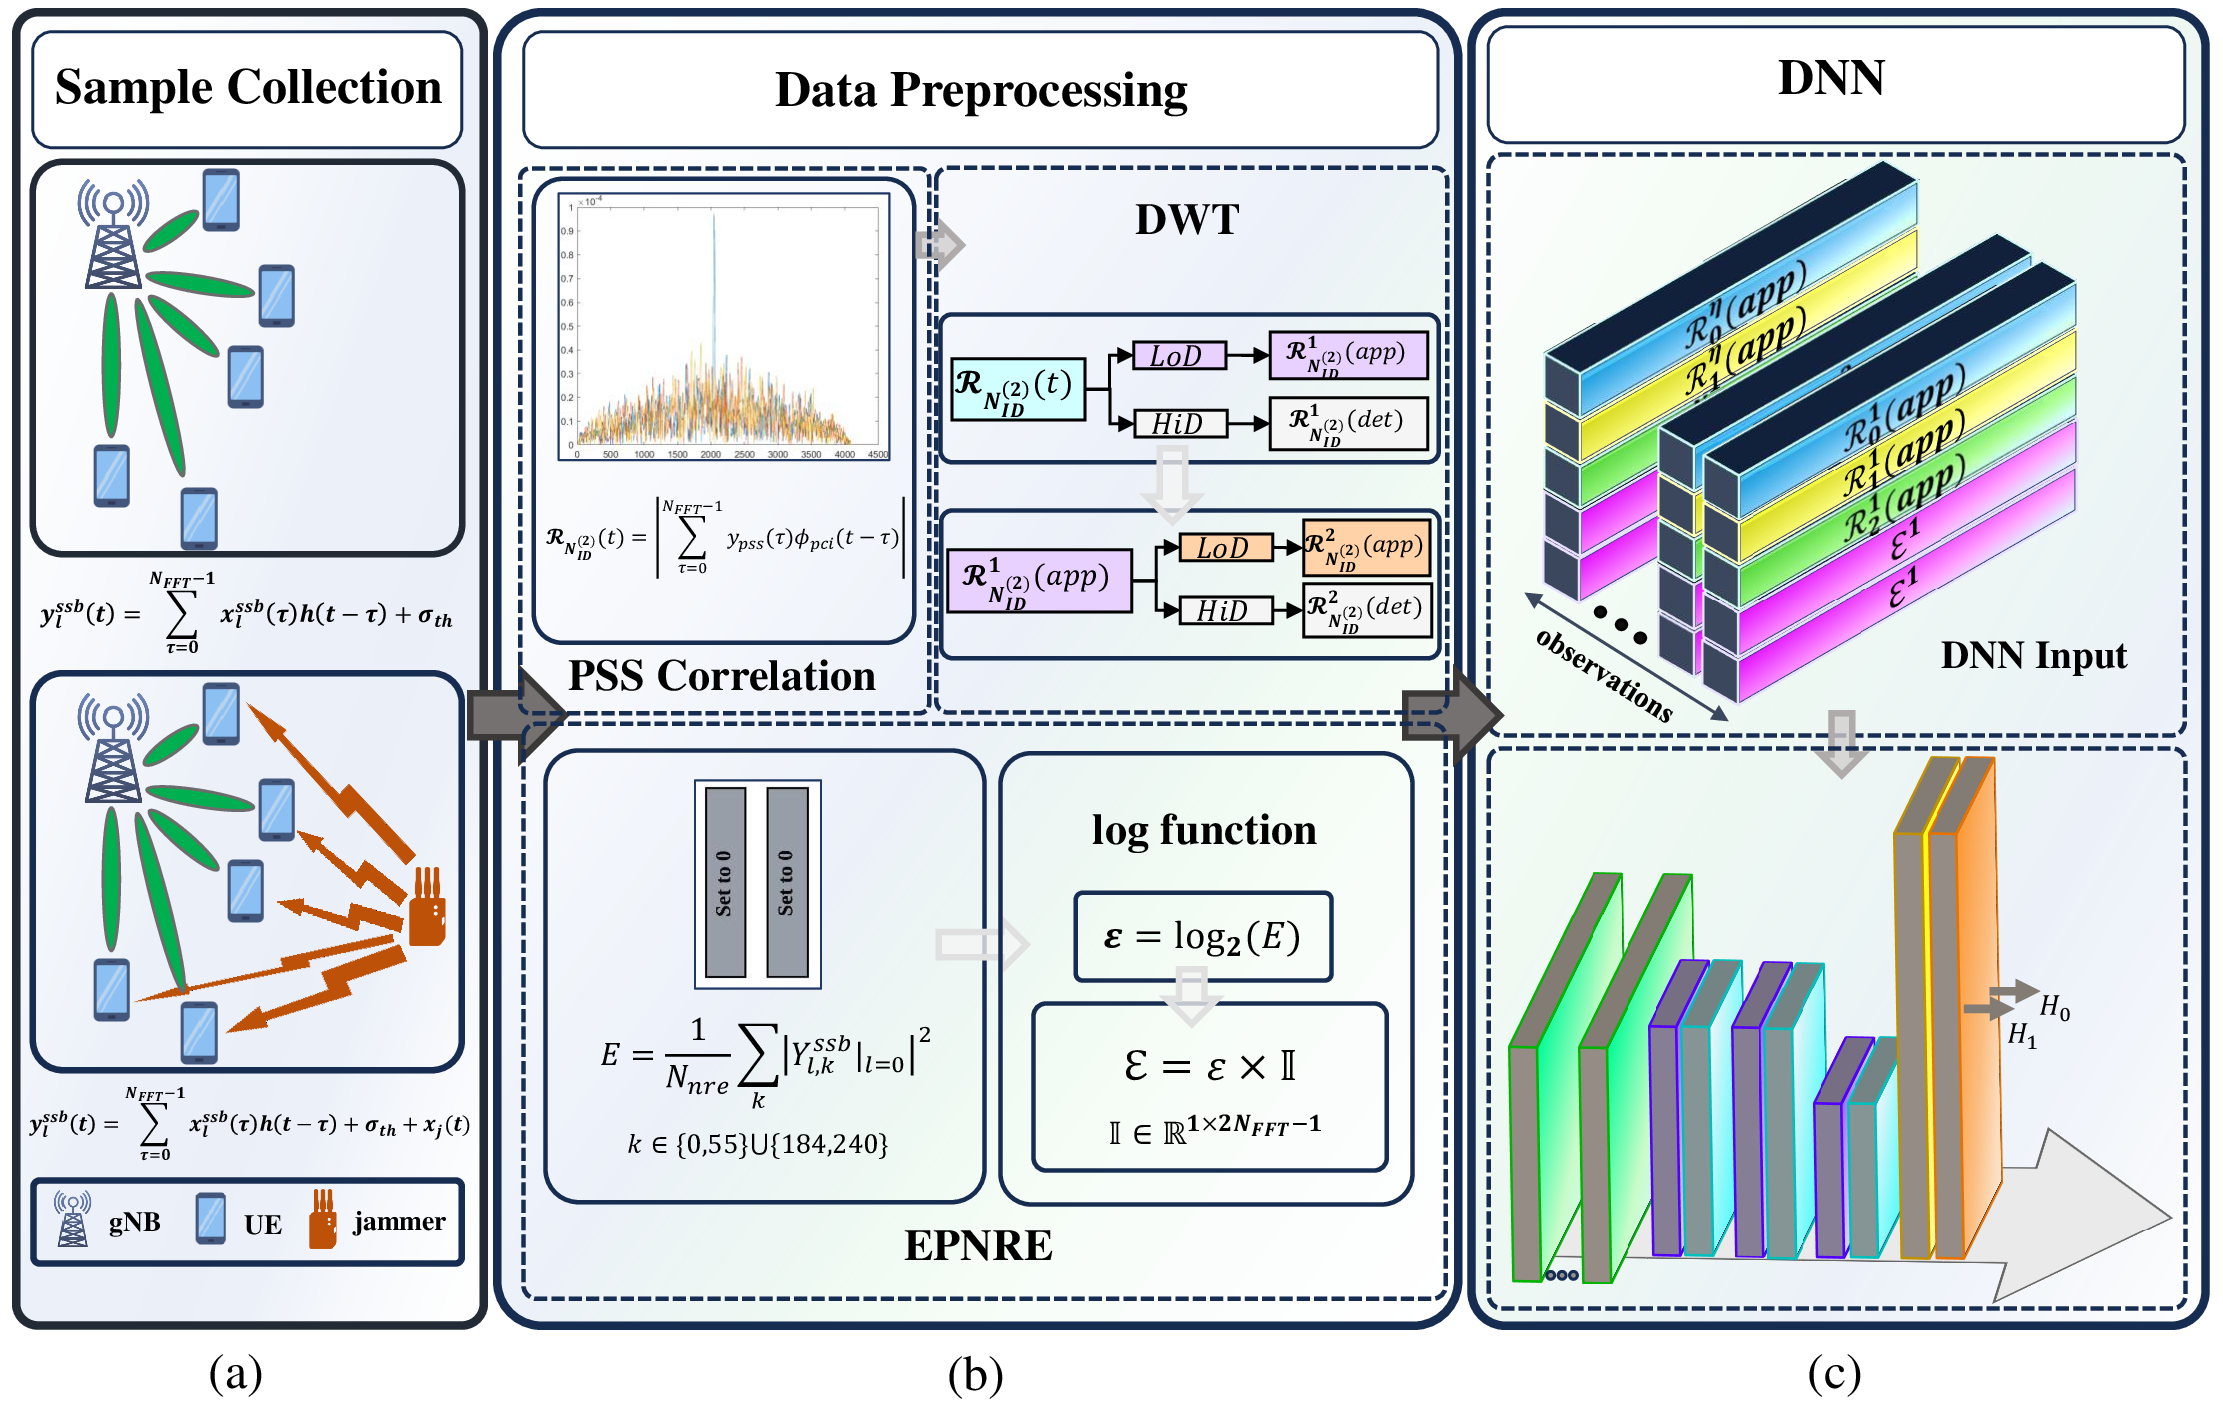
This section focuses on the proposed jamming detection scheme. The overall block diagram of our detection model is demonstrated in Fig. 2. Received signal observations are processed through a data preprocessing module, following which the modified dataset is input into a Deep Learning block for training and jamming detection. The details of each block are provided in the rest of this section.
IV-A Data Preprocessing
IV-A1 PSS correlation
Each transmitted SSB includes a PSS sequence which is a version of one of the three base PSS sequences formulated in (1). Thus, within the correlation signal of the received PSS sequence with one of the m-sequences, we expect to observe a visible peak value. The correlation of with each m-sequences results in a 1 by 2 signal demonstrated as444Since there is a specific signal for each , the output of the correlator in (9) is sub-scripted with . ,
| (9) |
where denotes the absolute value. By analyzing the correlation sequences, the cell ID parameter of the correspondent gNB can be specified. The jammer can distort this cell ID extraction process through jamming signals.
IV-A2 DWT
To remove the redundant information from the correlator output and to magnify the jammer-related features, DWT is employed. This also reduces the dimension of the data set and hence, significantly decreases the training time as described in V-A2. As illustrated in Fig. 2, two-stage DWT is applied to the output of the correlator, . The approximate output of the first DWT module, , is fed to the second DWT module, generating the final outputs . This process can be mathematically explained as follows:
| (10) |
in which is obtained as,
| (11) |
where is derived as per (9). Furthermore, is the mother wavelet function chosen as Haar wavelet 555Haar wavelet is a set of rescaled square-shaped functions that collectively form the simplest wavelet family or basis [37]. to maintain and magnify the important information from PSS correlation. Haar wavelet is a straightforward choice as it is very effective at identifying abrupt changes in the signal amplitude including PSS peaks [38][39]. Thus, it can successfully reduce signal size while maintaining crucial information and keeping the computational load at a desired stage. Fig. 3 demonstrates the effect of adding two layers of DWT to the PSS correlation dataset. As can be seen in the figure, the length of the correlated signal is decreased by almost 25%, and the correspondent peak is magnified significantly by 2 times.
| (12) |

IV-A3 Energy per Null RE (EPNRE)
After receiving the transmitted signal, the signal is converted into the frequency domain using Fourier transform as in (13).
| (13) |
in which represents the Fourier transform of the received signal in -th OFDM symbol and -th subcarrier data point. In the next step, the SS block is extracted from the frequency domain signal. There are numbers of resource elements in the SS block which are intentionally set to zero by gNB as shown in Fig. 1. These resource elements help us collect information about the noise and jamming signal. The energy of these resource elements is calculated as expressed in (14).
| (14) |
Depending on the jammer transmit power and its distance to the UE, the received energy of the jamming signal might be small in some observations. Thus, to adjust the dynamic range of the calculated received energy to be more distinguishable, a log function is applied to the final energy value as,
| (15) |
In the absence of a jammer, the UE is only affected by environmental noise. The energy of this type of interference is significantly small compared to the energy from a jammer. Thus, when the reaches a specific threshold, it can be concluded that a jammer is present in the scenario.
IV-B DL Block
IV-B1 DNN Input
Observations are designed as a 2-D image including the PSS correlation signals at the output of the second DWT module (), and energy per null resource elements (). In each observation (), the first three rows in the 2-D image include correlated signal, and the last two rows are dedicated to the energy parameter (Fig. 2). The calculated EPNRE is a scalar value while the size of is equal to . Thus, to maintain the impact of the energy feature and to make it visible to the classifier, the energy is repeated in the last two rows as,
| (16) |
where denotes a vector of ones. After creating a 2-D image of features, each observation is positioned behind the previous observation thus creating a 3-D tensor (Fig. 2) as the final dataset ().
| (17) |
IV-B2 Data Augmentation and Class Balancing
The dissimilarity in sample sizes between the two classes, although frequently seen in the process of data collection, causes the class imbalance that must be resolved to maintain the reliability and validity of the produced data. These imbalanced classes can result in biased models and fail to generalize to minority class [40][41]. This situation causes the CNN model to demonstrate less efficiency and accuracy in classifying the minority observations and decreases the performance of the model in detecting underrepresented received signals. Various techniques, including oversampling the training samples to produce a comparatively balanced dataset [42], have been suggested as solutions to this problem. Additionally, research has demonstrated that CNN decisions are more difficult to generalize to minority classes when the data is unbalanced [43]. However, methods including data augmentation have demonstrated efficacy in enhancing the precision of classification tasks involving unbalanced datasets [44], [45], [46], [47], [48]. while adversarial machine learning approaches have shown promising solutions in securing wireless systems through augmentation of real data samples [49], qualitative and quantitative analyses of various data augmentation techniques are provided in several works, notably in [50], [51], [52], [53]. To overcome the effect of the imbalance classes and use a more robust dataset, circular shift is applied to the minor dataset [54]. Through the circular shift augmentation method, each observation in the minority class is divided into sub-sequences with similar lengths, and each sub-sequence is independently shuffled to create a new sequence which introduces new variations of the collected observations. Traditional techniques (such as rotation, cropping, and flipping) may affect data integrity or eliminate vital information. Circular shift enhances the generalization capabilities of the DNN model by introducing diverse patterns while maintaining most of the original information without significant information loss [54], [55],.
IV-B3 DNN Structure
The deep learning model used for training is a supervised model, and dataset is paired with the correspondent labels as , where is the total number of observations. In this algorithm two classes are represented for the dataset, therefore, represents a binary digit set and can be written using one-hot encoding (18).
| (18) |
After normalizing using the softmax layer, the output score of the model for -th observation is expressed as follows:
| (19) |
where represents the parameter of the deep learning model, and denotes the jamming scores of the jamming detection problem which satisfies . Based on the decision rule, two scores are compared and the hypothesis with the higher score becomes the output (20).
| (20) |
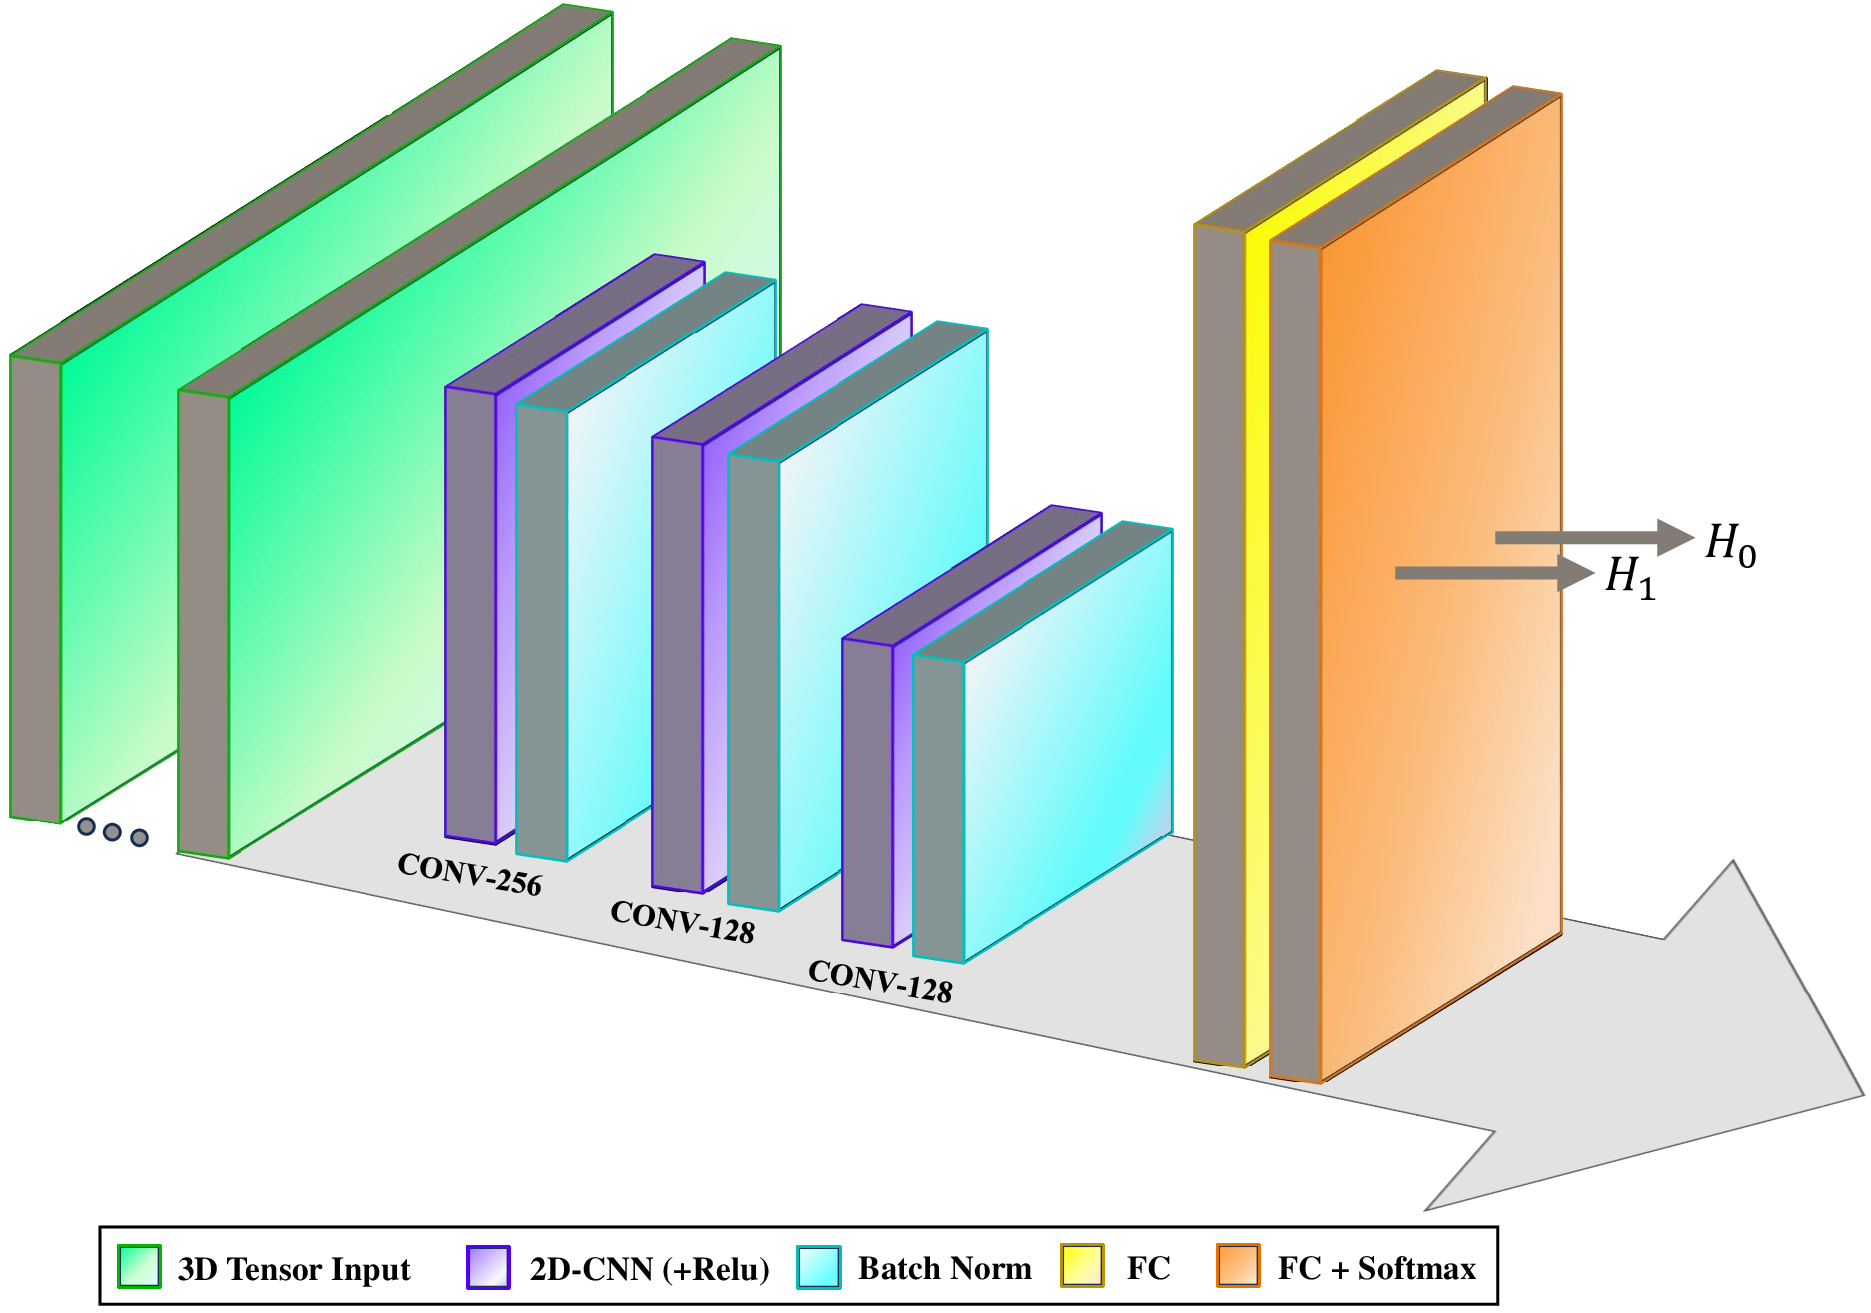
As the features are organized in 2-D images, the deep learning model is designed using 2-D CNN layers. After exploring various architectures and experimenting under different model parameters, the optimal design for the DNN is finalized as demonstrated in Fig. 4. The 3-D tensors including the features of each observation are used as an input to three layers of 2-D CNN with ReLu activation. After each layer of CNN, a batch normalization layer is added to provide faster and more stable training. Two fully connected layers and a softmax layer are used as the last layers of the design. The softmax layer enables the normalization of the output scores. A detailed list of parameters for the DNN model is provided in Table III.
| Parameter | Value |
|---|---|
| Mini-Batch Size | 25 |
| Initial Learning Rate | 0.001 |
| MaxEpoch | 20 |
| Validation frequency | 80 |
| CNN-1 | |
| CNN-2 | |
| CNN-3 | |
| FC-1 Output Layer | 128 |
| FC-2 Output Layer | 2 |
| Training Optimization Method | SGDM |
| Validation Training Rate | 30% |
IV-B4 Offline Training
In the classification layer, the main goal is to maximize the probability of detection. Thus, maximizing in the absent of the jammer and in the presence of the jammer. To optimize the solution, an objective function can be defined as the Maximum Likelihood (ML) function represented in (21).
| (21) |
To minimize the loss between the actual and predicted value, a negative log-likelihood function is minimized to adjust the weights during the training as shown below:
| (22) |
Therefore, the optimization problem can be expressed as (23).
| (23) |
Through stochastic gradient descent (SGD) optimization, the model is trained to provide higher values for when or when . The training is formed through iterative back-propagating processes.
IV-C Accuracy Enhancement
IV-C1 Double Threshold DNN
The ratio between the two output scores of the detection model can be defined as . This value is compared with a threshold to enable the algorithm to make a detection decision. However, for the scenarios where SJNR value is high, meaning that the jamming signal is weaker compared to the transmitted signal from gNB, the uncertainty at the output of the classifier is high. Thus, the output scores are too close to each other, making it challenging for the classifier to make a decision. In other words, defining one hard decision at the output layer of the classifier reduces the accuracy of the jamming detector in the uncertainty area. To optimize the performance of the detection algorithm, this trade-off between the and should be considered. Therefore, an ambiguity area is defined to reach a better and more accurate decision. Based on this, while the decision is being made out of the ambiguity area, the detector detects the absence or the presence of the jammer with 100% empirical accuracy, balancing between the requirement for high detection rates against the risk of false alarms. To design such structure, two threshold points () are considered. represents sorted observations in descending order, and are observations that fall in the areas that the classification decides with high certainty. These thresholds are obtained as,
| (24) | |||||
| (25) |
While or , the detector selects or respectively. In the case that , another DNN is trained specifically for higher SJNR values is activated and observations are fed for more accurate analysis to this DNN. This improves the performance of the jamming detection by minimizing the probability of miss-detection (false negatives(FN)) and false-alarms (false positives(FP)), or equivalently, maximizing true positives (TP) and true negatives (TN). The structure of the DT-DDNN model is represented in Algorithm 1. After data is processed in the data preprocessing block, it is fed into the first DNN with a double threshold design. The first DNN calculates and which are the weight scores correspondence to this block. These scores are then used at the input of the first threshold and decision block (i.e., Threshold and Decision I). If the scores represent values outside of the uncertainty area, the final decision is provided as an output. In the case that the score values fall into the uncertainty area, data is sent to the second DNN with a single threshold design for final classification. The second DNN is specifically trained in high SJNR regime to extract more fine-grained features and is expected to yield higher accuracy compared to the first DNN. In the second DNN, the threshold is used to detect the jammer in harsher conditions (i.e., higher SJNR values). The ratio between the two output scores of the second DNN, and , is defined as . The comparison between the ratio and detection threshold enables a degree of freedom to have a trade-off between and . After finding the using optimum parameters of and the , empirical can be computed to determine the threshold value. Assume we define the target value for as so that , and we define the total number of observations fallen into hypothesis as . After sorting the observations in descending order (), the threshold can be defined as in (26).
| (26) |
The classification is processed based on comparing the ratio of the scores () and single threshold value () in the second DNN. During the online detection, samples are used as input to the DNN block, and after evaluations and passing through the softmax layer, two output scores are presented. The final decision is made in threshold and decision block using as below:
| (27) |
in which represents the online samples. Fig. 5 provides an overall overview of the structure of the double threshold enabled design explained above.

IV-C2 Deep Cascade Learning
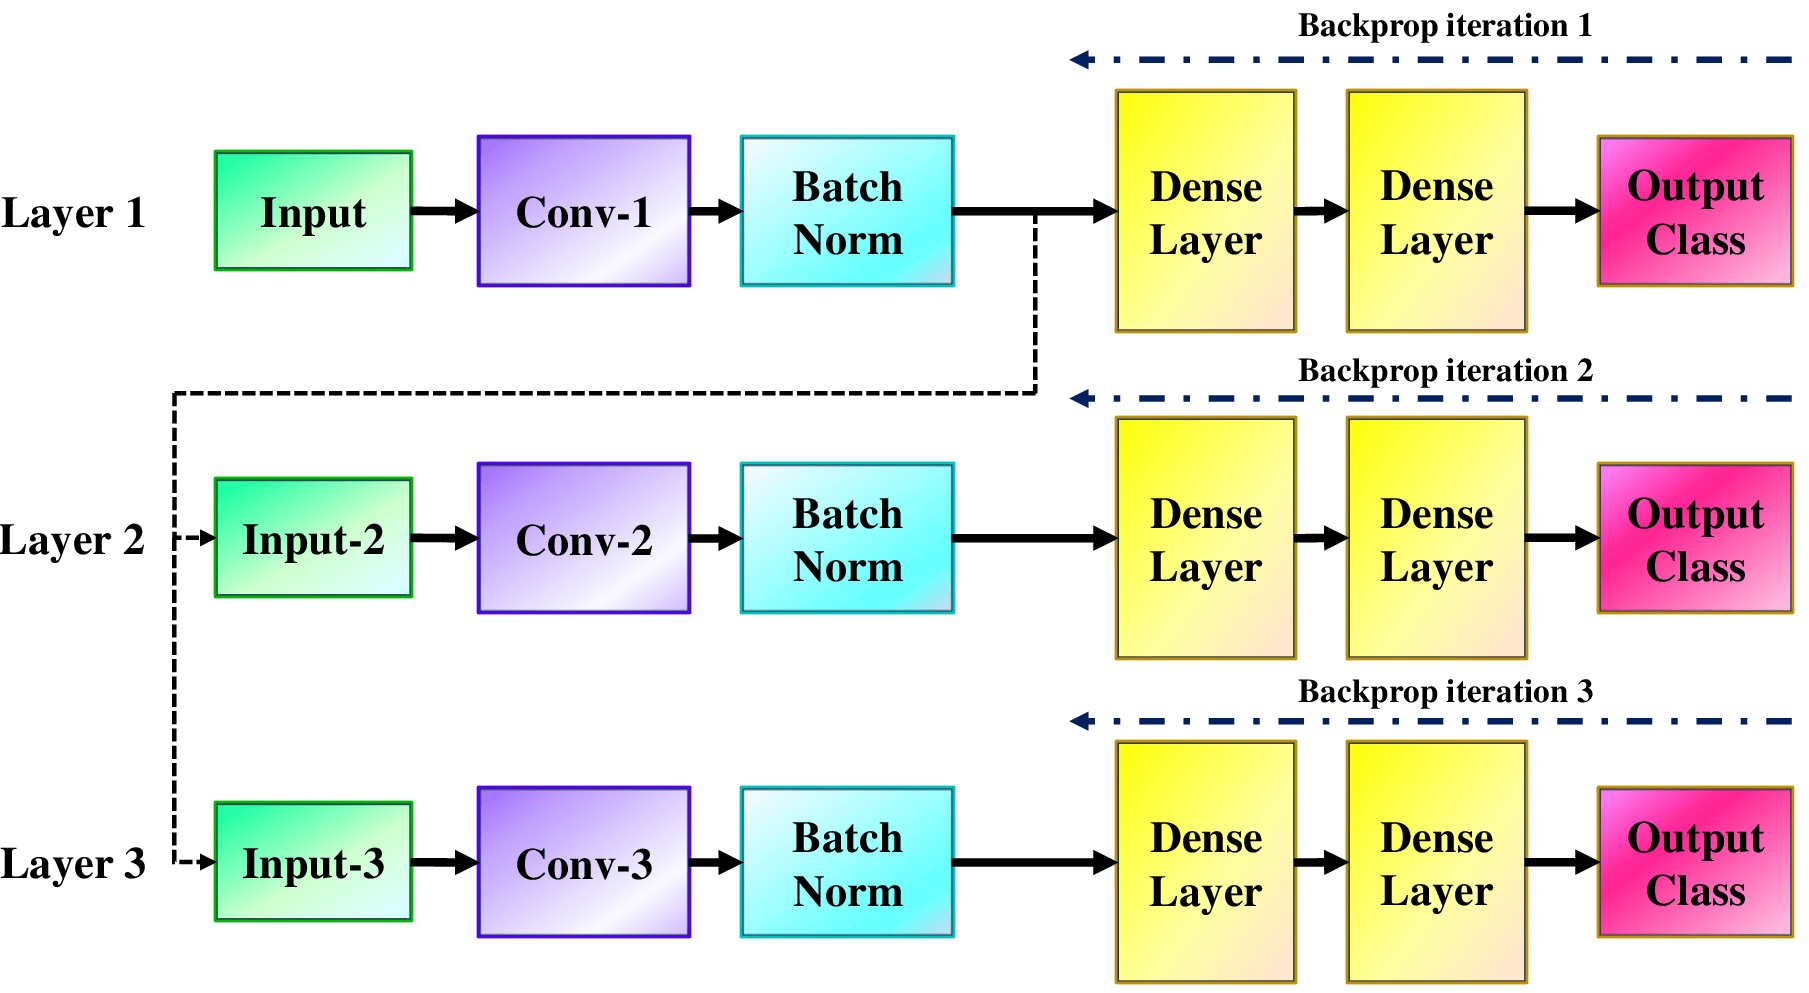
Although the convolution network has demonstrated remarkable performance and results [56] [57][58][59], it experiences the vanishing gradient problem while undergoing training [60]. This occurs because the weight updates during back-propagation are substantially reduced as the depth of the network increases, meaning that layers closer to input experience a slower learning rate [61],[62]. One solution to overcome this situation is the deep cascade learning algorithm proposed in [61]. Deep cascade learning gradually trains the network from the lowest to higher layers. When the jamming signal is weak and therefore SJNR values are close to each other, the classifier faces trouble classifying between two classes. Deep cascade learning fine-tunes the weights by dividing the network into sub-layers and sequentially trains each layer until all the input layers have been trained. Through this technique, the vanishing gradient problem can be eliminated by compelling each layer of the network to acquire features that are correlated with the output. In other words, it maintains the linear correlation between input and output while accommodating the nonlinear relationship [63]. Furthermore, it has shown a significant reduction in training time and memory while adjusting the complexity of the network to the given data [61][64][65]. The structure of the DNN model using deep cascade learning is shown in Fig. 6. The input layer is connected to the output using two dense layers. The weights for the initial model layer and the output are subsequently obtained via a back-propagation algorithm during the training. After reaching a state of stability, the second layer is trained by connecting to an output layer with a similar structure to the first layer using data created by forward propagating the actual inputs through the fixed initial layer. Through several iterations, every layer goes through this process for learning, and the weights remain constant for the subsequent layer. Adapting this approach helps increase the robustness of the second DNN and preserve the back-propagated gradient while having hidden layers.
V Simulation and Experiment Results
In this section, dataset generation and the performance of the proposed deep jamming detection architecture in offline training and online testing are evaluated and discussed thoroughly.
V-A Simulation results
V-A1 Data generation
To collect the received signal recordings, a synthetic 5G dataset is generated from the scenarios with and without jammer under different conditions. The generated dataset is then processed by data preprocessing block and fed into the detection model. A detailed description of the dataset generation environment is provided as follows.
The transmitter produces 5G waveform including four OFDM symbols containing the SS block. It is capable of transmitting the signal using four different types of modulation including QPSK, 16QAM, 64QAM, 256QAM. The signal is then passed through CDL-D channel model and is received by the UE. UE and gNB are positioned in different locations, and the UE is connected to the base stations with different cell IDs. Different locations for the UE results in different path loss experiences. The simulation environment is equipped with free-space path loss model to demonstrate the effect of different UE positions in the scenario as,
| (28) |
where and signify the wavelength and the distance between gNB and UE, respectively. The received signal for each observation is recorded in time domain and the number of observations is . The same process is performed to record the received signal in the presence of the jammer with different SJNR values and jamming powers. The number of observations in this scenario is denoted as . The jammer used for the training is designed using AWGN. Other types of jammers such as the jammer which can transmit modulated BPSK, and 8QAM signals are used for testing. The dataset parameters used for the dataset generation are extracted from [66], [67] and listed in Table IV.
| Parameter | Value |
|---|---|
| SJNR | -10 to 30 dB, step size: 1 dB |
| Distance | 10 to 500 m, step size: 20 dB |
| Input Size | |
| 2048 | |
| Delay Spread | 30 ns |
| Subcarrier Spacing (SCS) | 30 kHz |
| Sample Rate666The sample rate equals to which equals Msps | 61.44 Msps |
| Antenna Noise Temperature | 290 K |
| Cyclic Prefix | Normal |
| Number of Resource Blocks | 106 |
| Channel Model | CDL-D |
| gNB Power | 30 dB |
| Modulation Scheme | QPSK, 16QAM, 64QAM, 256QAM |
V-A2 Performance under the Single Threshold DNN
The training performance of the first single threshold DNN is presented in Fig. 7. In this figure, the upper graph plots the accuracy of the model which stabilizes around 94.93% by jumping quickly into the convergence region in the early stages of the training process. The integration of DWT into the design results in more precision and less training time of 144 minutes, while before adding DWT the training time was around 41 hours. The below graph presents the loss plot which demonstrates a sharp drop during the early stages, eventually reaching a state of stability around 0.01. This signifies a decrease in the prediction error as the training proceeds. It can be concluded that the model is capable of classifying the unobserved data without falling into overfitting.
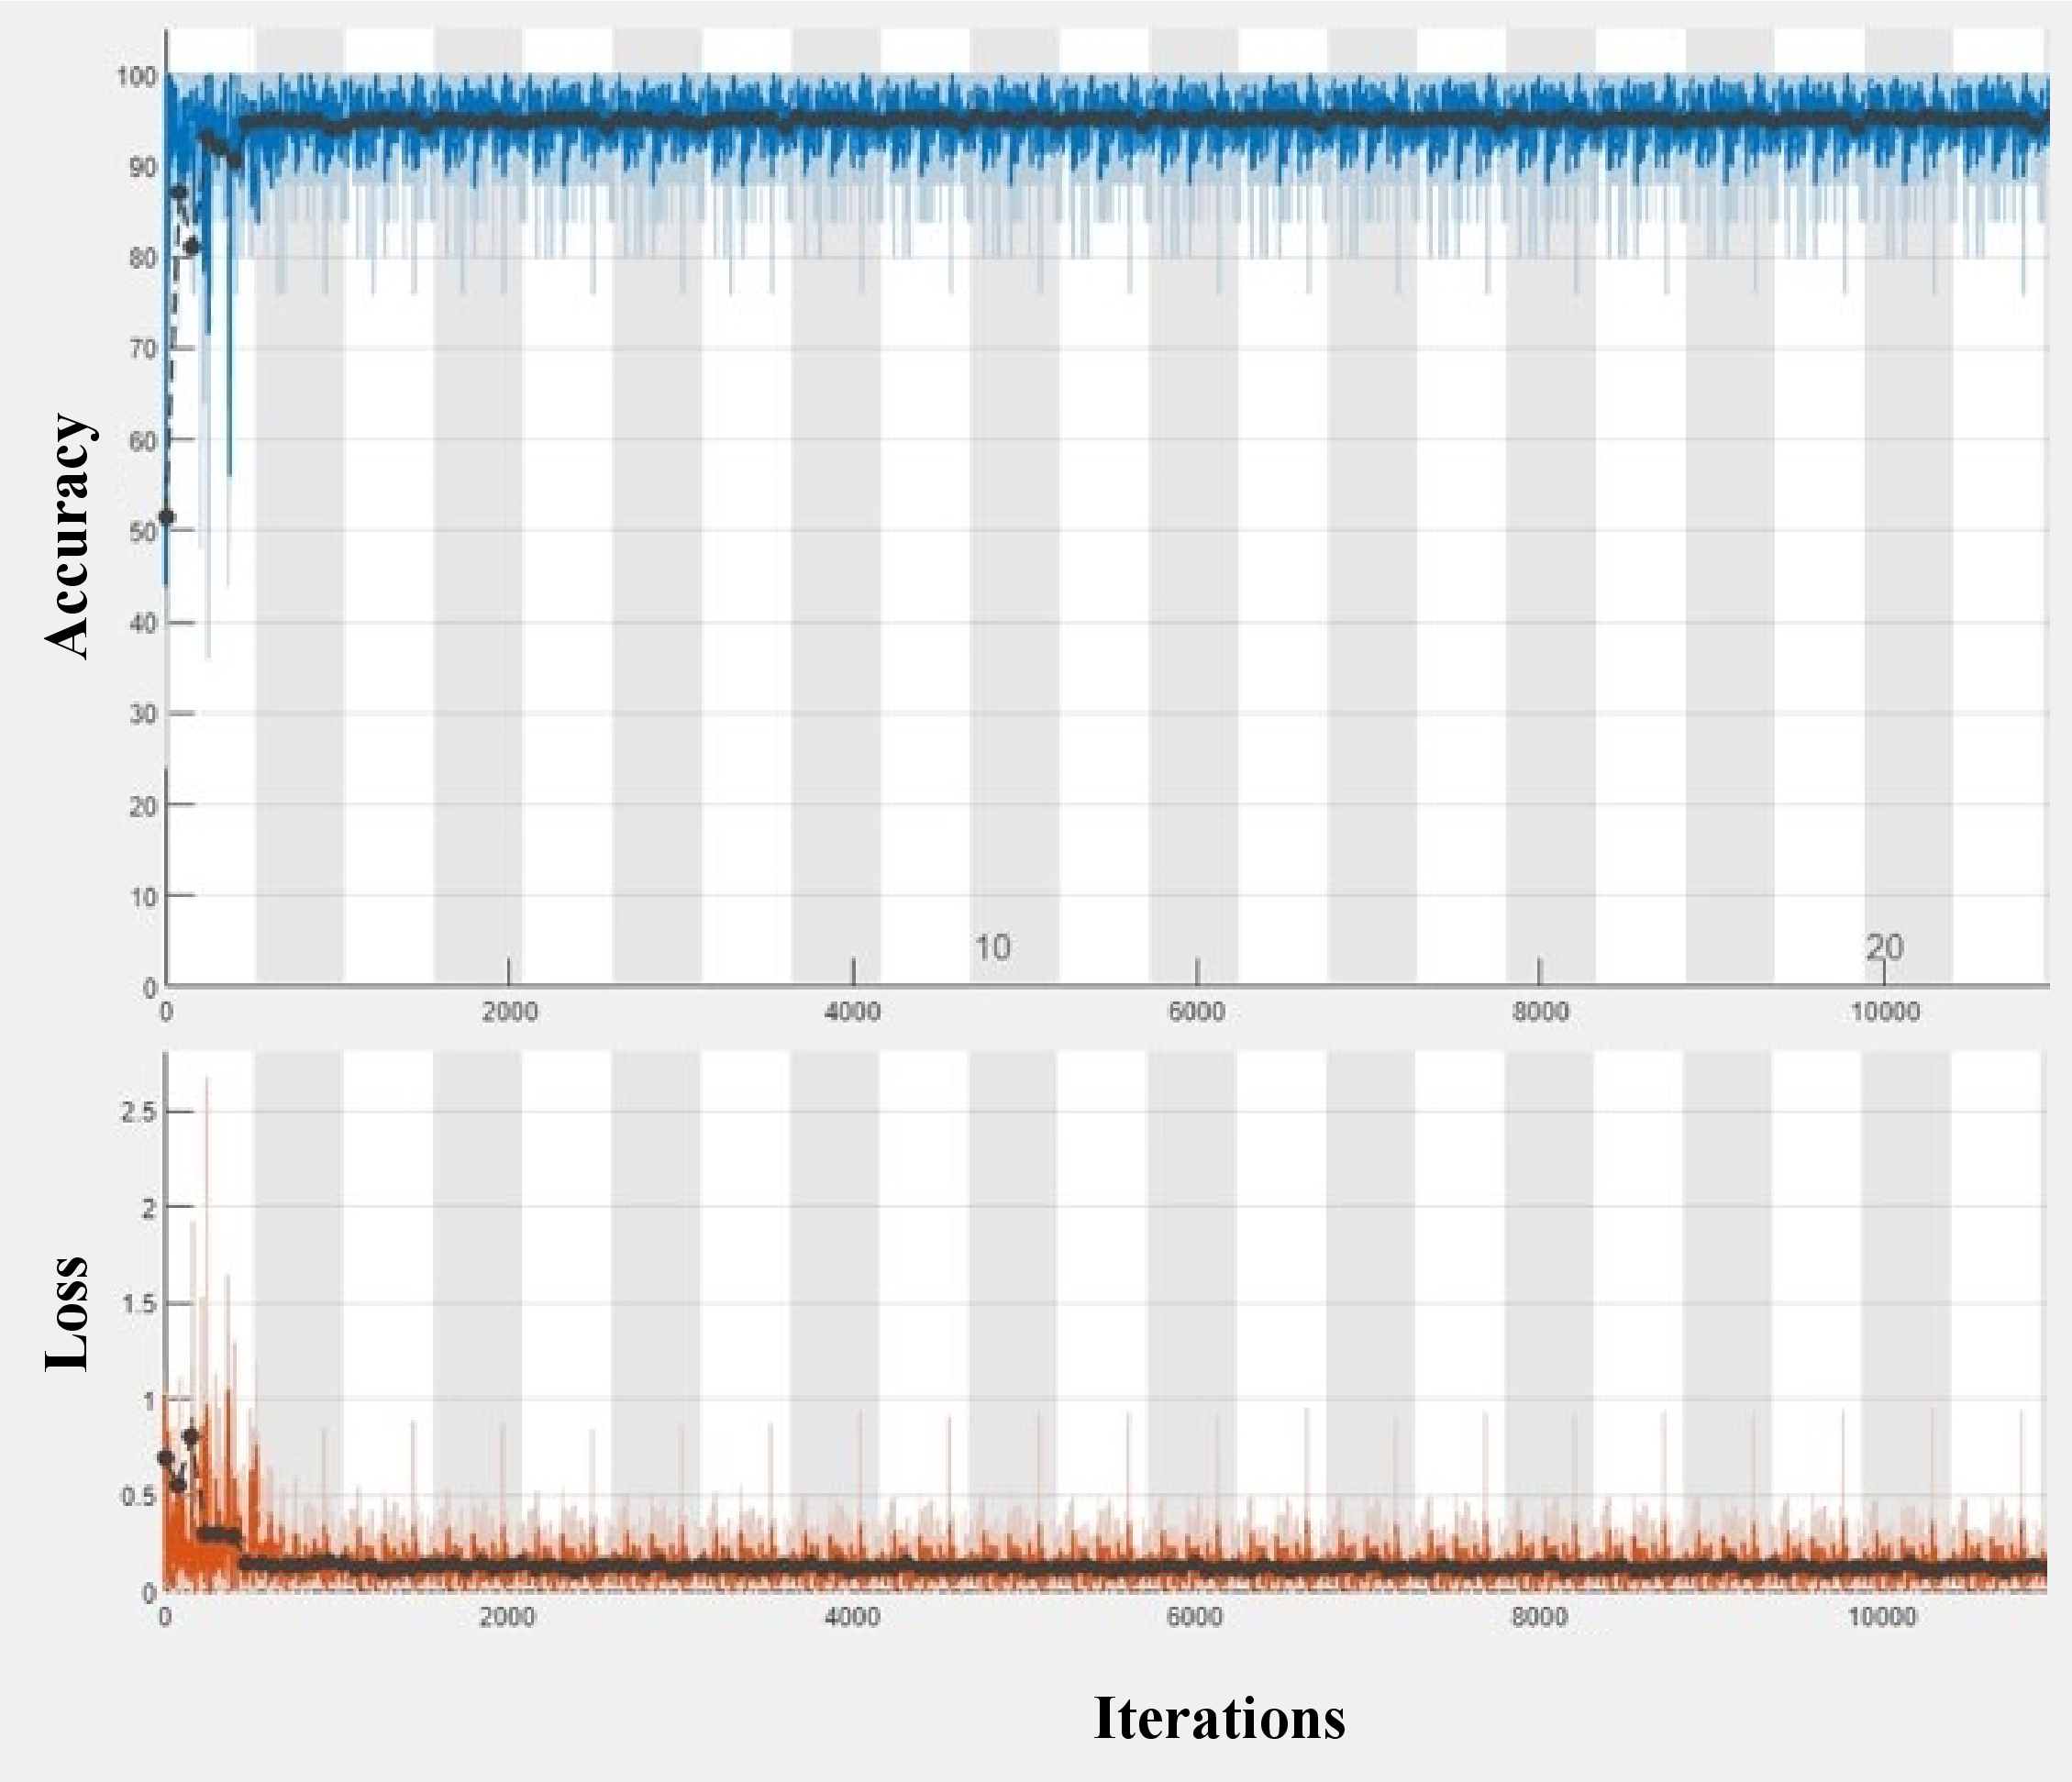
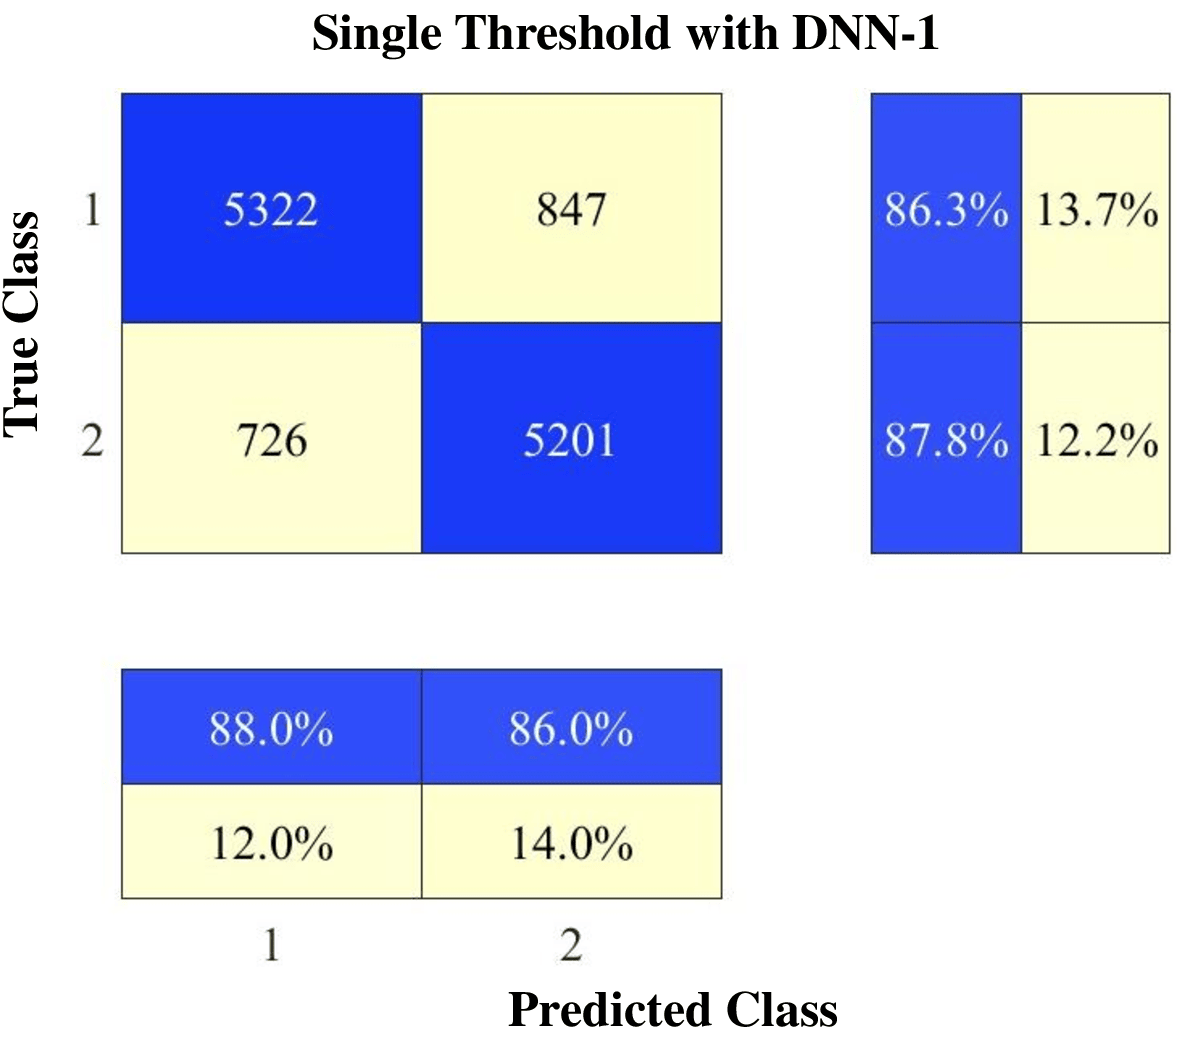
Fig. 8 presents the confusion matrix for jamming detection with a single threshold DNN design while the SJNR is spanning from -10.5 to 30 dB. The figure demonstrates the performance of the detection algorithm in which true positive (TP) and true negative (TN) correspond to non-jammed and jammed classes respectively. Based on this matrix, the algorithm classified 5322 observations as TP with the rate of 88.0%, and 5201 cases as TN with the rate of 86.0%. 12.0% of the jammed cases were falsely classified as non-jammed scenarios and 14.0% of the non-jammed observations were erroneously classified as jammed cases. This demonstrates the ability of the model to accurately differentiate between jammed and non-jammed signals. However, it also introduces the potential for further improvement to decrease the misclassification cases particularly to reduce the FN observations. In the jamming detection scenario, reducing FN is more important than FP, as failure to identify a jammer leads to security risks and communication disruption [68].
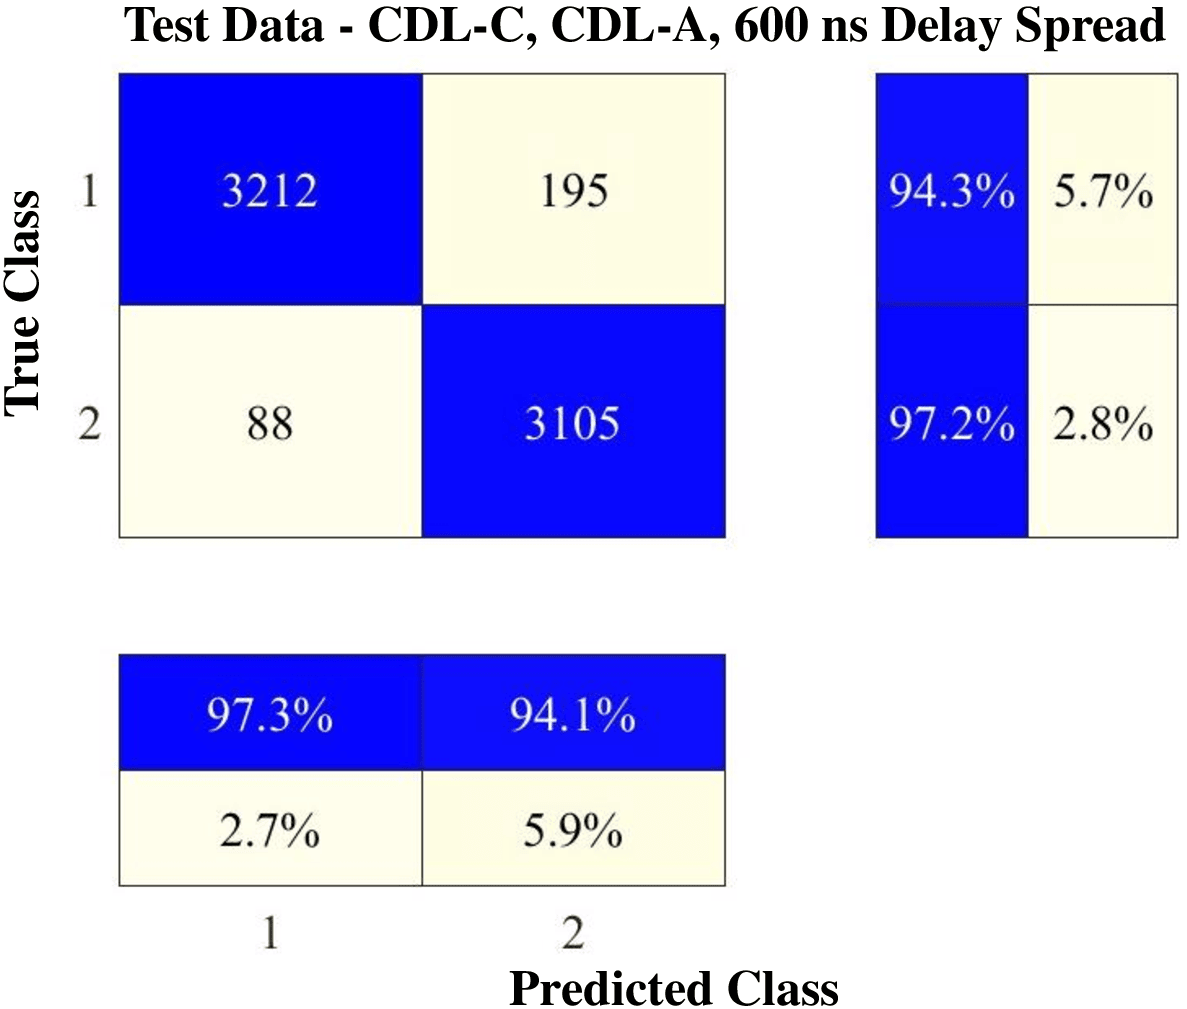
After training and testing the model, a different test dataset is implemented consisting of signals transmitted over CDL-C and CDL-A channel models with delay spread. The purpose of this test is to show the generalization of the proposed model to various 5G network settings. The confusion matrix in Fig. 9 demonstrates the robustness of the design to the disparities of the network by correctly detecting 97.3% of the non-jammed cases and 94.1% of jammed cases. Furthermore, recall and precision can be obtained as 0.97 and 0.94 respectively. Hence, the model demonstrates minimal misclassification which shows its ability to detect the attack despite increased complexity. This test highlights the potential of the detection model in a real-world 5G network while maintaining performance and accuracy in a more complex test environment.
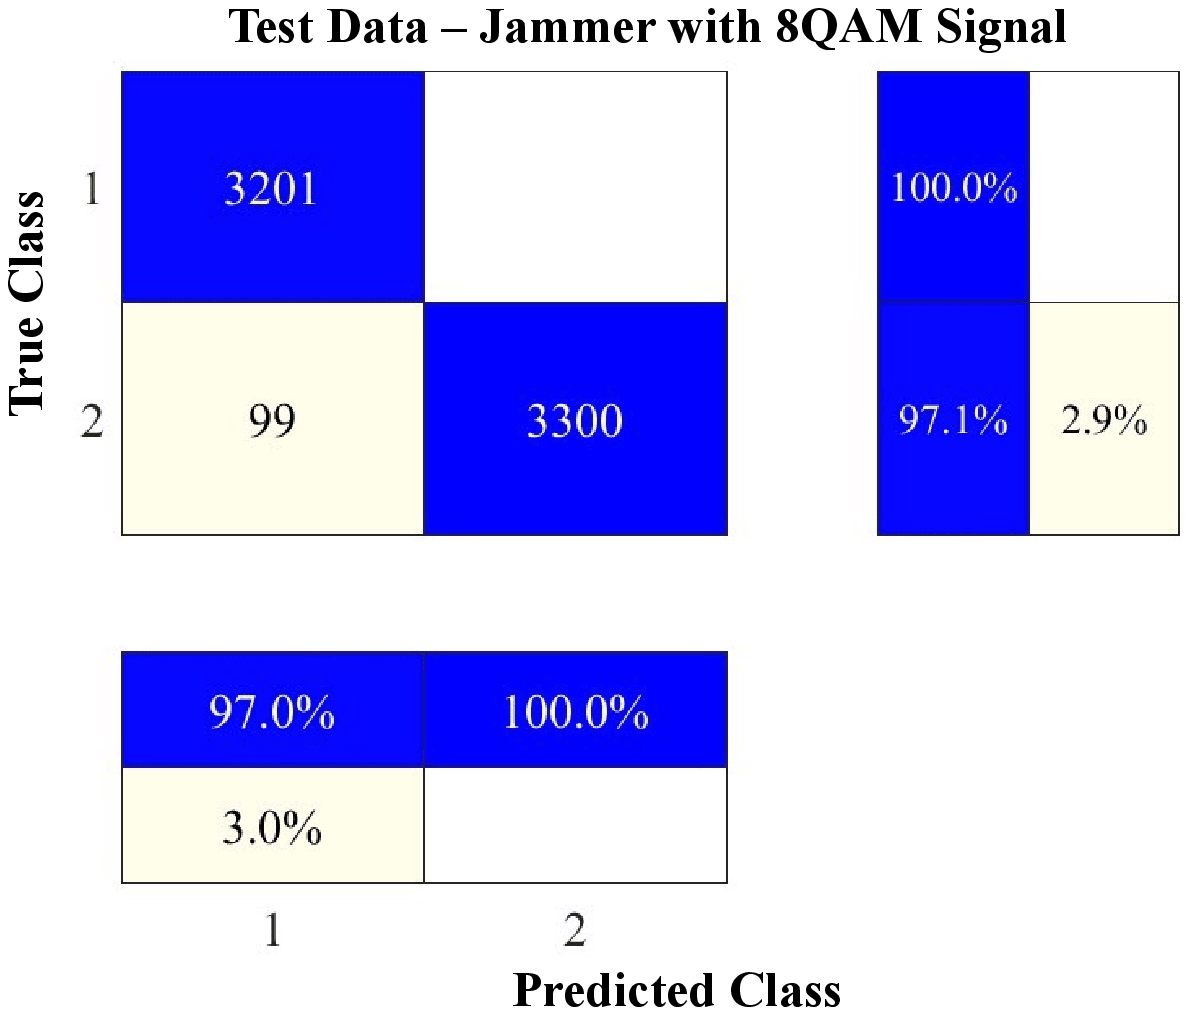
Besides testing under different network settings, a second test dataset compromised by a jammer transmitting with 8QAM signal modulation is created to test the effectiveness of the detector model to different types of jamming signals. Based on the confusion matrix of this test which is provided in Fig. 10, despite using AWGN as the jamming signal in the training process, it demonstrates acceptable flexibility by accurately classifying 97% of non-jammed cases and 100% of jammed observations. These results show the robustness of the design against novel jamming techniques which signifies a transfer of learning from one jamming mode to another. However, no percentage of jammed cases were incorrectly classified, which corresponds to zero probability of miss-detection (FP=0). These results demonstrate the ability of the model to stay generalized to various types of jamming without requiring retraining.
V-A3 DT-DDNN Performance
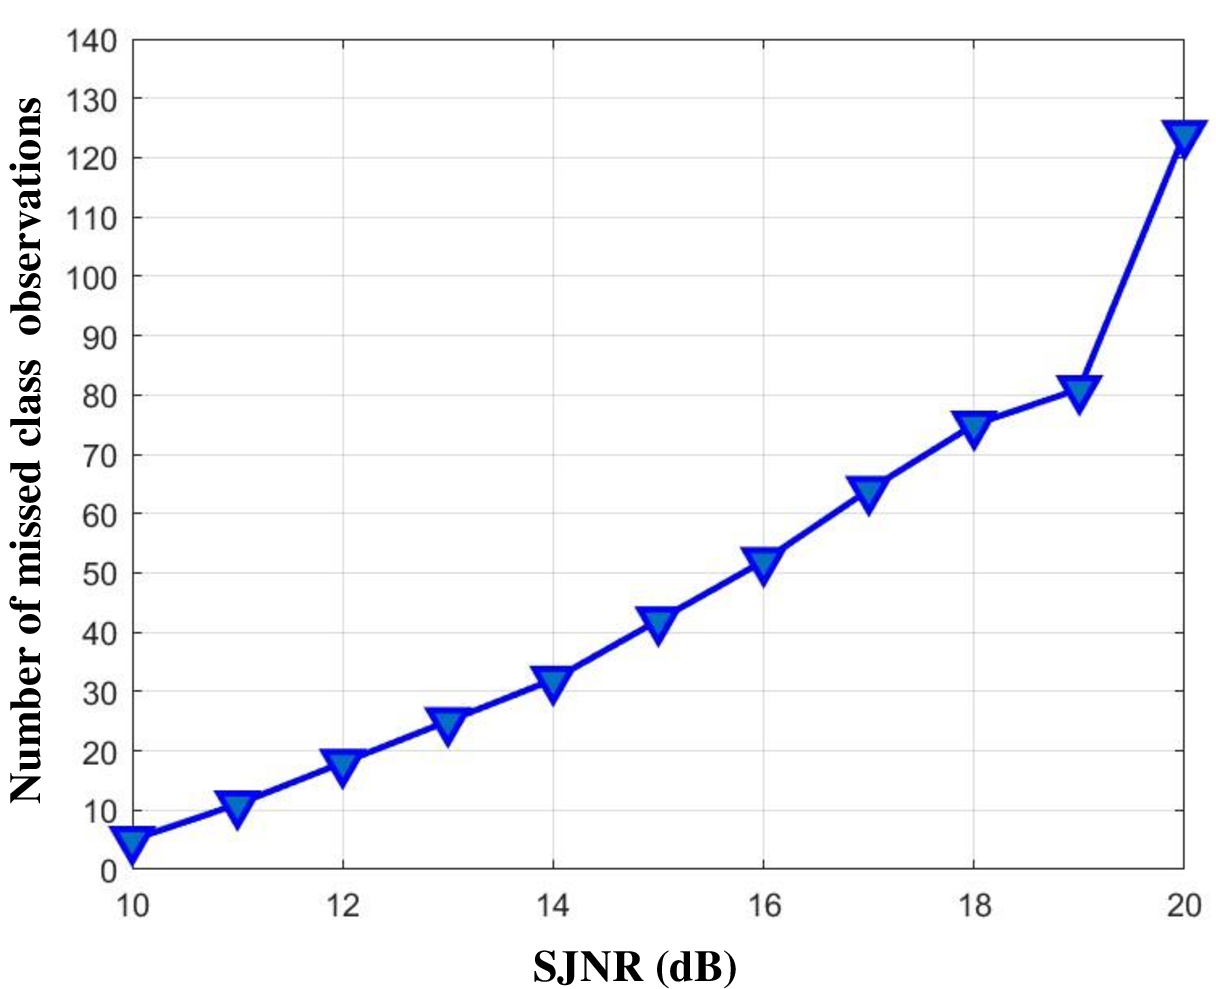
Fig. 11 demonstrates the relationship between the number of missed class observations and the SJNR in dB. During these experiments, the received power of gNB is fixed to focus solely on the effect of the jammer. It can be observed that as the SJNR increases, there is a significant rise in the number of missed detections. This trend is related to the reduction in the strength of the received jamming signal compared to the power received from the gNB as SJNR increases. As a result, the effect of the jammer on model features is decreased and the received signal pattern is similar to the cases without the jammer, which contributes to a rise in classification error. The observed situation highlights a significant challenge in the jamming detection model as it is more difficult for the detector to distinguish between the jammed and legitimate signals. Thus, in a high SJNR regime, the deep learning model incorrectly classifies jammed signals as normal. One solution to resolve this issue is adding a double-threshold DNN model to the design. The primary objective of this change is to augment the sensitivity of the jamming detection model, particularly in conditions characterized by high SJNR. By employing a double threshold approach, the detection model is capable of conducting a more comprehensive analysis of the signal, distinguishing low-power jamming attacks from regular signal fluctuations which enhances the precision of the model.
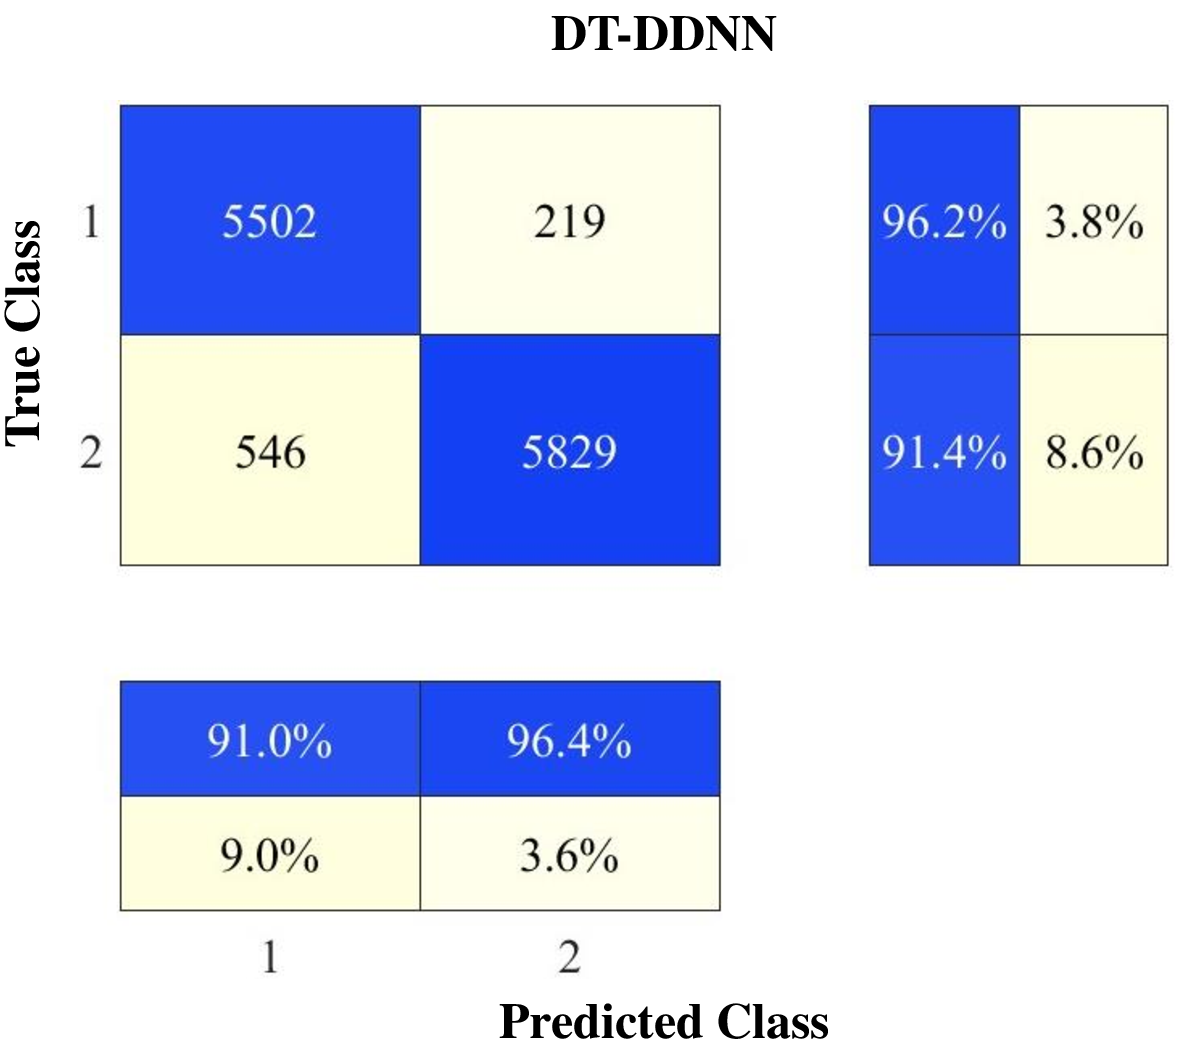
The confusion matrix of the DT-DDNN design which includes a double DNN architecture to improve the sensitivity of the jamming detector is presented in Fig. 12. While the first DNN uses a double-threshold concept to increase the sensitivity, the second DNN includes a deep cascade learning model to enhance the ability of the system to accurately classify complex observations and decrease the probability of miss-detection to 9.0%. The model accurately classifies 91.0% of non-jammed cases and 96.4% of jammed observations, which shows almost 3% and 10.4% rise in the accuracy compared to the single threshold architecture. These results represent an advancement in the ability to detect and provide countermeasures for jamming attacks in real-world scenarios of the 5G network.
Comparative analysis of three DNN designs for jamming detection in a 5G network is provided by the ROC curves in Fig. 13. The green dotted curve corresponds to a DNN trained on raw IQ samples taken from 5G waveform with no preprocessing block in the design. The optimum configuration was achieved with 4 layers of CNN with batch and ReLu following each layer. The single threshold DNN design, illustrated by the blue dashed curve, is correspondence to the single threshold DNN design that uses a single DNN to classify jammed cases. In contrast, the red solid curve represents the DT-DDNN design which uses a double DNN system to improve the sensitivity of the detection algorithm. The primary DNN block detects jamming by applying a double threshold decision-making method, and the secondary DNN handles observations that fall into the ambiguous area that the first DNN has found difficulties in classifying. By integrating a deep cascade learning model into the second DNN, the objective is to further enhance the classification performance. Based on the ROC curves, it is evident that the DT-DDNN provides a higher probability of detection () in comparison to the majority of false alarm probabilities (). This indicates a greater proportion of true positive and a reduced potential of miss-detection of legit signals as jamming. This suggests that the second design with DT-DDNN architecture offers a more robust jamming detection system under challenging detection cases.

V-B Experimental Validation
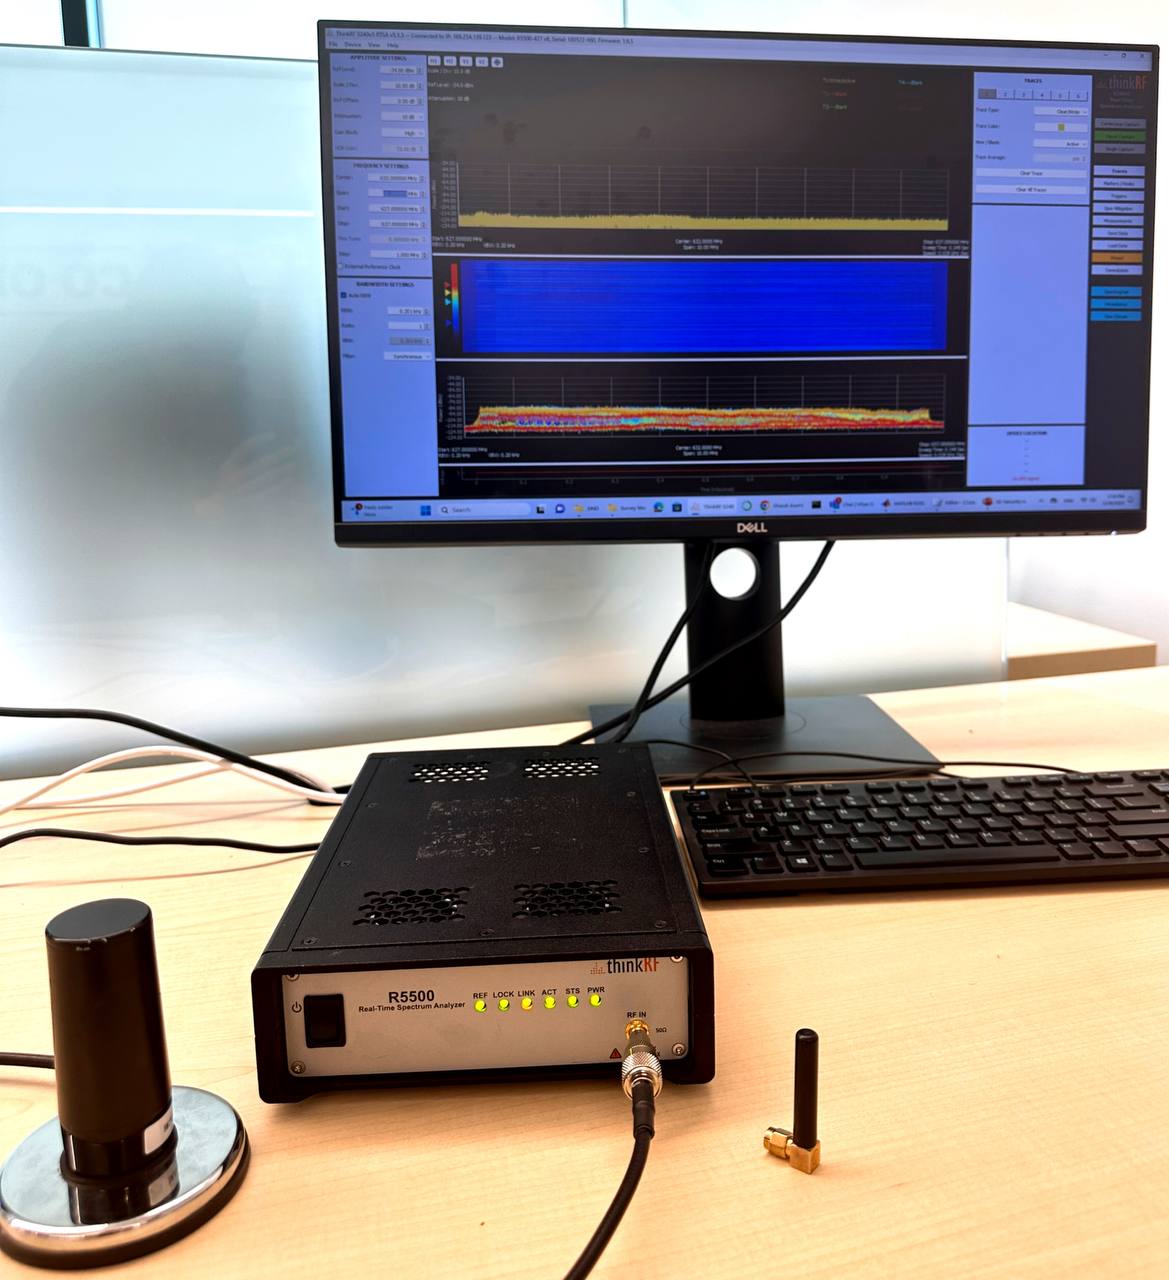
The experimental evaluation is conducted within the FR1 5G NR n71 band operating within the downlink frequency range of 617-652 MHz and bandwidth of 35 MHz [69]. During the initial tests, it is concluded that this spectrum is shared between Telus (with carrier frequency of ) and Rogers (with carrier frequency of ). Data acquisition is performed using ThinkRF spectrum analyzer RTSA R5500 (shown in Fig. 14) and two different types of antennas. The location of the test and therefore distance from the gNB is variable during the sampling. The experimental setup is configured with the sample rate of 15.625 MHz, the carrier frequency of , and the intermediate frequency bandwidth (IFBW) of 10 MHZ. Sampling is conducted in various environments, including indoor (behind the windows and under the desk) and outdoor (Line-of-Sight (LOS) and Non-Line-of-Sight (NLOS)) scenarios and collected samples are stored in CSV format using PyRF4 API.
To extract precise information of SSB, it is critical to perform time offset (TO) and carrier frequency offset (CFO) estimations. This is due to the lack of knowledge on the exact center frequency, which necessitates the application of a blind search. To accurately calculate the TO and CFO, we utilize the PSS correlation characteristics along with the cyclic prefix from CP-OFDM 5G waveform to fine-tune with gNB signal. The optimization problem for estimating CFO is formulated as,
| (29) |
For obtaining time offset to the SSB, Schmidl & Cox approach [70] is adopted which exploits the cyclic prefix in 5G waveform. Hence, the following optimization problem is solved numerically.
| (30) |
in which and are as,
| (31) |
and
| (32) |
respectively. Following the extraction of SSB, the correlation signals and EPNRE values are calculated. Fig. 15 demonstrates OFDM symbols of SSB versus the subcarrier indices for one of the observations selected as an example. In this figure, black cross markers represent the PSS symbols that are used to calculate PSS correlation, and red dots correspond to null subcarriers from which EPNRE is calculated. The features of collected samples, including 6000 observations, are then transferred into a 3D tensor and fed into the DT-DDNN model. The threshold parameters of the DT-DDNN which defines the sensitivity of the model are updated based on environmental noise power.

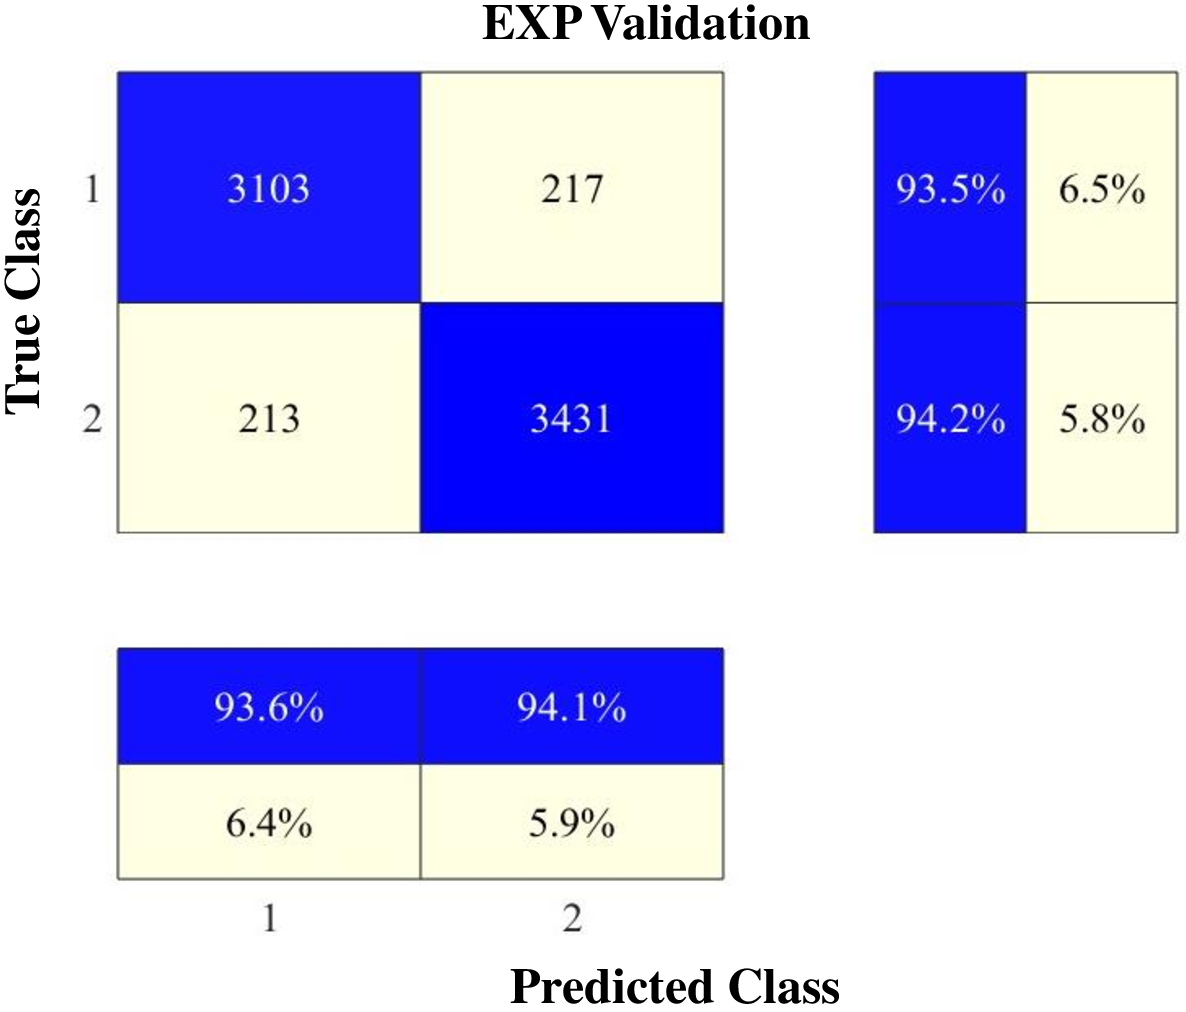
The confusion matrix in Fig. 16 provides an evaluation of the performance of DT-DDNN model using data obtained from the practical testbed. Based on these results, the model accurately classifies 93.6% of non-jammed cases and 94.1% of jammed observations. 213 observations of jammed signals are classified as non-jammed cases with a miss-detection rate of 6.4% and 217 cases of non-jammed observation are classified as jammed observations with false-alarm probability of 5.9%. These results validate the practical applicability and efficacy of DT-DDNN model by showing the ability of the proposed model to accurately distinguish between jammed and non-jammed 5G signals in experimental configuration.
VI conclusion
This work presents a robust deep-learning-based approach to detect smart and barrage jamming attacks in 5G networks with a particular focus on 5G SSB. By incorporating deep cascade learning and DWT, our DT-DDNN architecture provides remarkable accuracy in classifying a wide range of jamming scenarios, including those characterized by high SJNR values and diverse signal transmission settings. A preprocessing block is integrated to extract PSS correlation and EPNRE characteristics of the received signal which has enhanced the ability of the model to differentiate between the jammed and non-jammed observations. Inclusion of a DWT block in the model, the performance of the training process has enhanced and the training duration is reduced while maintaining the accuracy of the detection. Our results show that DT-DDNN outperforms the single threshold approach and provides more robustness and sensitivity to different jamming scenarios. DT-DDNN demonstrates improved detection probability by 10.4% and 13.2% compared to single threshold design and unprocessed IQ sample DNN design respectively. Furthermore, the adaptability of the model has been verified via several experiments with varied channel conditions, delay spread, and jamming techniques. The provided outcomes highlight the effectiveness of the suggested approach which precisely identifies jammer presence in the network with minimal false positive and miss-detection. Additionally, an experimental setup is built to assess the performance of the proposed DT-DDNN model in response to real 5G signals. The experiments conducted on the data collected from the testbed confirm the effectiveness of the system in practical scenarios. Our ongoing research includes investigation of the potential of unsupervised generative models in jamming detection to improve the performance of the system in the detection of unseen and novel jamming attacks. Furthermore, combining the CFO estimator with the design is expected to transfer the preprocessing load partially to the machine learning block.
Acknowledgment
This work was supported in part by funding from the Innovation for Defence Excellence and Security (IDEaS) program from the Department of National Defence (DND). The authors would like to acknowledge the support of thinkRF in building the experimental setup for this work.
References
- [1] F. Hamidi-Sepehr, M. Sajadieh, S. Panteleev, T. Islam, I. Karls, D. Chatterjee, and J. Ansari, “5g urllc: Evolution of high-performance wireless networking for industrial automation,” IEEE Communications Standards Magazine, vol. 5, no. 2, pp. 132–140, 2021.
- [2] R. Khan, P. Kumar, D. N. K. Jayakody, and M. Liyanage, “A survey on security and privacy of 5g technologies: Potential solutions, recent advancements, and future directions,” IEEE Communications Surveys & Tutorials, vol. 22, no. 1, pp. 196–248, 2019.
- [3] S. Zhang, Y. Wang, and W. Zhou, “Towards secure 5g networks: A survey,” Computer Networks, vol. 162, p. 106871, 2019.
- [4] J. H. Park, S. Rathore, S. K. Singh, M. M. Salim, A. Azzaoui, T. W. Kim, Y. Pan, and J. H. Park, “A comprehensive survey on core technologies and services for 5g security: Taxonomies, issues, and solutions,” Hum.-Centric Comput. Inf. Sci, vol. 11, no. 3, 2021.
- [5] M. Amini, G. Asemian, M. Kulhandjian, B. Kantarci, C. D’Amours, and M. Erol-Kantarci, “Bypassing a reactive jammer via noma-based transmissions in critical missions,” in IEEE International Conference on Communications (ICC), 2024 (Accepted) Preprint: https://arxiv.org/pdf/2401.10387.pdf.
- [6] H. Zhang, M. Elsayed, M. Bavand, R. Gaigalas, Y. Ozcan, and M. Erol-Kantarci, “Federated learning with dual attention for robust modulation classification under attacks,” arXiv preprint arXiv:2401.11039, 2024.
- [7] R. Tuninato, D. G. Riviello, R. Garello, B. Melis, and R. Fantini, “A comprehensive study on the synchronization procedure in 5g nr with 3gpp-compliant link-level simulator,” EURASIP Journal on Wireless Communications and Networking, vol. 2023, no. 1, p. 111, 2023.
- [8] 3GPP, “5G; NR; Physical channels and modulation,” 3rd Generation Partnership Project (3GPP), Technical Specification (TS) 38.211, 10 2023, version 17.6.0. [Online]. Available: https://portal.3gpp.org/desktopmodules/Specifications/SpecificationDet-\\ails.aspx?specificationId=3213
- [9] M. E. Flores, D. D. Poisson, C. J. Stevens, A. V. Nieves, and A. M. Wyglinski, “Implementation and evaluation of a smart uplink jamming attack in a public 5g network,” IEEE Access, 2023.
- [10] H. Pirayesh and H. Zeng, “Jamming attacks and anti-jamming strategies in wireless networks: A comprehensive survey,” IEEE communications surveys & tutorials, vol. 24, no. 2, pp. 767–809, 2022.
- [11] M. Lichtman, R. Rao, V. Marojevic, J. Reed, and R. P. Jover, “5g nr jamming, spoofing, and sniffing: Threat assessment and mitigation,” in IEEE Intl. Conf. on Communications workshops, 2018, pp. 1–6.
- [12] S.-D. Wang, H.-M. Wang, W. Wang, and V. C. Leung, “Detecting intelligent jamming on physical broadcast channel in 5g nr,” IEEE Communications Letters, 2023.
- [13] Y. Arjoune and S. Faruque, “Smart jamming attacks in 5g new radio: A review,” in 2020 10th annual computing and communication workshop and conference (CCWC). IEEE, 2020, pp. 1010–1015.
- [14] N. Ludant and G. Noubir, “Sigunder: a stealthy 5g low power attack and defenses,” in Proceedings of the 14th ACM Conference on Security and Privacy in Wireless and Mobile Networks, 2021, pp. 250–260.
- [15] Y. Arjoune and S. Faruque, “Real-time machine learning based on hoeffding decision trees for jamming detection in 5G new radio,” in IEEE Intl. Conf. on Big Data (Big Data), 2020, pp. 4988–4997.
- [16] C. Örnek and M. Kartal, “An efficient EVM based jamming detection in 5G networks,” in IEEE Middle East and North Africa COMMunications Conf. (MENACOMM), 2022, pp. 130–135.
- [17] M. S. J. Solaija, H. Salman, and H. Arslan, “Towards a unified framework for physical layer security in 5g and beyond networks,” IEEE Open Journal of Vehicular Technology, vol. 3, pp. 321–343, 2022.
- [18] C. Zhang, F. Jia, Z. Zhang, J. Ge, and F. Gong, “Physical layer security designs for 5g noma systems with a stronger near-end internal eavesdropper,” IEEE Transactions on Vehicular Technology, vol. 69, no. 11, pp. 13 005–13 017, 2020.
- [19] N. Nandan, S. Majhi, and H.-C. Wu, “Beamforming and power optimization for physical layer security of MIMO-NOMA based CRN over imperfect CSI,” IEEE Transactions on Vehicular Technology, vol. 70, no. 6, pp. 5990–6001, 2021.
- [20] S. Huang, M. Xiao, and H. V. Poor, “On the physical layer security of millimeter wave noma networks,” IEEE Transactions on Vehicular Technology, vol. 69, no. 10, pp. 11 697–11 711, 2020.
- [21] T. Hossain, S. Shabab, A. Badrudduza, M. K. Kundu, and I. S. Ansari, “On the physical layer security performance over ris-aided dual-hop rf-uowc mixed network,” IEEE Transactions on Vehicular Technology, vol. 72, no. 2, pp. 2246–2257, 2022.
- [22] M. E. Eltayeb, J. Choi, T. Y. Al-Naffouri, and R. W. Heath, “Enhancing secrecy with multiantenna transmission in millimeter wave vehicular communication systems,” IEEE Transactions on Vehicular Technology, vol. 66, no. 9, pp. 8139–8151, 2017.
- [23] H. Sharma, N. Kumar, and R. Tekchandani, “Mitigating jamming attack in 5G heterogeneous networks: A federated deep reinforcement learning approach,” IEEE Transactions on Vehicular Technology, vol. 72, no. 2, pp. 2439–2452, 2022.
- [24] J. Viana, H. Farkhari, P. Sebastião, L. M. Campos, K. Koutlia, B. Bojovic, S. Lagén, and R. Dinis, “Deep attention recognition for attack identification in 5G UAC scenarios: Novel architecture and end-to-end evaluation,” IEEE Transactions on Vehicular Technology, 2023.
- [25] L. Chiarello, P. Baracca, K. Upadhya, S. R. Khosravirad, and T. Wild, “Jamming detection with subcarrier blanking for 5G and beyond in industry 4.0 scenarios,” in IEEE Intl. Symp. on Personal, Indoor and Mobile Radio Communications (PIMRC), 2021, pp. 758–764.
- [26] C. Örnek and M. Kartal, “Securing the future: A resourceful jamming detection method utilizing the EVM metric for next-generation communication systems,” Electronics, vol. 12, no. 24, p. 4948, 2023.
- [27] S. Jere, Y. Wang, I. Aryendu, S. Dayekh, and L. Liu, “Bayesian inference-assisted machine learning for near real-time jamming detection and classification in 5G New Radio (NR),” IEEE Transactions on Wireless Communications, 2023.
- [28] B. M. Kouassi, V. Monsan, A. B. Ballo, J. A. Kacoutchy, D. MAMADOU, and K. J. Adou, “Application of the learning set for the detection of jamming attacks in 5G mobile networks,” Intl. J. of Advanced Computer Science and Applications, vol. 14, no. 6, 2023.
- [29] M. Hachimi, G. Kaddoum, G. Gagnon, and P. Illy, “Multi-stage jamming attacks detection using deep learning combined with kernelized support vector machine in 5G cloud radio access networks,” in Intl. Symp. on networks, computers and communications. IEEE, 2020, pp. 1–5.
- [30] Y. Wang, S. Jere, S. Banerjee, L. Liu, S. Shetty, and S. Dayekh, “Anonymous jamming detection in 5G with bayesian network model based inference analysis,” in IEEE Intl. Conf. on High Performance Switching and Routing (HPSR), 2022, pp. 151–156.
- [31] Z. Feng and C. Hua, “Machine learning-based rf jamming detection in wireless networks,” in Intl. Conf. on security of smart cities, industrial control system and communications (SSIC). IEEE, 2018, pp. 1–6.
- [32] T. Kopacz, S. Schießl, A.-M. Schiffarth, and D. Heberling, “Effective ssb beam radiation pattern for RF-EMF maximum exposure assessment to 5G base stations using massive MIMO antennas,” in European Conf. on Antennas and Propagation (EuCAP). IEEE, 2021, pp. 1–5.
- [33] Z. Lin, J. Li, Y. Zheng, N. V. Irukulapati, H. Wang, and H. Sahlin, “Ss/pbch block design in 5G new radio (NR),” in IEEE Globecom Workshops. IEEE, 2018, pp. 1–6.
- [34] F. Chen, X. Li, Y. Zhang, and Y. Jiang, “Design and implementation of initial cell search in 5G NR systems,” China Communications, vol. 17, no. 5, pp. 38–49, 2020.
- [35] 3GPP, “NR; Physical layer procedures for control,” 3rd Generation Partnership Project (3GPP), Technical Specification (TS) 38.213, 10 2023, version 17.7.0. [Online]. Available: https://portal.3gpp.org/desktopmodules/Specifications/SpecificationDet-\\ails.aspx?specificationId=3215
- [36] Y.-H. You and H.-K. Song, “Efficient sequential detection of carrier frequency offset and primary synchronization signal for 5G NR systems,” IEEE Trans. on Vehicular Technology, vol. 69/8, pp. 9212–9216, 2020.
- [37] R. S. Stanković and B. J. Falkowski, “The haar wavelet transform: its status and achievements,” Computers & Electrical Engineering, vol. 29, no. 1, pp. 25–44, 2003.
- [38] X. Liu, M. Ahsan, M. Ahmad, M. Nisar, X. Liu, I. Ahmad, and H. Ahmad, “Applications of haar wavelet-finite difference hybrid method and its convergence for hyperbolic nonlinear schr ö dinger equation with energy and mass conversion,” Energies, vol. 14, no. 23, p. 7831, 2021.
- [39] R. Tang, X. Zhou, and C. Wang, “A haar wavelet decision feedback channel estimation method in ofdm systems,” Applied Sciences, vol. 8, no. 6, p. 877, 2018.
- [40] J. M. Johnson and T. M. Khoshgoftaar, “Survey on deep learning with class imbalance,” Journal of Big Data, vol. 6, no. 1, pp. 1–54, 2019.
- [41] M. Buda, A. Maki, and M. A. Mazurowski, “A systematic study of the class imbalance problem in convolutional neural networks,” Neural networks, vol. 106, pp. 249–259, 2018.
- [42] Q. Lv, W. Feng, Y. Quan, G. Dauphin, L. Gao, and M. Xing, “Enhanced-random-feature-subspace-based ensemble cnn for the imbalanced hyperspectral image classification,” IEEE J. of Sel. Topics in Applied Earth Observations and Remote Sensing, vol. 14, pp. 3988–3999, 2021.
- [43] D. Dablain, K. N. Jacobson, C. Bellinger, M. Roberts, and N. V. Chawla, “Understanding cnn fragility when learning with imbalanced data,” Machine Learning, pp. 1–26, 2023.
- [44] N. Rojhani, M. Passafiume, M. Sadeghibakhi, G. Collodi, and A. Cidronali, “Model-based data augmentation applied to deep learning networks for classification of micro-doppler signatures using fmcw radar,” IEEE Transactions on Microwave Theory and Techniques, 2023.
- [45] L. Cai, K. Cao, Y. Wu, and Y. Zhou, “Spectrum sensing based on spectrogram-aware cnn for cognitive radio network,” IEEE Wireless Communications Letters, vol. 11, no. 10, pp. 2135–2139, 2022.
- [46] O. M. Gul, M. Kulhandjian, B. Kantarci, A. Touazi, C. Ellement, and C. D’amours, “Secure industrial iot systems via RF fingerprinting under impaired channels with interference and noise,” IEEE Access, vol. 11, pp. 26 289–26 307, 2023.
- [47] L. Li, Z. Zhang, and L. Yang, “Influence of autoencoder-based data augmentation on deep learning-based wireless communication,” IEEE Wireless Communications Letters, vol. 10, no. 9, pp. 2090–2093, 2021.
- [48] Q. Zheng, P. Zhao, Y. Li, H. Wang, and Y. Yang, “Spectrum interference-based two-level data augmentation method in deep learning for automatic modulation classification,” Neural Computing and Applications, vol. 33, no. 13, pp. 7723–7745, 2021.
- [49] J. Liu, M. Nogueira, J. Fernandes, and B. Kantarci, “Adversarial machine learning: A multilayer review of the state-of-the-art and challenges for wireless and mobile systems,” IEEE Communications Surveys & Tutorials, vol. 24, no. 1, pp. 123–159, 2022.
- [50] A. Mumuni and F. Mumuni, “Data augmentation: A comprehensive survey of modern approaches,” Array, p. 100258, 2022.
- [51] C. Shorten and T. M. Khoshgoftaar, “A survey on image data augmentation for deep learning,” J. of big data, vol. 6/1, pp. 1–48, 2019.
- [52] K. Maharana, S. Mondal, and B. Nemade, “A review: Data pre-processing and data augmentation techniques,” Global Transitions Proceedings, vol. 3, no. 1, pp. 91–99, 2022.
- [53] C. Comert, M. Kulhandjian, O. M. Gul, A. Touazi, C. Ellement, B. Kantarci, and C. D’Amours, “Analysis of augmentation methods for rf fingerprinting under impaired channels,” in Proc. of the 2022 ACM Workshop on Wireless Security and Machine Learning, 2022.
- [54] K. Zhang, Z. Cao, and J. Wu, “Circular shift: An effective data augmentation method for convolutional neural network on image classification,” in IEEE Intl. Conf. on image processing. IEEE, 2020, pp. 1676–1680.
- [55] P. Singh, “Systematic review of data-centric approaches in artificial intelligence and machine learning,” Data Sci. and Management, 2023.
- [56] J. Gu, Z. Wang, J. Kuen, L. Ma, A. Shahroudy, B. Shuai, T. Liu, X. Wang, G. Wang, J. Cai et al., “Recent advances in convolutional neural networks,” Pattern recognition, vol. 77, pp. 354–377, 2018.
- [57] A. Mukherjee, P. Goswami, M. A. Khan, L. Manman, L. Yang, and P. Pillai, “Energy-efficient resource allocation strategy in massive iot for industrial 6g applications,” IEEE Internet of Things Journal, vol. 8, no. 7, pp. 5194–5201, 2020.
- [58] S. Solanki, V. Dehalwar, J. Choudhary, M. L. Kolhe, and K. Ogura, “Spectrum sensing in cognitive radio using CNN-RNN and transfer learning,” IEEE Access, vol. 10, pp. 113 482–113 492, 2022.
- [59] H. Xing, H. Qin, S. Luo, P. Dai, L. Xu, and X. Cheng, “Spectrum sensing in cognitive radio: A deep learning based model,” Trans. on Emerging Telecommunications Technologies, vol. 33, no. 1, p. e4388, 2022.
- [60] S.-H. Noh, “Performance comparison of cnn models using gradient flow analysis,” in Informatics, vol. 8, no. 3. MDPI, 2021, p. 53.
- [61] E. S. Marquez, J. S. Hare, and M. Niranjan, “Deep cascade learning,” IEEE transactions on neural networks and learning systems, vol. 29, no. 11, pp. 5475–5485, 2018.
- [62] N. Ali, A. Z. Ijaz, R. H. Ali, Z. U. Abideen, and A. Bais, “Scene parsing using fully convolutional network for semantic segmentation,” in IEEE Canadian Conf. on Electrical and Computer Eng, 2023, pp. 180–185.
- [63] N. Gautam, A. Choudhary, and B. Lall, “Comparative study of neural network architectures for modelling nonlinear optical pulse propagation,” Optical Fiber Technology, vol. 64, p. 102540, 2021.
- [64] Y. Wang, Z. Ni, S. Song, L. Yang, and G. Huang, “Revisiting locally supervised learning: an alternative to end-to-end training,” arXiv preprint arXiv:2101.10832, 2021.
- [65] X. Du, K. Farrahi, and M. Niranjan, “Transfer learning across human activities using a cascade neural network architecture,” in Proc. ACM Intl. Symp. on Wearable Computers, 2019, pp. 35–44.
- [66] 3GPP, “5G; Study on channel model for frequencies from 0.5 to 100 GHz,” 3rd Generation Partnership Project (3GPP), Technical Specification (TS) 38.901, 11 2020, version 16.1.0. [Online]. Available: https://portal.3gpp.org/desktopmodules/Specifications/SpecificationDet-\\ails.aspx?specificationId=3173
- [67] X. Han, S. Liu, and L. Fu, “Hybrid beamforming for full-duplex enabled cellular system in the unlicensed mmwave band,” in 2021 IEEE Global Communications Conference (GLOBECOM). IEEE, 2021, pp. 1–6.
- [68] C. Greco, P. Pace, S. Basagni, and G. Fortino, “Jamming detection at the edge of drone networks using multi-layer perceptrons and decision trees,” Applied Soft Computing, vol. 111, p. 107806, 2021.
- [69] 3GPP, “5G; NR; Base Station (BS) radio transmission and reception,” 3rd Generation Partnership Project (3GPP), Technical Specification (TS) 38.104, 02 2024, version 17.12.0. [Online]. Available: https://portal.3gpp.org/desktopmodules/Specifications/SpecificationDet-\\ails.aspx?specificationId=3202
- [70] T. Schmidl and D. Cox, “Robust frequency and timing synchronization for ofdm,” IEEE Transactions on Communications, vol. 45, no. 12, pp. 1613–1621, 1997.