Structural origin of relaxation in dense colloidal suspensions
Abstract
Amorphous solids relax via slow molecular rearrangement induced by thermal fluctuations or applied stress. Although microscopic structural signatures predicting these structural relaxations have long been sought, a physically motivated structural measure relevant to diverse systems remains elusive. Here, we introduce a structural order parameter derived from the mean-field caging potential experienced by the particles due to their neighbors, which reliably predicts the occurrence of structural relaxations. The parameter, derived from density functional theory, is a measure of susceptibility to particle rearrangements that can effectively identify weak or defect-like regions in disordered systems. Using experiments on dense colloidal suspensions, we demonstrate a causal relationship between this order parameter and the structural relaxations of the amorphous solid. In quiescent suspensions, increasing the density leads to stronger correlations between the structure and dynamics. Under applied shear, the mean structural order parameter increases with increasing strain, signaling shear-induced softening, which is accompanied by the proliferation of plastic events. In both cases, the order parameter reliably identifies weak regions where the plastic rearrangements due to thermal fluctuation or applied shear preferentially occur. Our study paves the way to a structural understanding of the relaxation of a wide range of amorphous solids, from suspensions to metallic glasses.
The hallmark of amorphous solids is their slow structural relaxation, which occurs many orders of magnitude slower than the molecular relaxation time. This relaxation is dynamically heterogeneous [1, 2, 3, 4, 5], related to the disordered structure of the glass, with dynamic time scales differing by orders of magnitude across the sample. A major effort has been to link this relaxation to structural hallmarks that define locally weak regions from which the relaxations originate. Unlike crystals, for which dislocations can be identified as topological defects that carry plastic relaxation within the long-range ordered lattice, no such structural measures exist for glasses, which possess only short-range order. Even when the amorphous solid is subject to external shear and the deformation is localized to regions referred to as shear transformed zones [6, 7], no structural measure has been found to predict their occurrence. While the variation in relaxation dynamics is believed to stem from the diverse atomic environment of the disordered amorphous structure, with some regions being softer than others and thus more susceptible to failure under external stresses, no unique signature has yet been identified. Even though these localized shear transformations have been integral to the earliest models of glasses [8, 9, 10] and the plasticity of amorphous solids [11, 12, 6], and several structural measures including free volume [8, 9, 12], soft modes of vibration [13, 14, 15], locally favored structures [16, 17, 18], and two-body excess entropy [19, 20, 47], were proposed to identify them, they have had limited success to identify structural relaxations under shear or thermal fluctuations [22, 23]. Although several other measures of plasticity were tested for their predictive efficacy [22], only a small subset of these measures is applicable to experimental systems such as colloidal suspensions. Recently, advancements in machine learning (ML) techniques
have led to the development of a softness parameter capable of identifying locally weak regions by considering a large number of structural descriptors [24, 25, 26, 27, 28, 29]. The ML softness was shown to identify structural defects similar to dislocations in crystals [25, 30] and to display universal scaling with the relaxation dynamics [26]. However, this parameter, like any machine learning study, lacks some physical insight.
A few other order parameters have been successful in describing structural heterogeneity and correlating well with the dynamics in the systems but have not yet been explored for systems under applied shear. Tong and Tanaka have recently proposed an order parameter that is many body in nature and correlates well with the dynamics in 2D and 3D quiescent systems [31, 32, 21]. A mean-field microscopic theory of softness based on dynamic density functional theory [33, 34, 35] was proposed to identify structural defects. In this formulation, it was assumed that each particle is caged by its neighbours, and the structure of the liquid describes this cage. The inverse of the depth of this mean-field caging potential was considered as a structural order parameter (SOP), and strong correlations between this SOP and the dynamics were found at low temperatures, where the system relaxed slowly.
It was also shown that the SOP captures both enthalpic and entropic effects, the former playing a central role in the dynamics in attractive systems and the latter in repulsive systems, suggesting that this SOP is well equipped to be a good predictor of dynamics for both attractive and repulsive systems [36]. The appeal of the order parameter is that it provides a simple, physically intuitive quantity directly obtained from the structure, making it easy to implement in experimental studies. However, it remains untested in experiments and for systems under applied shear.
Here, we demonstrate that the above structural order parameter based on the caging potential is an excellent descriptor to reliably pinpoint structural relaxations in thermally excited and sheared dense colloidal suspensions. We consider dense monolayers for quasi two-dimensional measurements under conditions of quiescence, bulk suspensions in three dimensions under constant shear, and employ the inverse depth of the mean field caging potential as the structural order parameter. The depth measures the stiffness of the nearest-neighbor cage, and its inverse is the compliance of the nearest neighbor environment. Using this order parameter, we demonstrate a direct relation between the structure and dynamics of the systems. With increasing particle density, the average caging potential depth increases, indicating that the structure gets better defined while the correlation between the SOP and particle dynamics also grows. We further apply the SOP to sheared suspensions and find that it reliably predicts the location of shear transformations. The applied shear lowers the caging potential and increases the SOP until shear transformations proliferate and the suspension yields. The plastic rearrangements are then localized to regions where the SOP is maximum. A quantification of these correlations confirms a strong causal relation between the structural order parameter and plastic deformation. The order parameter, therefore, provides a unique structural identifier of plastic regions in amorphous solids analogous to dislocations in crystals.
 |
 |
 |
 |
 |
 |
Caging potential of dense colloidal suspensions
According to the mean-field approximation, we describe each particle as caged by its
neighbours, where the caging potential is calculated, assuming that while the particle is undergoing short-time dynamics, the background is frozen [33, 34, 35]. Using the Ramakrishnan-Yussouff free energy functional [37, 38, 39], we define the mean-field caging
potential [34, 33, 35] felt by the particle due to the frozen background which now depends on the structure of the liquid. The details of the calculation of the mean field caging potential are described in earlier works[34] and a brief outline is presented in
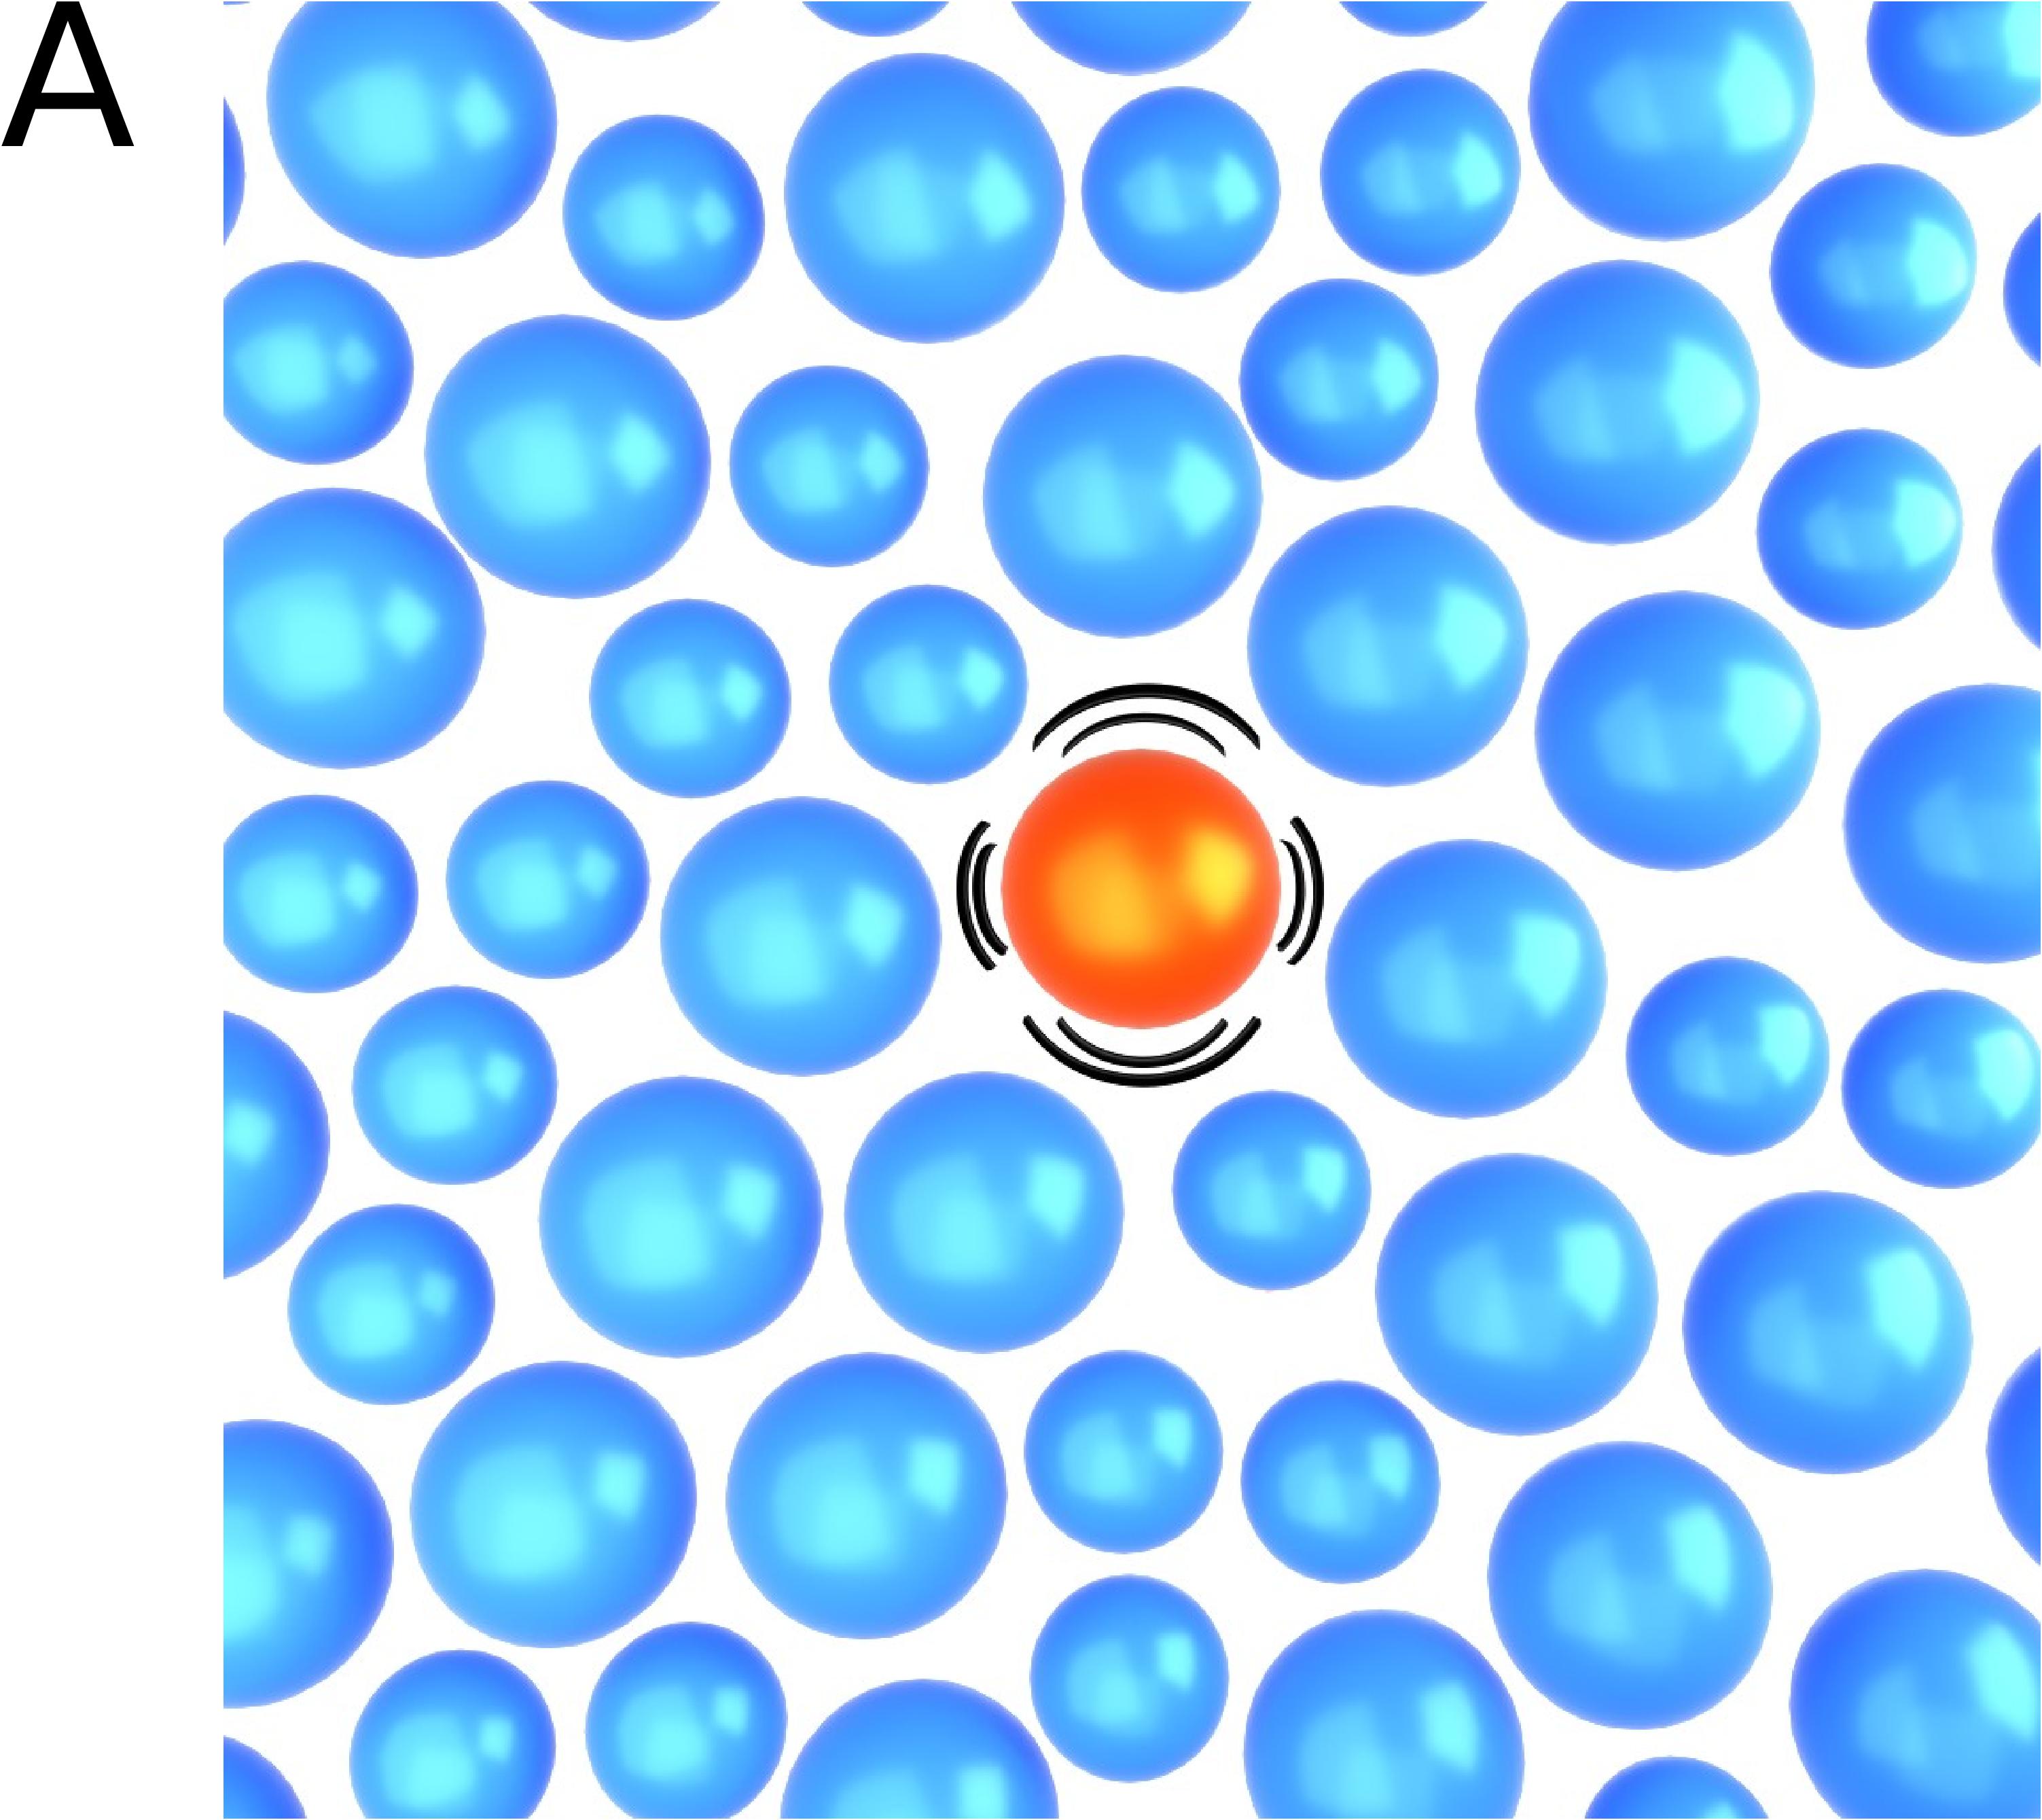
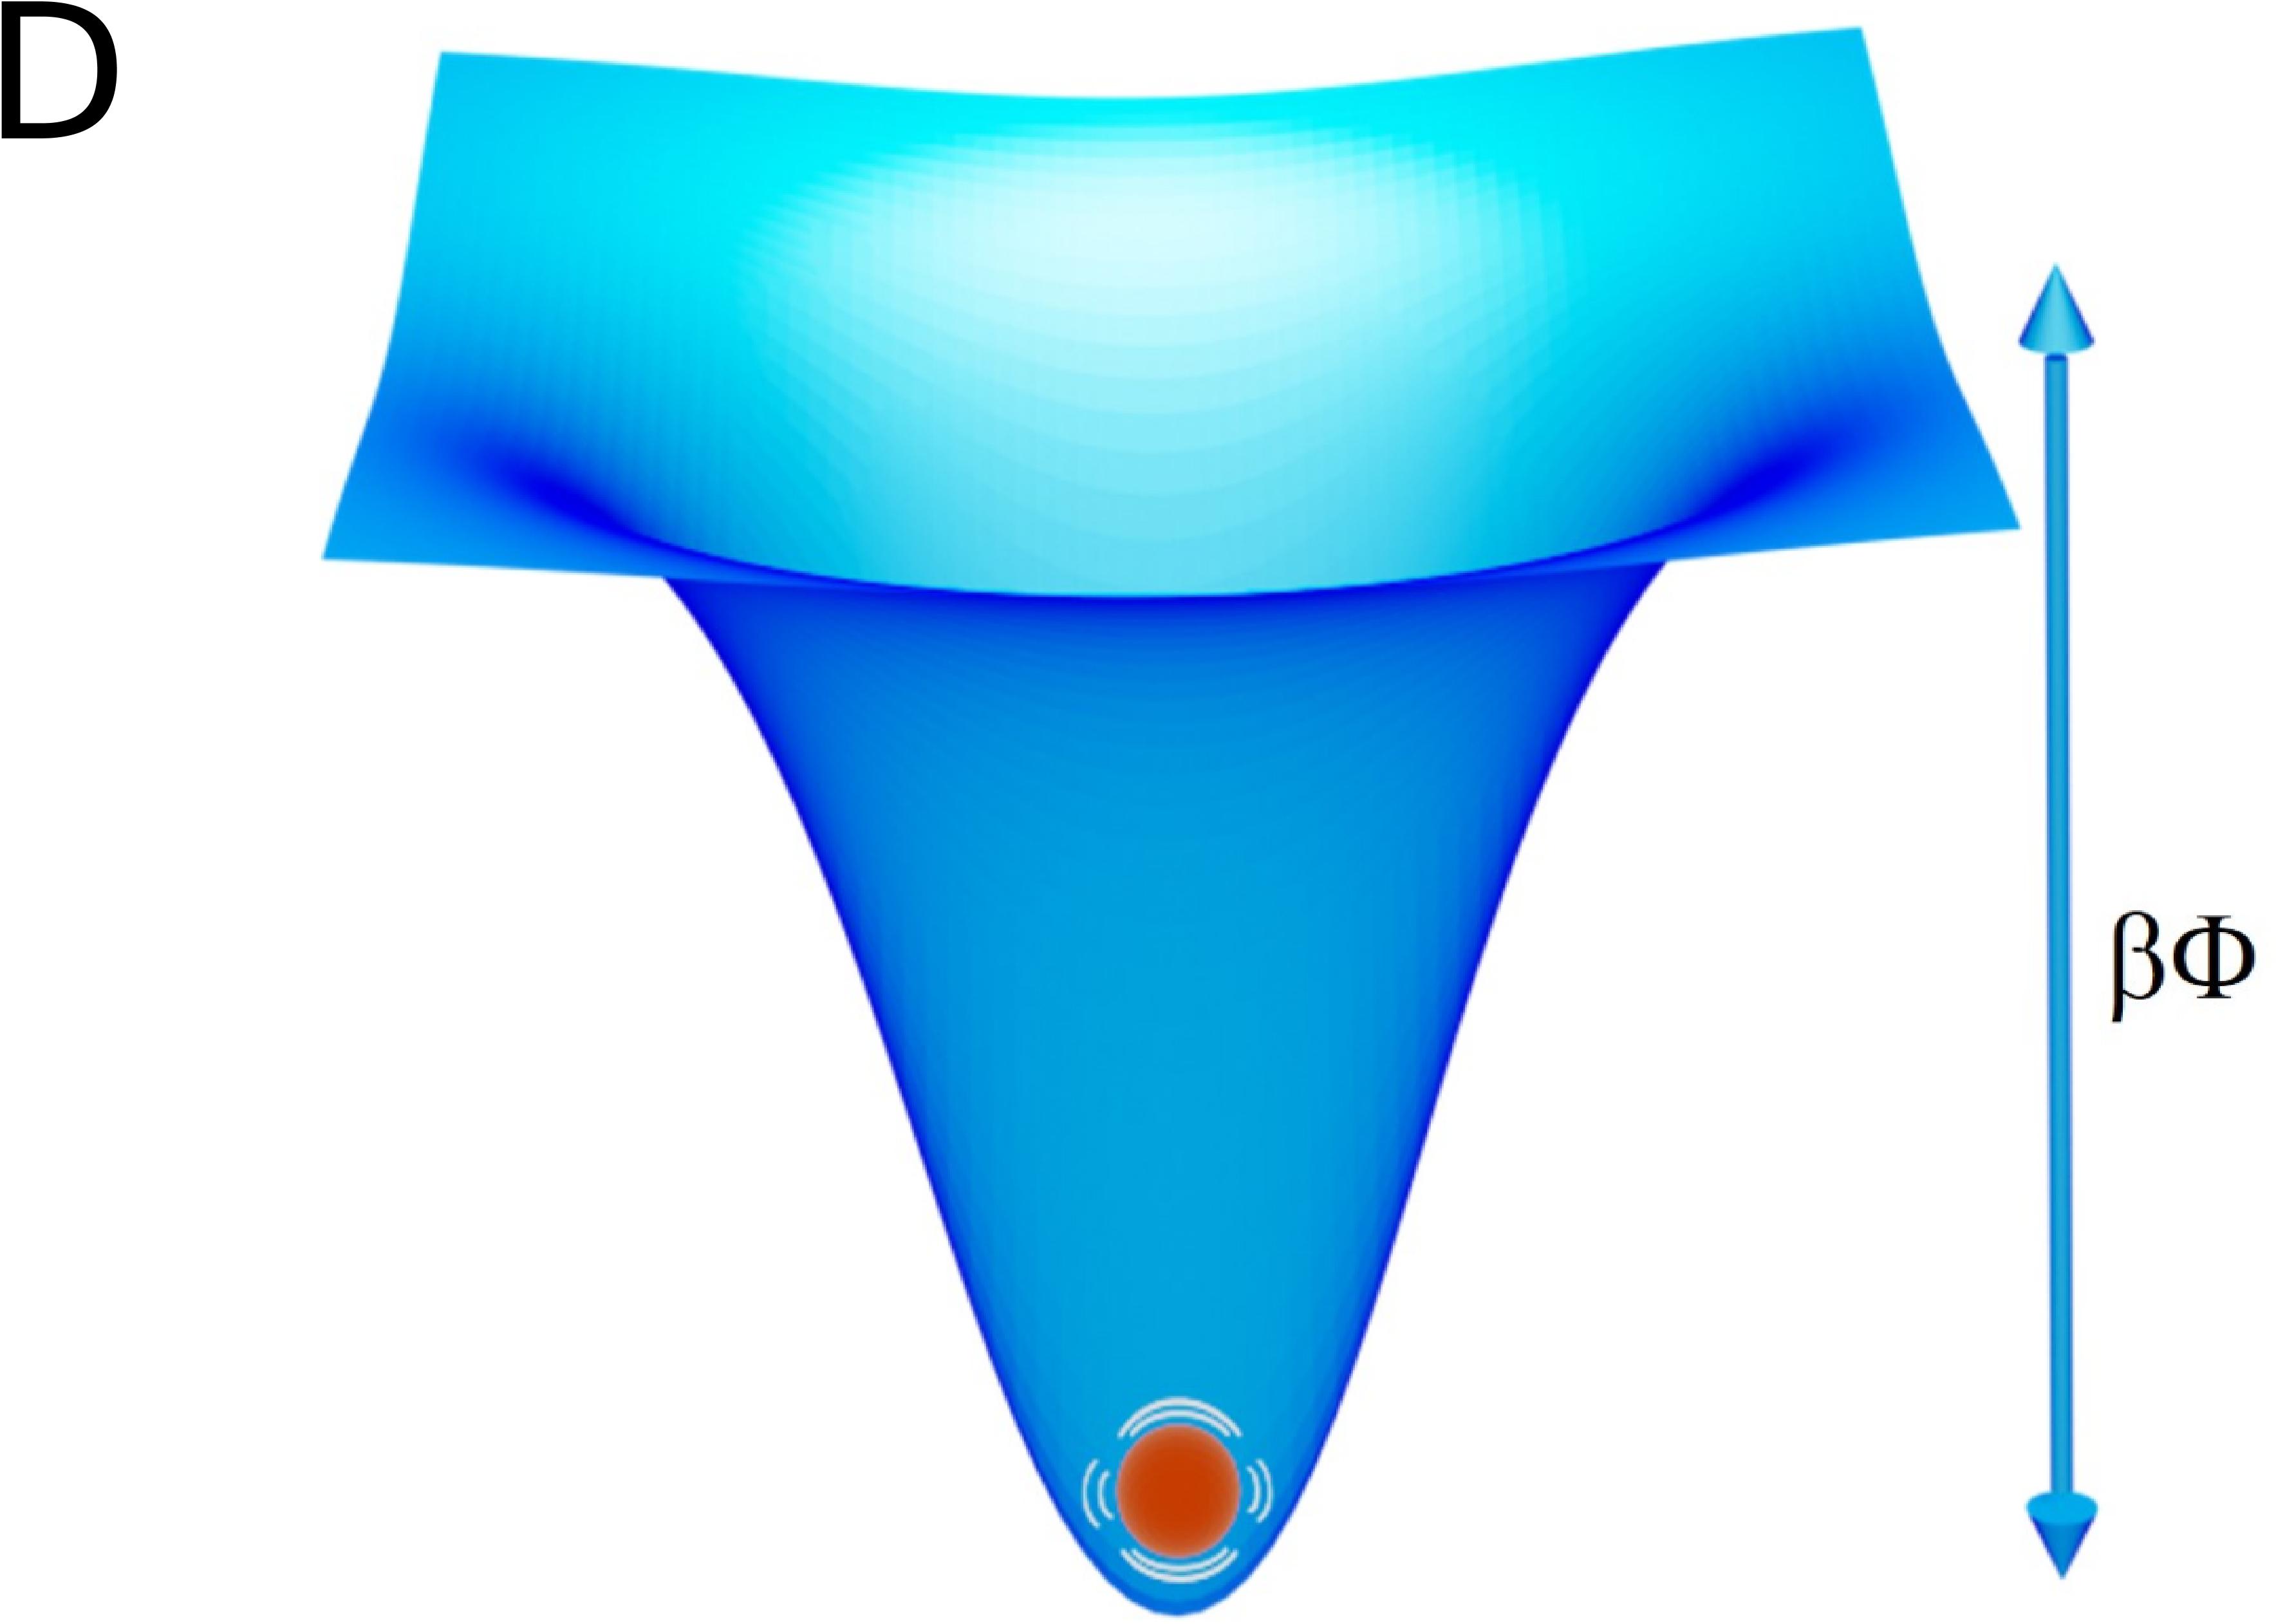
the supporting information. Figure 1A shows the tagged particle in the frozen background, and in Fig. 1D, we draw a cartoon of the
potential experienced by the particle. The form of the potential obtained in our experiments is shown in Fig.S1B in the supporting information. In our study, the inverse of the depth of the mean field caging potential is our structural order parameter (SOP).
The absolute value of the depth of the caging potential felt by a particle in a system is given by [35],
| (1) |
where is the density, is the particle level radial distribution function (RDF). is the direct correlation function which, via the hypernetted chain approximation [40], is expressed in terms of the RDF as . Although the depth of the potential is derived from microscopic density functional theory, we can also arrive at this expression just intuitively. The RDF provides information on the local arrangement of the particles around a tagged particle, and the direct correlation function is the effective short-range interaction potential between the tagged particle and its neighbours. Thus, the product of the two functions provides us with information on the caging potential the tagged particle feels due to its neighbours. For a more structured environment, the potential will be deeper, and for a less structured environment, the potential will be shallower. We exploit this relation between the local structure and the local depth of the potential to define the structural order parameter on a particle level , which provides a measure of the local stiffness
based on its immediate neighborhood.
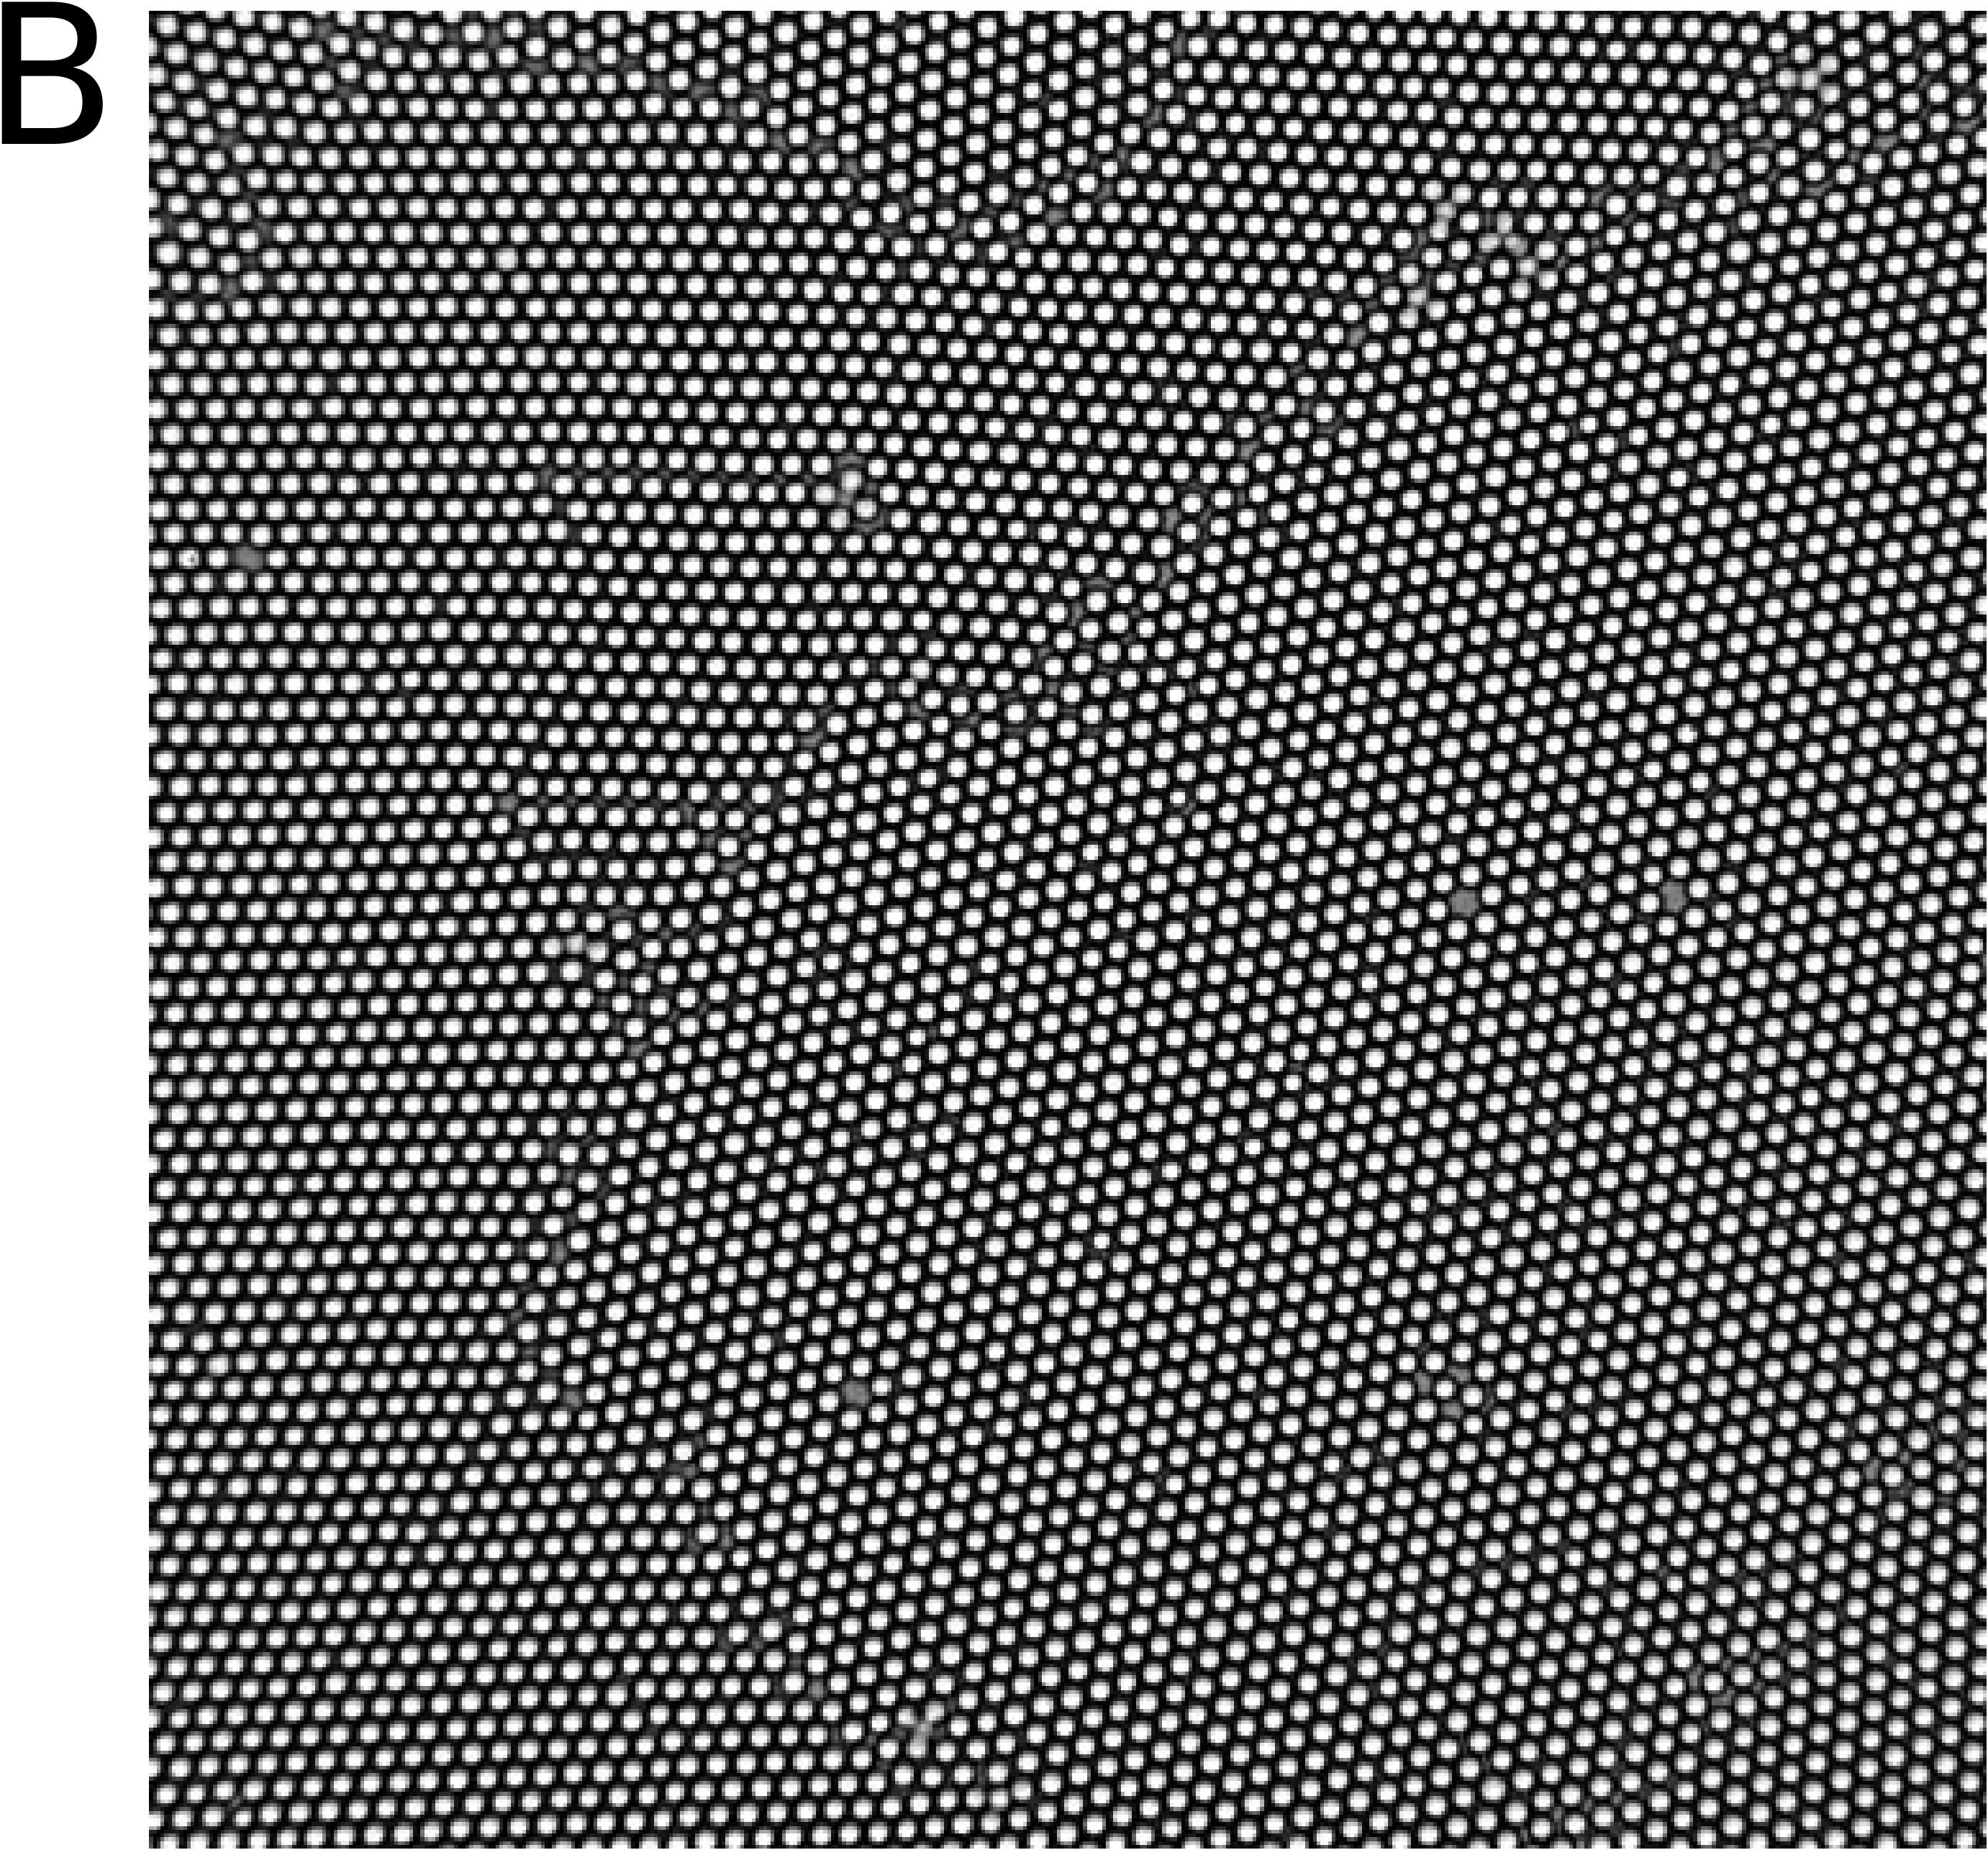
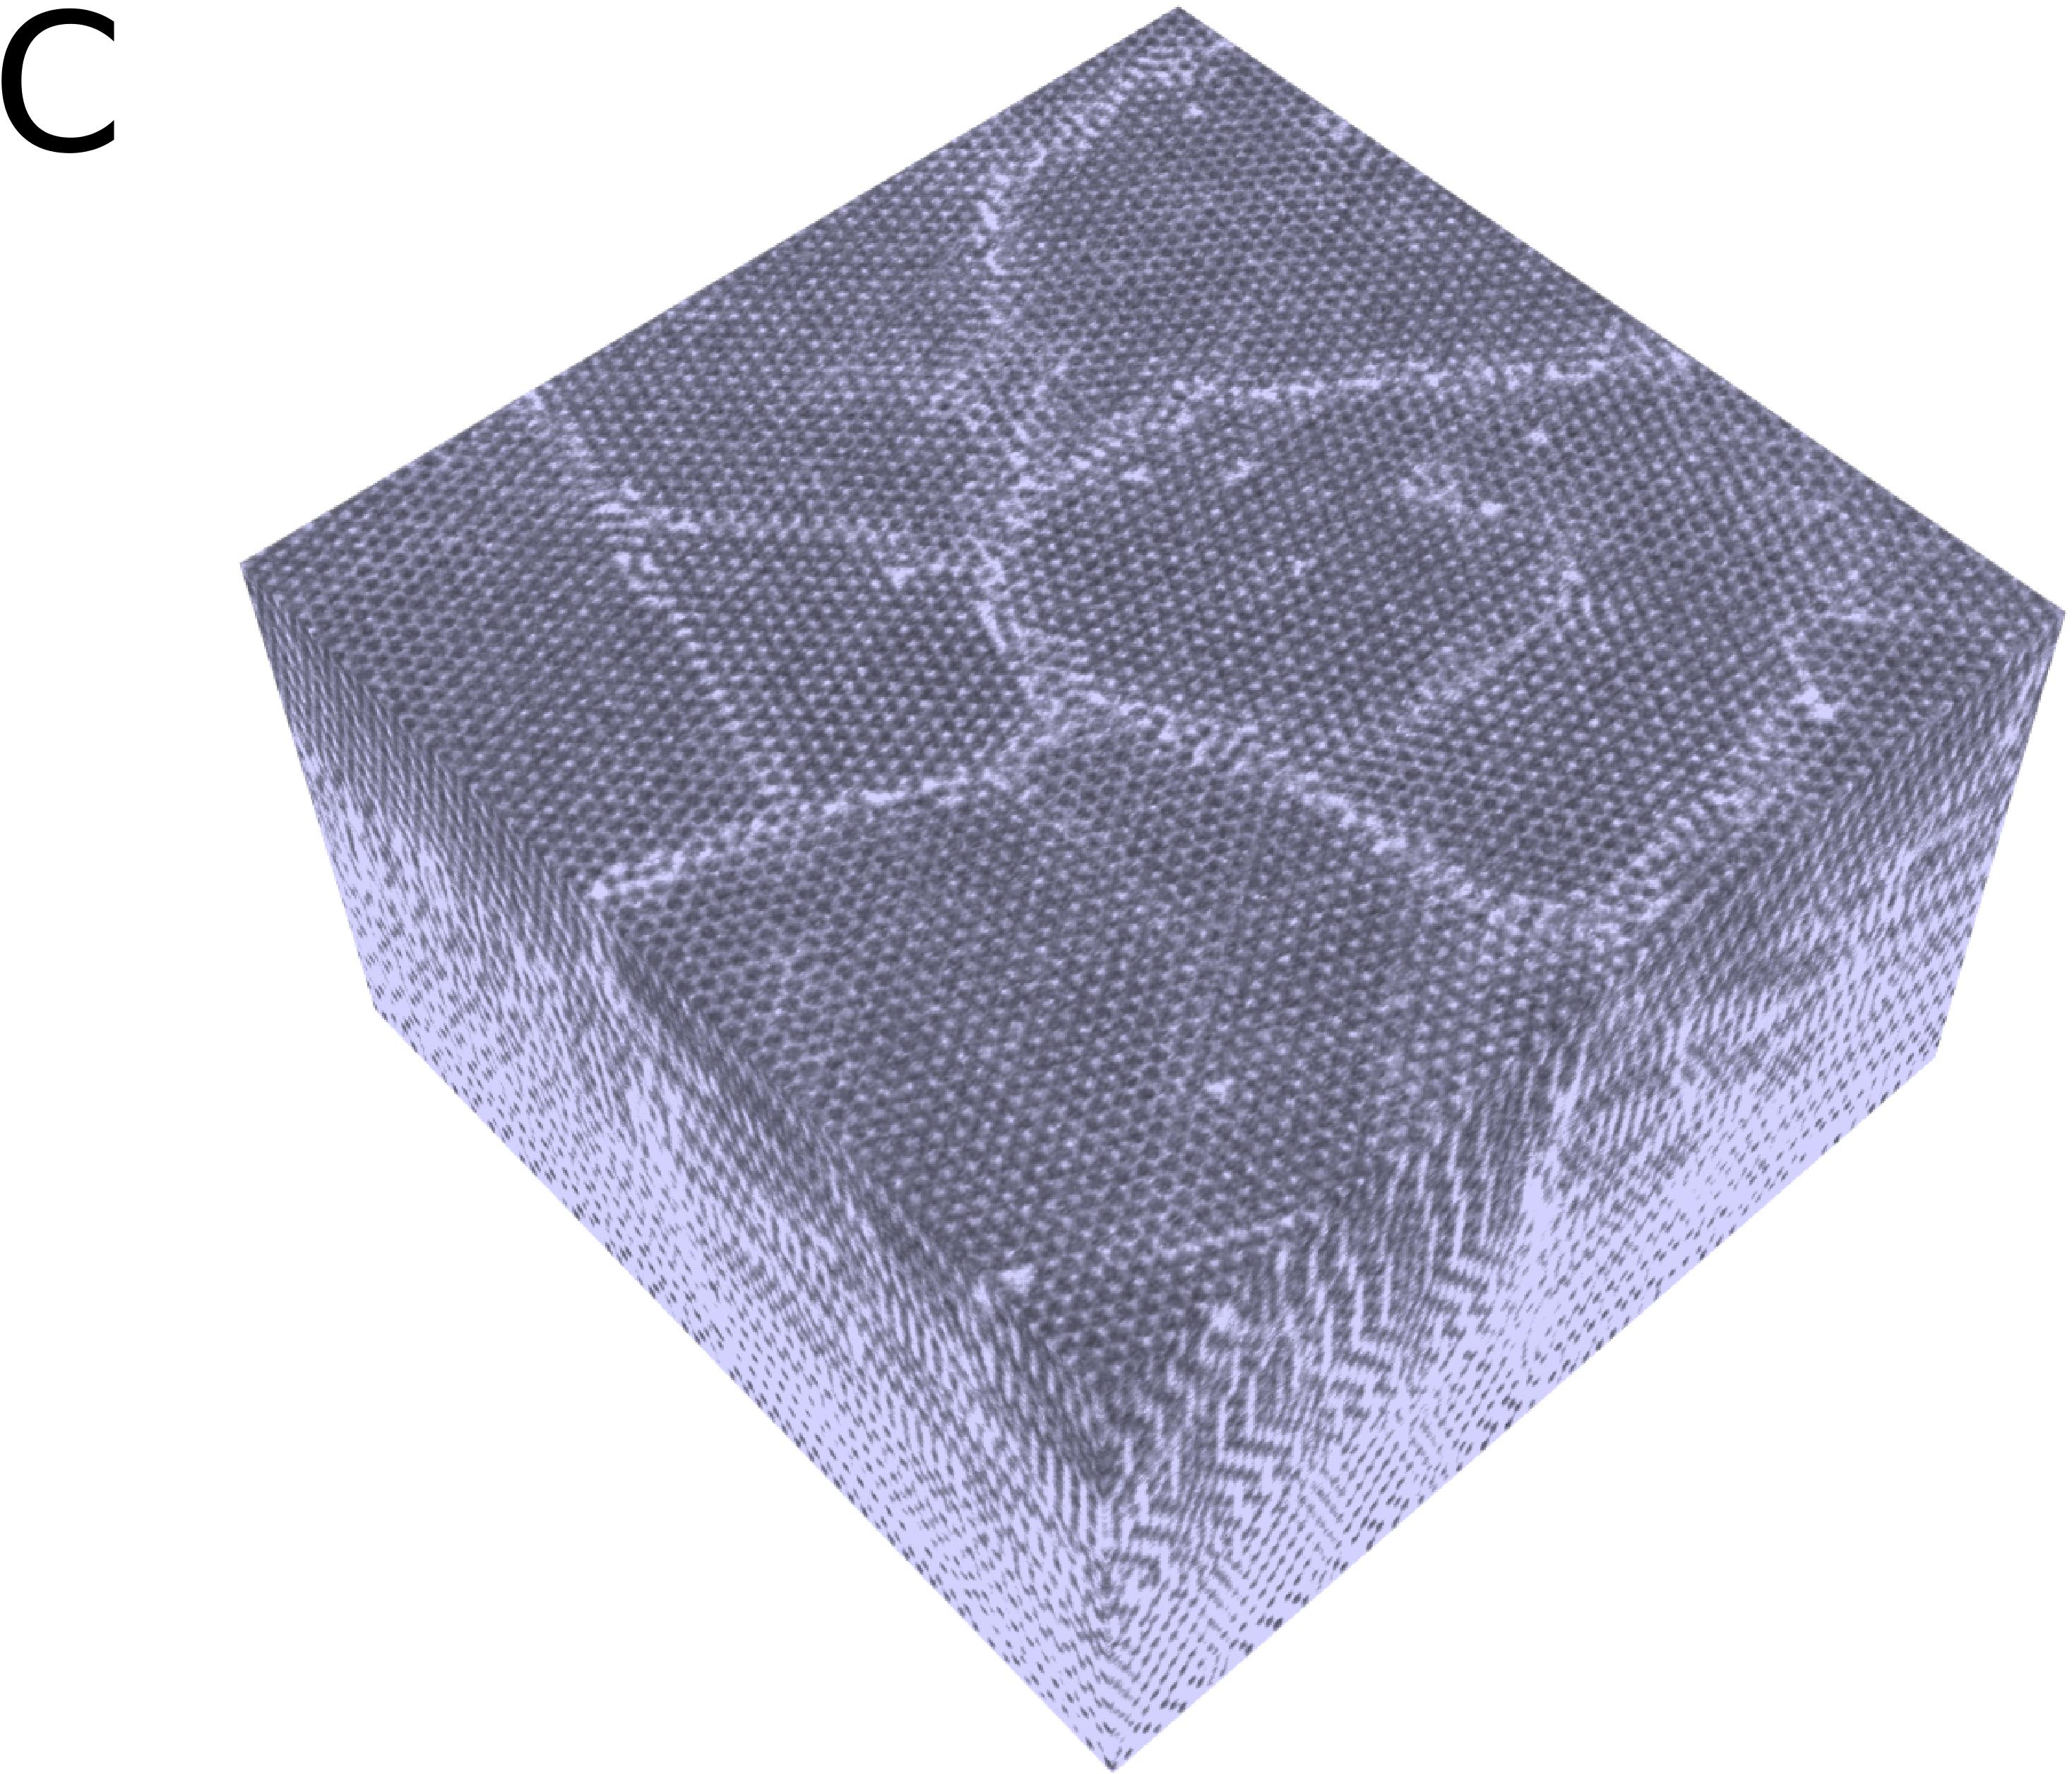
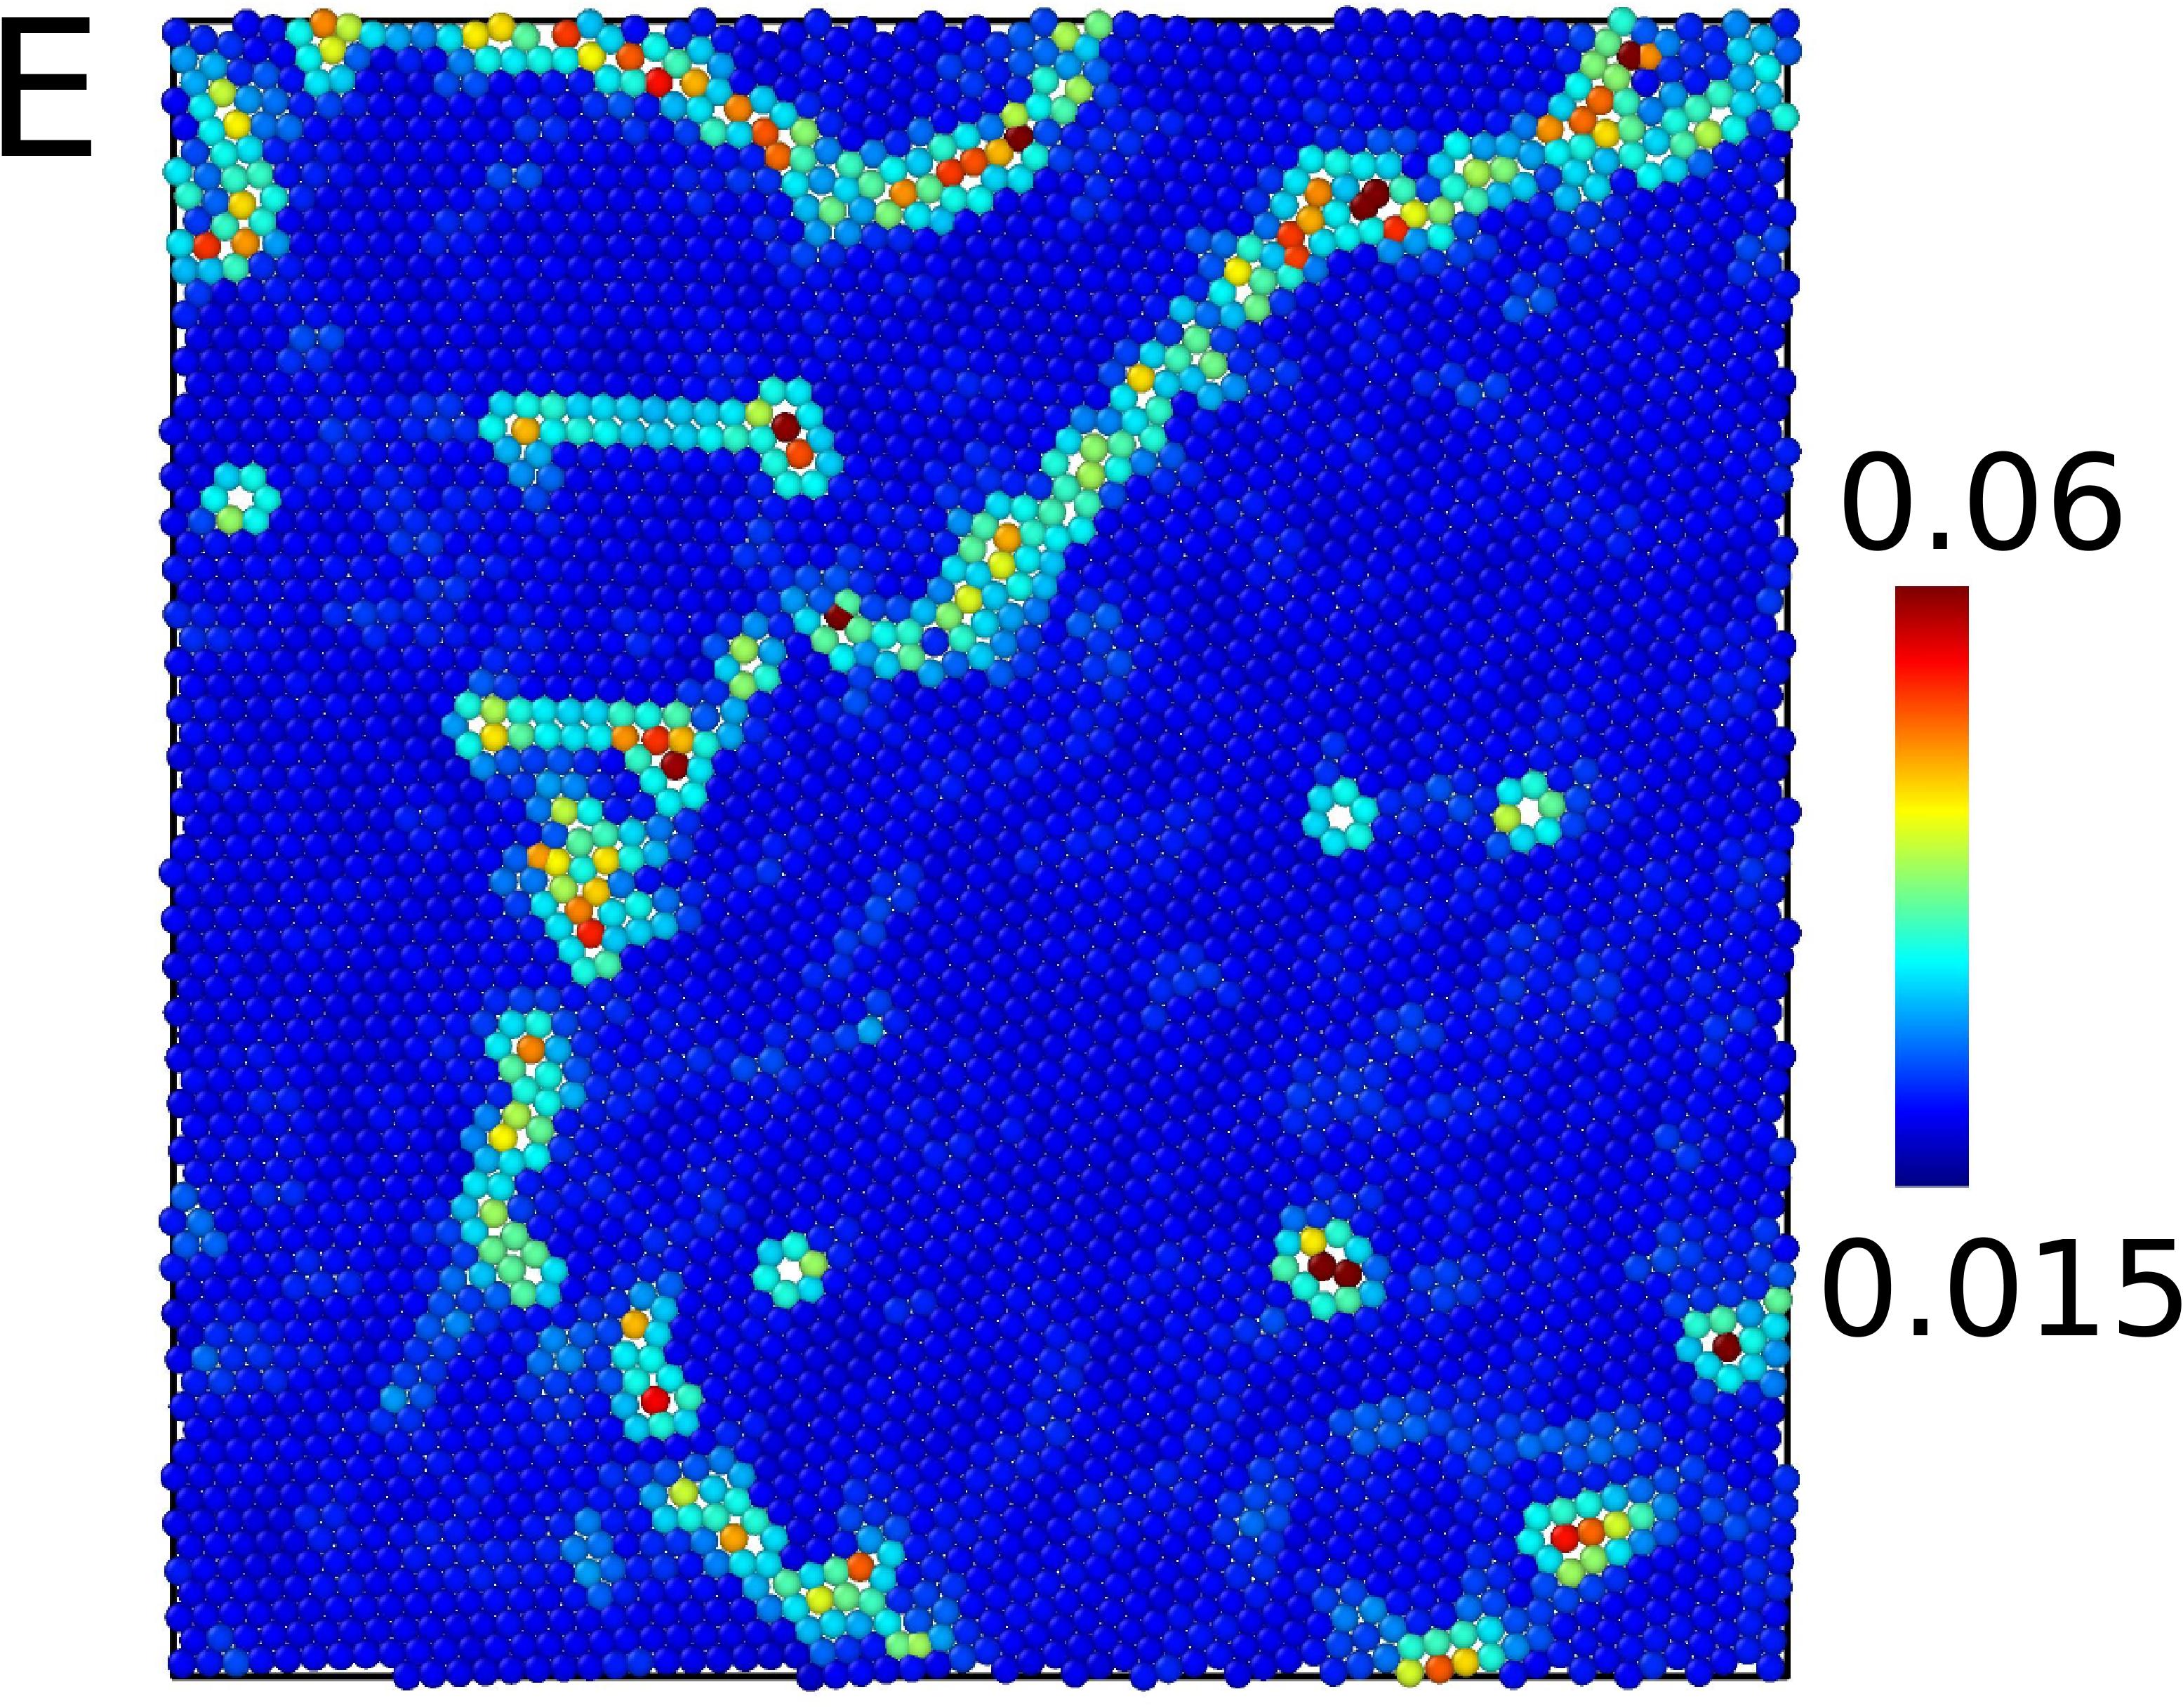
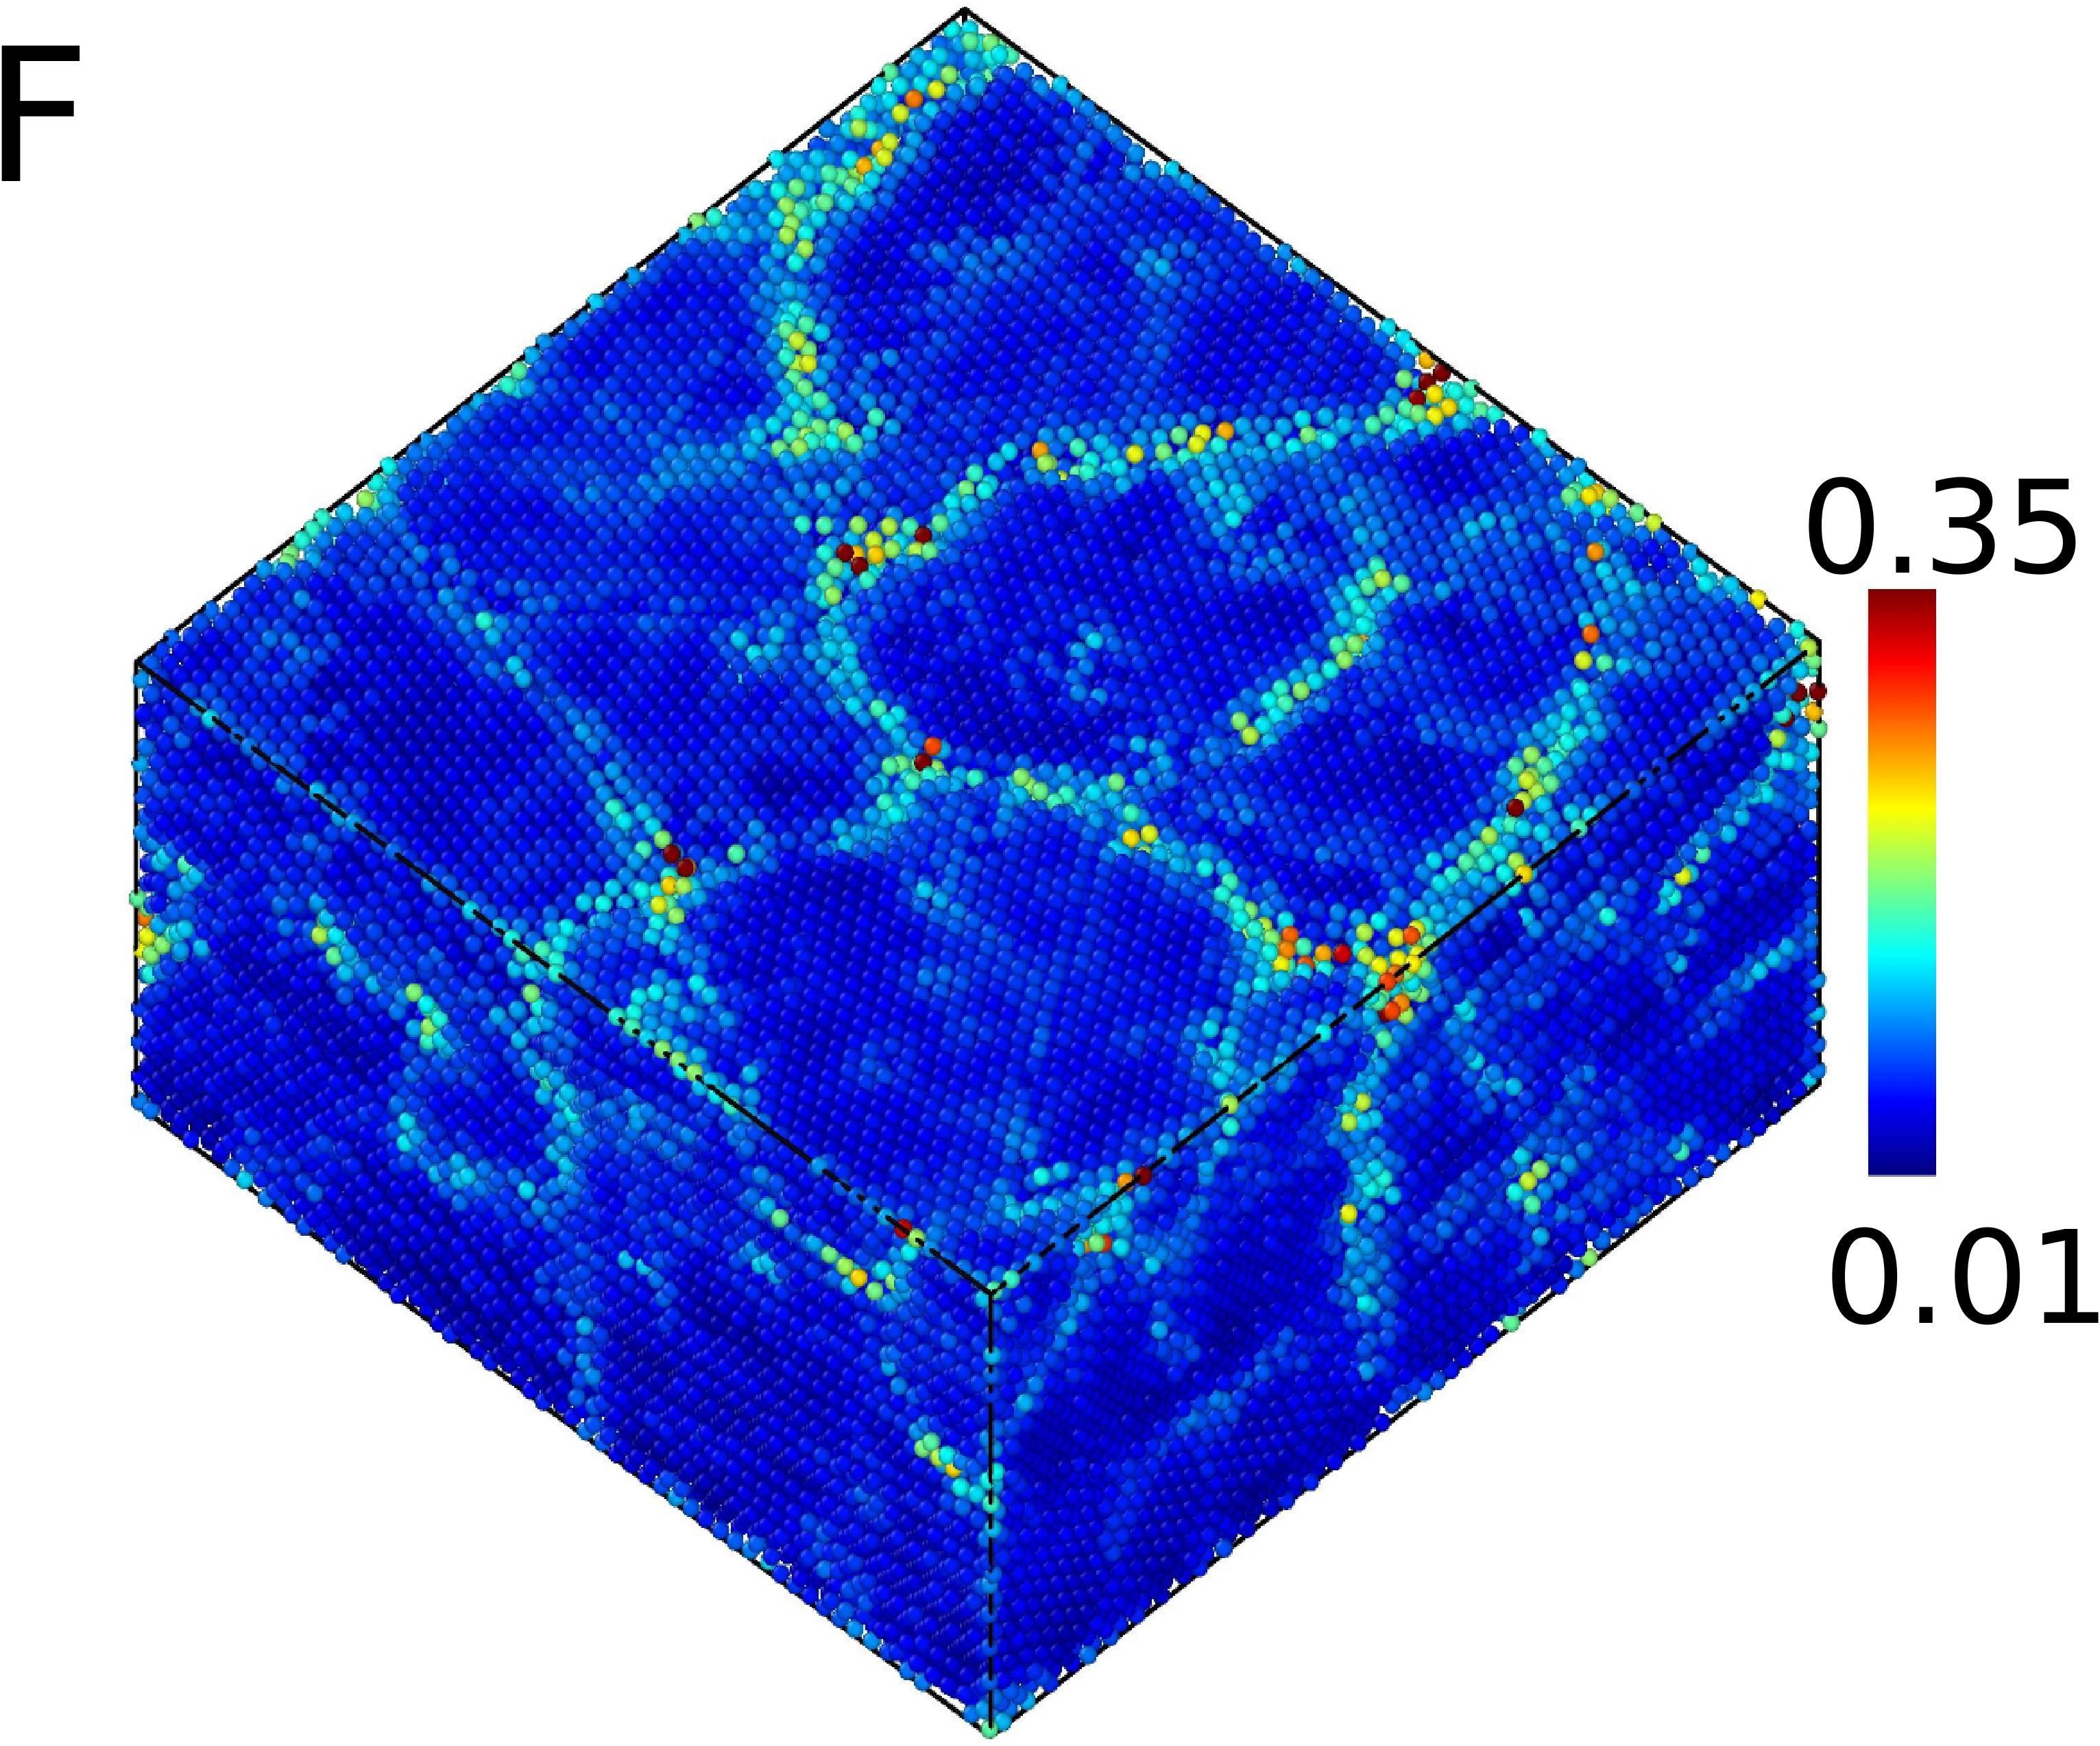
As a proof of concept, we first apply this order parameter to colloidal crystals. The Figs.1B and 1C display bright field image of a 2D colloidal crystal and a confocal image of a 3D colloidal crystal, respectively, made of silica beads. The size of the particles in 2D crystals is and it is in 3D crystals. The area fraction in 2D is , and the volume fraction in 3D is , see Materials and Methods for details. We compute the SOP of the particles based on the structure of the local neighborhood using Eq.1. The results are shown in Figs.1E and 1F, where the particles are colour coded based on their local structural order parameter. It is evident from these results that our order parameter can beautifully identify the grain boundaries in 2D and 3D crystals. It can also identify the line and point defects in the 2D crystal. Note that our order parameter is purely structural in nature, and we do not need any input from the dynamics of the system to describe the order parameter. Next, we apply this order parameter to identify structural heterogeneity in disordered bidisperse colloidal suspensions at different densities. The expression of the SOP for the binary system is given in the materials and methods section.
 |
 |
 |
 |
 |
 |
Structural relaxation in a colloidal monolayer suspensions
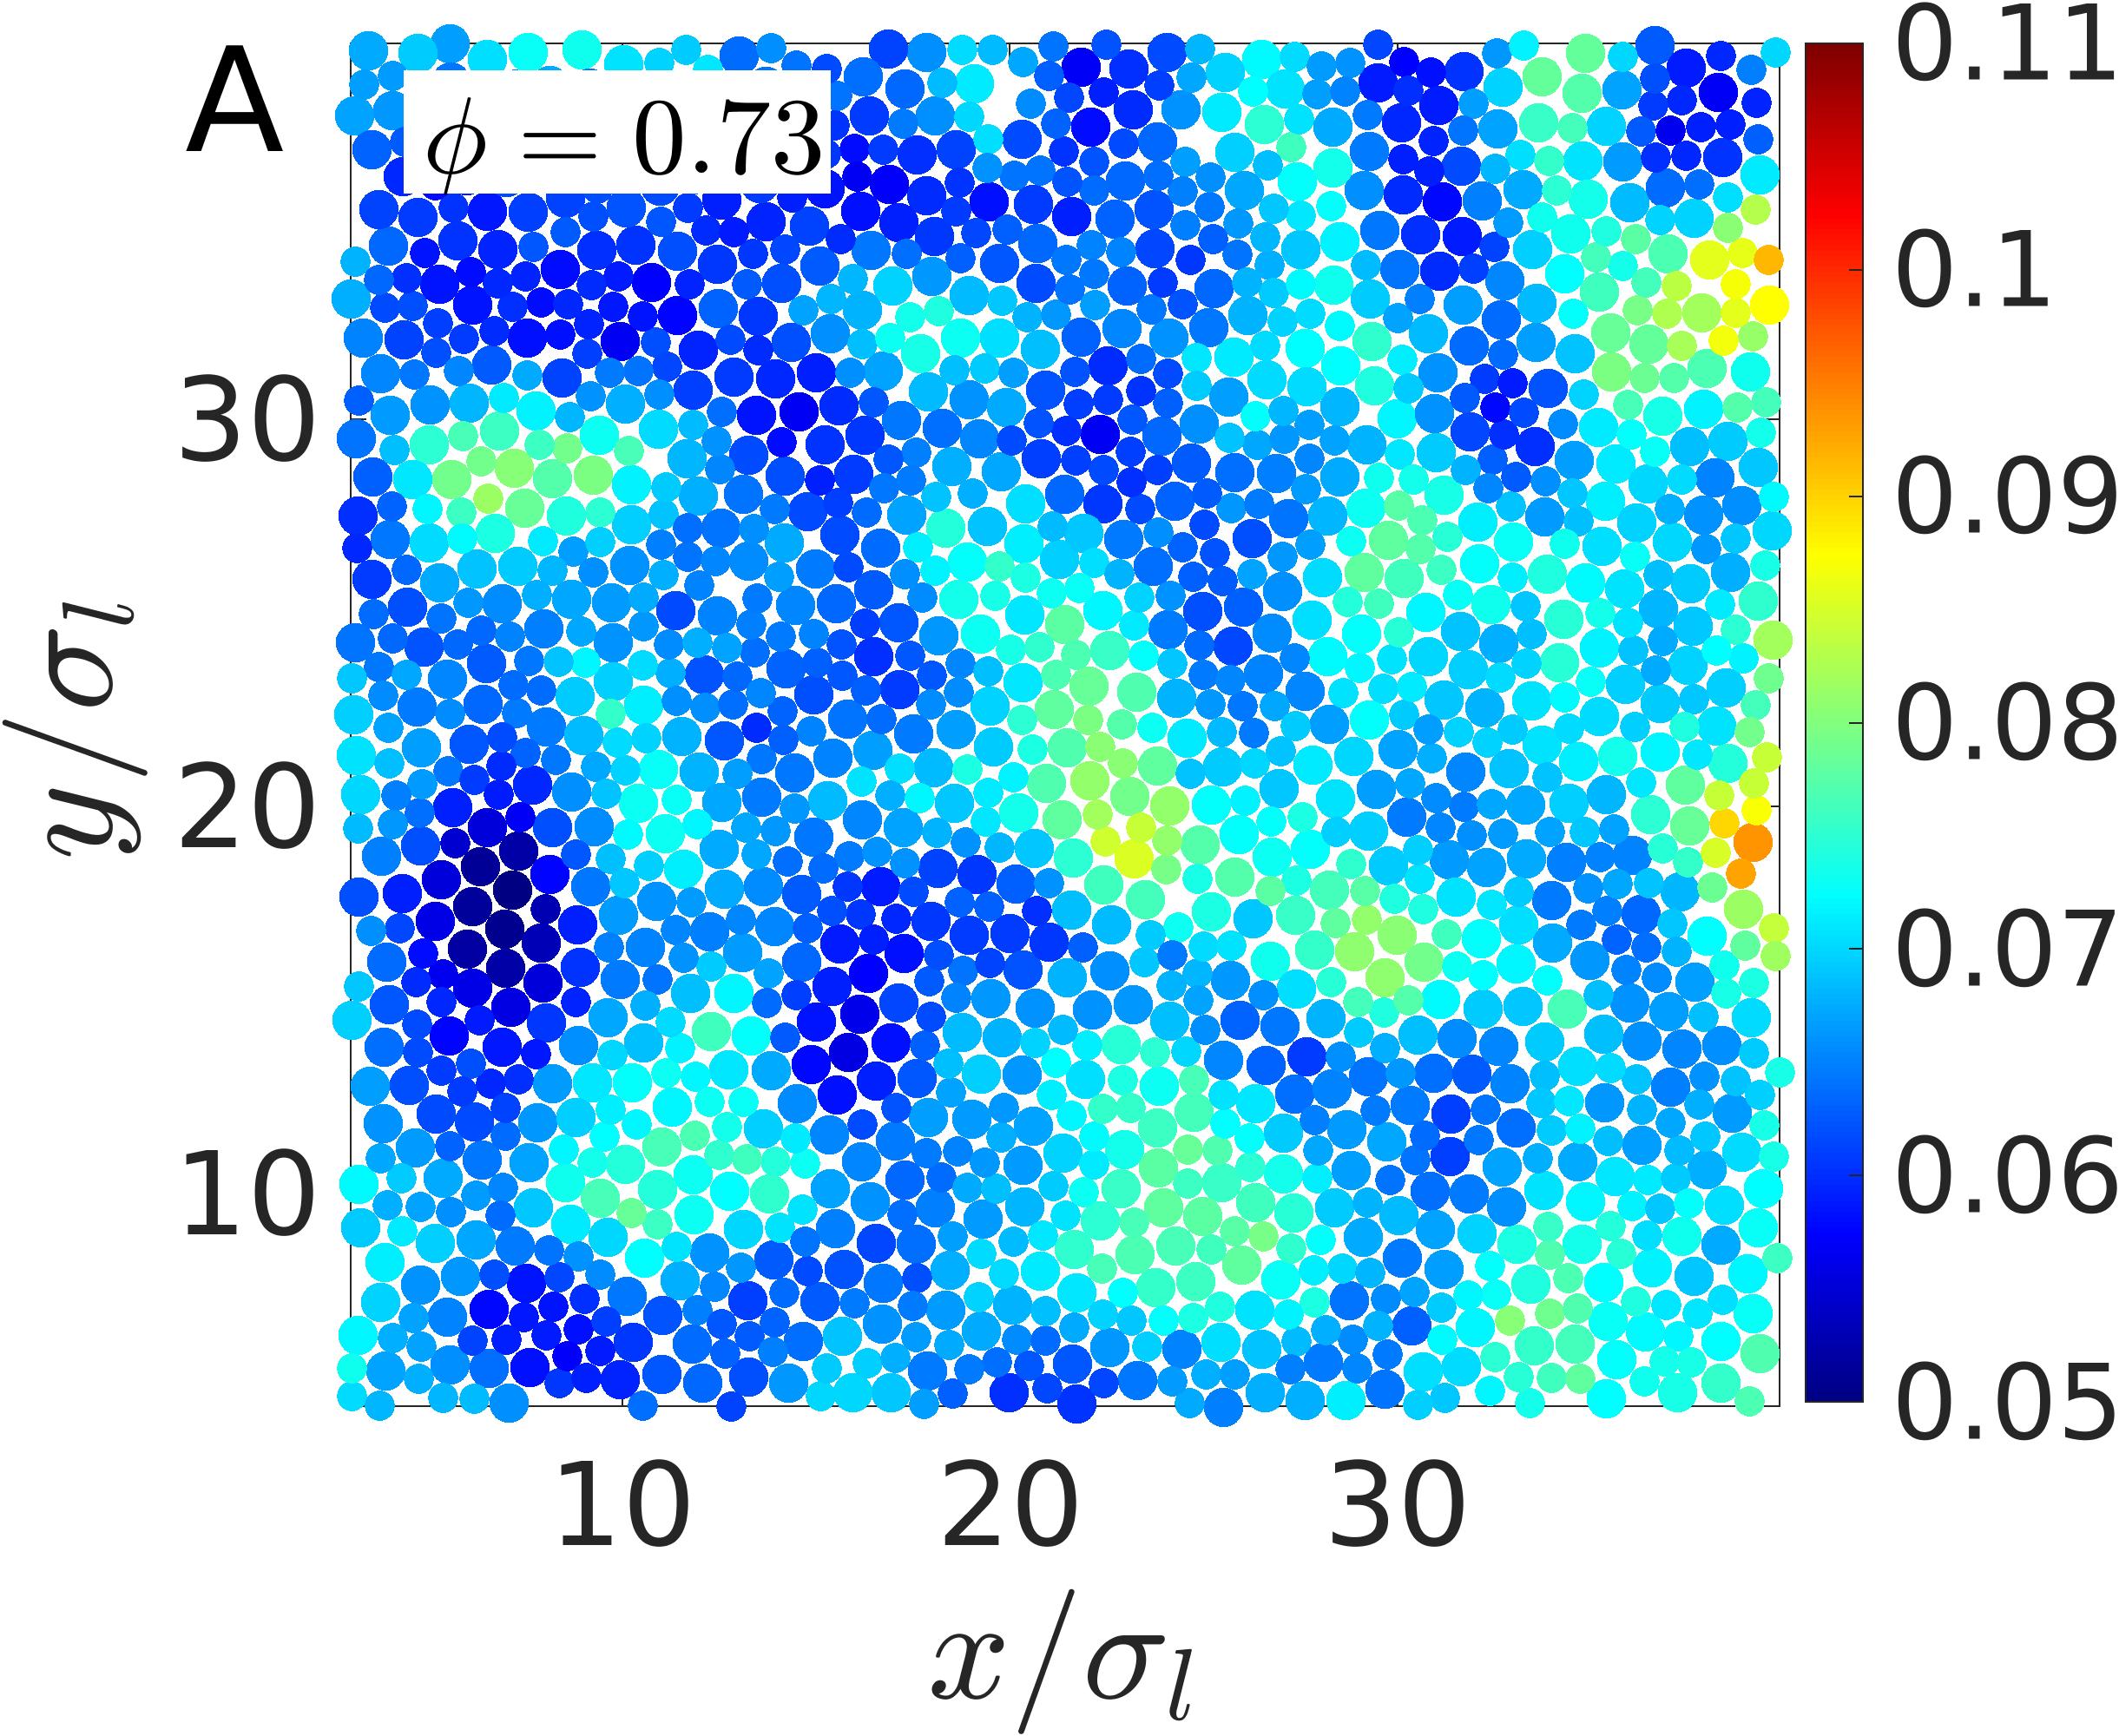
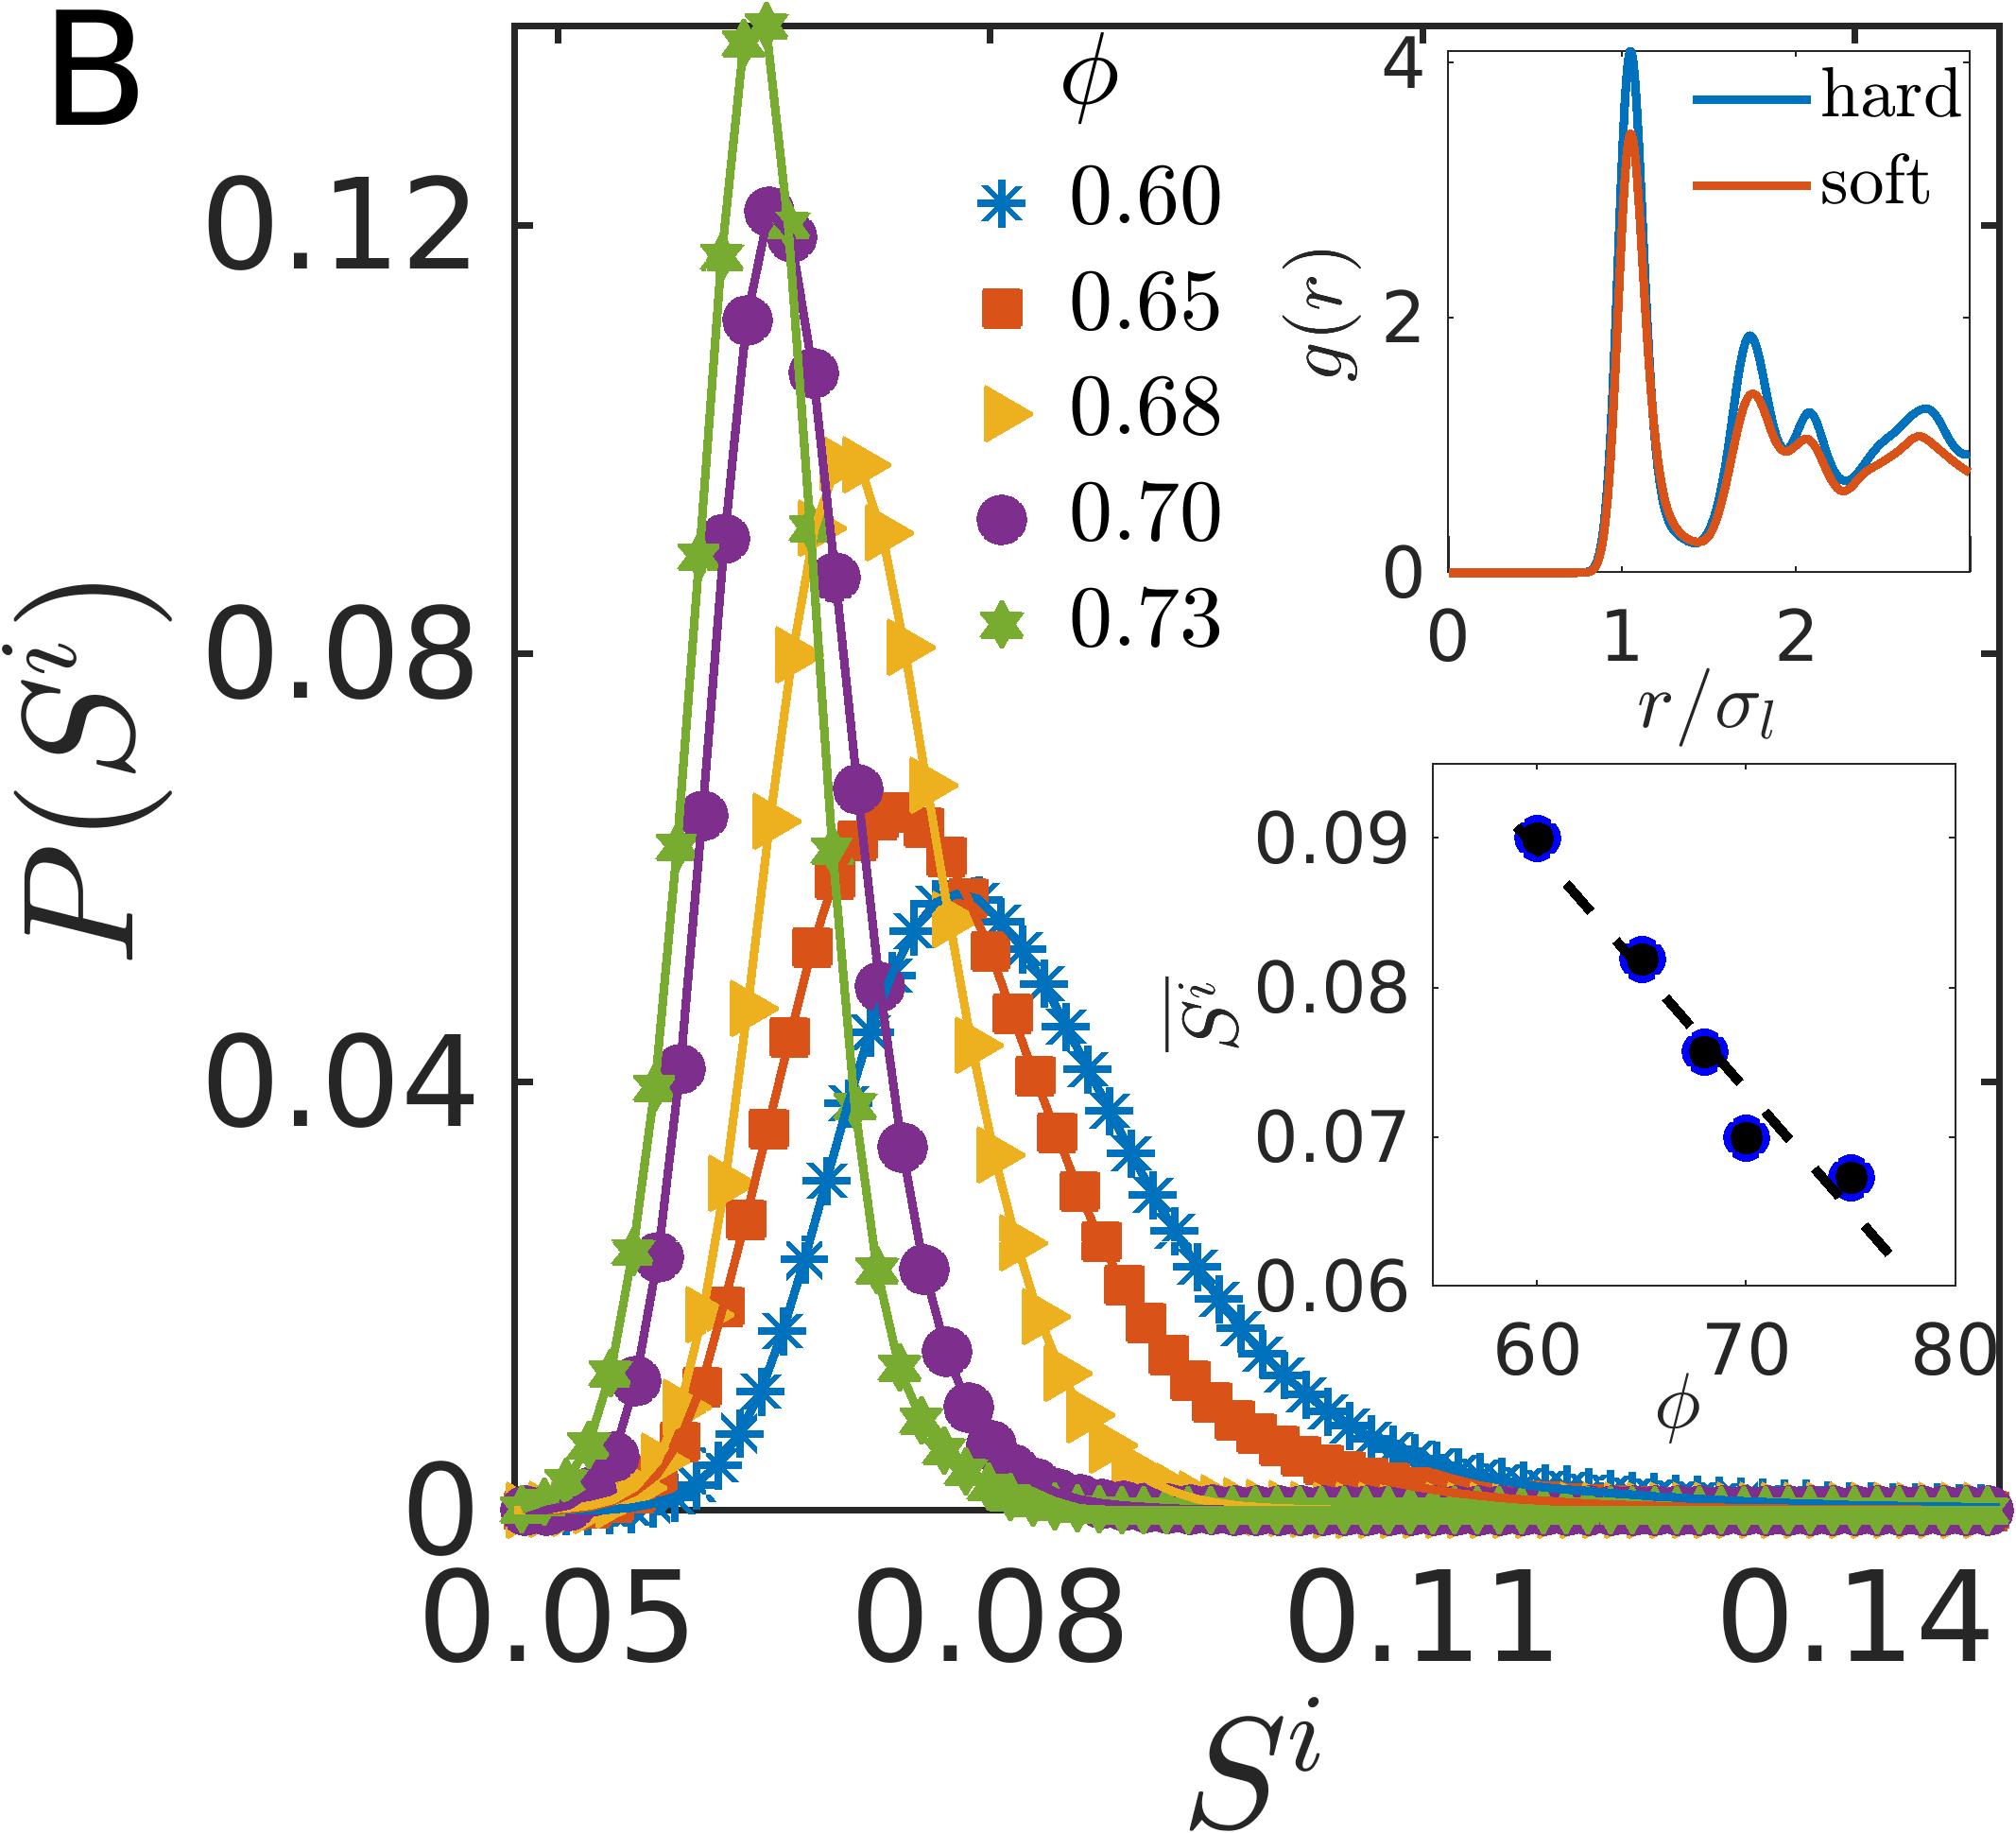
In this section, we analyze structural relaxation of 2D binary colloidal suspensions. A reconstruction of the colloidal particles at , with particles color-coded according to their structural order parameter, is depicted in Fig. 2A. Note the SOP of particles are coarse-grained; see section in the supporting information. The image offers a direct visualization of the structural heterogeneity within the amorphous system, where soft and hard regions extend over several particles. To gain a quantitative understanding, we plot the distributions of the order parameter for different particle densities in Fig. 2B. The distribution shifts to the left with increasing density, indicating that the local particle environments become harder. This is also apparent from the bottom inset, where the average SOP, , is observed to decrease, implying an increase in the depth of the caging potential with increasing density . Along with the hardening of structure, there is a simultaneous increase in the relaxation time of the system (see Fig.S1C in supporting information), which suggests that the system needs a longer time to relax with increasing depth of the caging potential.
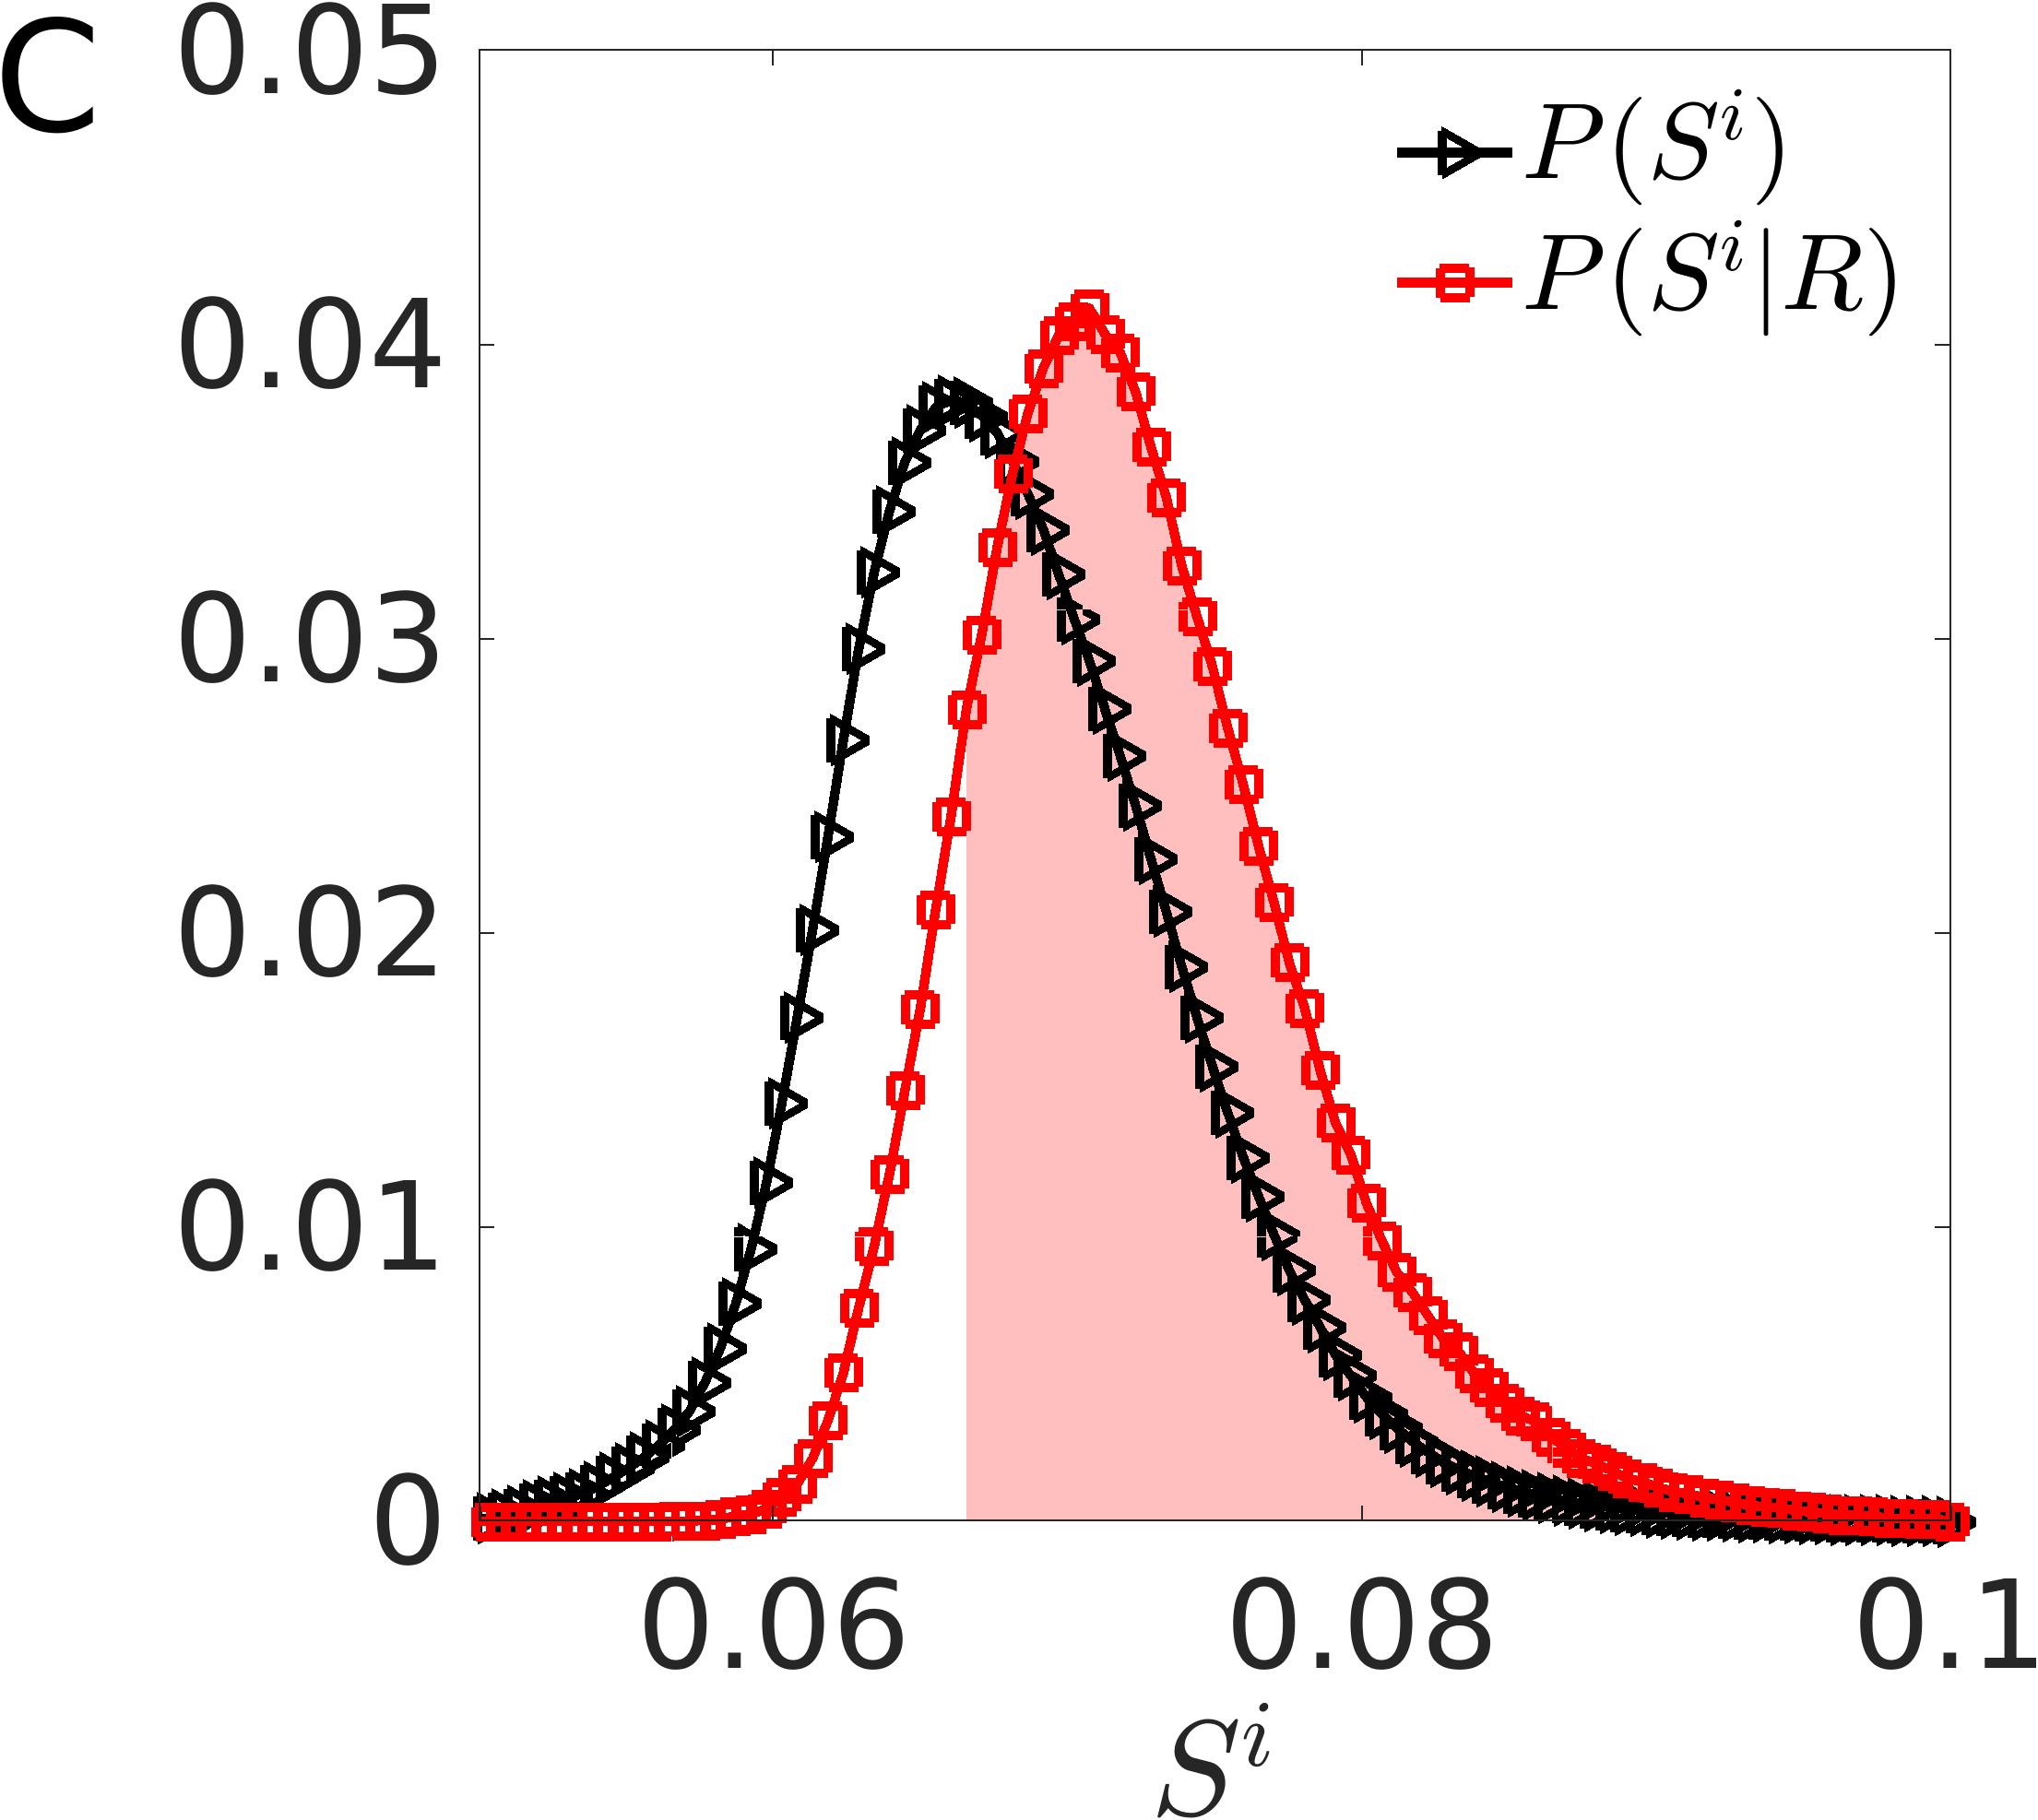
We can now utilize the order parameter to identify structural hallmarks of hard and soft environments. Hard environments encompass particles with less than the mean of the distribution, while soft environments encompass particles with greater than the mean. A comparison of the pair correlations (RDF) for these two sub-populations is depicted in the upper inset of Fig. 2B. Notably, the first peak of is more pronounced for hard particles, and a similar effect is observed for other higher-order peaks. Therefore, hard particles have a more structured neighborhood than soft particles. The SOP effectively identifies these distinct structural environments. Figure 2C shows the distribution of SOP of all particles (triangles) and the rearranging particles (squares). The rearranging particles are identified from their cage relative displacement with respect to a reference configuration, calculated over a time scale corresponding to the transition from sub-diffusive to diffusive motion of particles (see Materials and Methods for details). The for the rearranging particles is shifted to the right, indicating they are associated with a softer neighborhood. The shaded area in Fig.2C represents the fraction of rearranging particles whose SOP is larger than the average SOP of all particles, which is nearly ninety percent. Thus establishing that rearranging particles are indeed associated with a larger SOP.
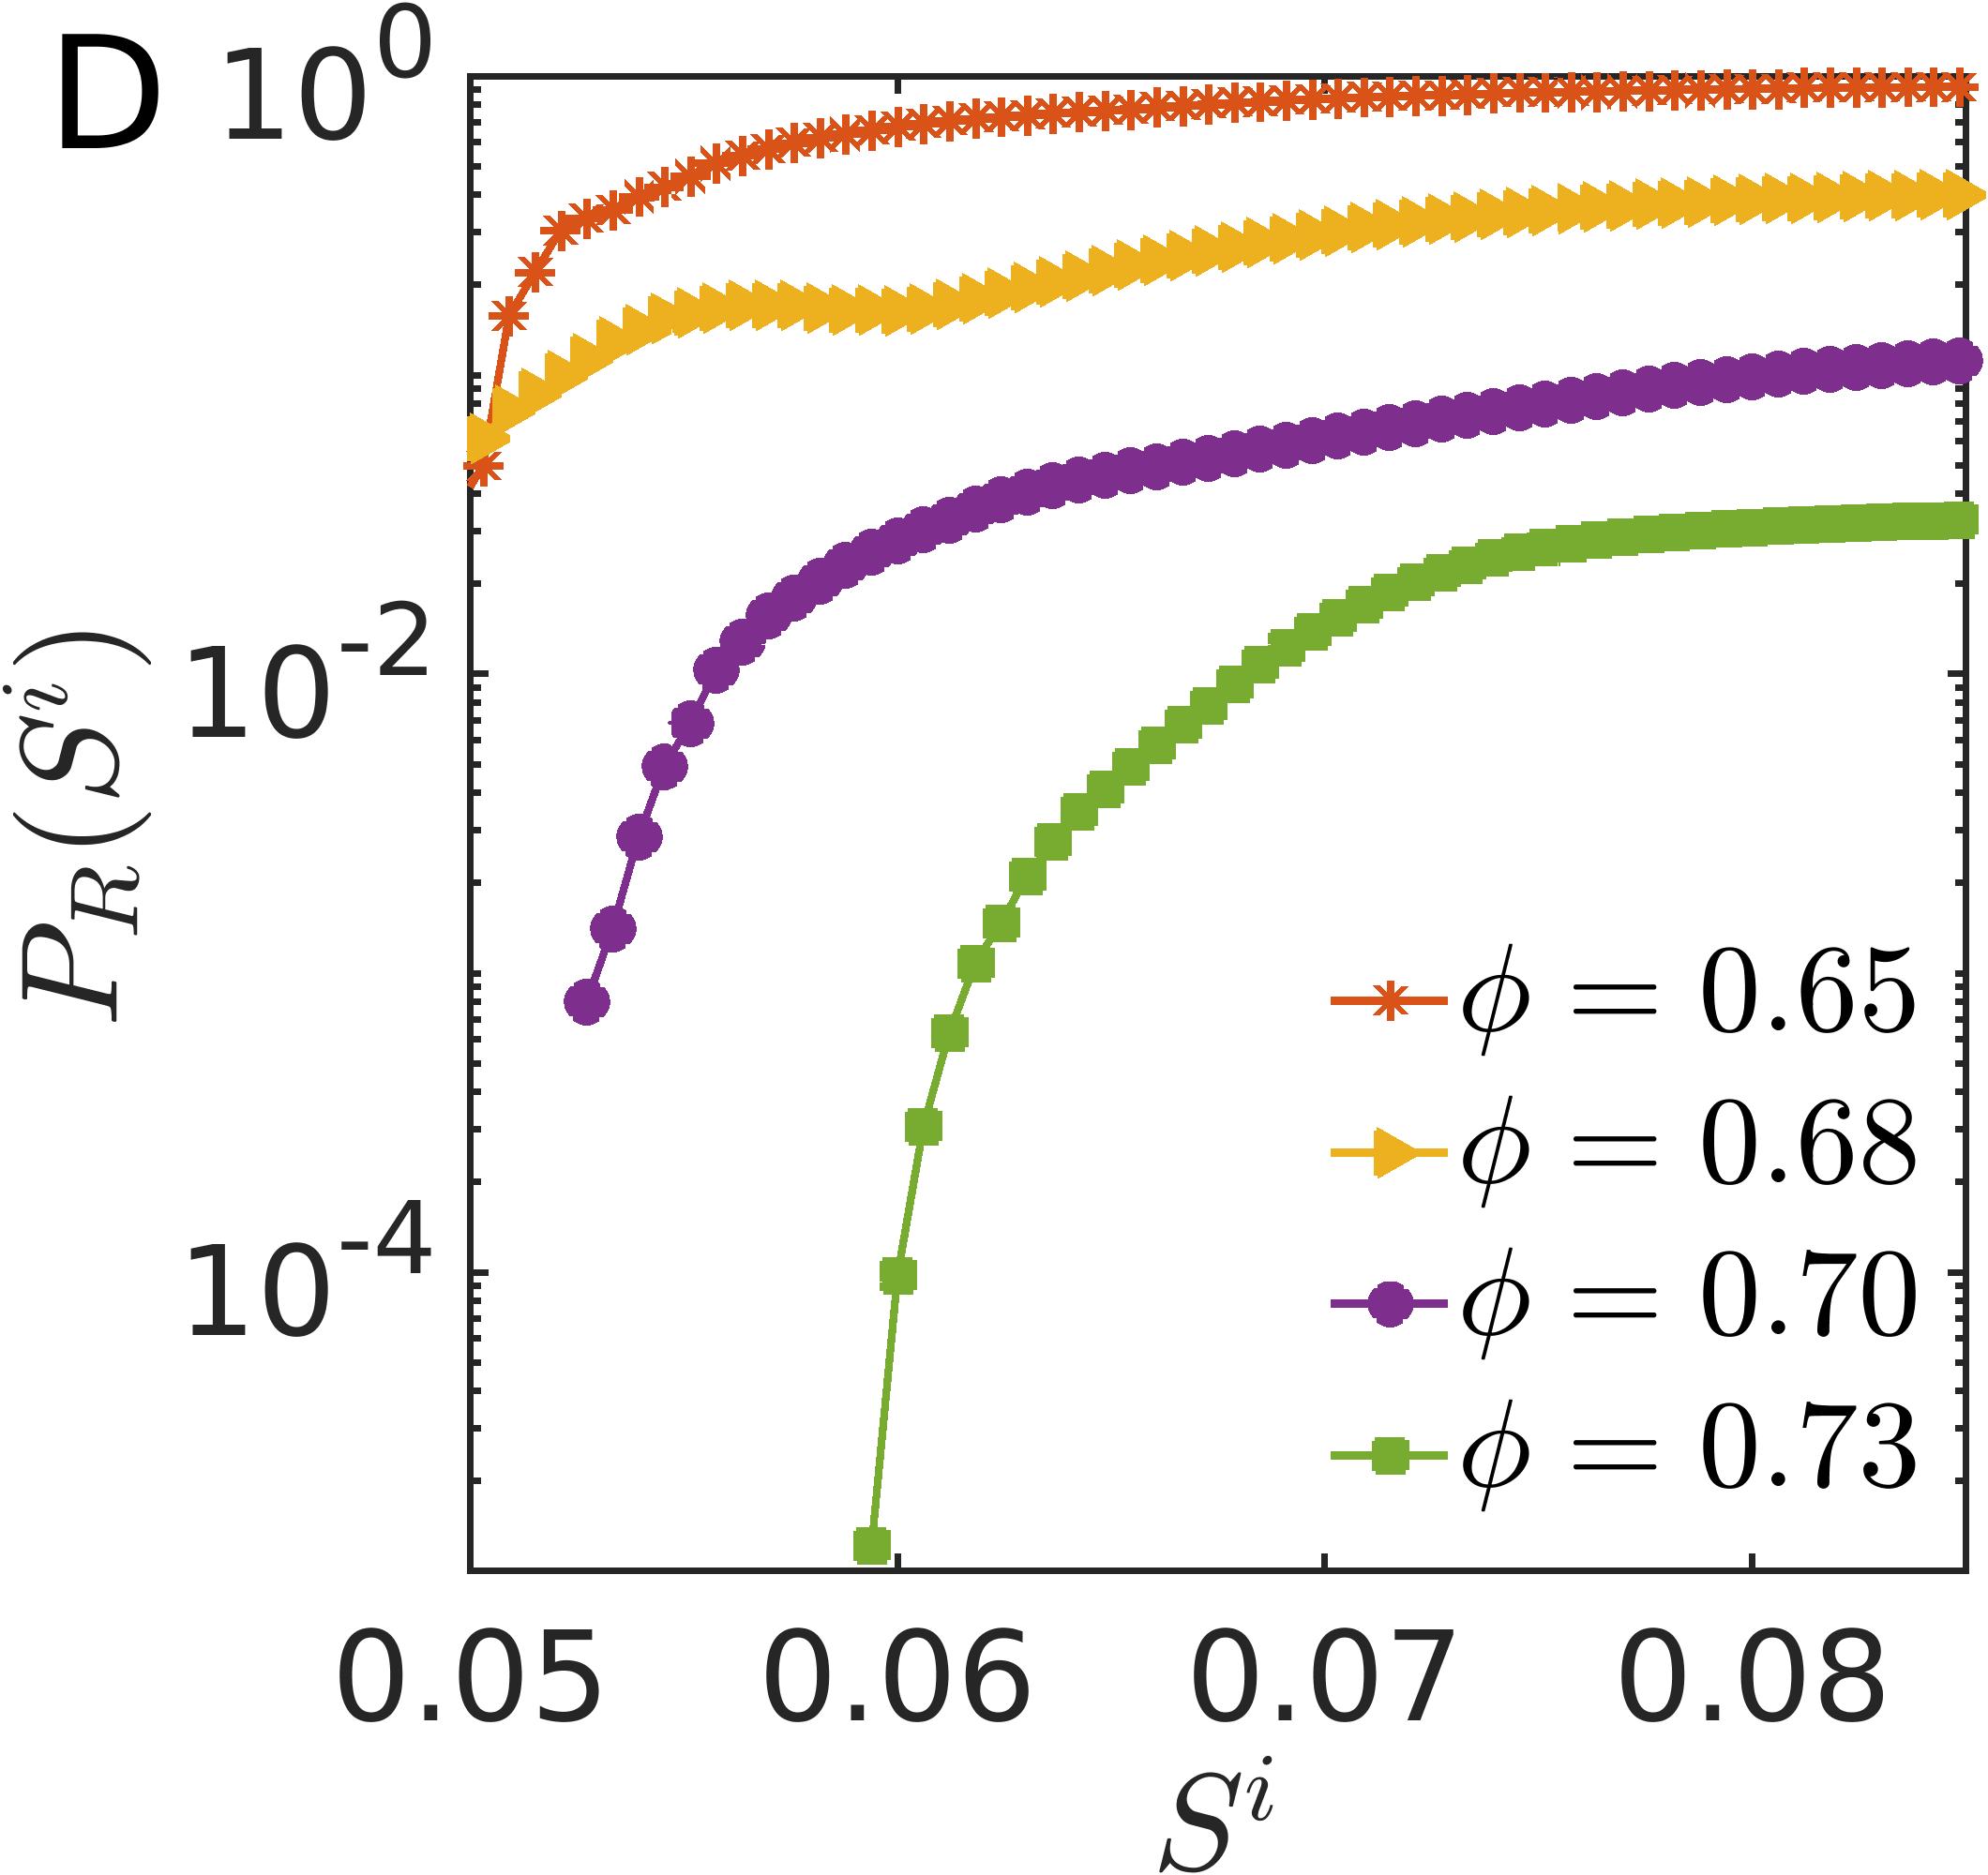
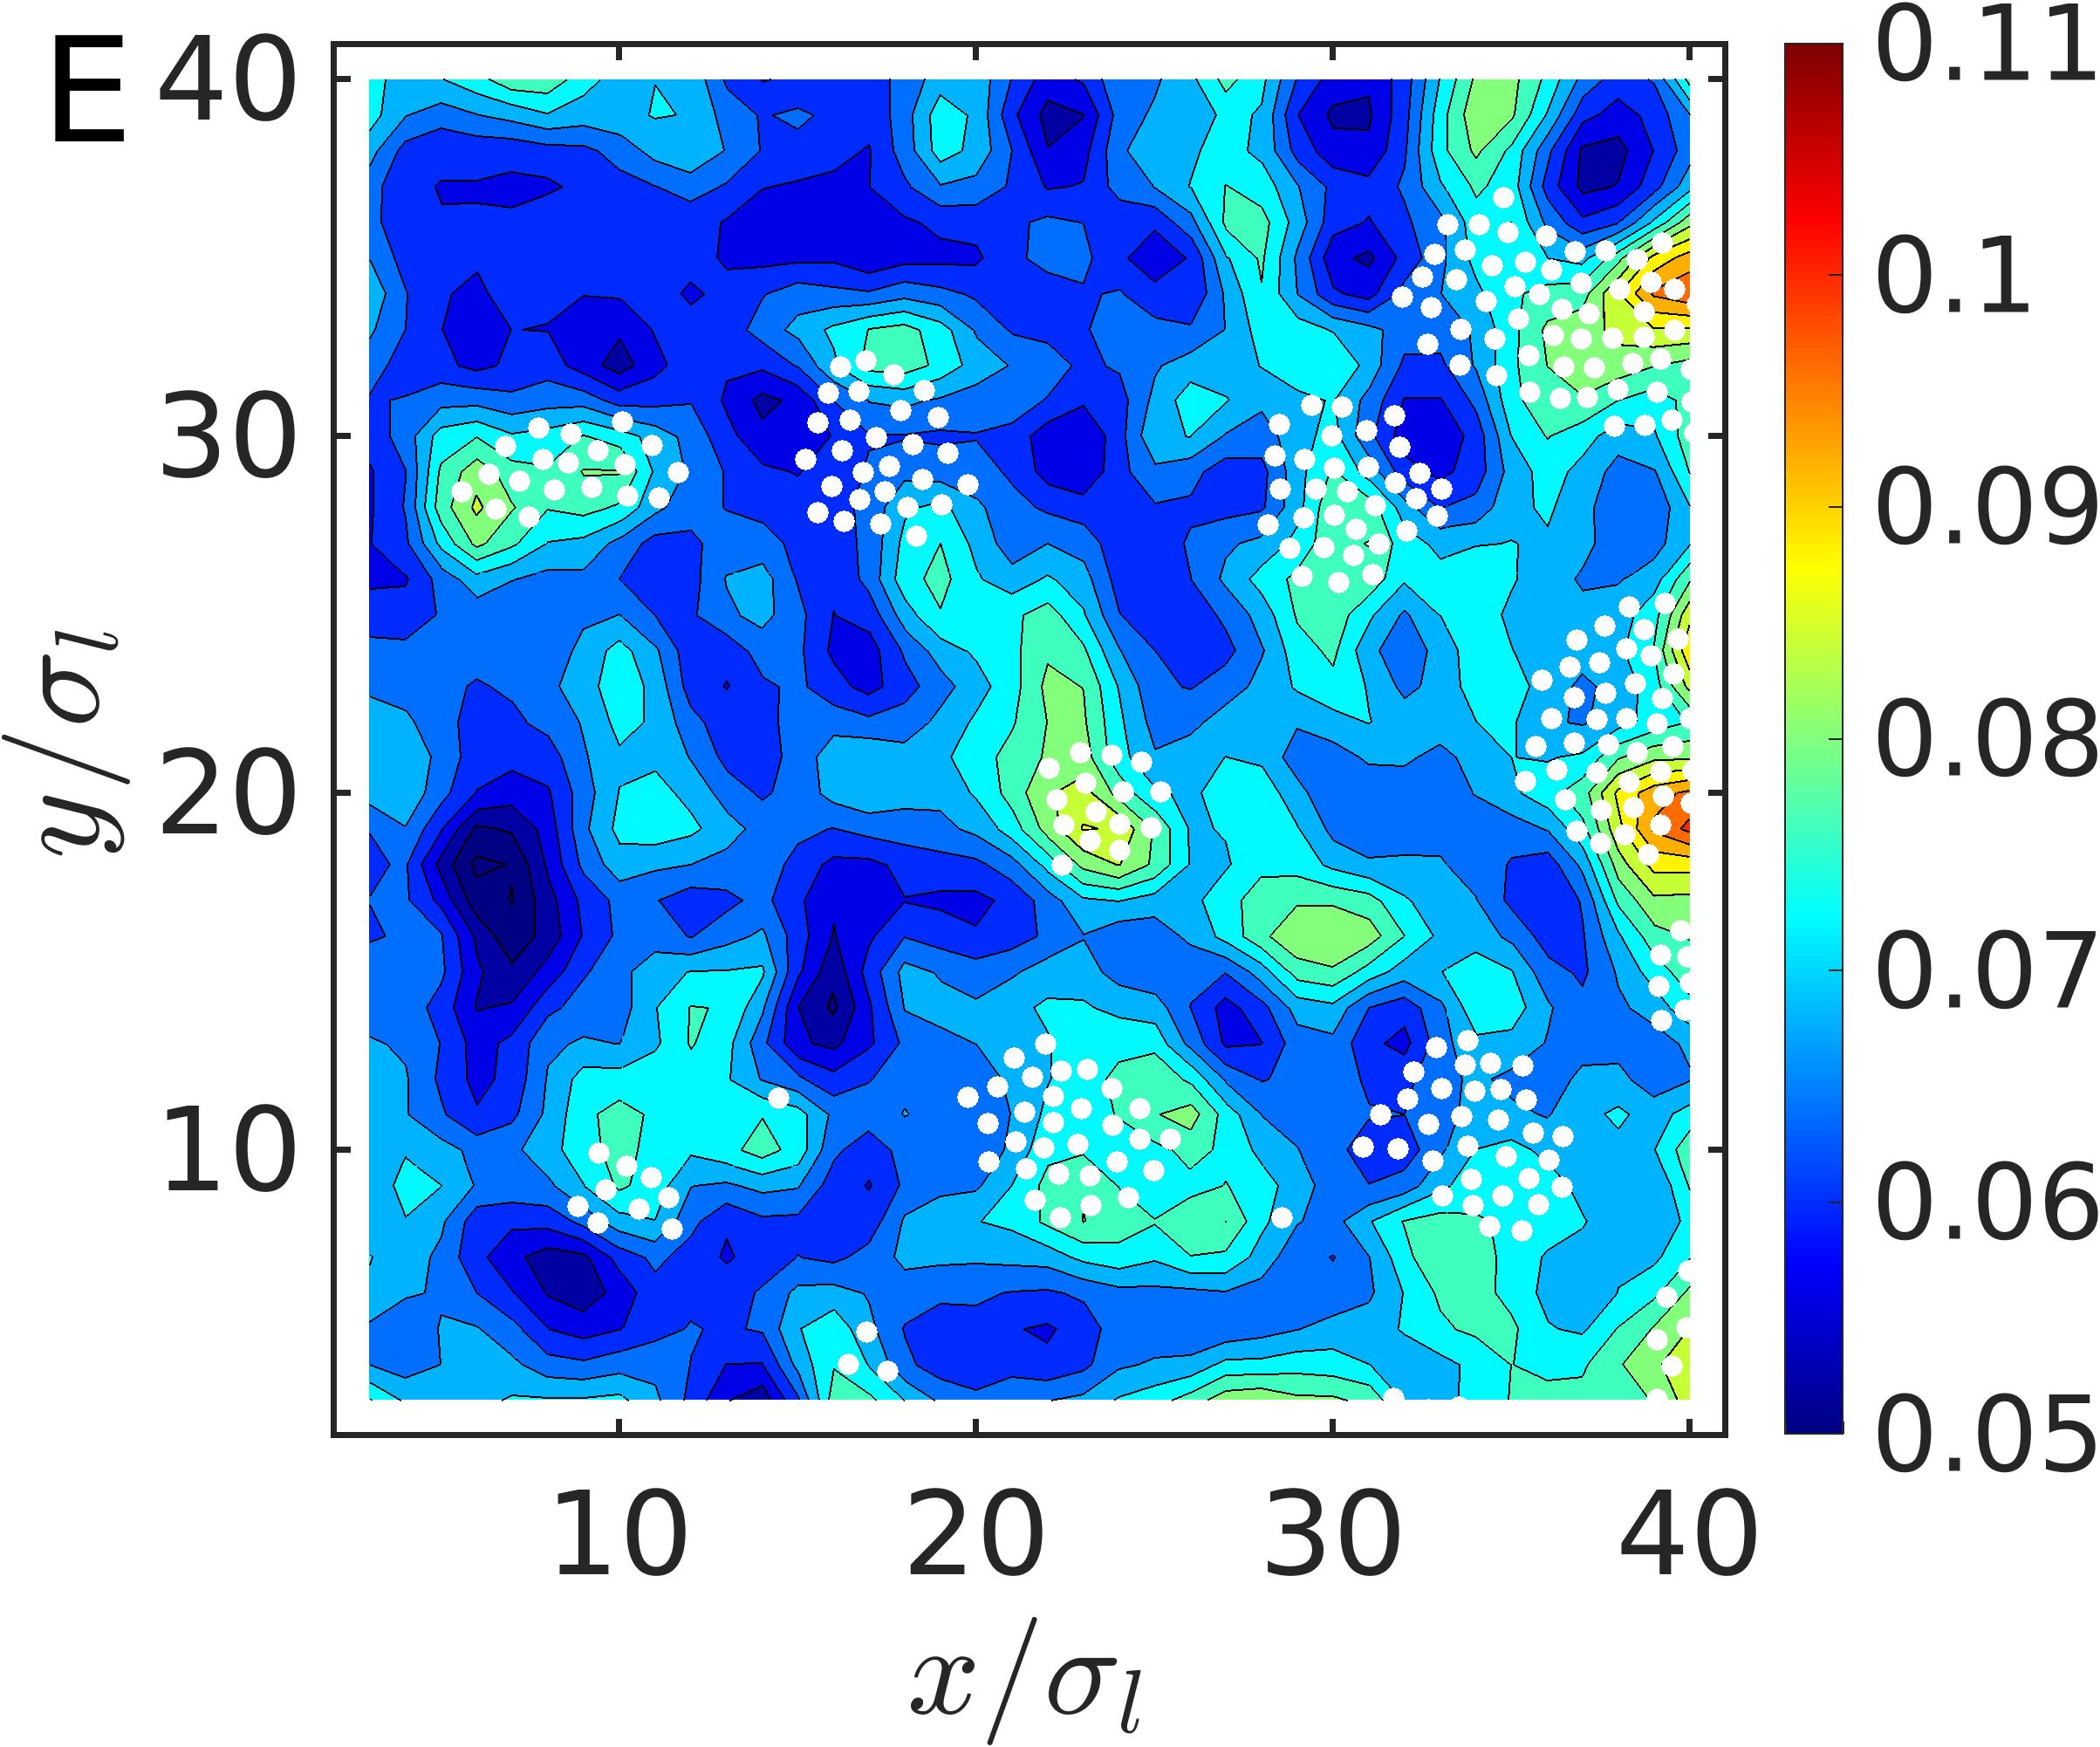
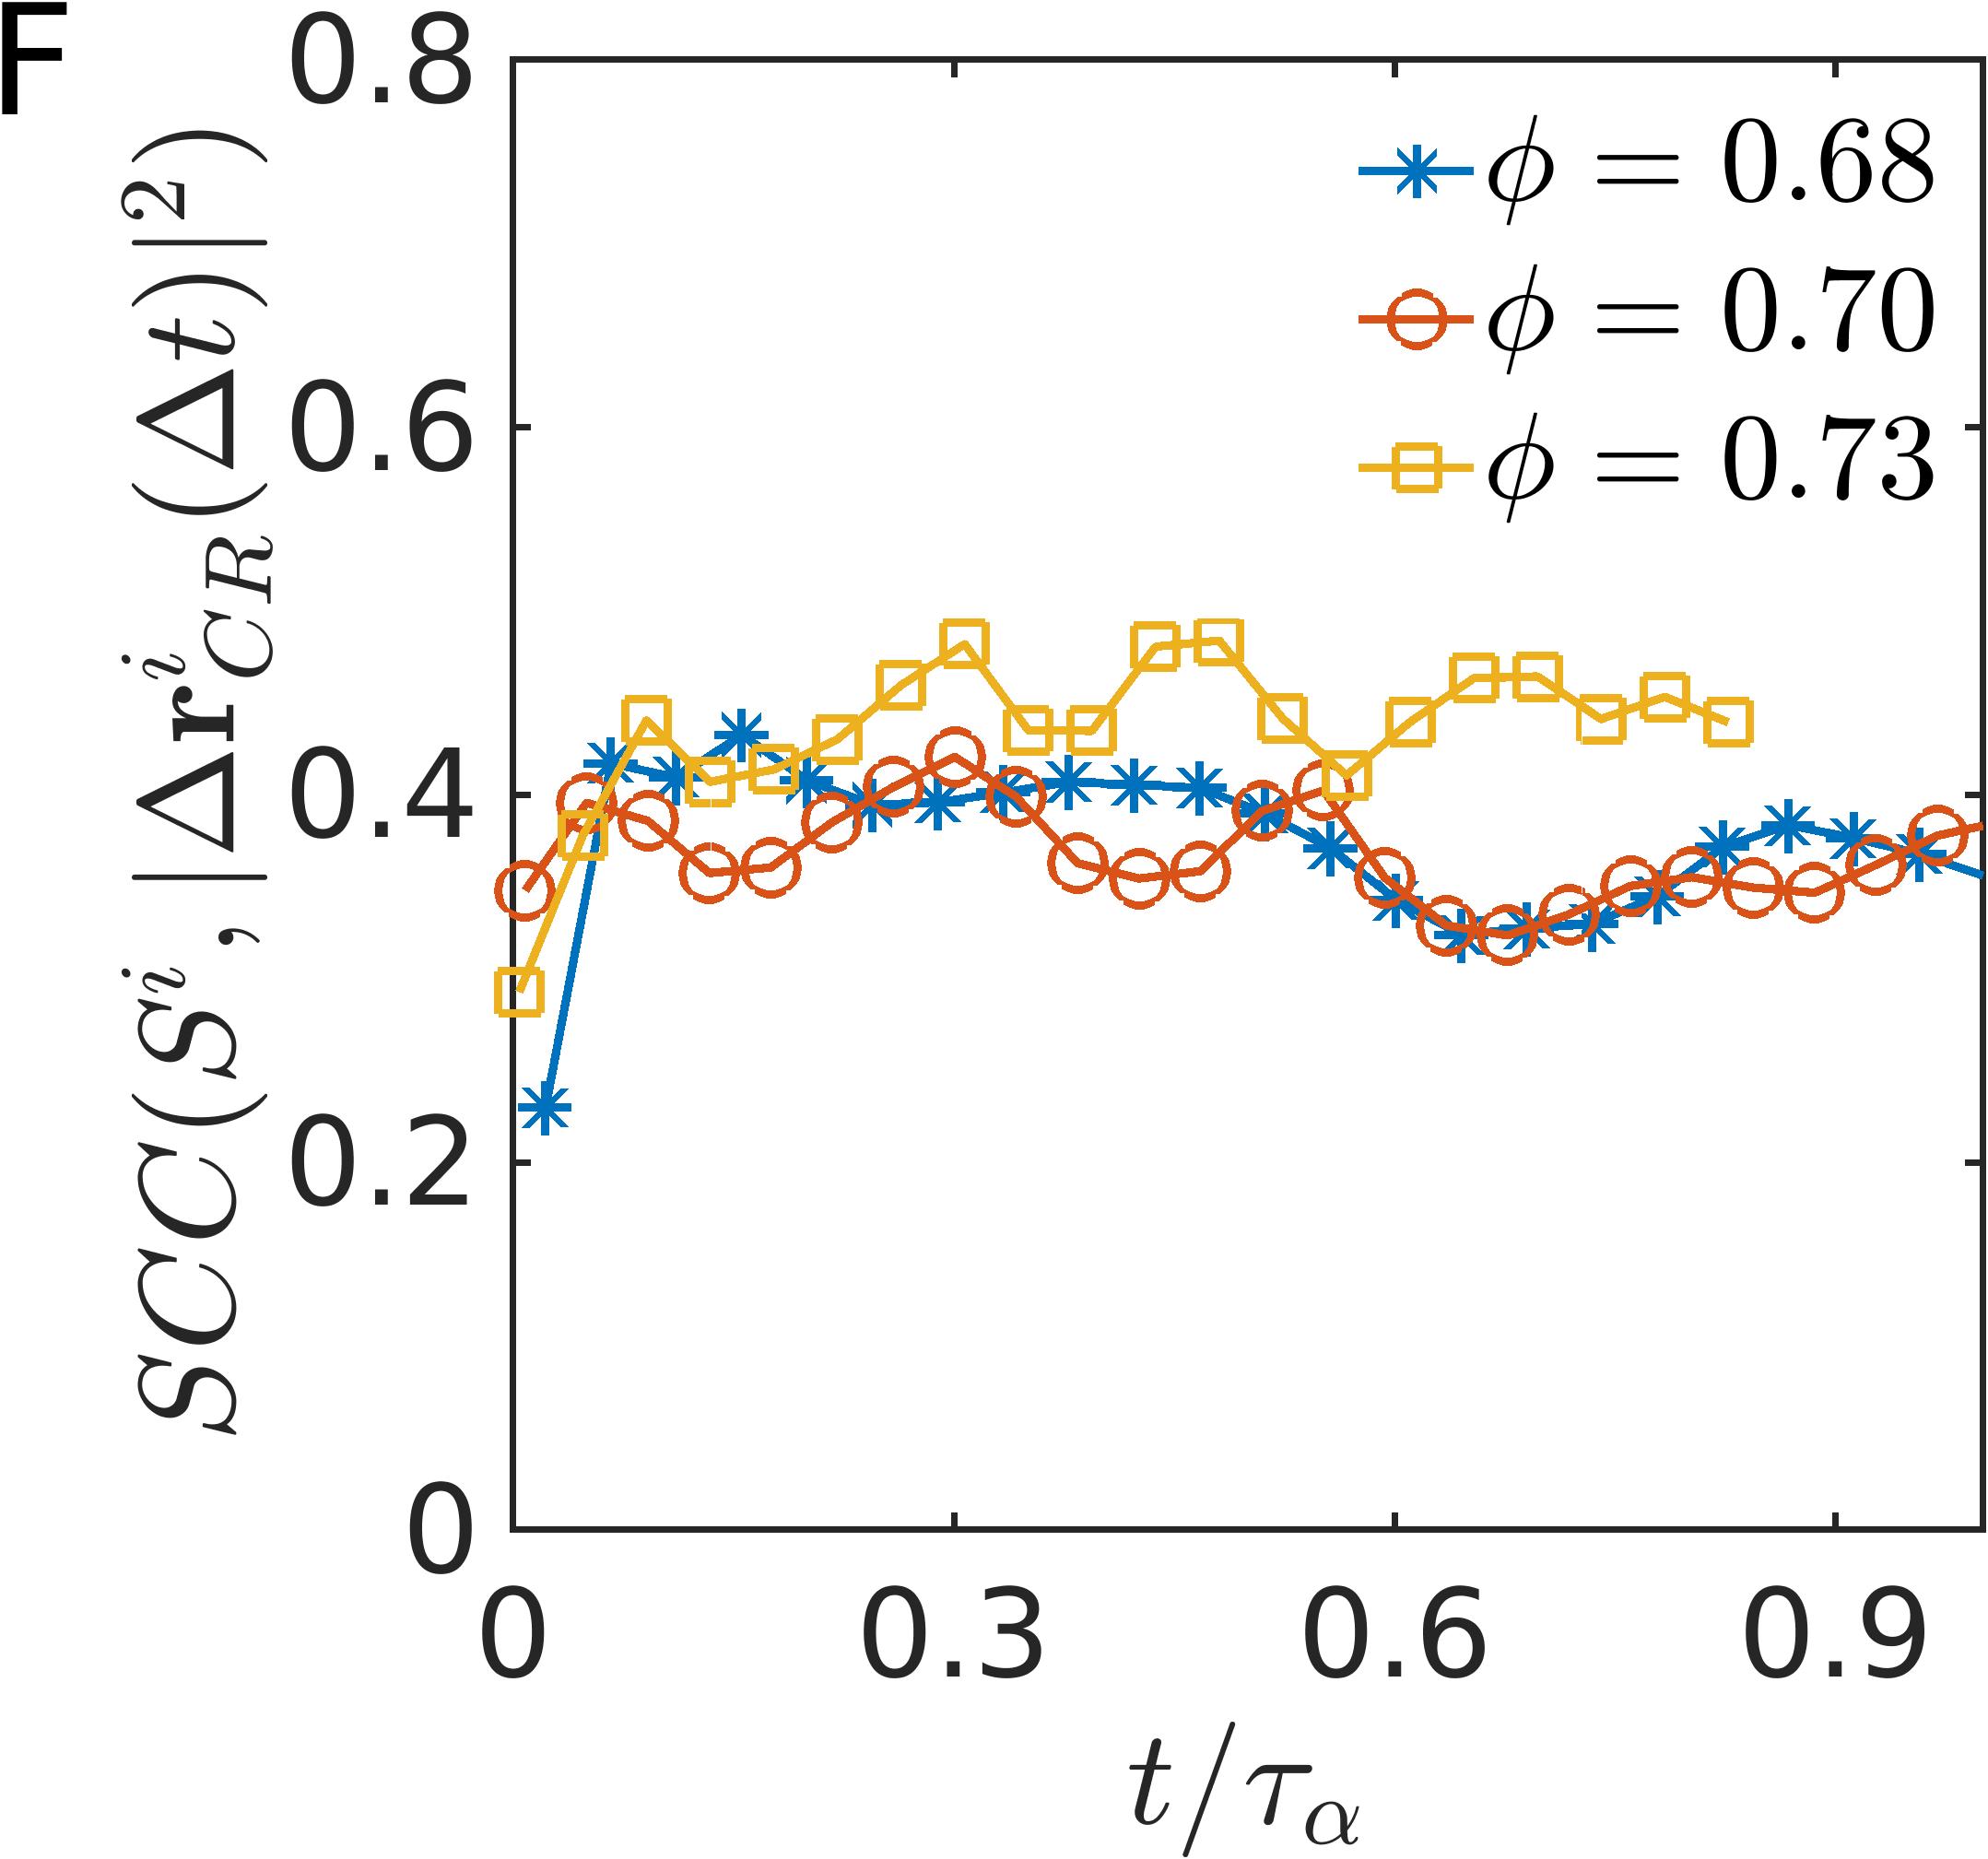
We next establish a causal relation between the SOP and rearranging particles that are responsible for the relaxation of the system. This is accomplished by determining the fraction of particles undergoing rearrangement as a function of . This is displayed in Fig.2D for a range of densities. The particles associated with higher or shallow caging potential display a larger probability of rearrangement, and this dependence is stronger at higher densities. This confirms that the dynamics is strongly correlated to structure at higher densities, in a way similar to stronger correlations between structure and dynamics at lower temperatures found in numerical simulations of molecular systems [24, 35]. A visual impression of these correlations is presented in Fig.2E, where the contours are drawn using of particles in a reference configuration, and the rearranging particles are shown as white circles. The rearranging particles are indeed located on top of regions of high SOP, visually establishing a close correlation between the dynamics and the structure characterized by the SOP. To quantify the correlations, we compute the Spearman rank correlation coefficient (SCC) between the structural order parameter of particles and their cage relative displacements as a function of scaled time (see Eq.6 in methods). For all the area fractions, the correlation initially grows and then remains almost constant over time. Similar features relating to correlations were reported in machine learning studies and molecular simulations [28, 23, 36].
Structural relaxation of dense colloidal suspensions under shear
 |
 |
 |
 |
 |
 |
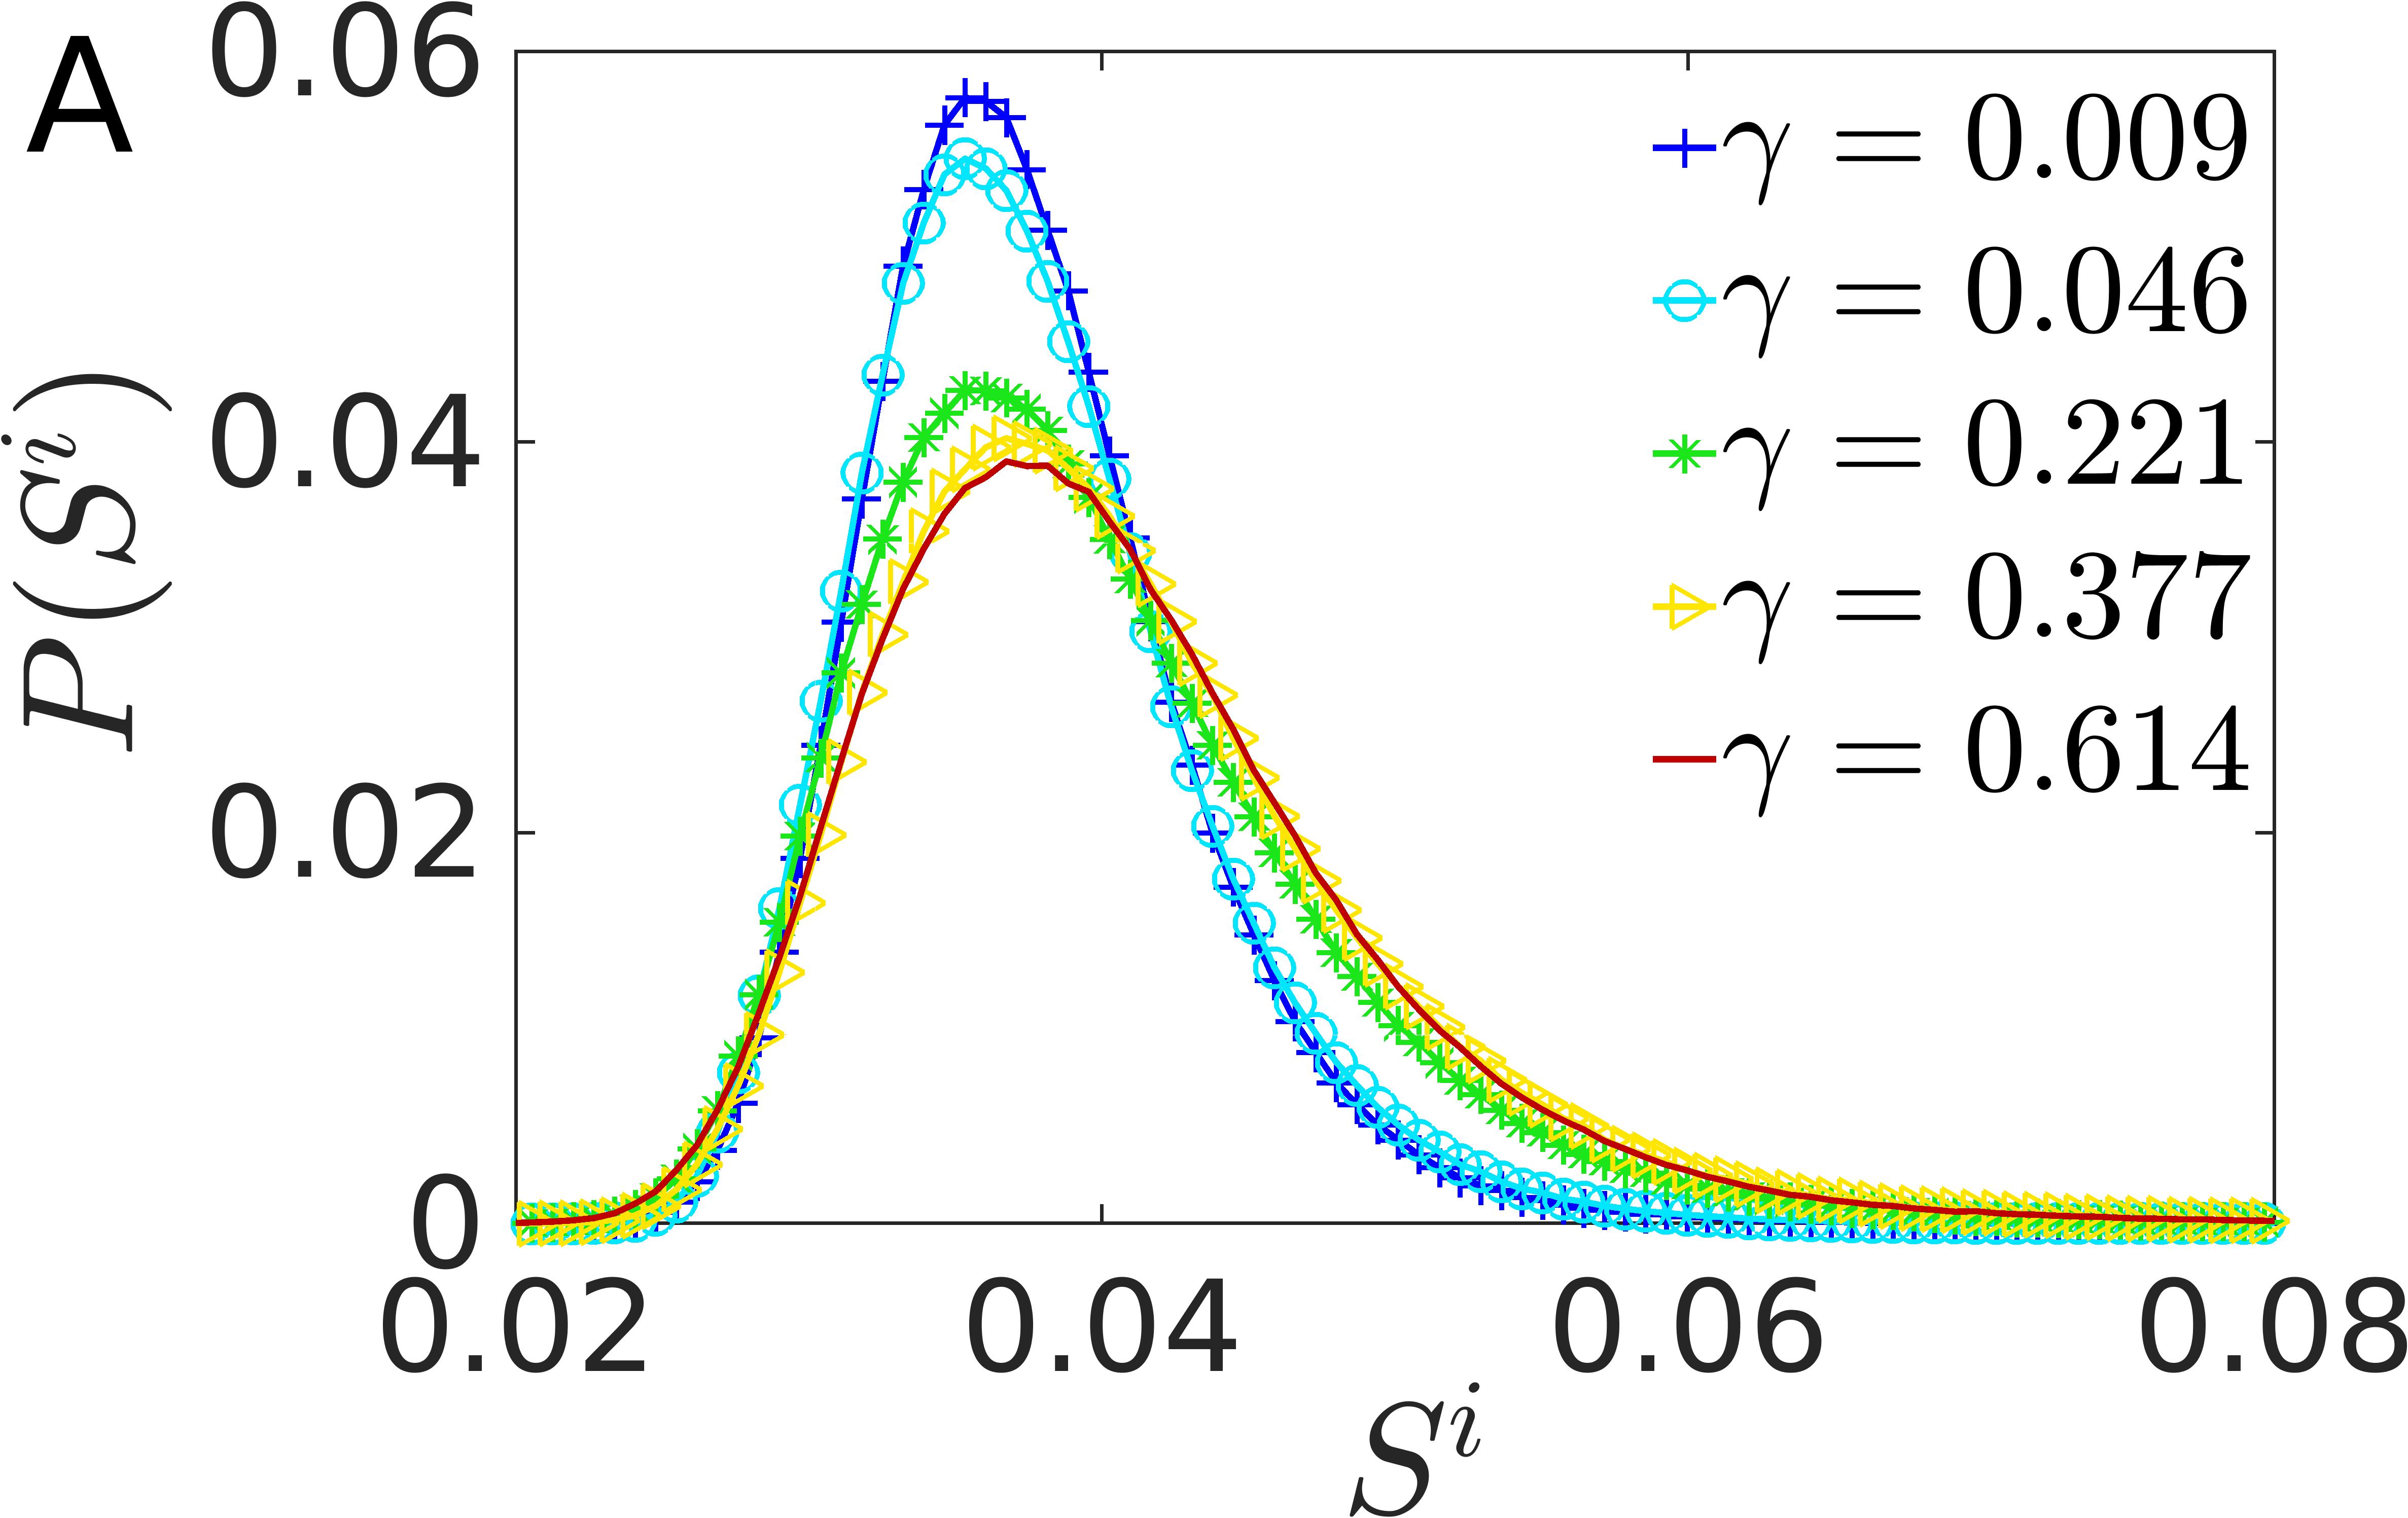
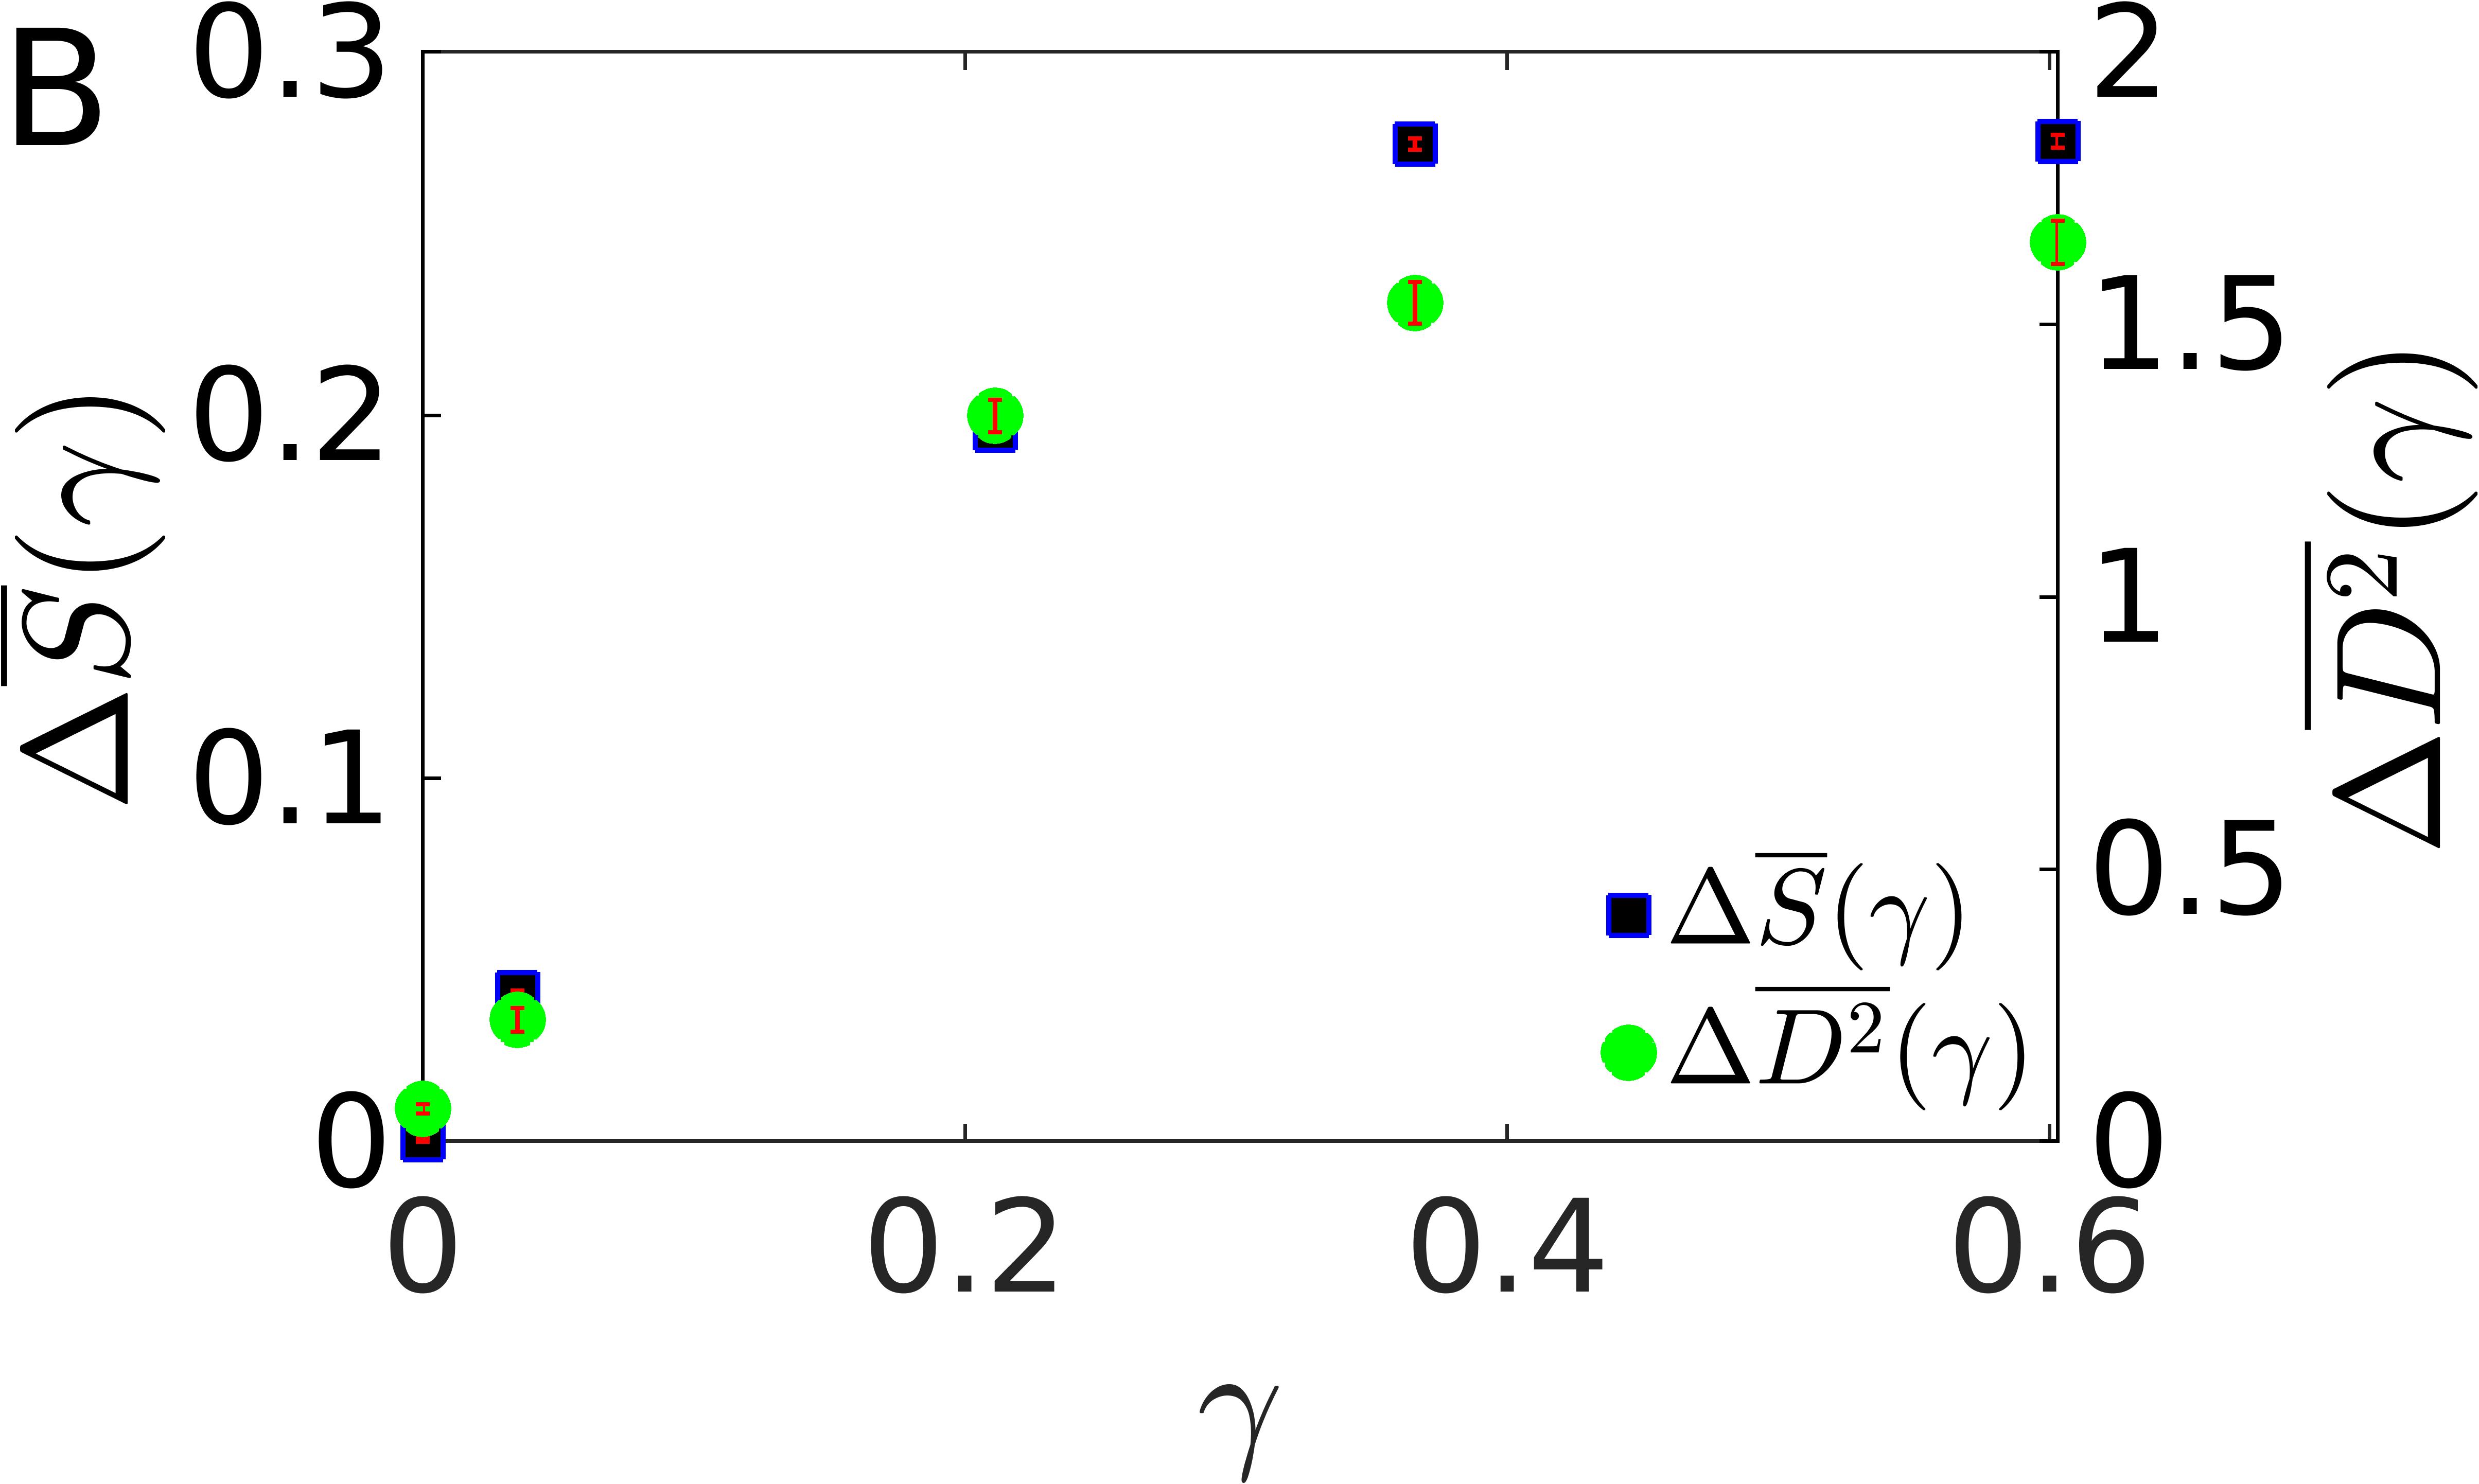
We extend our study of the structural order parameter to dense colloidal suspensions in 3D under plane shear at a constant shear rate of . The shear rates employed in our experiments are of the order of the inverse relaxation time of the system, indicating that the system is weakly driven [48]. We first present the effect of applied strain on the distribution of local structural order parameter . Although the system is strained, we treat it isotropically in the calculation of the SOP. Figure 3A shows the distributions for varying levels of applied strain ranging from . These distributions are averaged over multiple configurations centred around . As the applied strain increases, the peak of the distribution moves to larger values of . We elucidate this further by analyzing the variations in the average SOP, with strain . Figure 3B illustrates these variations through scaled changes, , where the bar represents averaging over all particles, and the angular bracket denotes averaging over multiple configurations. Here, represents the smallest strain interval considered in our study. Initially, increases with applied strain, suggesting a reduction in the average depth of caging potential experienced by the particles and consequent shear softening of the system. However, beyond a certain strain threshold, the system attains a steady state with no overall structural changes. This shear induced softening of the system should lead to a proliferation of plastic activity, which we confirm by investigating the dynamics.
To understand plastic deformation in sheared systems, we investigate the nonaffine displacements of particles [6, 49]. For a strain increment of , the non-affine displacement of a tagged particle is defined as , where i is the index of tagged particle, is the displacement vector between particle and its nearest neighbors , is the number of first nearest neighbors of particle based on the first minima of , and is the best-fit affine deformation tensor that minimizes .
The scaled change, , is presented on the right side of the vertical axis using circle symbols in Fig.3B. Note that the bar denotes average over particles and the angular bracket denotes averaging over multiple strain intervals. During the transient stages, the plastic deformation, , increases with strain and saturates after the system yields and attains a steady state.
Remarkably, both and display similar behavior in the transient and steady states. This trend appears to persist at higher shear rates; see Fig.S7 in SI for a similar analysis at .
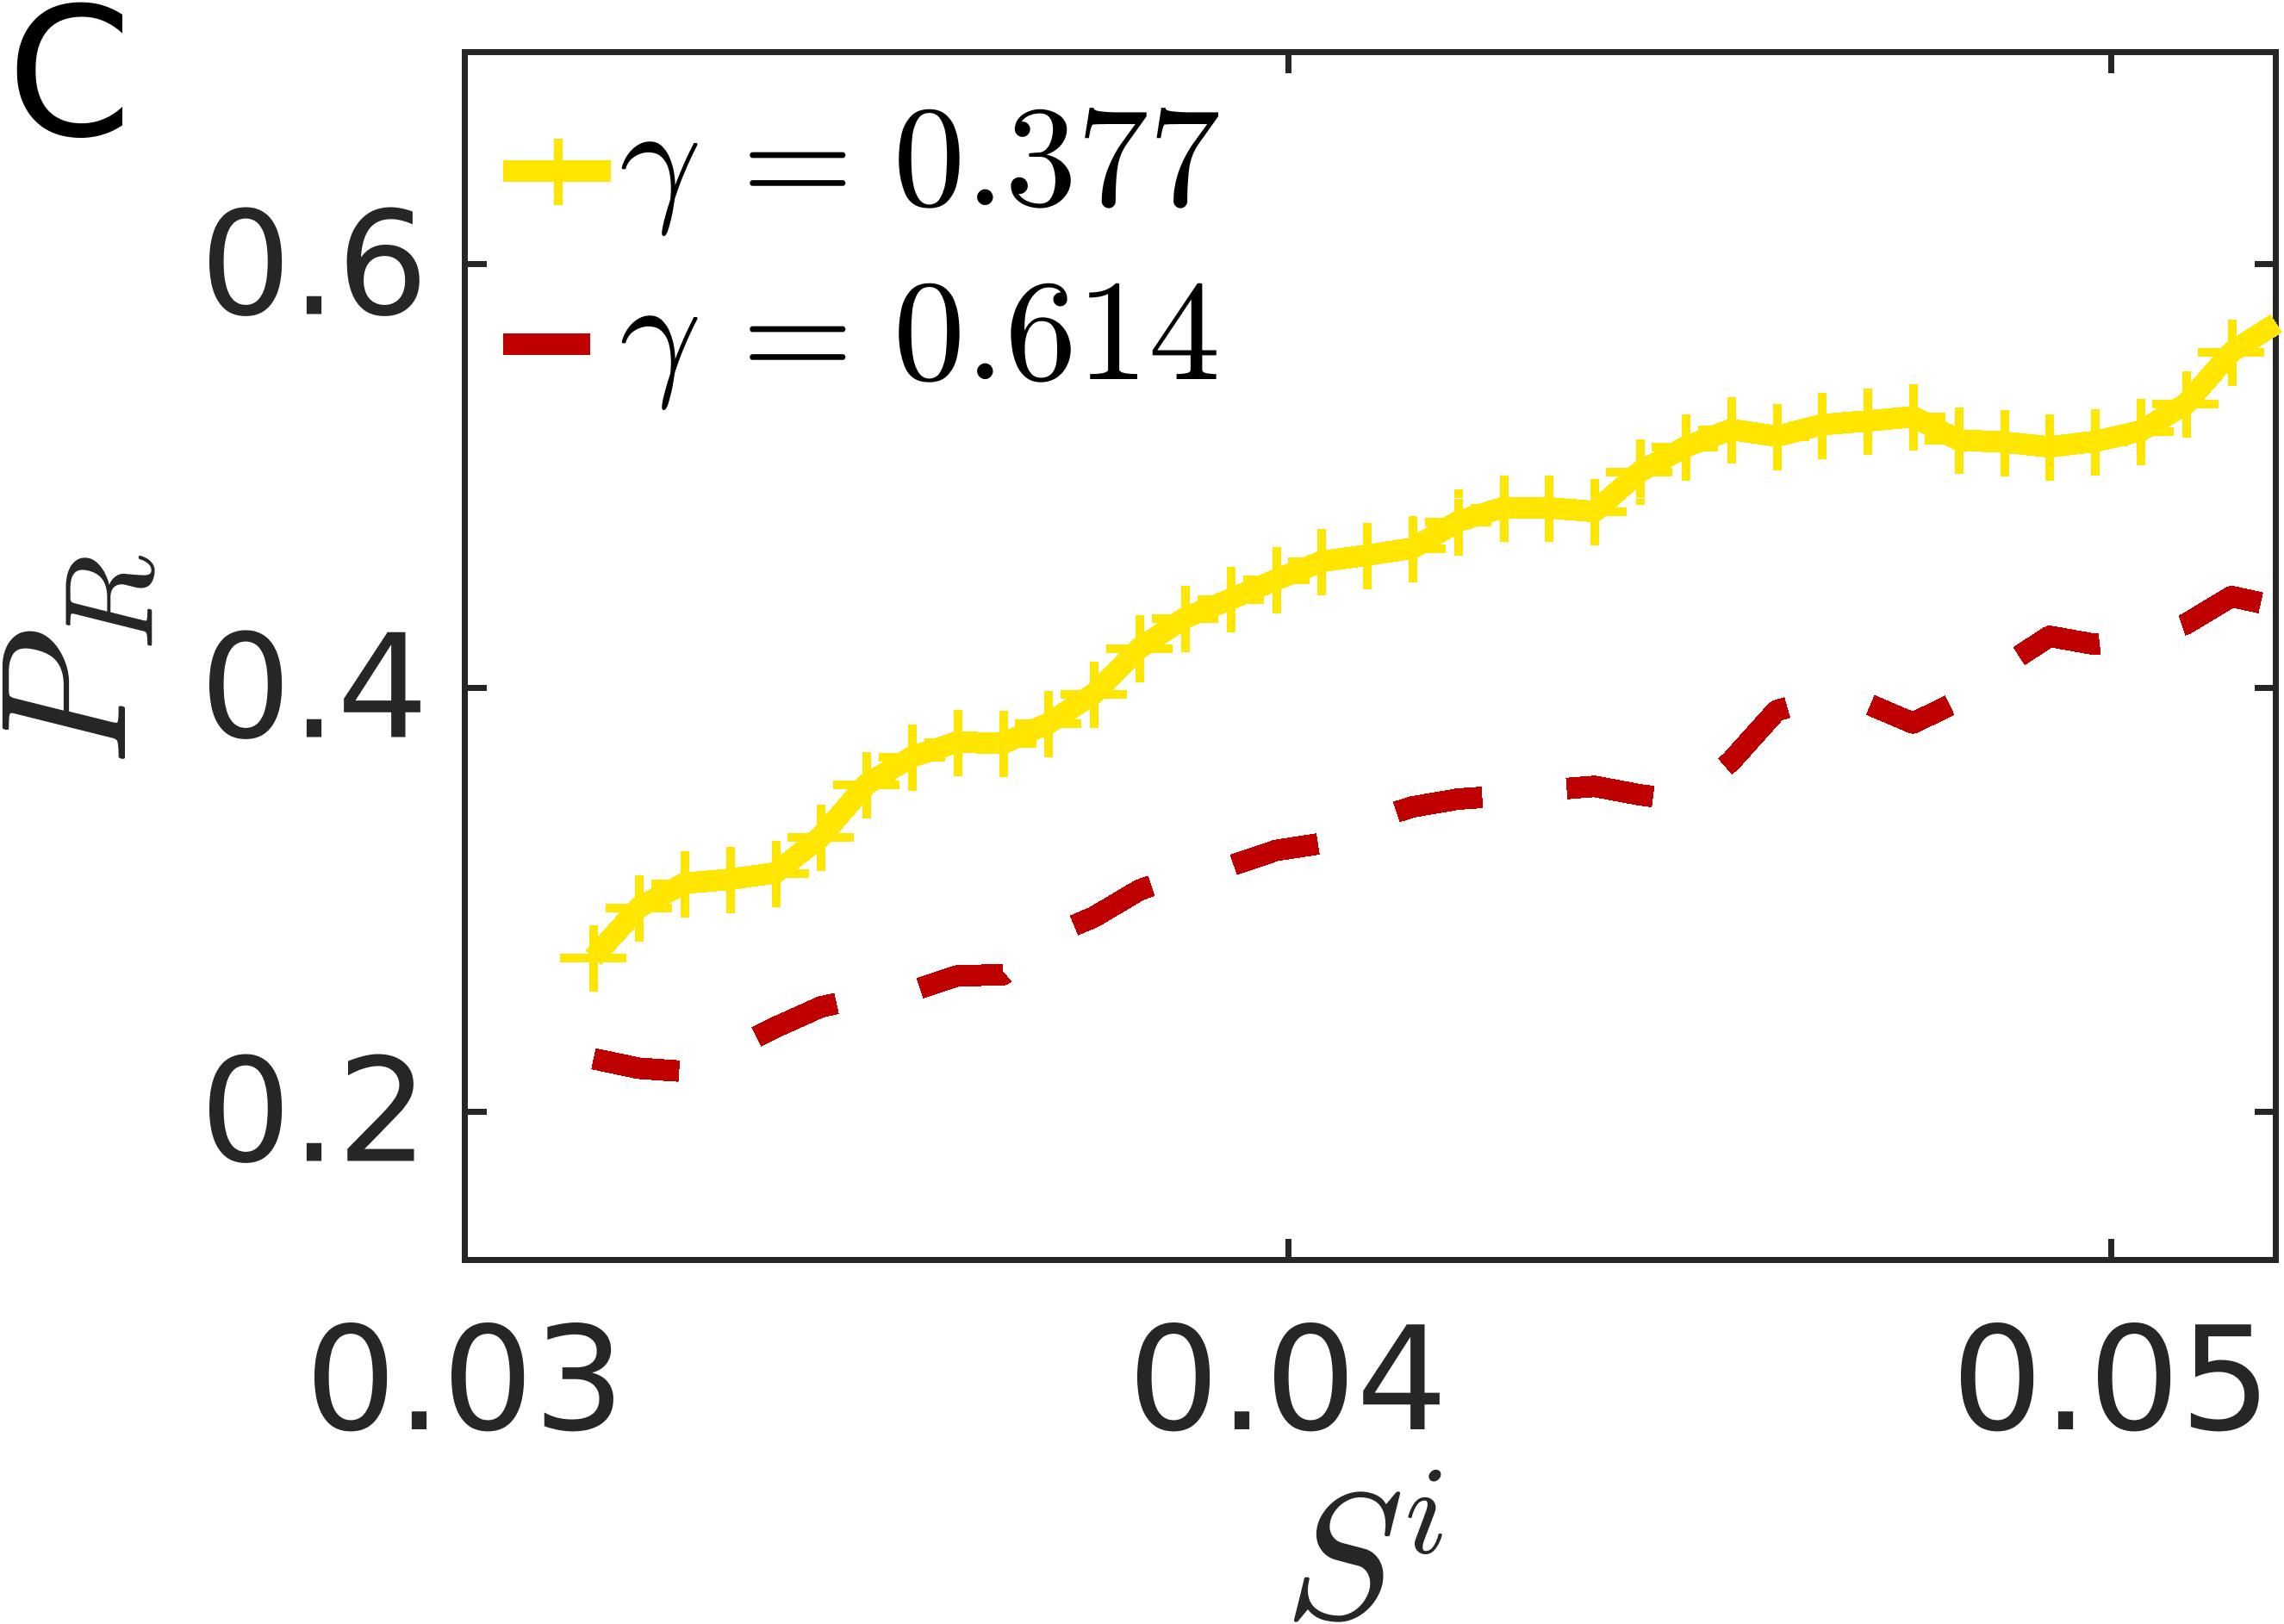
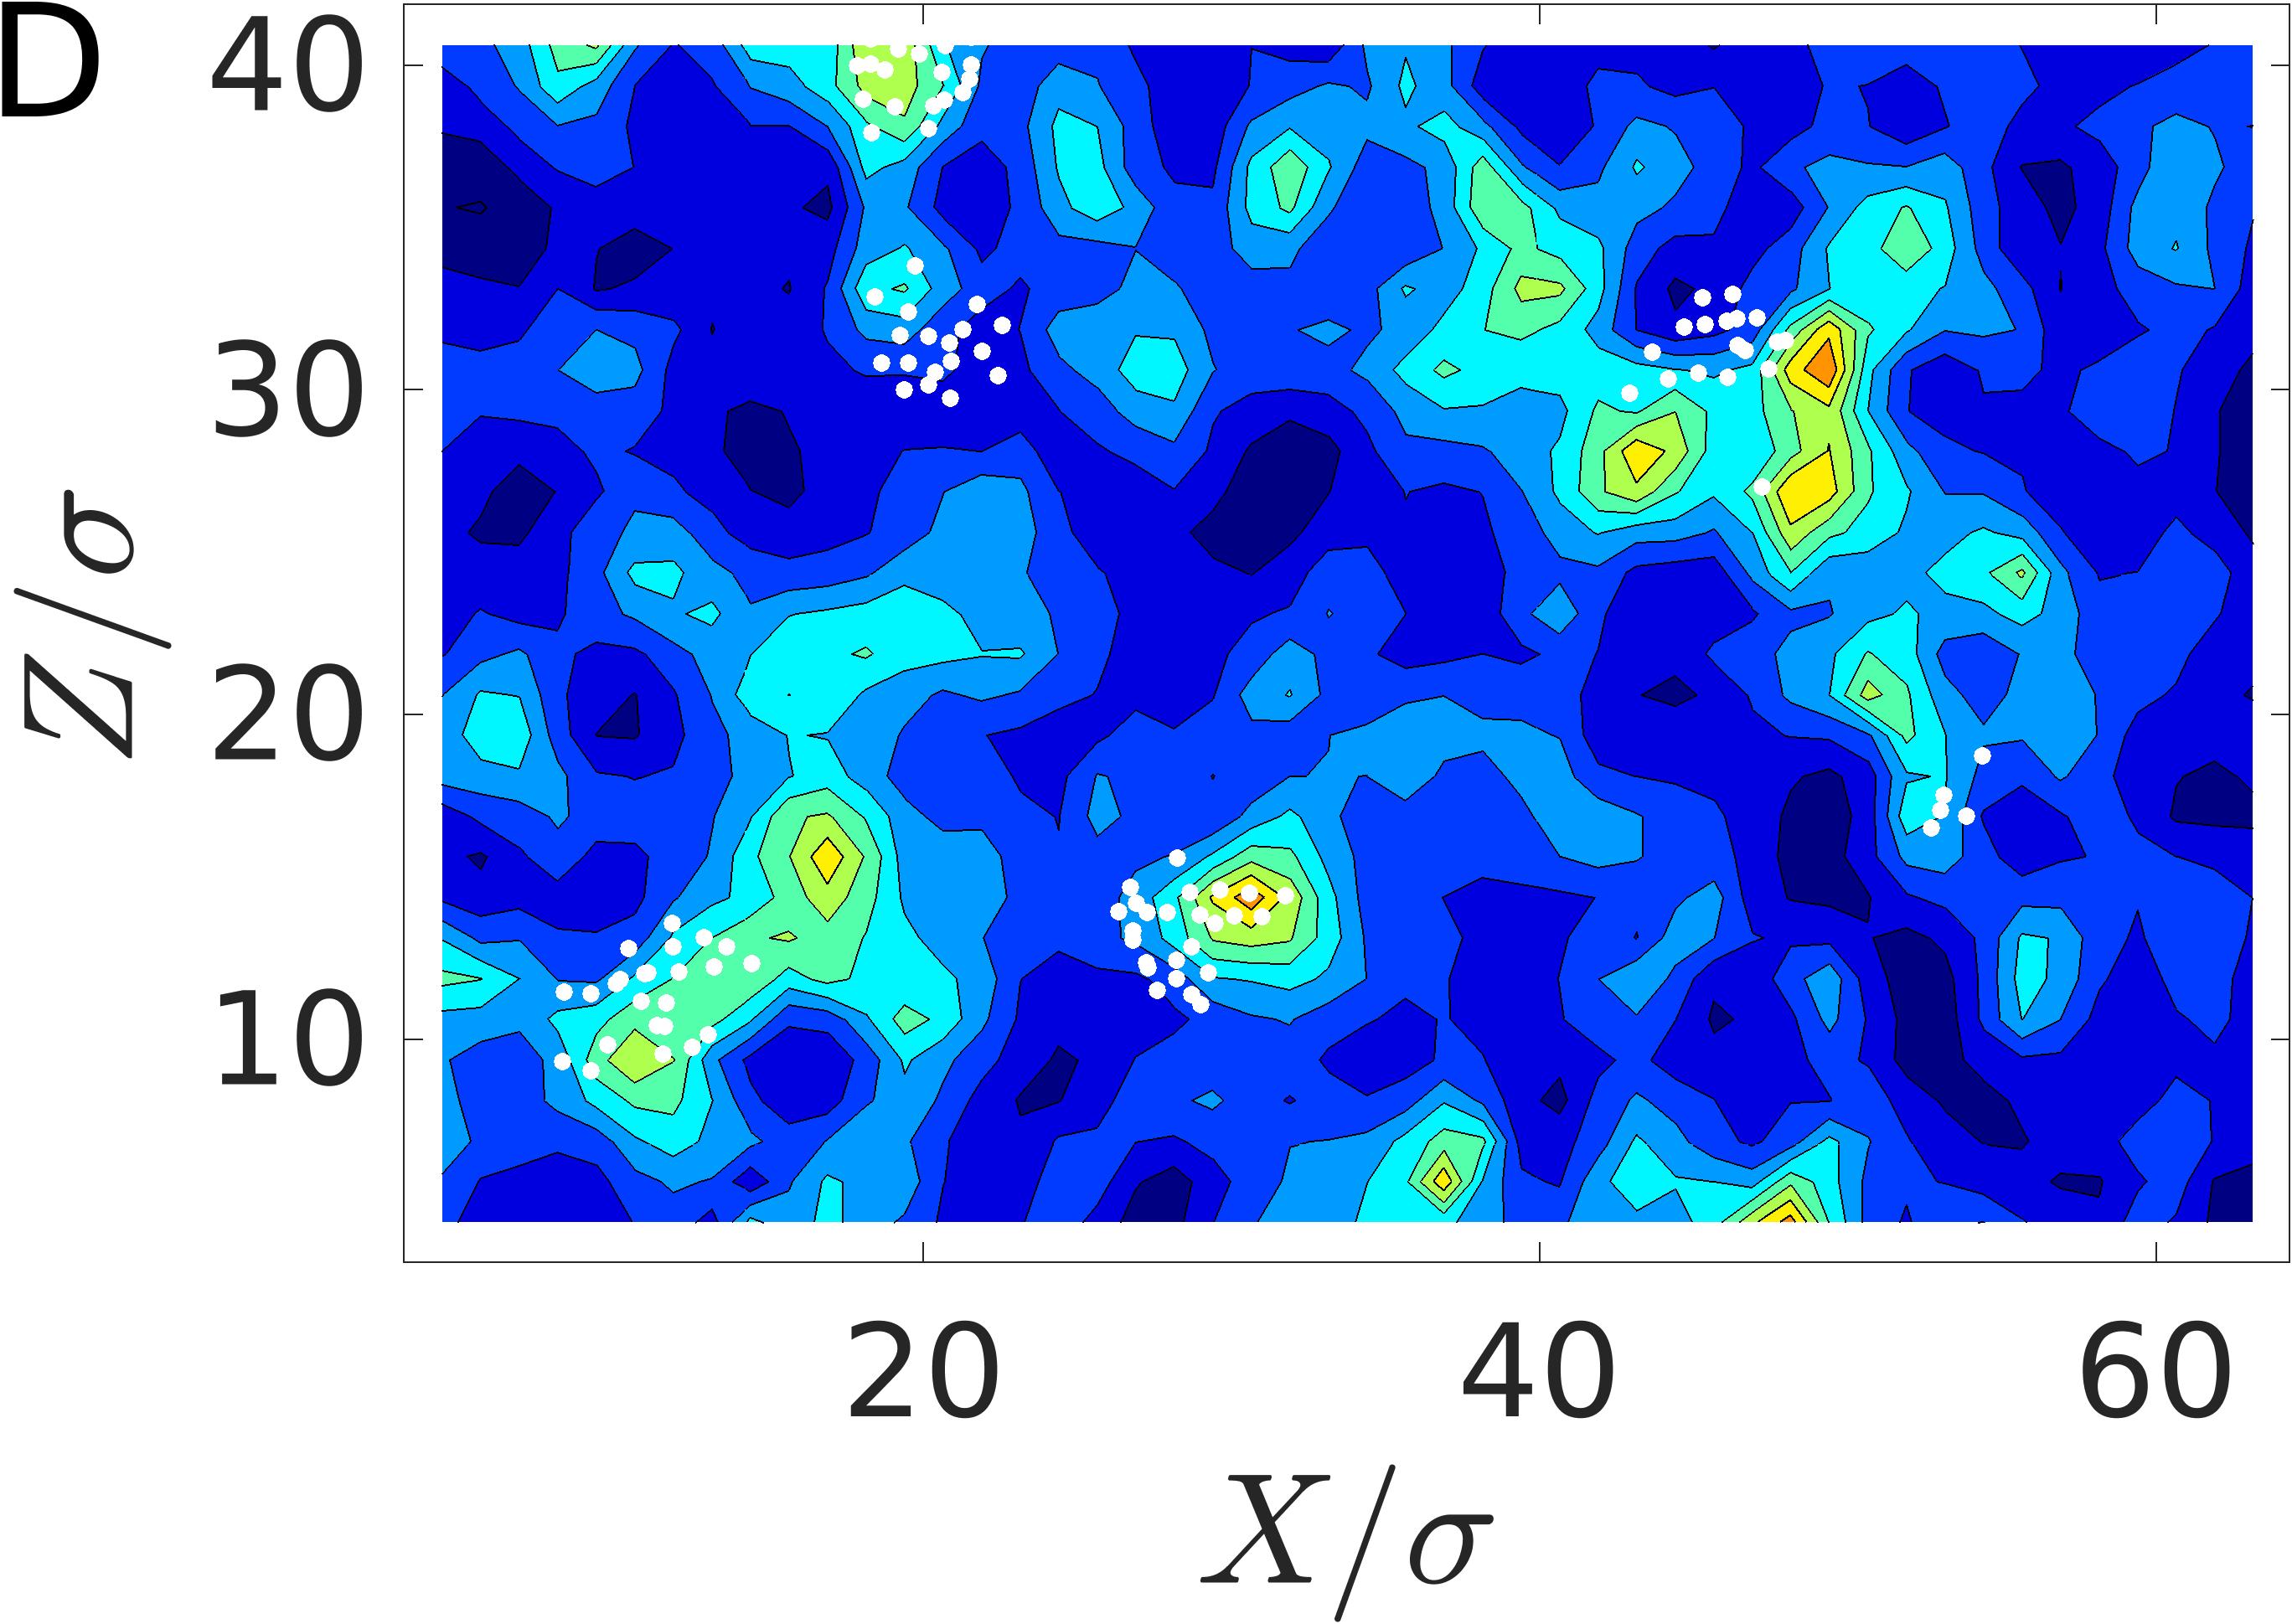
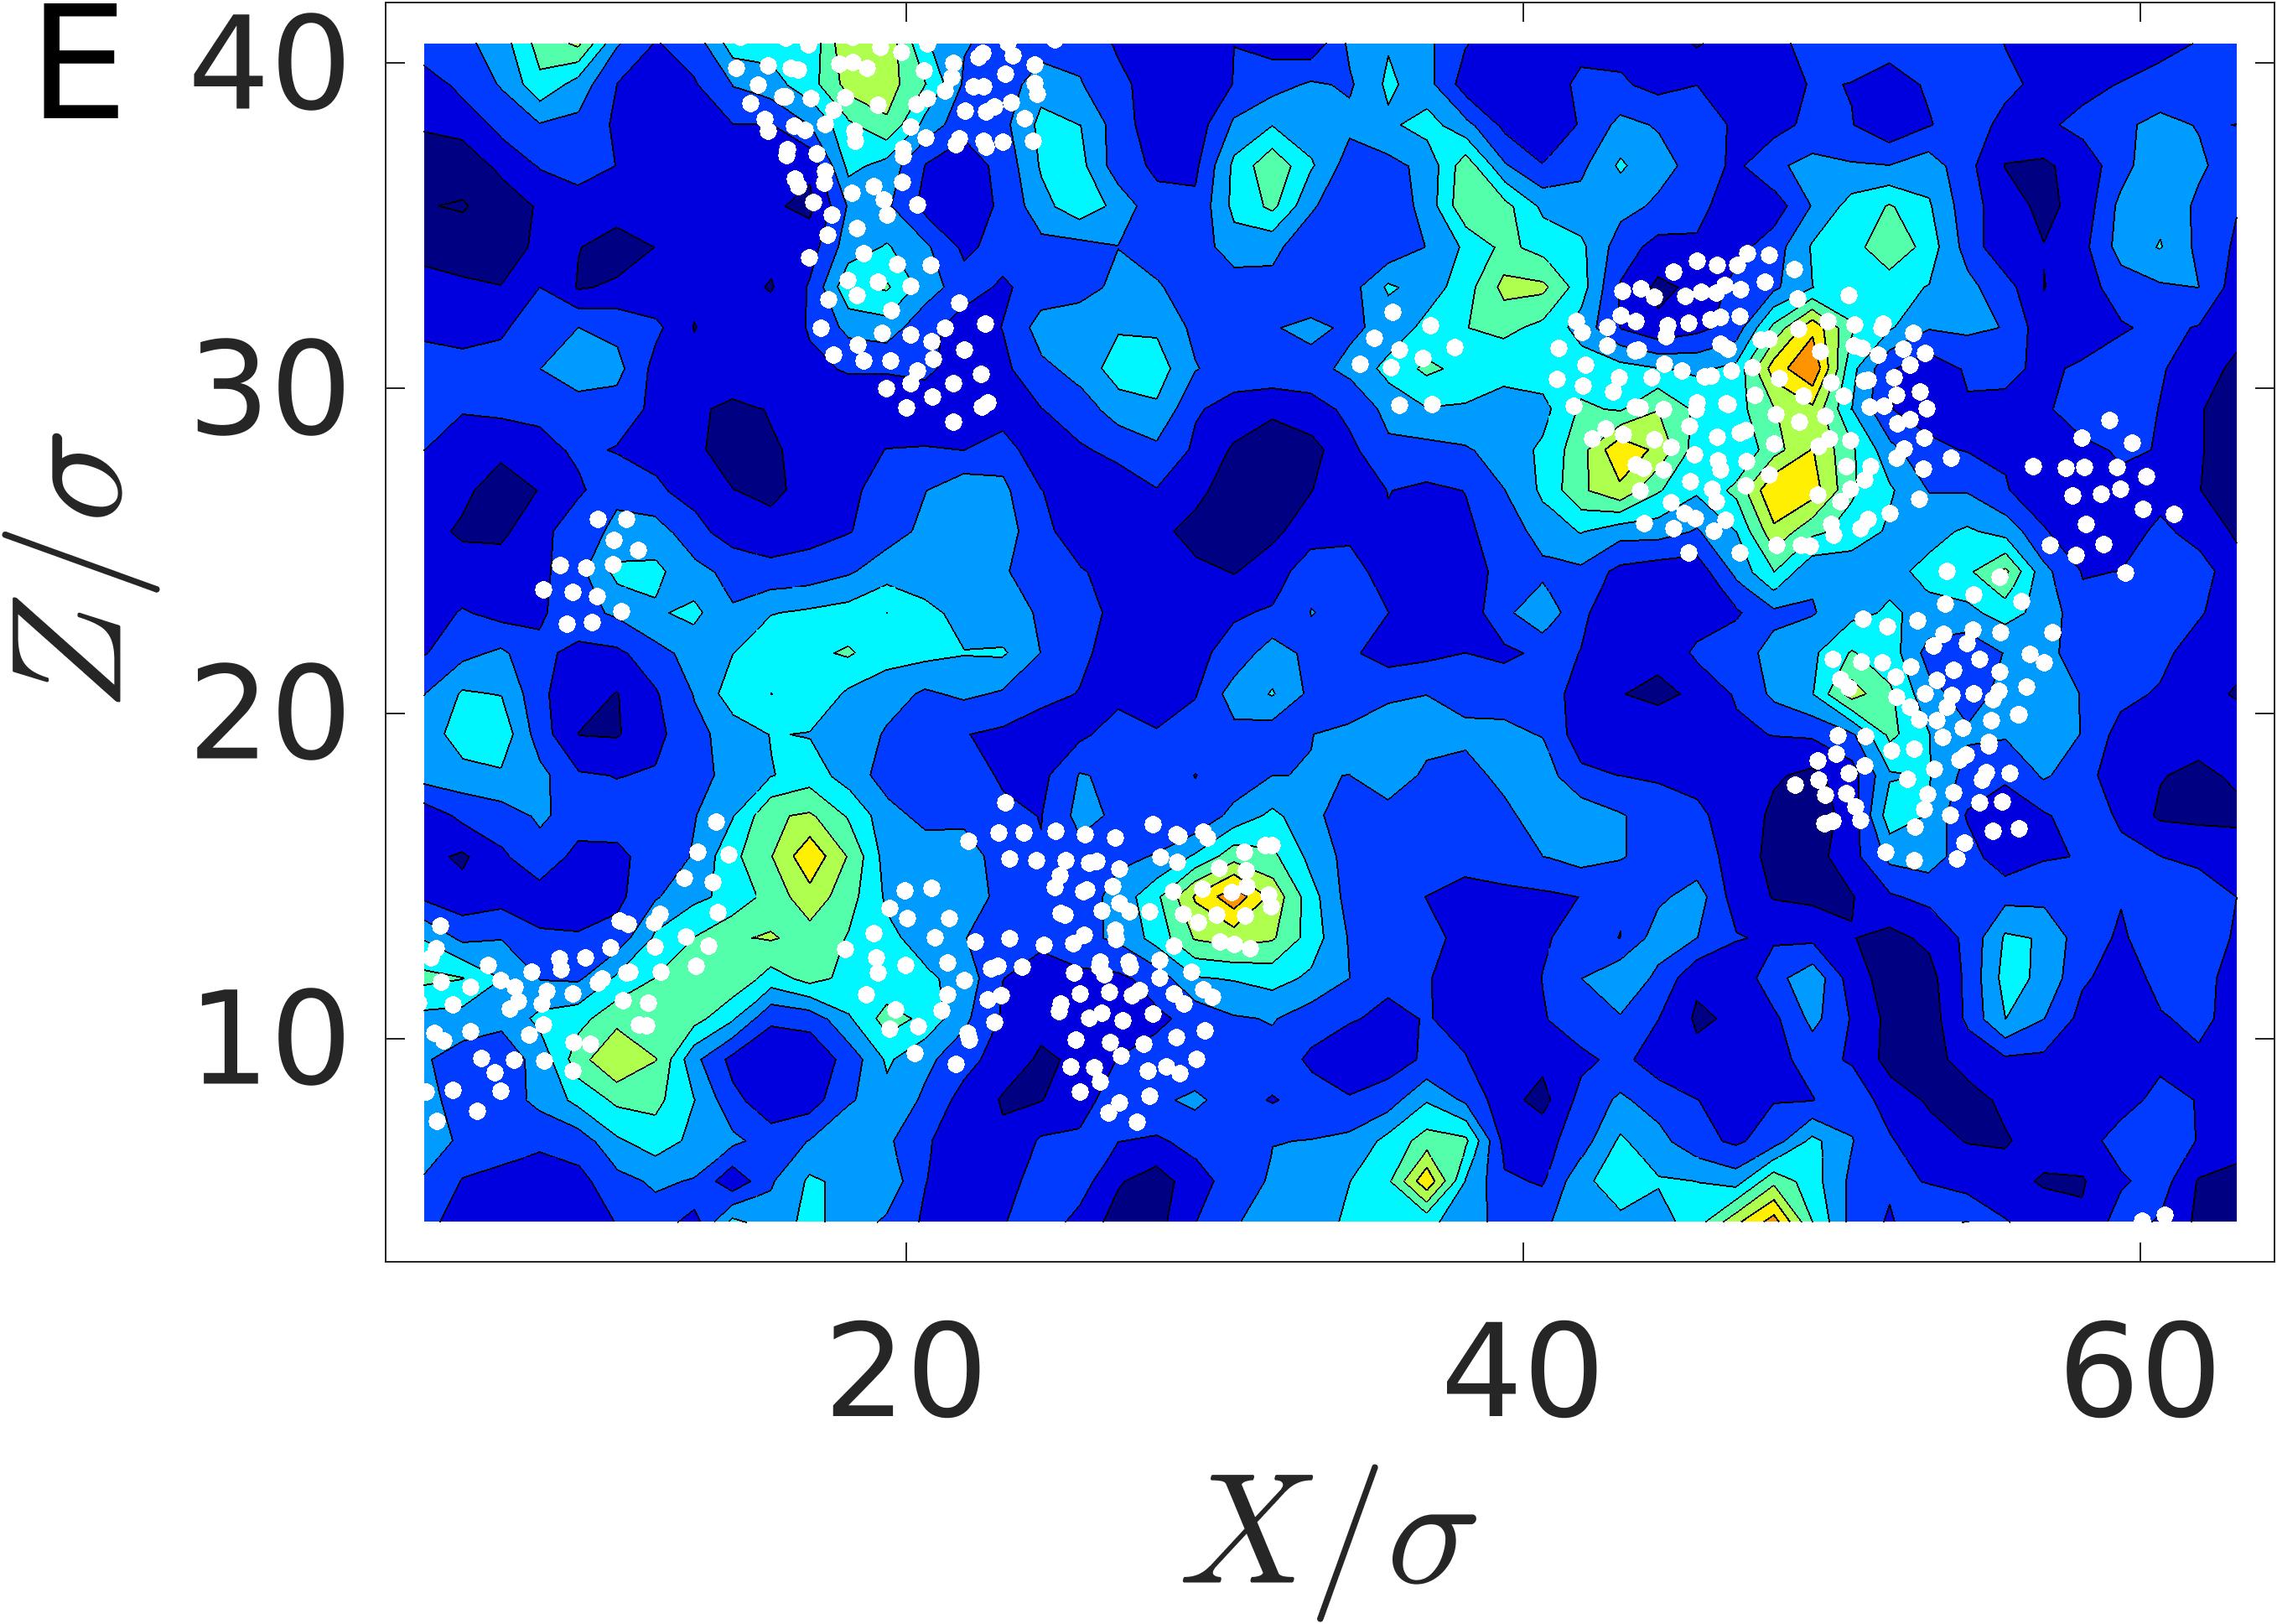
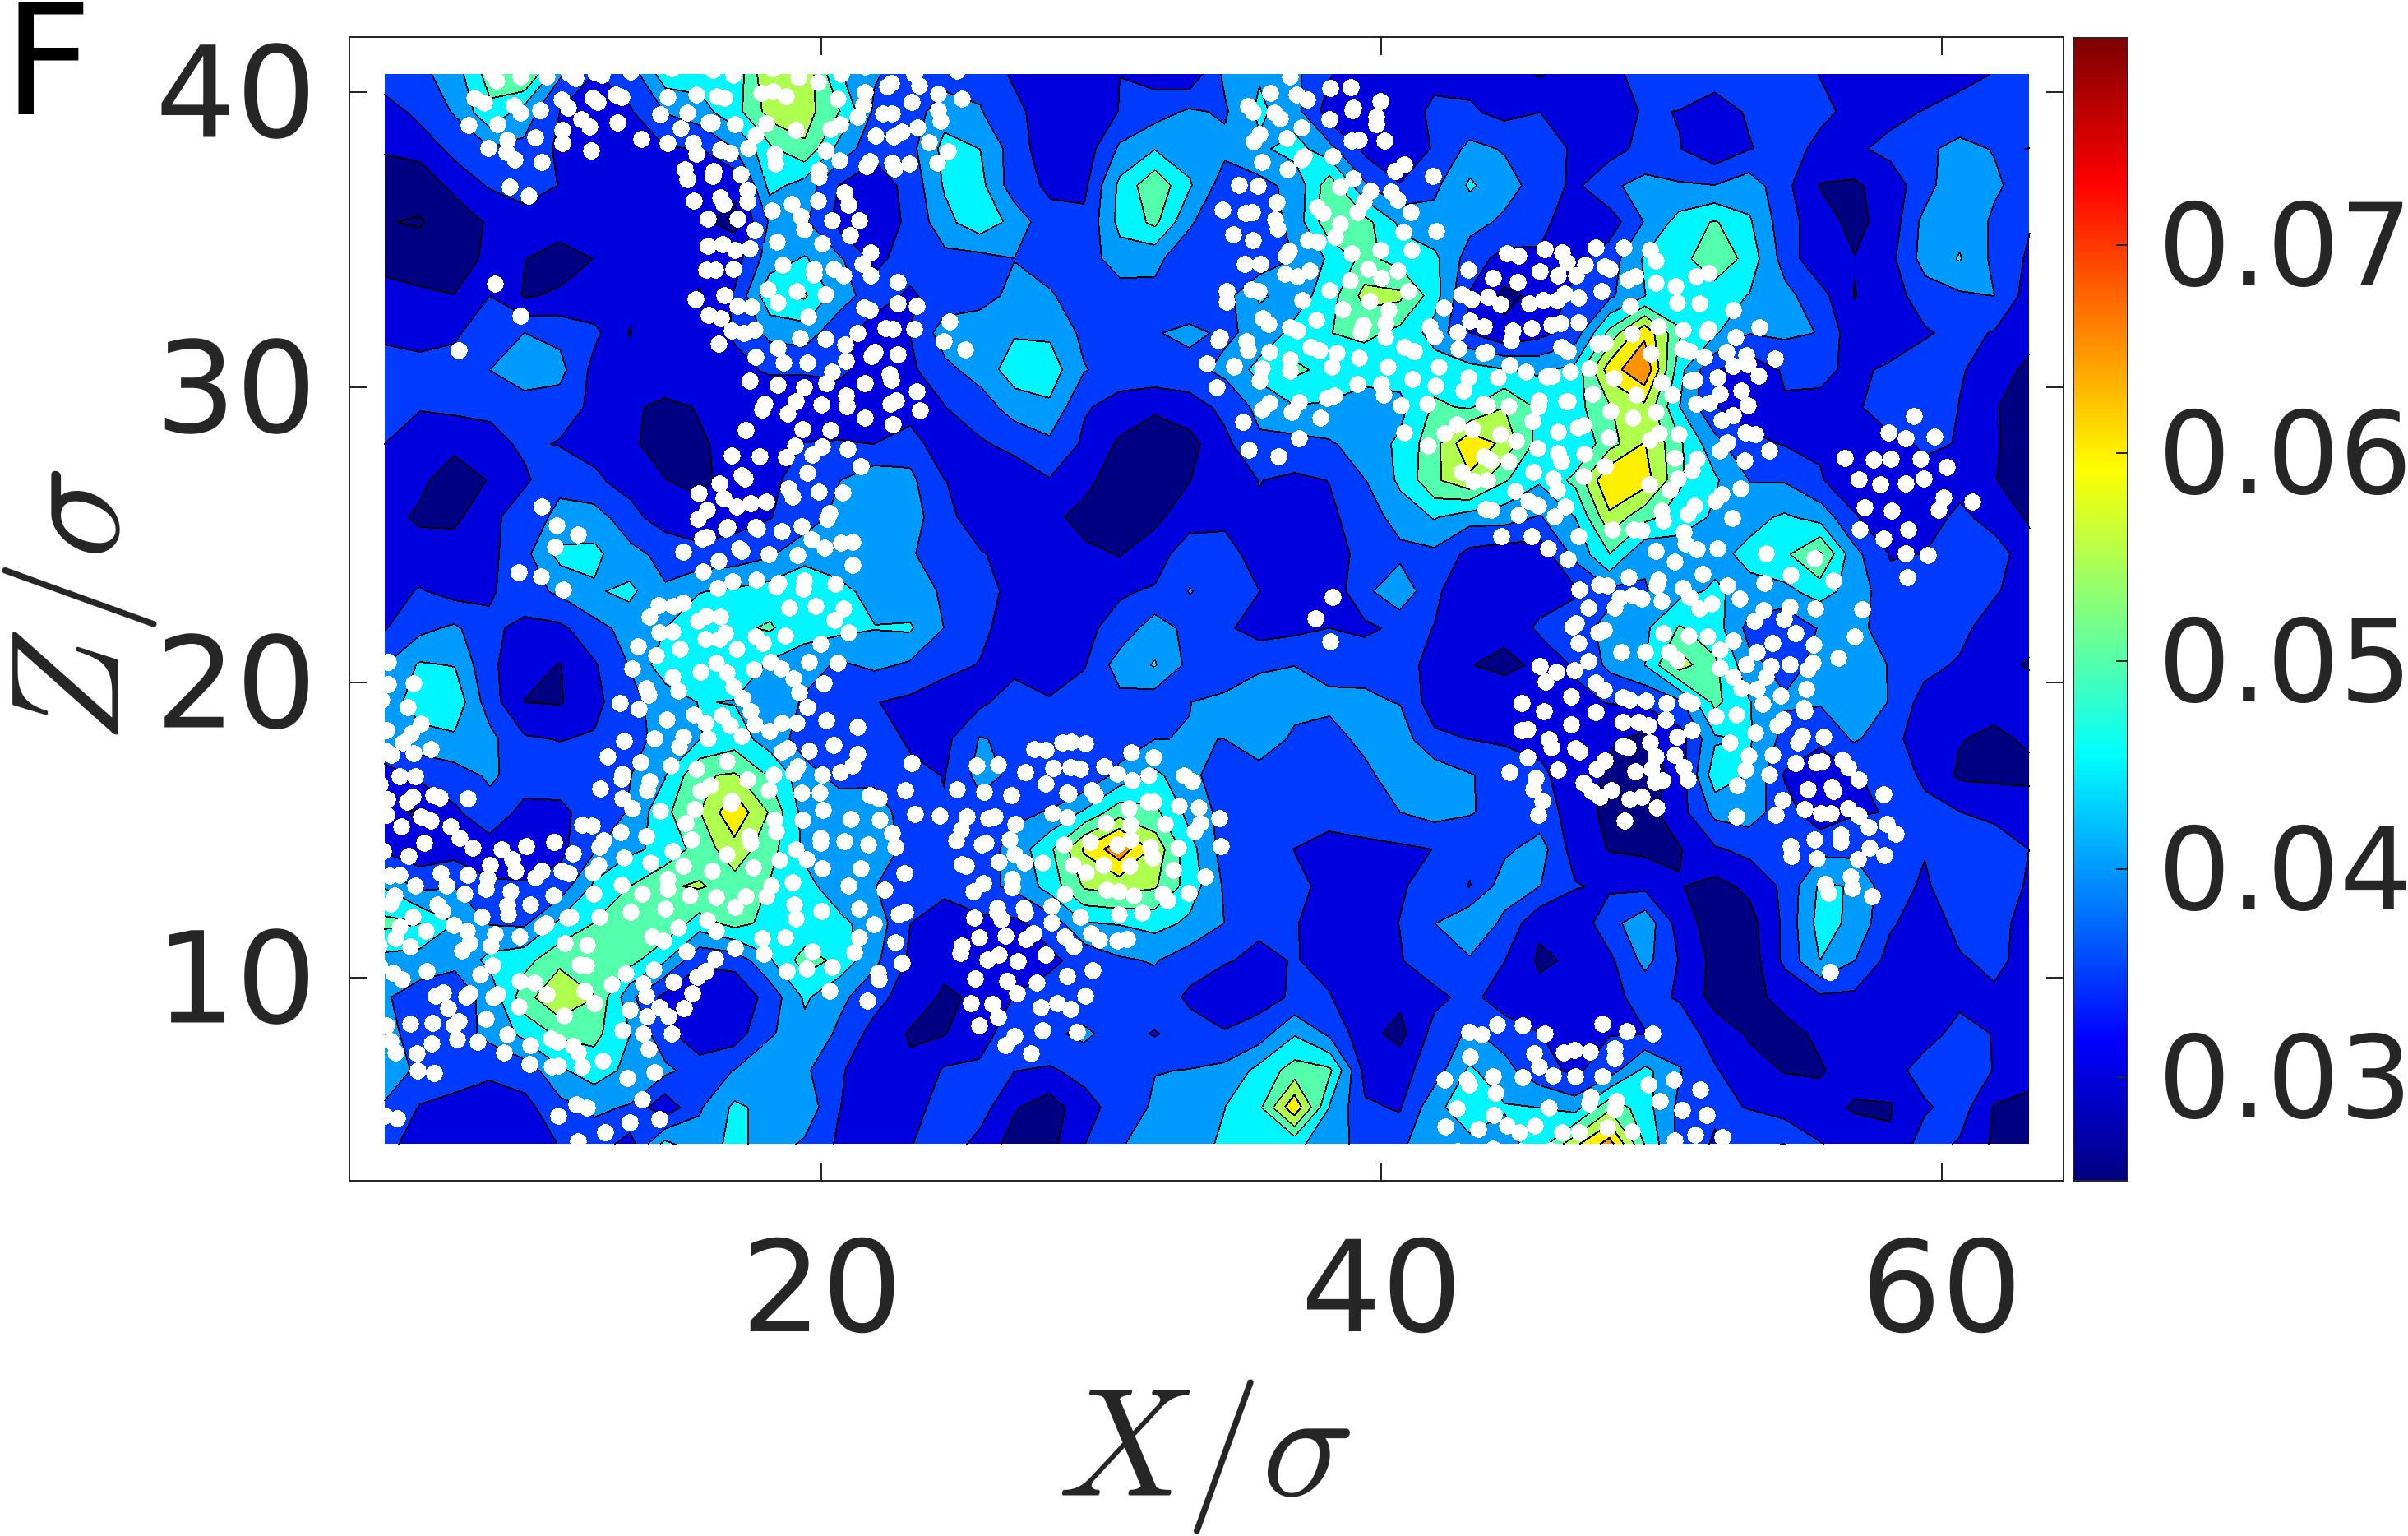
We next establish a causal relation between the structure and plastic events by analyzing the rearrangement probability of a particle based on its SOP, . The rearranging particles are identified using non-affine displacements; particles with are considered as undergoing plastic rearrangements. The threshold marks the onset of diffusive behavior of the average nonaffine displacements in the steady-state (see Material and Methods). We employ the same method used earlier for quiescent systems to compute . During the initial stages of shear at small , the deformation is largely elastic, with limited plastic deformation [Procaccia10]. Our experiments reveal only a small number of rearrangements within a typical observation window of . This observation is supported by Fig.S6B in the supporting information, which illustrates that the average non-affine displacements at and are smaller compared to steady-state values. Therefore, the presented in Fig.3C is calculated for and in the steady state. Consistent with experiments under quiescent conditions, we observe a positive correlation between rearrangements and SOP, thus affirming that particles with larger SOP are more likely to rearrange. Finally, we provide a visual impression of the structure-dynamics correlations in the steady state by identifying the rearrangements relative to a reference configuration at . Figures 3D-F depict the particles undergoing plastic rearrangements in white circles, with increasing strain at and , respectively, overlaid on a contour plot of the SOP of a reference configuration. Remarkably, as the system is sheared, the plastic events preferentially occur in regions that are associated with large SOP or in regions that are highly compliant with local deformation. These results provide direct confirmation of a causal relationship between structure and plastic activity in the system.
The results of our experiments are illuminating in light of earlier investigations. Experimental studies into sheared colloidal suspensions, based on mode coupling theory, successfully related shear stress to microscopic structure [41, 42, 43, 44, 45, 46]. Oscillatory shear measurements of 2D amorphous solids [47] investigated the correlation between relaxation rates of plastic flow and the structure quantified via excess entropy. However, these studies did not explore the correlation between local structure and plastic events under shear. Furthermore, a recent study using ML techniques [26] elucidated the universality of yield strain in a large class of amorphous solids by establishing a correlation to structural softness. Our study suggests that these correlations extend beyond yielding into the steady-state flow.
Concluding remarks
In conclusion, our findings demonstrate that the relaxation of dense amorphous colloidal suspensions, whether due to thermal fluctuations or weak applied shear, has a structural origin. We have elucidated this phenomenon using a local structural order parameter (SOP), which is the inverse of the local caging potential experienced by each particle due to its neighboring particles. The particles with large SOP are associated with loosely packed neighborhoods and the investigation of rearrangement probability and rank correlations, which correlate the SOP to rearrangements, confirms a strong causal relationship between the structure and dynamics. Therefore, the SOP effectively identifies localized defect-like regions in amorphous suspensions susceptible to particle rearrangements, leading to relaxation. Unlike in crystalline materials, where the dislocations or grain boundaries are extended objects, the weak-defective regions in amorphous materials appear to be localized. Thus, our study provides a fresh perspective on the plasticity of disordered solids centred on structural heterogeneity characterized by the effective caging potential. These insights could further our understanding of the structural role in the shear banding instability of complex fluids.
I Appendix
I.1 Experimental realization of 2D colloidal crystals
The monolayer of a 2D colloidal crystal was made by sedimenting silica beads of diameter in deionized(DI) water. The gravitational height of the particles was measured to be , which is smaller than the particle size. The 2D crystals thus formed contain vacancies and grain boundaries. The particles are imaged using bight-field microscopy with a field of view of . The features were found using particle tracking algorithm[50] and particles are obtained within the field of view.
I.2 Experimental realization of 3D colloidal crystals
The 3D crystal was created by suspending silica beads of in a mixture of glycerol and DI water to match the refractive index. To visualise the particles in 3D, a mM concentration of Rhodamine-6G dye was added to make the solvent fluorescent. The sample was left on the microscope for prior to measurement so that crystals formed with visible grains. The imaging was done using Leica-Dmi8 confocal microscope with a field of view of containing nearly particles.
I.3 Experimental realization of 2D amorphous suspensions
We have used a 50:50 binary mixture of silica colloids of diameters and and a size ratio . The colloids are dispersed in DI water and loaded into a thin chamber with a thickness of , which was created by sandwiching two coverslips using double-sided tape. The coverslips were plasma-cleaned to prevent the colloids from sticking to the glass surface. The particles were allowed to sediment under gravity to form an amorphous monolayer with a gravitational height of for the small and large particles, respectively. The sample was left on the microscope for approximately 2 hours before imaging. The number density of the colloids was varied to adjust their area fraction in the monolayer, and they were imaged in a region measuring at a frame rate of 21 frames per second. The trajectories of individual particles were determined using a standard particle tracking algorithm [50]. In this study, we investigated a range of area fractions from , which contained approximately to particles in the field of view.
I.4 Experimental techniques used for performing shear measurements
The shear experiments are performed using dense colloidal suspensions of sterically stabilized fluorescent polymethylmethacrylate particles in a density and refractive index matching mixture of cycloheptyl bromide and cis-decalin. The particles have a diameter of and a polydisperity of to prevent crystallization. The suspension was centrifuged at an elevated temperature to obtain a dense sediment, which was subsequently diluted to get a suspension of the desired volume fraction . The sample was sheared using a shear cell that had two parallel boundaries separated by a distance of along the direction [49]. A piezoelectric device was used to move the top boundary in the direction to apply a shear rate of . To prevent boundary-induced crystallization in our samples, the boundaries were coated with a layer of polydisperse particles. Confocal microscopy was used to image the individual particles and to determine their positions in three dimensions with an accuracy of in the horizontal and in the vertical direction. We tracked the motion of particles during a -min time interval by acquiring image stacks every . The data acquisition was made during a small observation window at various strain values .
I.5 Structural order parameter of a binary system
The local structural order parameter is the inverse depth of the local caging potential, which is expressed in real space as = . The local caging potential of a binary system is written as
| (2) |
where is the mollified particle level pair function for type particle[20]. It is expressed as
| (3) |
where is the Gaussian broadening factor that makes local continuous. The values of the broadening parameter in 2D and 3D systems were and , and respectively. For details see section and of SI.
I.6 Identifying rearrangements in quiescent suspensions
We define rearrangements in our 2D measurements based on their cage relative mean squared displacement(CR-MSD)[51], which is given by the following expression:
| (4) |
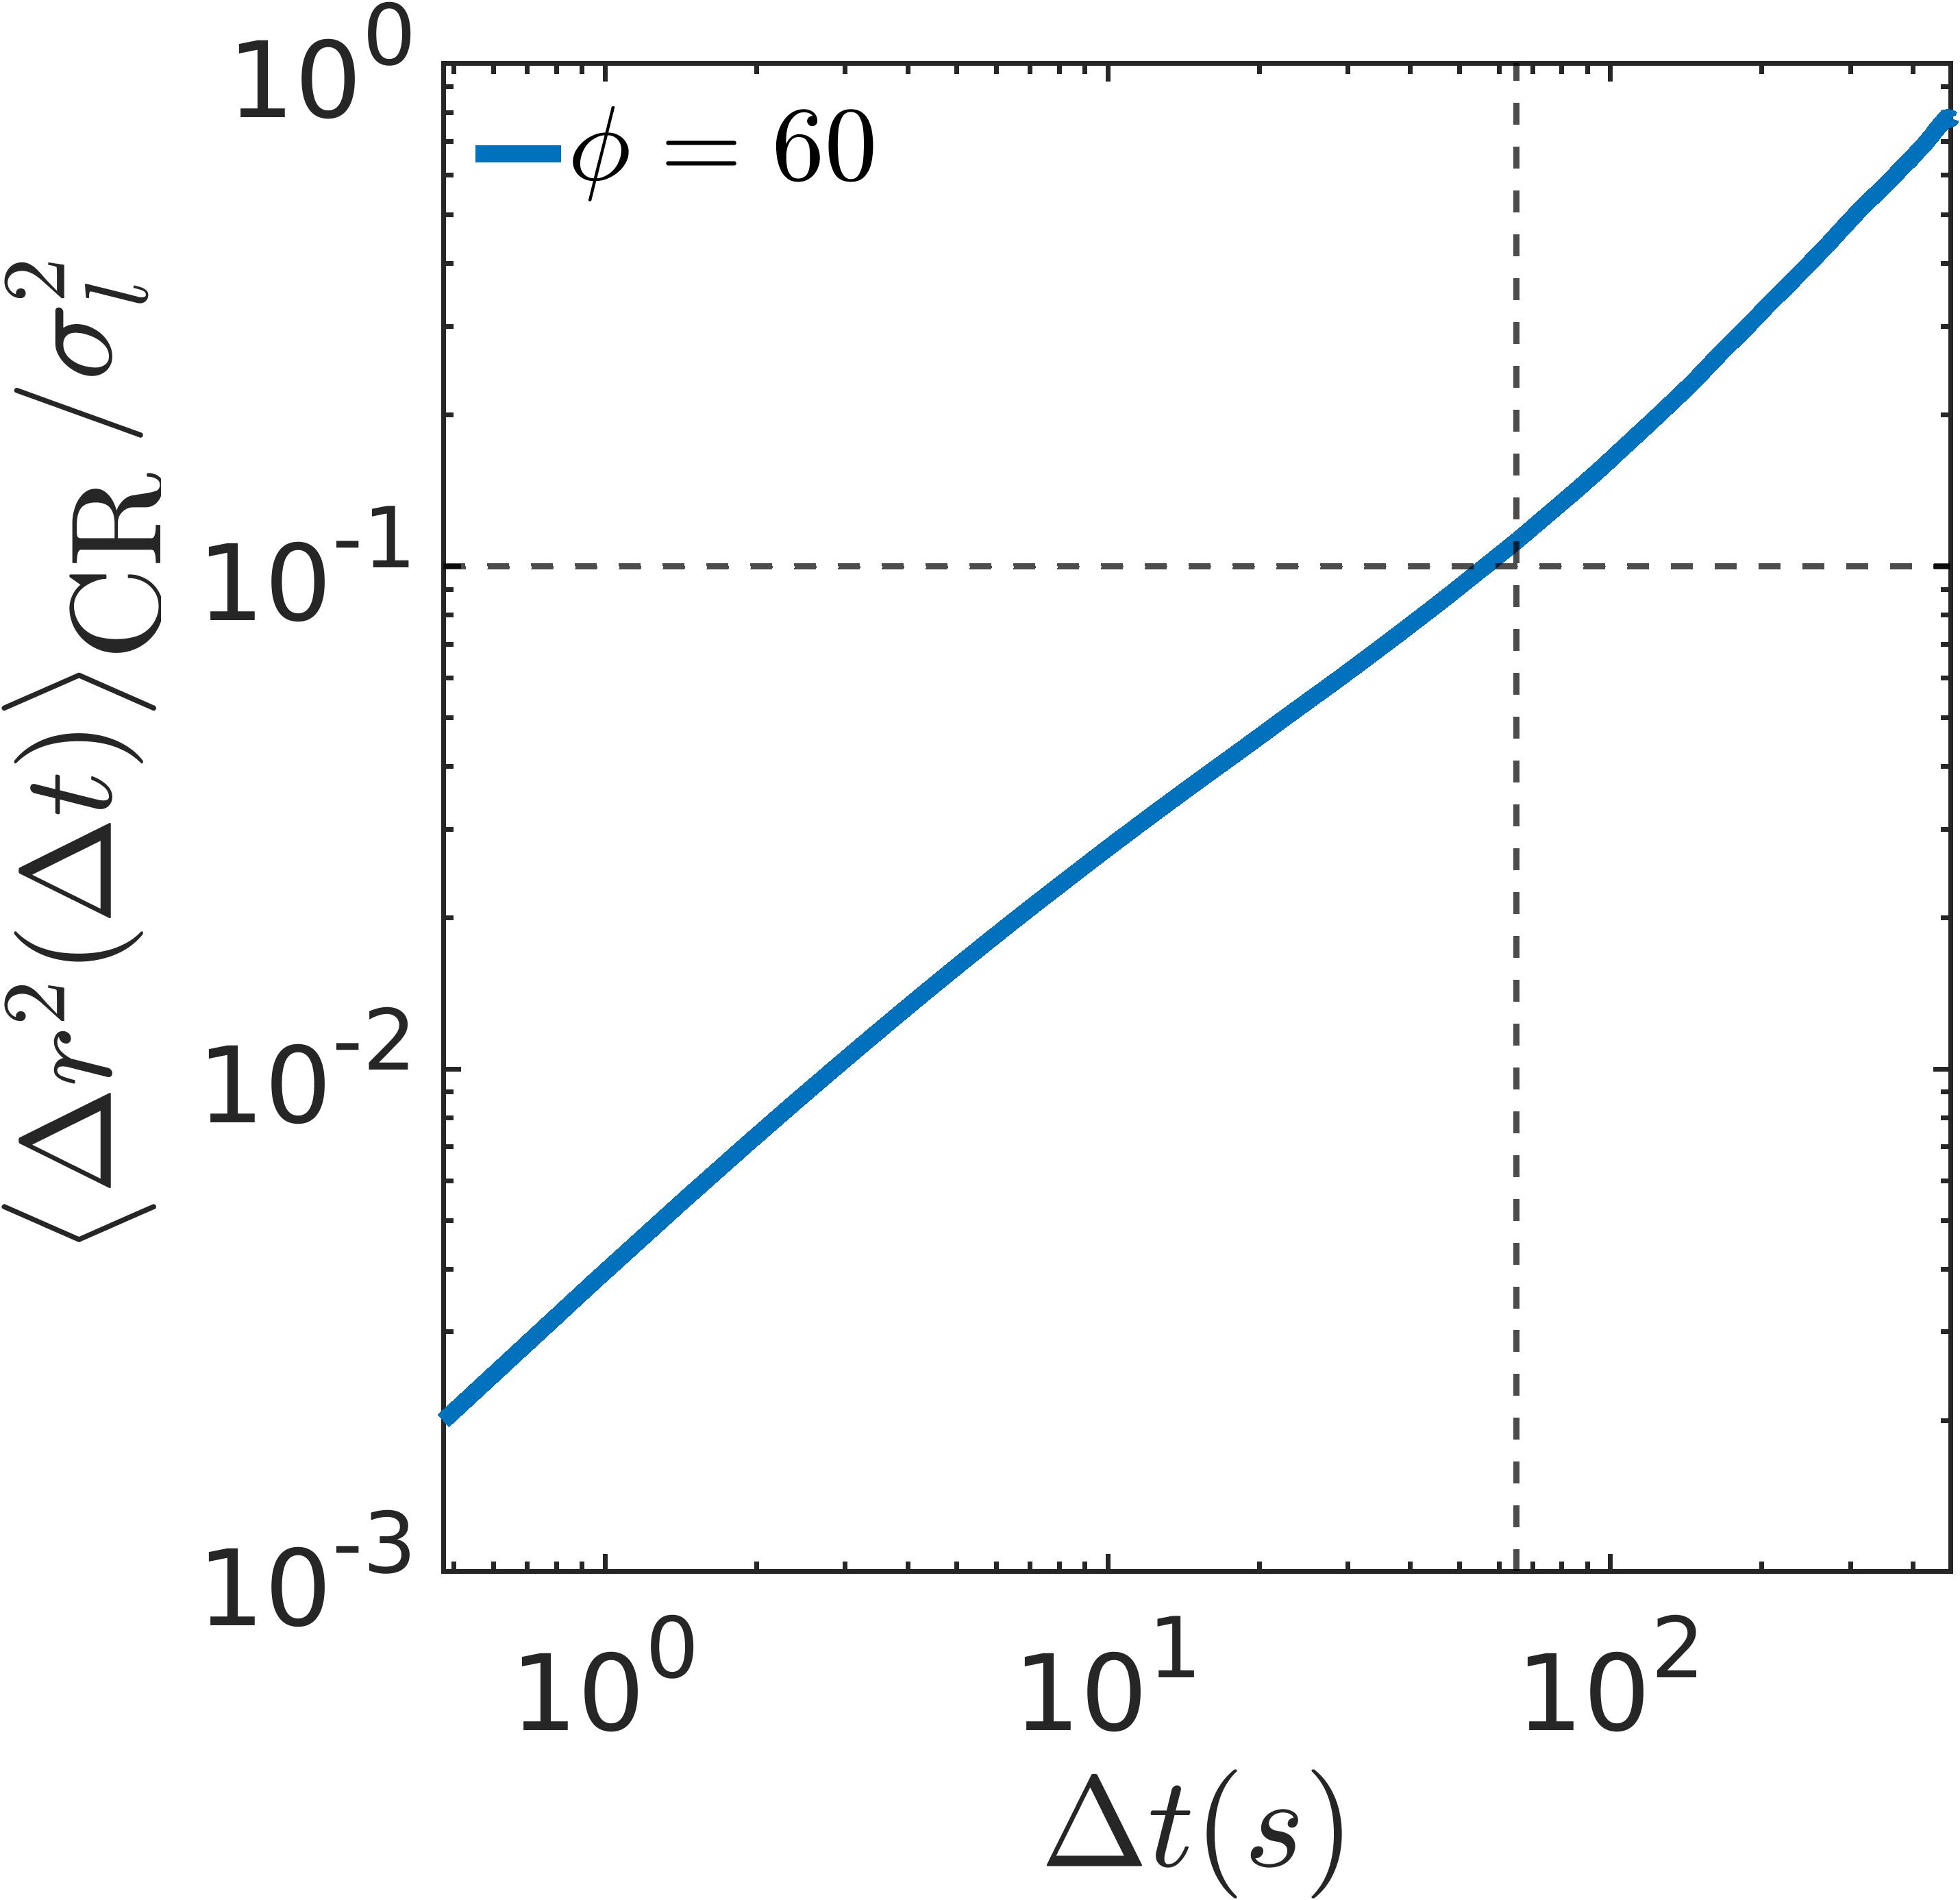
where , and is the number of nearest neighbors within a cutoff distance equal to first minima of . This is computed for the most dilute sample in our experiments, which has an area fraction of and is displayed in Fig.4. The black vertical line marks the timescale for the particles to transition from subdiffusive to diffusive motion. This corresponds to a timescale of and a normalized length scale of . We use these values to determine rearrangements in our 2D measurements. Any particle that has normalized cage relative displacement more than on the time scale is said to have rearranged.
I.7 Identifying rearrangements in suspensions under shear
The rearrangements under shear are identified from the non-affine displacements of particles, which is calculated using the following expression[6]:
| (5) |
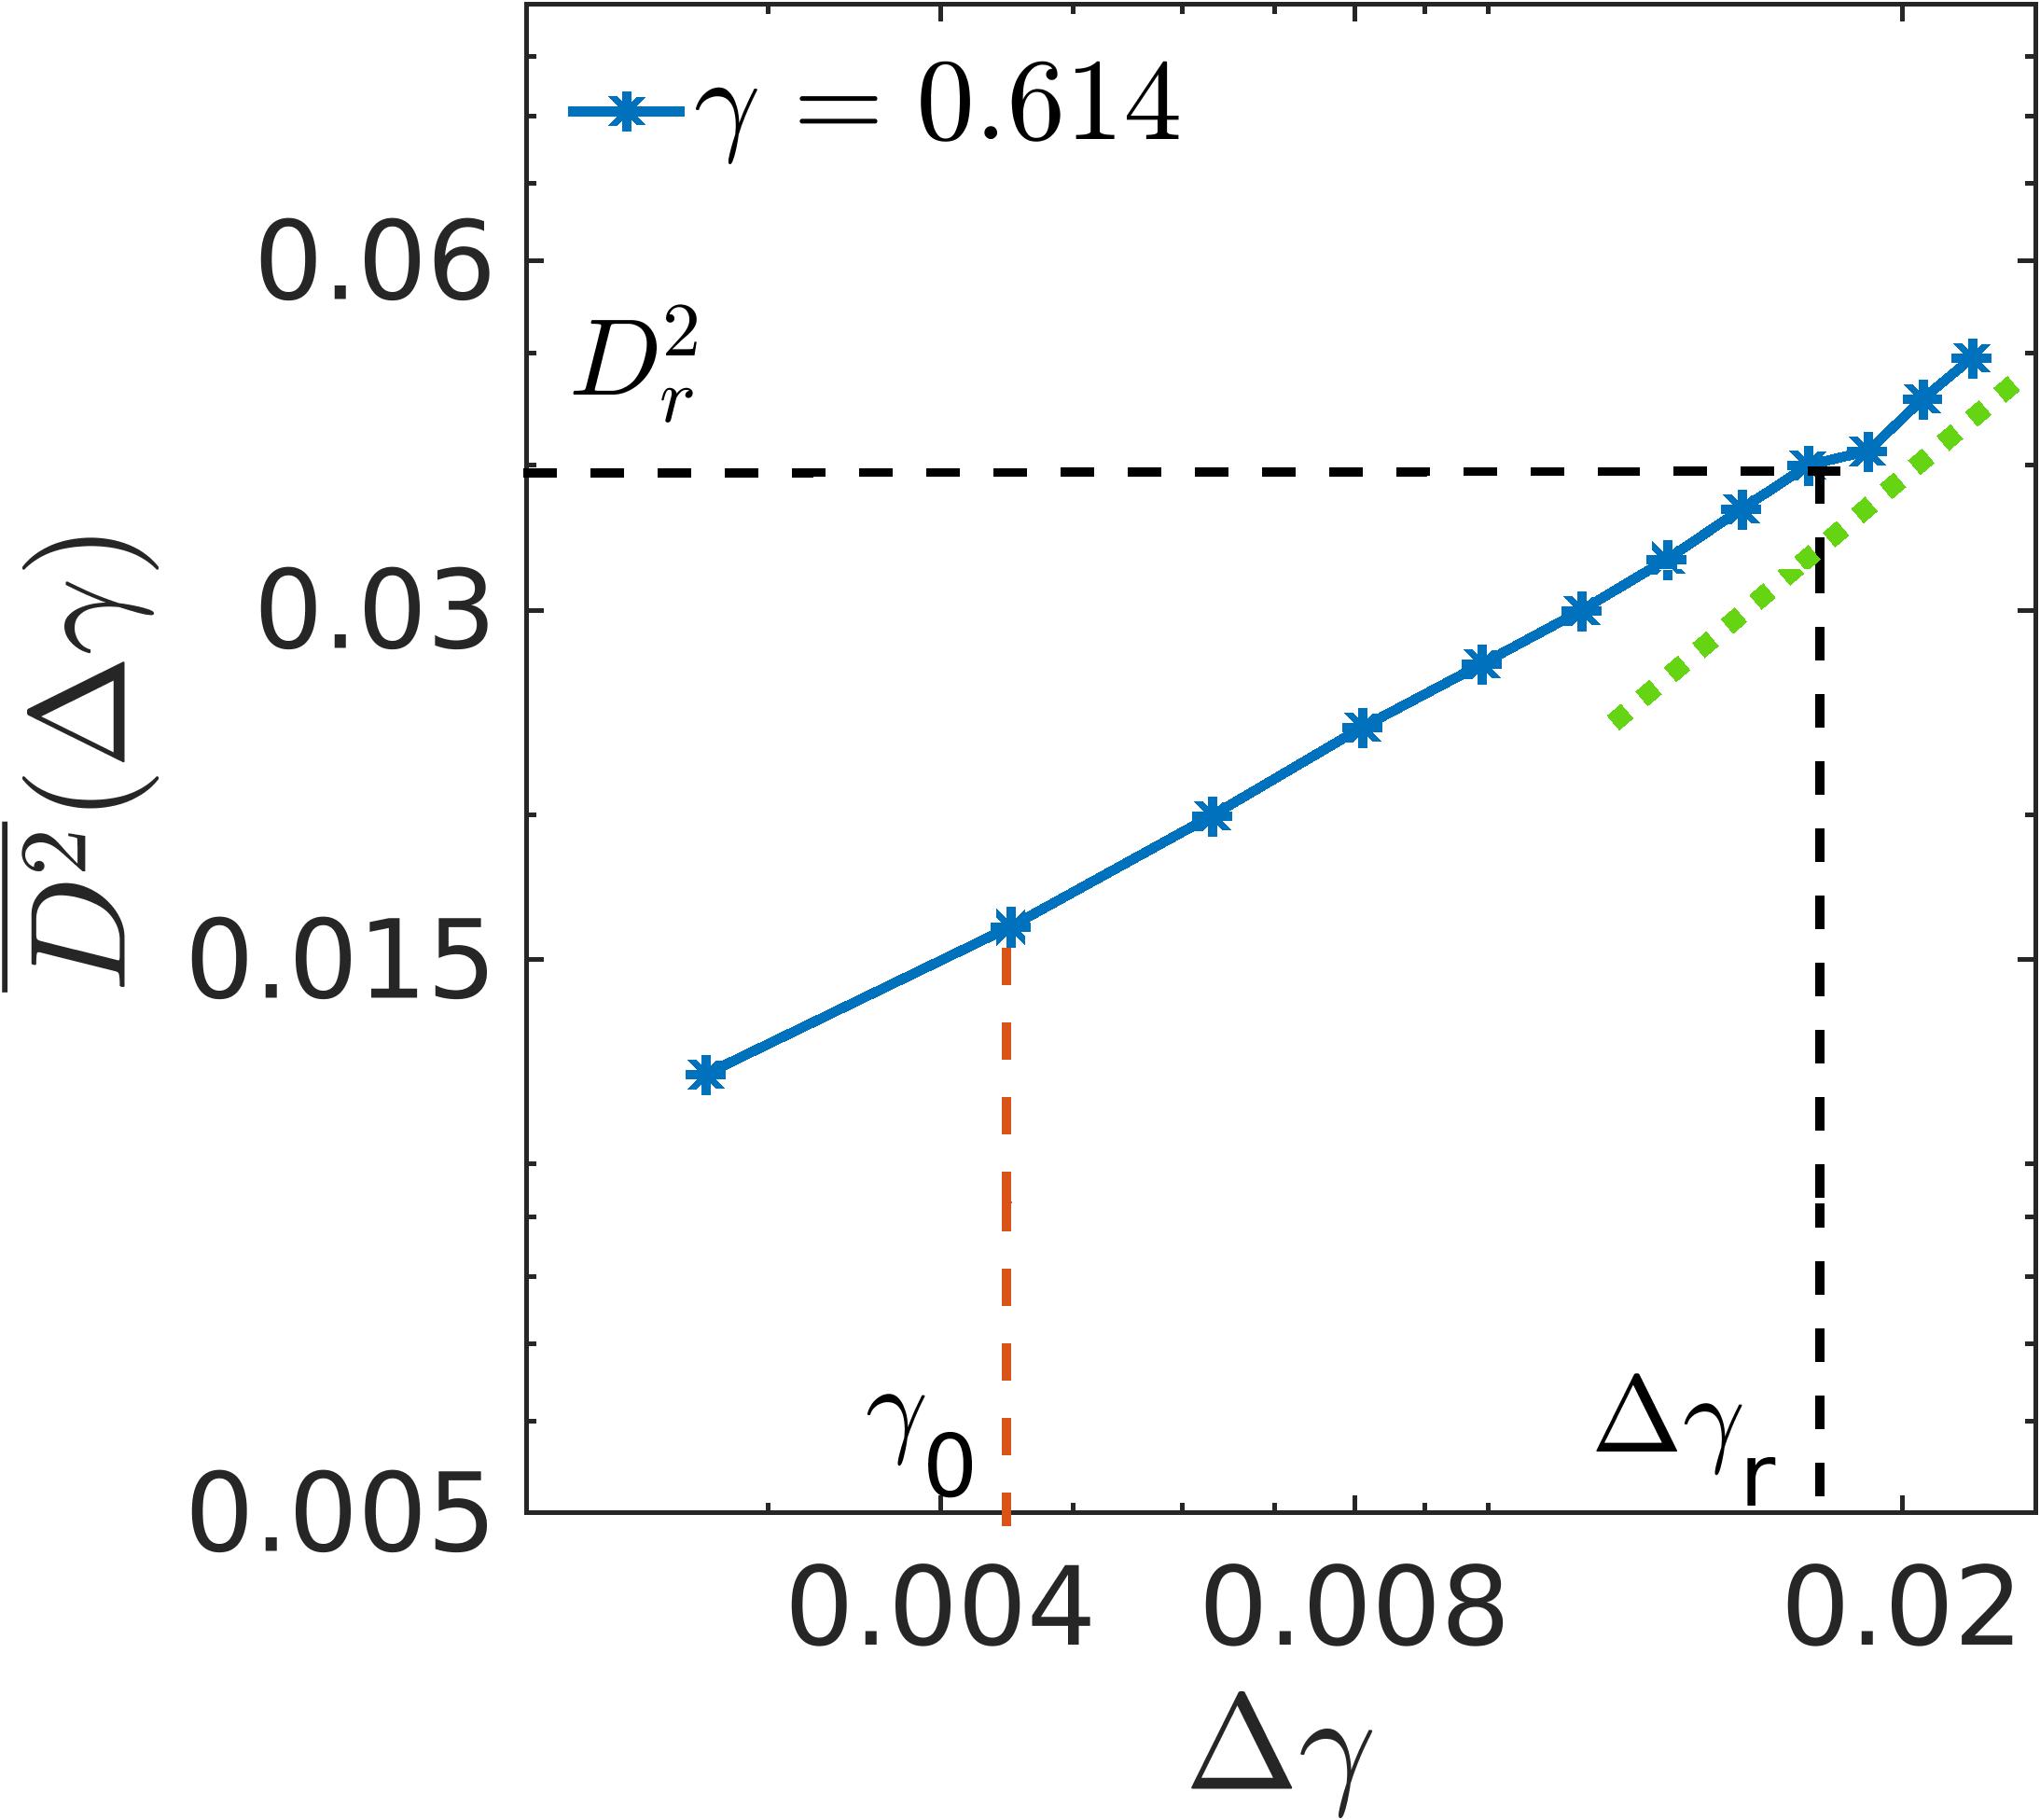
where the subscripts and represent the tagged particle and the nearest neighbors, respectively, and is the best-fit deformation tensor that minimizes . A plot of average non-affine displacements is shown in Fig.5 in the steady state at . The green solid line shows a line of slope . The red vertical line indicates , the smallest strain interval considered in our study. The black vertical line corresponds to a strain interval that marks the transition from sub-diffusive to diffusive motion. The non-affine displacement is the threshold value for identifying rearrangements. The rearranging particles are those that have on a strain scale .
I.8 Calculating the rearrangement probability
To calculate the rearrangement probability, denoted as , the local order parameter is divided into bins of equal width. For a given value of the order parameter, we determine the fraction of particles that undergo rearrangements relative to the total number of particles. This fraction is the rearrangement probability .
References
- Weeks et al. [2000] E. R. Weeks, J. C. Crocker, A. C. Levitt, A. Schofield, and D. A. Weitz, Three-dimensional direct imaging of structural relaxation near the colloidal glass transition, Science 287, 627 (2000).
- Berthier and Biroli [2011] L. Berthier and G. Biroli, Theoretical perspective on the glass transition and amorphous materials, Reviews of modern physics 83, 587 (2011).
- Berthier et al. [2011] L. Berthier, G. Biroli, J.-P. Bouchaud, L. Cipelletti, and W. van Saarloos, Dynamical heterogeneities in glasses, colloids, and granular media, Vol. 150 (OUP Oxford, 2011).
- Garrahan [2011] J. P. Garrahan, Dynamic heterogeneity comes to life, Proceedings of the national academy of sciences 108, 4701 (2011).
- Keys et al. [2007] A. S. Keys, A. R. Abate, S. C. Glotzer, and D. J. Durian, Measurement of growing dynamical length scales and prediction of the jamming transition in a granular material, Nature physics 3, 260 (2007).
- Falk and Langer [1998] M. L. Falk and J. S. Langer, Dynamics of viscoplastic deformation in amorphous solids, Physical Review E 57, 7192 (1998).
- Schall et al. [2007] P. Schall, D. A. Weitz, and F. Spaepen, Structural rearrangements that govern flow in colloidal glasses, Science 318, 1895 (2007).
- Turnbull and Cohen [1961] D. Turnbull and M. H. Cohen, Free-volume model of the amorphous phase: glass transition, The Journal of chemical physics 34, 120 (1961).
- Cohen and Grest [1979] M. H. Cohen and G. Grest, Liquid-glass transition, a free-volume approach, Physical Review B 20, 1077 (1979).
- Steinhardt et al. [1983] P. J. Steinhardt, D. R. Nelson, and M. Ronchetti, Bond-orientational order in liquids and glasses, Physical Review B 28, 784 (1983).
- Argon [1979] A. Argon, Plastic deformation in metallic glasses, Acta metallurgica 27, 47 (1979).
- Spaepen [1977] F. Spaepen, A microscopic mechanism for steady state inhomogeneous flow in metallic glasses, Acta metallurgica 25, 407 (1977).
- Widmer-Cooper et al. [2008] A. Widmer-Cooper, H. Perry, P. Harrowell, and D. R. Reichman, Irreversible reorganization in a supercooled liquid originates from localized soft modes, Nature Physics 4, 711 (2008).
- Ghosh et al. [2011] A. Ghosh, V. Chikkadi, P. Schall, and D. Bonn, Connecting structural relaxation with the low frequency modes in a hard-sphere colloidal glass, Physical Review Letters 107, 188303 (2011).
- Manning and Liu [2011] M. L. Manning and A. J. Liu, Vibrational modes identify soft spots in a sheared disordered packing, Physical Review Letters 107, 108302 (2011).
- Malins et al. [2013] A. Malins, S. R. Williams, J. Eggers, and C. P. Royall, Identification of structure in condensed matter with the topological cluster classification, The Journal of chemical physics 139 (2013).
- Leocmach and Tanaka [2012] M. Leocmach and H. Tanaka, Roles of icosahedral and crystal-like order in the hard spheres glass transition, Nature communications 3, 974 (2012).
- Hallett et al. [2018] J. E. Hallett, F. Turci, and C. P. Royall, Local structure in deeply supercooled liquids exhibits growing lengthscales and dynamical correlations, Nature communications 9, 3272 (2018).
- Piaggi et al. [2017] P. M. Piaggi, O. Valsson, and M. Parrinello, Enhancing entropy and enthalpy fluctuations to drive crystallization in atomistic simulations, Physical Review Letters 119, 015701 (2017).
- Piaggi and Parrinello [2017] P. M. Piaggi and M. Parrinello, Entropy based fingerprint for local crystalline order, The Journal of chemical physics 147, 114112 (2017).
- Tong and Tanaka [2020] H. Tong and H. Tanaka, Role of attractive interactions in structure ordering and dynamics of glass-forming liquids, Physical Review Letters 124, 225501 (2020).
- Richard et al. [2020] D. Richard, M. Ozawa, S. Patinet, E. Stanifer, B. Shang, S. Ridout, B. Xu, G. Zhang, P. Morse, J.-L. Barrat, et al., Predicting plasticity in disordered solids from structural indicators, Physical Review Materials 4, 113609 (2020).
- Yang et al. [2016] X. Yang, R. Liu, M. Yang, W.-H. Wang, and K. Chen, Structures of local rearrangements in soft colloidal glasses, Physical review letters 116, 238003 (2016).
- Cubuk et al. [2015] E. D. Cubuk, S. S. Schoenholz, J. M. Rieser, B. D. Malone, J. Rottler, D. J. Durian, E. Kaxiras, and A. J. Liu, Identifying structural flow defects in disordered solids using machine-learning methods, Physical review letters 114, 108001 (2015).
- Schoenholz et al. [2016] S. S. Schoenholz, E. D. Cubuk, D. M. Sussman, E. Kaxiras, and A. J. Liu, A structural approach to relaxation in glassy liquids, Nature Physics 12, 469 (2016).
- Cubuk et al. [2017] E. D. Cubuk, R. Ivancic, S. S. Schoenholz, D. Strickland, A. Basu, Z. Davidson, J. Fontaine, J. L. Hor, Y.-R. Huang, Y. Jiang, et al., Structure-property relationships from universal signatures of plasticity in disordered solids, Science 358, 1033 (2017).
- Ma et al. [2019] X. Ma, Z. S. Davidson, T. Still, R. J. Ivancic, S. Schoenholz, A. Liu, and A. Yodh, Heterogeneous activation, local structure, and softness in supercooled colloidal liquids, Physical review letters 122, 028001 (2019).
- Bapst et al. [2020] V. Bapst, T. Keck, A. Grabska-Barwińska, C. Donner, E. D. Cubuk, S. S. Schoenholz, A. Obika, A. W. Nelson, T. Back, D. Hassabis, et al., Unveiling the predictive power of static structure in glassy systems, Nature Physics 16, 448 (2020).
- Ganapathi et al. [2021] D. Ganapathi, D. Chakrabarti, A. Sood, and R. Ganapathy, Structure determines where crystallization occurs in a soft colloidal glass, Nature Physics 17, 114 (2021).
- Sharp et al. [2018] T. A. Sharp, S. L. Thomas, E. D. Cubuk, S. S. Schoenholz, D. J. Srolovitz, and A. J. Liu, Machine learning determination of atomic dynamics at grain boundaries, Proceedings of the National Academy of Sciences 115, 10943 (2018).
- Tong and Tanaka [2018] H. Tong and H. Tanaka, Revealing hidden structural order controlling both fast and slow glassy dynamics in supercooled liquids, Physical Review X 8, 011041 (2018).
- Tong and Tanaka [2019] H. Tong and H. Tanaka, Structural order as a genuine control parameter of dynamics in simple glass formers, Nature communications 10, 5596 (2019).
- Nandi et al. [2017] M. K. Nandi, A. Banerjee, C. Dasgupta, and S. M. Bhattacharyya, Role of the pair correlation function in the dynamical transition predicted by mode coupling theory, Physical Review Letters 119, 265502 (2017).
- Nandi and Bhattacharyya [2021] M. K. Nandi and S. M. Bhattacharyya, Microscopic theory of softness in supercooled liquids, Physical Review Letters 126, 208001 (2021).
- Sharma et al. [2022] M. Sharma, M. K. Nandi, and S. M. Bhattacharyya, Identifying structural signature of dynamical heterogeneity via the local softness parameter, Physical Review E 105, 044604 (2022).
- Sharma et al. [2023] M. Sharma, M. K. Nandi, and S. Maitra Bhattacharyya, A comparative study of the correlation between the structure and the dynamics for systems interacting via attractive and repulsive potentials, The Journal of Chemical Physics 159 (2023).
- Ramakrishnan and Yussouff [1979] T. Ramakrishnan and M. Yussouff, First-principles order-parameter theory of freezing, Physical Review B 19, 2775 (1979).
- Kirkpatrick and Wolynes [1987] T. Kirkpatrick and P. Wolynes, Connections between some kinetic and equilibrium theories of the glass transition, Physical Review A 35, 3072 (1987).
- Reinhardt and Brader [2012] J. Reinhardt and J. M. Brader, Dynamics of localized particles from density functional theory, Physical Review E 85, 011404 (2012).
- Hansen and McDonald [1986] J. P. Hansen and I. R. McDonald, The Theory of Simple Liquids, 2nd ed. ,Academic, London (1986).
- Fuchs and Cates [2009] M. Fuchs and M. E. Cates, A mode coupling theory for brownian particles in homogeneous steady shear flow, Journal of Rheology 53, 957 (2009).
- Amann et al. [2013] C. P. Amann, M. Siebenbürger, M. Krüger, F. Weysser, M. Ballauff, and M. Fuchs, Overshoots in stress-strain curves: Colloid experiments and schematic mode coupling theory, Journal of Rheology 57, 149 (2013).
- van der Vaart et al. [2013] K. van der Vaart, Y. Rahmani, R. Zargar, Z. Hu, D. Bonn, and P. Schall, Rheology of concentrated soft and hard-sphere suspensions, Journal of Rheology 57, 1195 (2013).
- Sentjabrskaja et al. [2018] T. Sentjabrskaja, J. Hendricks, A. R. Jacob, G. Petekidis, S. U. Egelhaaf, and M. Laurati, Binary colloidal glasses under transient stress-and strain-controlled shear, Journal of Rheology 62, 149 (2018).
- Koumakis et al. [2012] N. Koumakis, M. Laurati, S. Egelhaaf, J. Brady, and G. Petekidis, Yielding of hard-sphere glasses during start-up shear, Physical review letters 108, 098303 (2012).
- Laurati et al. [2012] M. Laurati, K. J. Mutch, N. Koumakis, J. Zausch, C. P. Amann, A. B. Schofield, G. Petekidis, J. F. Brady, J. Horbach, M. Fuchs, et al., Transient dynamics in dense colloidal suspensions under shear: Shear rate dependence, Journal of Physics: Condensed Matter 24, 464104 (2012).
- Galloway et al. [2020] K. L. Galloway, X. Ma, N. C. Keim, D. J. Jerolmack, A. G. Yodh, and P. E. Arratia, Scaling of relaxation and excess entropy in plastically deformed amorphous solids, Proceedings of the National Academy of Sciences 117, 11887 (2020).
- Ghosh et al. [2017] A. Ghosh, Z. Budrikis, V. Chikkadi, A. L. Sellerio, S. Zapperi, and P. Schall, Direct observation of percolation in the yielding transition of colloidal glasses, Physical review letters 118, 148001 (2017).
- Chikkadi et al. [2011] V. Chikkadi, G. Wegdam, D. Bonn, B. Nienhuis, and P. Schall, Long-range strain correlations in sheared colloidal glasses, Physical review letters 107, 198303 (2011).
- Crocker and Grier [1996] J. C. Crocker and D. G. Grier, Methods of digital video microscopy for colloidal studies, Journal of colloid and interface science 179, 298 (1996).
- Vivek et al. [2017] S. Vivek, C. P. Kelleher, P. M. Chaikin, and E. R. Weeks, Long-wavelength fluctuations and the glass transition in two dimensions and three dimensions, Proceedings of the National Academy of Sciences 114, 1850 (2017).