Giant Biconical Dust Filaments in the Starburst Galaxy NGC 1808
Abstract
We present the results from an analysis of multi-wavelength archival data on the multi-phase outflow in the starburst galaxy NGC 1808. We report the detection at 70 and 100 µm of dust filaments that extend up to 13 kpc from the galactic mid-plane and trace an edge-brightened biconical structure along the minor axis of the galaxy. The inner filaments are roughly co-spatial with previously identified optical dust filaments, extraplanar polycyclic aromatic hydrocarbon emission, and neutral and ionized gaseous outflows. The 70/160 µm flux ratio, a proxy for dust temperature, is elevated along the edges of the cones, indicating that the dusty medium has been driven out of the central regions of these cones and possibly shock-heated by a large-scale outflow. We establish lower limits on the extraplanar dust mass and mean height above the stellar disk of and kpc, respectively. The energy requirement of ergs needed to lift the dusty material, assuming Milky-Way like dust-to-gas ratio, can be supplied by the current starburst, with measured star formation rate of yr-1, over a timescale of Myr, where is the efficiency of energy transfer. We conclude that a starburst-driven outflow is the most likely mechanism by which the dust features were formed.
1 Introduction
Dust is expected to move in and out of galaxies, tied to the inflow and outflow of gas. Gas enters galaxies through galaxy mergers and accretion flows, and flows out of galaxies driven by the energy from stellar processes and active galactic nuclei (AGN). Indeed, dust has been inferred to exist outside of galaxies in the gravitationally bound circumgalactic medium (CGM, 100-300 kpc; Peek et al., 2015) and even the unbound intergalactic medium (IGM; 100-300 kpc; Ménard & Fukugita, 2012). Studies of dust on such large scales rely on the statistical measurements of excess reddening of background sources. The importance of these large-scale flows of gas and dust on the evolution of galaxies is an area of active research (Tumlinson et al., 2017; Veilleux et al., 2020; Faucher-Giguère & Oh, 2023).
Direct detection of dust outside of galaxies remains sparse, especially beyond 10 kpc. Ultraviolet light emitted by young stars and reflected off extraplanar dust has been detected in several nearby edge-on star-forming and active disk galaxies (Hoopes et al., 2005; Hodges-Kluck & Bregman, 2014; Seon et al., 2014; Hodges-Kluck et al., 2016; Shinn, 2018; Jo et al., 2018), but most of the dust observed in this fashion lies at vertical heights 5 kpc from the galactic disk mid-plane. Brighter UV sources are needed to probe the dust beyond this distance using this method. UV-scattered “cones” extending over 10-20 kpc along powerful gas outflows have been detected in a growing number of luminous quasars (Zakamska et al., 2006; Obied et al., 2016; Wylezalek et al., 2016, 2022; Veilleux et al., 2023).
A complementary method to study dust in and around galaxies is to search for the thermal radiation emitted by heated dust. Extraplanar mid-infrared (MIR) polycyclic aromatic hydrocarbon (PAH) emission out to 6 kpc has been reported in a few nearby edge-on starburst and active disk galaxies using the Spitzer Space Telescope (Spitzer; e.g., Engelbracht et al., 2006; McCormick et al., 2013). The James Webb Space Telescope (JWST; Gardner et al., 2006; Rigby et al., 2023) is rapidly building on the Spitzer legacy by providing exquisite MIR angular resolution and sensitivity to detect dust with K. However, the dust tied to the more distant CGM, far from the heat sources in the host galaxy, is expected to be cooler and therefore more easily detectable in the far-infrared (FIR), beyond the reach of JWST. The Herschel Science Archive (HSA111https://irsa.ipac.caltech.edu/applications/Herschel/) of the Herschel Space Observatory (Herschel; Pilbratt et al., 2010) has proven to be of great value to study the distribution and properties of the cool dust with temperatures K in and around nearby galaxies. In particular, deep Herschel observations of edge-on disk galaxies have revealed extraplanar dust typically extending up to heights 3 kpc but sometimes up to 10-25 kpc (Roussel et al., 2010; Meléndez et al., 2015; McCormick et al., 2018; Yoon et al., 2021; Veilleux et al., 2021).
The target of the present paper, NGC 1808, is a barred disk galaxy with inclination 57∘ (Koribalski et al., 1993) which has long been known to display conspicuous dust filaments that extend up to 3 kpc from the nucleus in optical broadband () color maps (Phillips, 1993). These filaments coincide with outflowing neutral-atomic gas filaments where the optical Na I D 5890, 5896 doublet feature is seen blueshifted in absorption and redshifted in emission (Phillips, 1993; Rupke et al., 2021). The inferred polar outflow is roughly along the minor axis of the stellar bar and large-scale disk (PA 45∘), where the northeast outflow lies in front of the disk and the southwest outflow is behind the disk (Koribalski et al., 1993; Sheth et al., 2010; Muñoz-Mateos et al., 2015). The neutral-atomic gas has deprojected outflow velocities of up to 450 km s-1 (Rupke et al., 2021). It is likely driven by the nuclear starburst in this system (Forbes et al., 1992; Krabbe et al., 1994; Junkes et al., 1995; Laurent et al., 2000; Heike & Awaki, 2007; Chen et al., 2023), although a low-luminosity, heavily obscured AGN, tentatively detected at high X-ray energies (Jiménez-Bailón et al., 2005) and millimeter wavelengths (Audibert et al., 2021), may also contribute to the outflow energetics. This dusty neutral-atomic outflow roughly coincides spatially with the H I 21-cm outflow reported by Koribalski et al. (1993), the dense cold molecular and neutral outflow studied by Salak et al. (2016, 2017, 2018, 2019) and Audibert et al. (2021), the warm-ionized gas outflow observed in optical line emission (e.g., Sharp & Bland-Hawthorn, 2010; Rupke et al., 2021), the hot-ionized outflow detected in the soft X-rays with ROSAT, Chandra, and XMM-Newton (Dahlem et al., 1994; Jiménez-Bailón et al., 2005), and possibly also the base of a linearly polarized non-thermal radio continuum structure that extends up to 7 kpc from the nucleus (Dahlem et al., 1990).
Here we report the results from a new analysis of the Herschel data on this object. These data are combined with the extensive set of ancillary data at other wavelengths to help us better understand our detection of cool-dust biconical filaments. Sec. 2 describes the multi-wavelength archival data used in our study. We present the results from our analysis of these data in Sec. 3 and discuss the implications of our results in Sec. 4. The conclusions are summarized in Sec. 5. We adopt a distance of 12.3 Mpc for NGC 1808 (Tully et al., 2009, 2013), corresponding to a scale of 59 pc per arcsecond, for the remainder of this paper.
2 Archival Data
A summary of the archival data used in the present study in given in Table 1.
| Telescope | Instrument | PI | Dataset | Exposure (s) | Beam FWHM (′′) |
|---|---|---|---|---|---|
| (1) | (2) | (3) | (4) | (5) | (6) |
| Spitzer | IRAC 4.5 m | D. Fisher | AOR 18284800 | 2072 | 1.78 |
| Spitzer | IRAC 8 m | D. Fisher | AOR 18284800 | 2072 | 3.16 |
| Herschel | PACS 70 m | E. Sturm | OBSID 1342204260 | 626 | 5.6 |
| Herschel | PACS 100 m | E. Sturm | OBSID 1342204262 | 626 | 6.8 |
| Herschel | PACS 160 m | E. Sturm | OBSID 1342204263 | 626 | 11.3 |
| Herschel | SPIRE 250 m | E. Sturm | OBSID 1342203633 | 1086 | 21.3 |
| Herschel | SPIRE 350 m | E. Sturm | OBSID 1342203633 | 1086 | 28.3 |
| Herschel | SPIRE 500 m | E. Sturm | OBSID 1342203633 | 1086 | 39.8 |
| GALEX | FUV Imager | N/A | NGS | 2769.2 | 4.0 |
| GALEX | NUV Imager | N/A | NGS | 7729.6 | 5.6 |
| XMM-Newton | Epic (pn, MOS1, MOS2) | F. Jansen | OBSID 0110980801 | 43606 | 6.0 |
2.1 Herschel
We use archival observations of NGC 1808 taken with the Herschel Photodetector Array Camera and Spectrometer (PACS) at 70 µm, 100 µm, and 160 µm under program ID KPGT_esturm_1. A pair of observations is taken initially at 70 µm and 160 µm followed by a pair of observations at 100 µm and 160 µm so we co-add the 160 µm maps. First, we background-subtract the images by averaging the medians of the flux measured within four elliptical areas far from the disk or extraplanar structures. We reproject all images to the pixel scale (16) and units (Jy pixel-1) of the 70 µm image in a process that conserves the flux. The 100 µm image does not need to be reprojected as its pixels already are 16 and have units of Jy pixel-1, but the 160 µm image has 32 pixels in the same units. The products are processed to Level 2.5 using the BULK_REPROCESSING SPG v14.2.0 pipeline processing mode and mapped with JScanamorphos. The 100 µm image displays a slight gradient in which the southeastern background is brighter than the northwestern background.
A series of observations was also taken with the Herschel Spectral and Photometric Imaging Receiver (SPIRE) at 250 µm, 350 µm, and 500 µm under KPGT_esturm_1. The respective pixel sizes of these images are 6″, 10″, and 14″. We reproject the background-subtracted SPIRE images to display with 1.6″ pixels, while also converting from the native flux density units of Jy beam-1 to Jy pixel-1. The SPIRE products are processed to Level 2 with SPG v14.1.0 and mapped with JScanamorphos.
2.2 Spitzer
We use mid-infrared observations from the Spitzer archives taken with the InfraRed Array Camera (IRAC) at 4.5 µm and 8 µm under program ID 30496. Both images have a pixel size of 122, and use native flux density units of MJy sr-1. We clean horizontal streak artifacts in the 8 µm image. We begin this process by selecting a region away from the disk that contains an artifact but extends slightly beyond the edges of the artifact into uncontaminated space. We calculate the difference between the median of the entire region and the median of the sub-region affected by the artifact, and subtract that value from the artifact. Because of a large area of pixels that sharply drop off to negative values west of the galaxy at 8 µm, we ignore the region 8 kpc west of the disk.
2.3 Ancillary Data
We use ultraviolet observations taken with the far-ultraviolet (FUV) and near-ultraviolet (NUV) imagers on board the Galaxy Evolution Explorer (GALEX) as part of the Near Galaxy Survey (NGS) mission, with wavelength ranges 1350-1750 Å and 1750-2800 Å, respectively. The pixels in both bands are 15. We background-subtract and reproject the GALEX images to the 16 pixel size of the 70 µm image. Additionally, we use a series of X-ray images taken with all three XMM-Newton European Photon Imaging Camera (EPIC) CCDs (MOS1, MOS2 & pn) . The XMM-Newton images span five energy bandpasses (, , , , and keV), and have 4″ pixels. The X-ray images are not background subtracted before reprojecting to the pixel size of the 70 µm image.
3 Results
3.1 Flux Maps
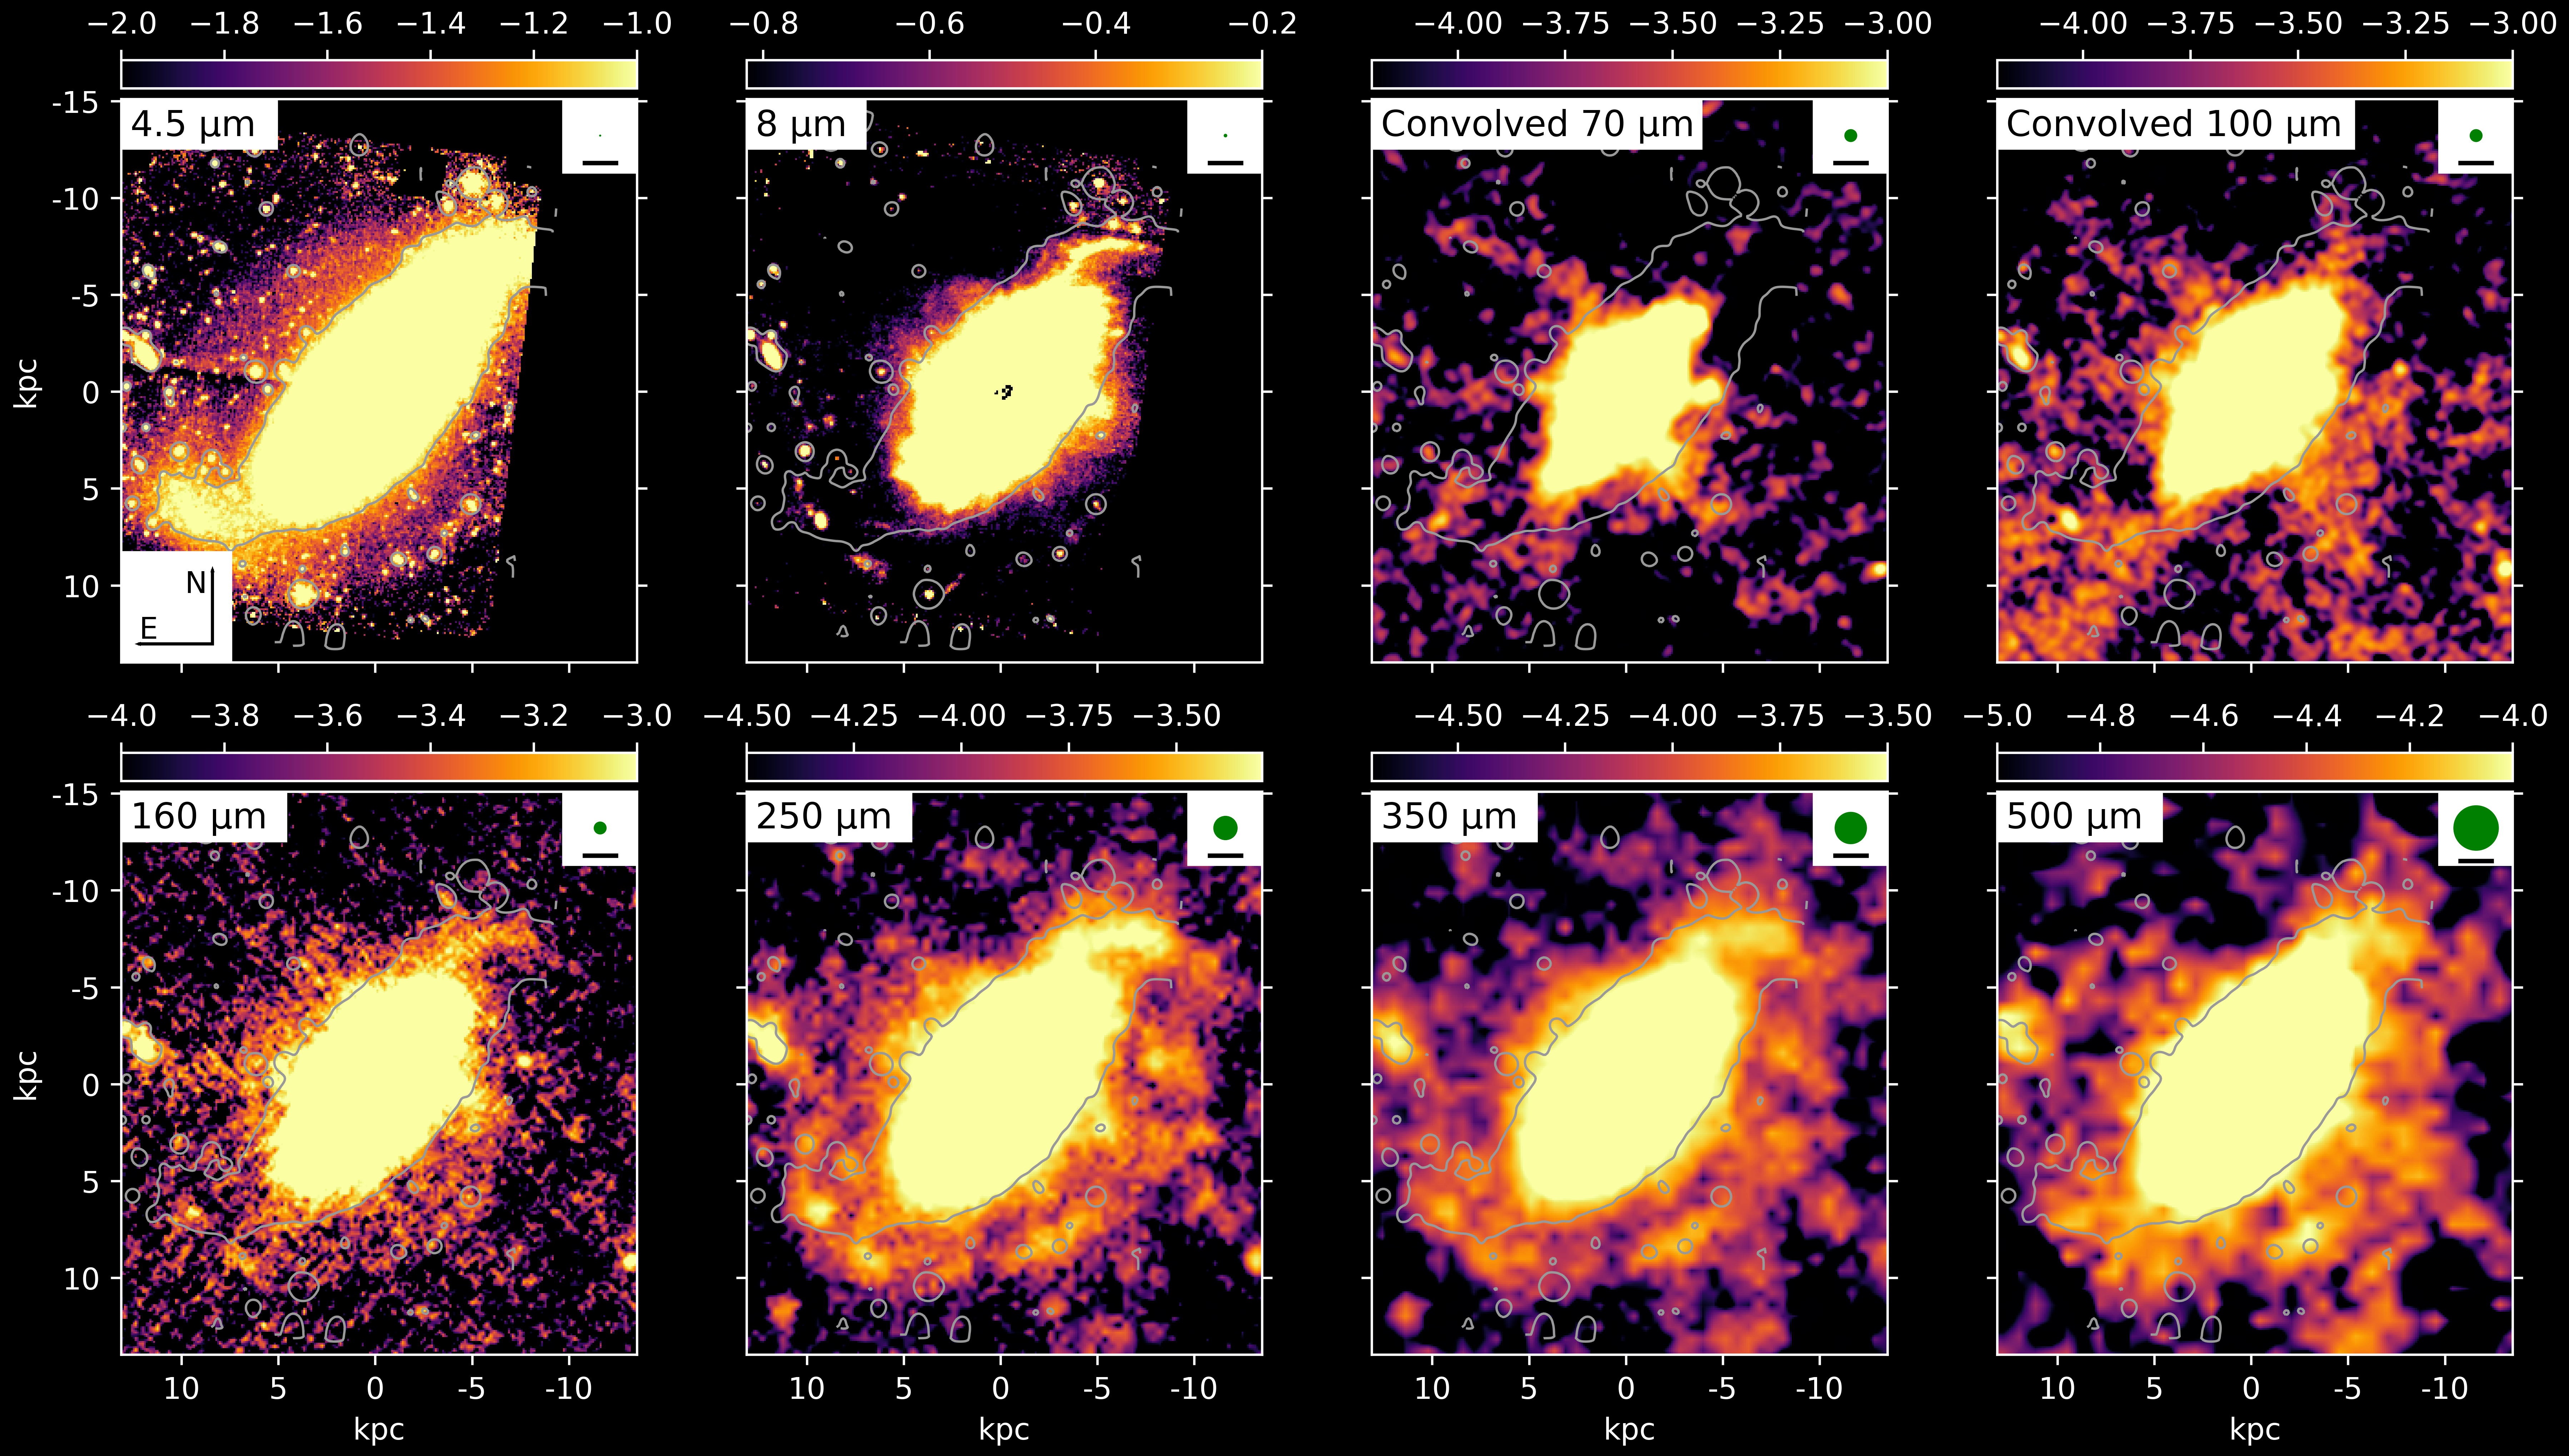
Both Spitzer images in Fig. 1 show the characteristic barred spiral structure of NGC 1808. At 4.5 µm, the emission largely traces the stellar continuum. We use the method outlined in McCormick et al. (2013) to derive a characteristic scale height, assuming the flux intensity decreases exponentially from the mid-line of the stellar bar (disk). For each pixel along the mid-line, we measure the distance from the mid-line until the relationship is satisfied, where is the distance from the mid-line, I() is the intensity at , and I0 is the intensity of the pixel in the mid-line. The scale height at that position along the mid-line is taken as the average of values measured on either side of the mid-line. We derive a scale height for the entire bar (disk) by averaging the scale height at each pixel along the mid-line, yielding a value of kpc, after correction for the inclination of the disk ().
In Fig. 1, we also show one of the isophotal contours of the bar where the 4.5 µm flux, after reprojection to the pixel scale of the 70 µm map and convolution to the resolution of the 160 µm map, is equal to 0.075 MJy sr-1, a value we chose for its ability to indicate where the spiral arms emerge from the bar without including fainter extraplanar emission.
At 8 µm, the emission from polycyclic aromatic hydrocarbons (PAHs) dominates and remains elevated at heights well beyond , where the 4.5 µm stellar component has mostly faded into the background (Fig. 1). We return to this result in Sec. 3.2, where we present the 8-to-4.5 µm flux ratio map to illustrate this point. The Herschel 70 µm and 100 µm maps in Fig. 1 show emission both in the northeastern extraplanar region analyzed by Phillips (1993) and southwest of the bar structure. The 70 µm map shows filamentary structures that extend out of the bar region (along lines A, B, C & D in Fig. 2), tracing a pattern that suggests the edges of a bicone. Filament B on the northern side extends out to a height of up to 13 kpc from the disk mid-plane. Here and throughout the text, we do not correct any height measurements for projection effects as the locations of these filaments with respect to the plane of the sky are uncertain. The two filaments in the southern extraplanar region are well-defined to a height of kpc above the disk, and then the emission becomes patchy out to 9 kpc from the bar, reaching the far southwestern edge of the image. The 100 µm map shows similar features. At 100 µm there is an apparent excess of flux in the southeastern corner of the image which likely is due to the slight positive gradient from NW to SE of the background intensity (discussed in Sec. 2.1). Part of this emission may also be due to cirrus-like emission in the disk of the host galaxy itself. The southernmost filament (line D) is not visible at 160 µm, and the overall flux distribution is less filamentary and more patchy. At longer wavelengths, in the SPIRE maps (Fig. 1), the filaments disappear and the structure of the spiral arms starts to emerge.
3.2 Flux Ratio Maps
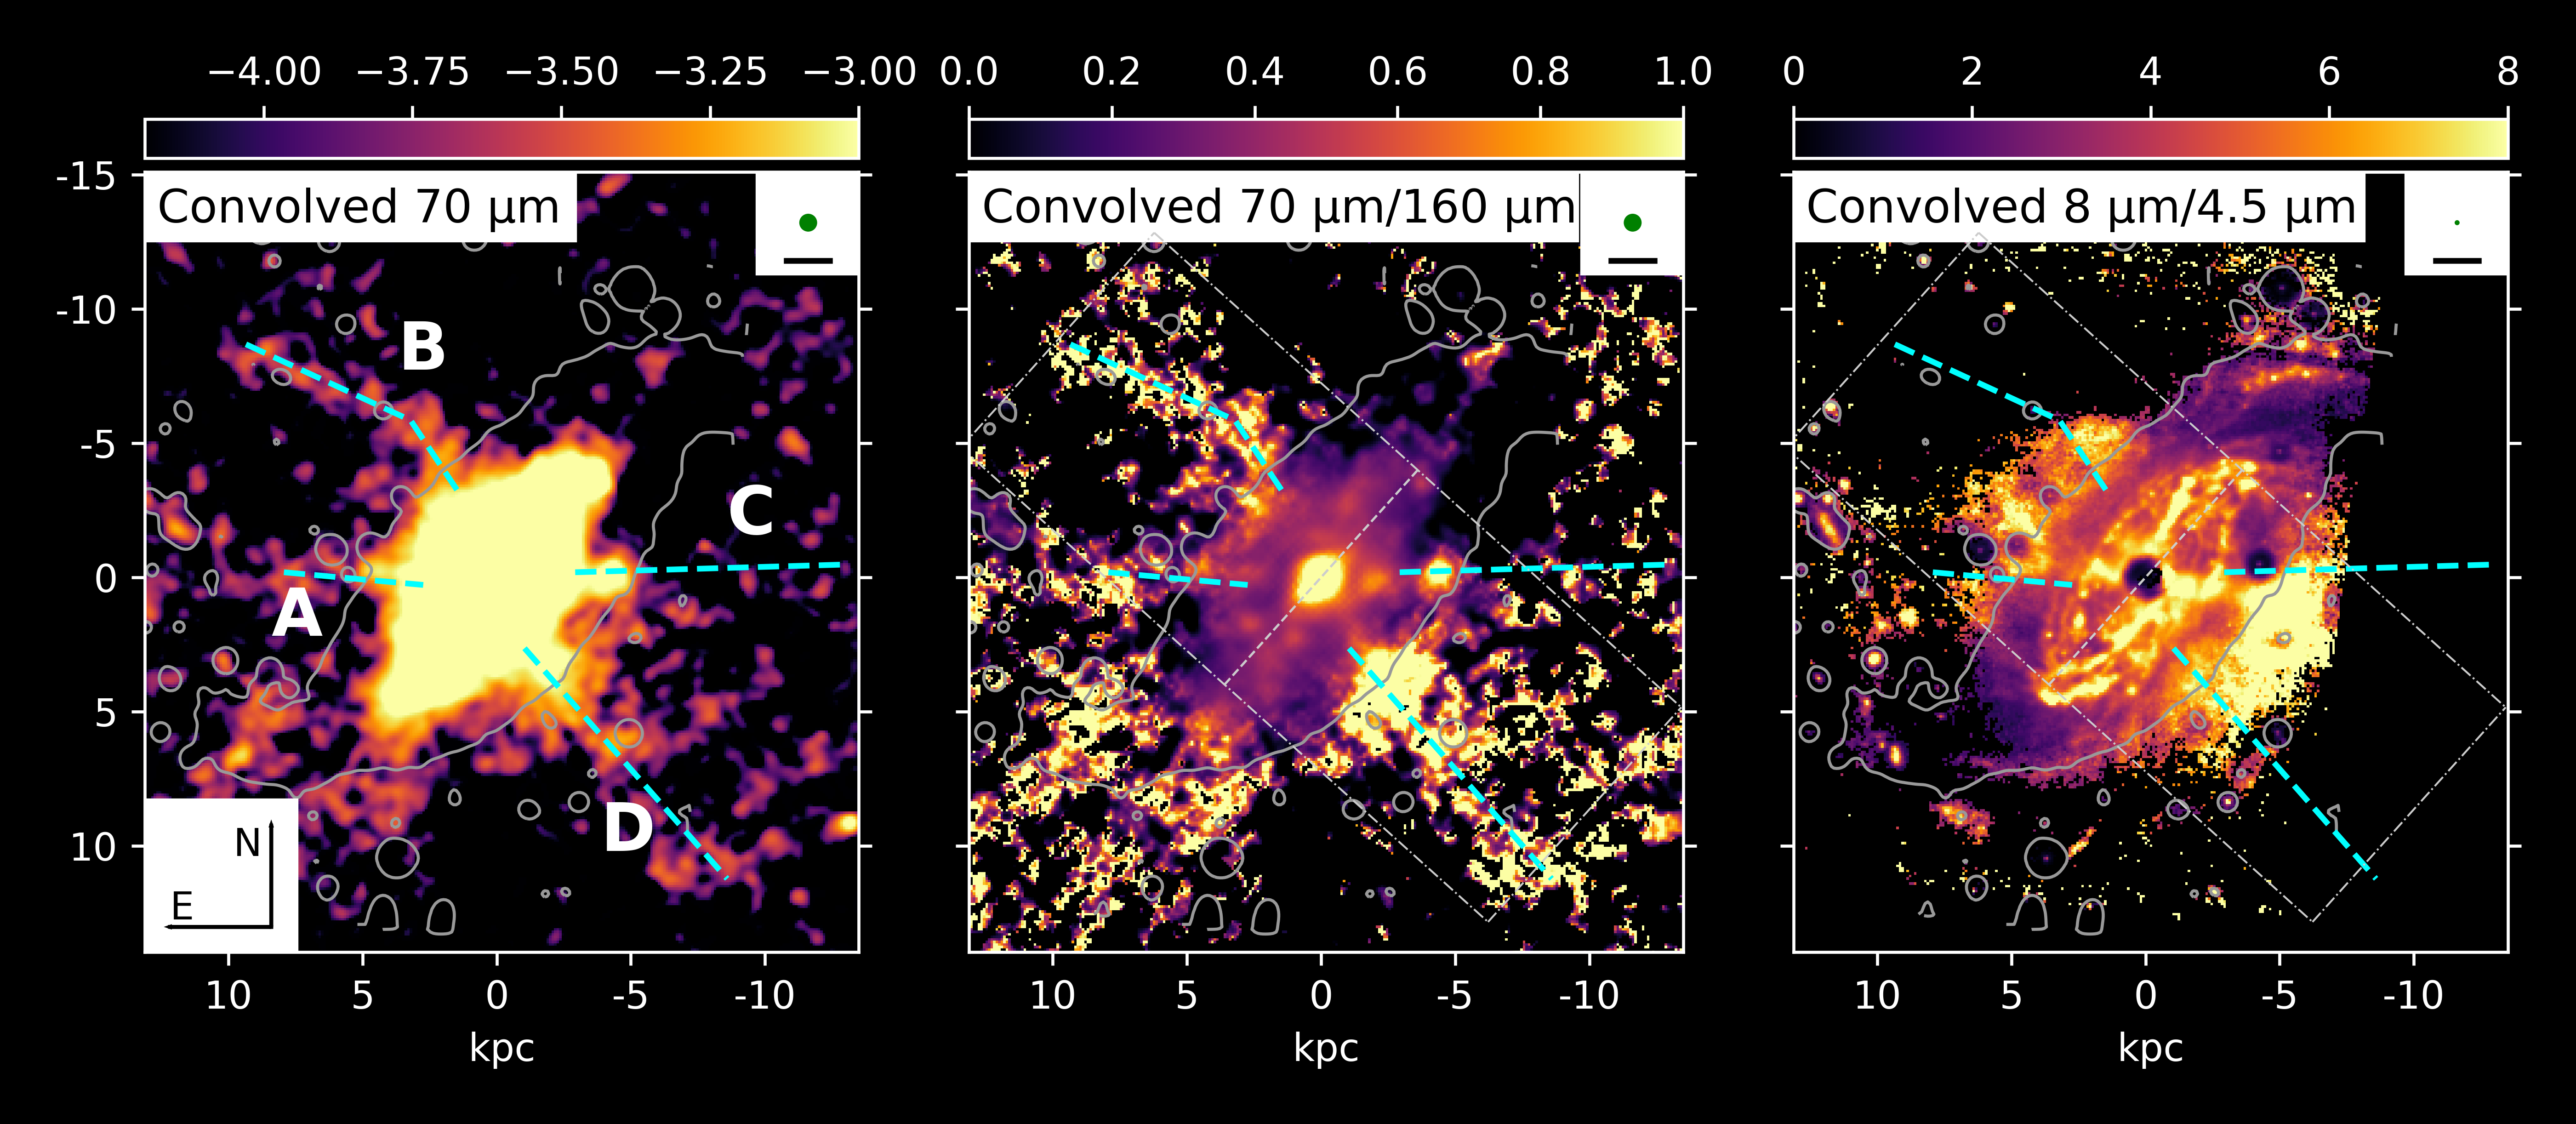
We use the Herschel PACS images at 70 µm and 160 µm to map the structure of the heated extraplanar dust. As FIR emission in galaxies often peaks between these wavelengths (Meléndez et al., 2015), the 70-to-160 µm flux ratio, , is a good indicator of the dust temperature, assuming the other properties of the dust (e.g., composition, grain size distribution) remain constant. For instance, this ratio is equal to 0.2 for a modified blackbody at K, 0.5 at K, and 1 at K. With this in mind, we convolve the 70 µm map to the resolution of the 160 µm data (113) and take the ratio of the convolved 70 µm map to the 160 µm map (Fig. 2). Some of the highest flux ratios are found along the northernmost and southernmost filaments (lines B & D). In the southern cone, there is a distinct knot of high 70-to-160 µm flux ratios near 6 kpc from the galactic center and a second knot further south at a distance 8 kpc. While not as high as along the filaments, the values of the flux ratios in the region between the filaments are also higher than the values in the disk. Some of the patchy emission seen in the southwestern corner of the 70 µm map does not appear in the ratio map because the 160 µm emission was often undetected in these regions.
Next, we use the ratio of the Spitzer IRAC images at 8 µm and 4.5 µm to map the PAH emission relative to that of the stellar continuum (Fig. 2). The ratio map shows a distinct -like structure where the ratios are generally higher in the central region and within the inner northeast and southwest conical regions traced by the filaments at 70 and 100 µm. The dip in the center of this map is an artifact caused by saturation in the center of the 8 µm map.
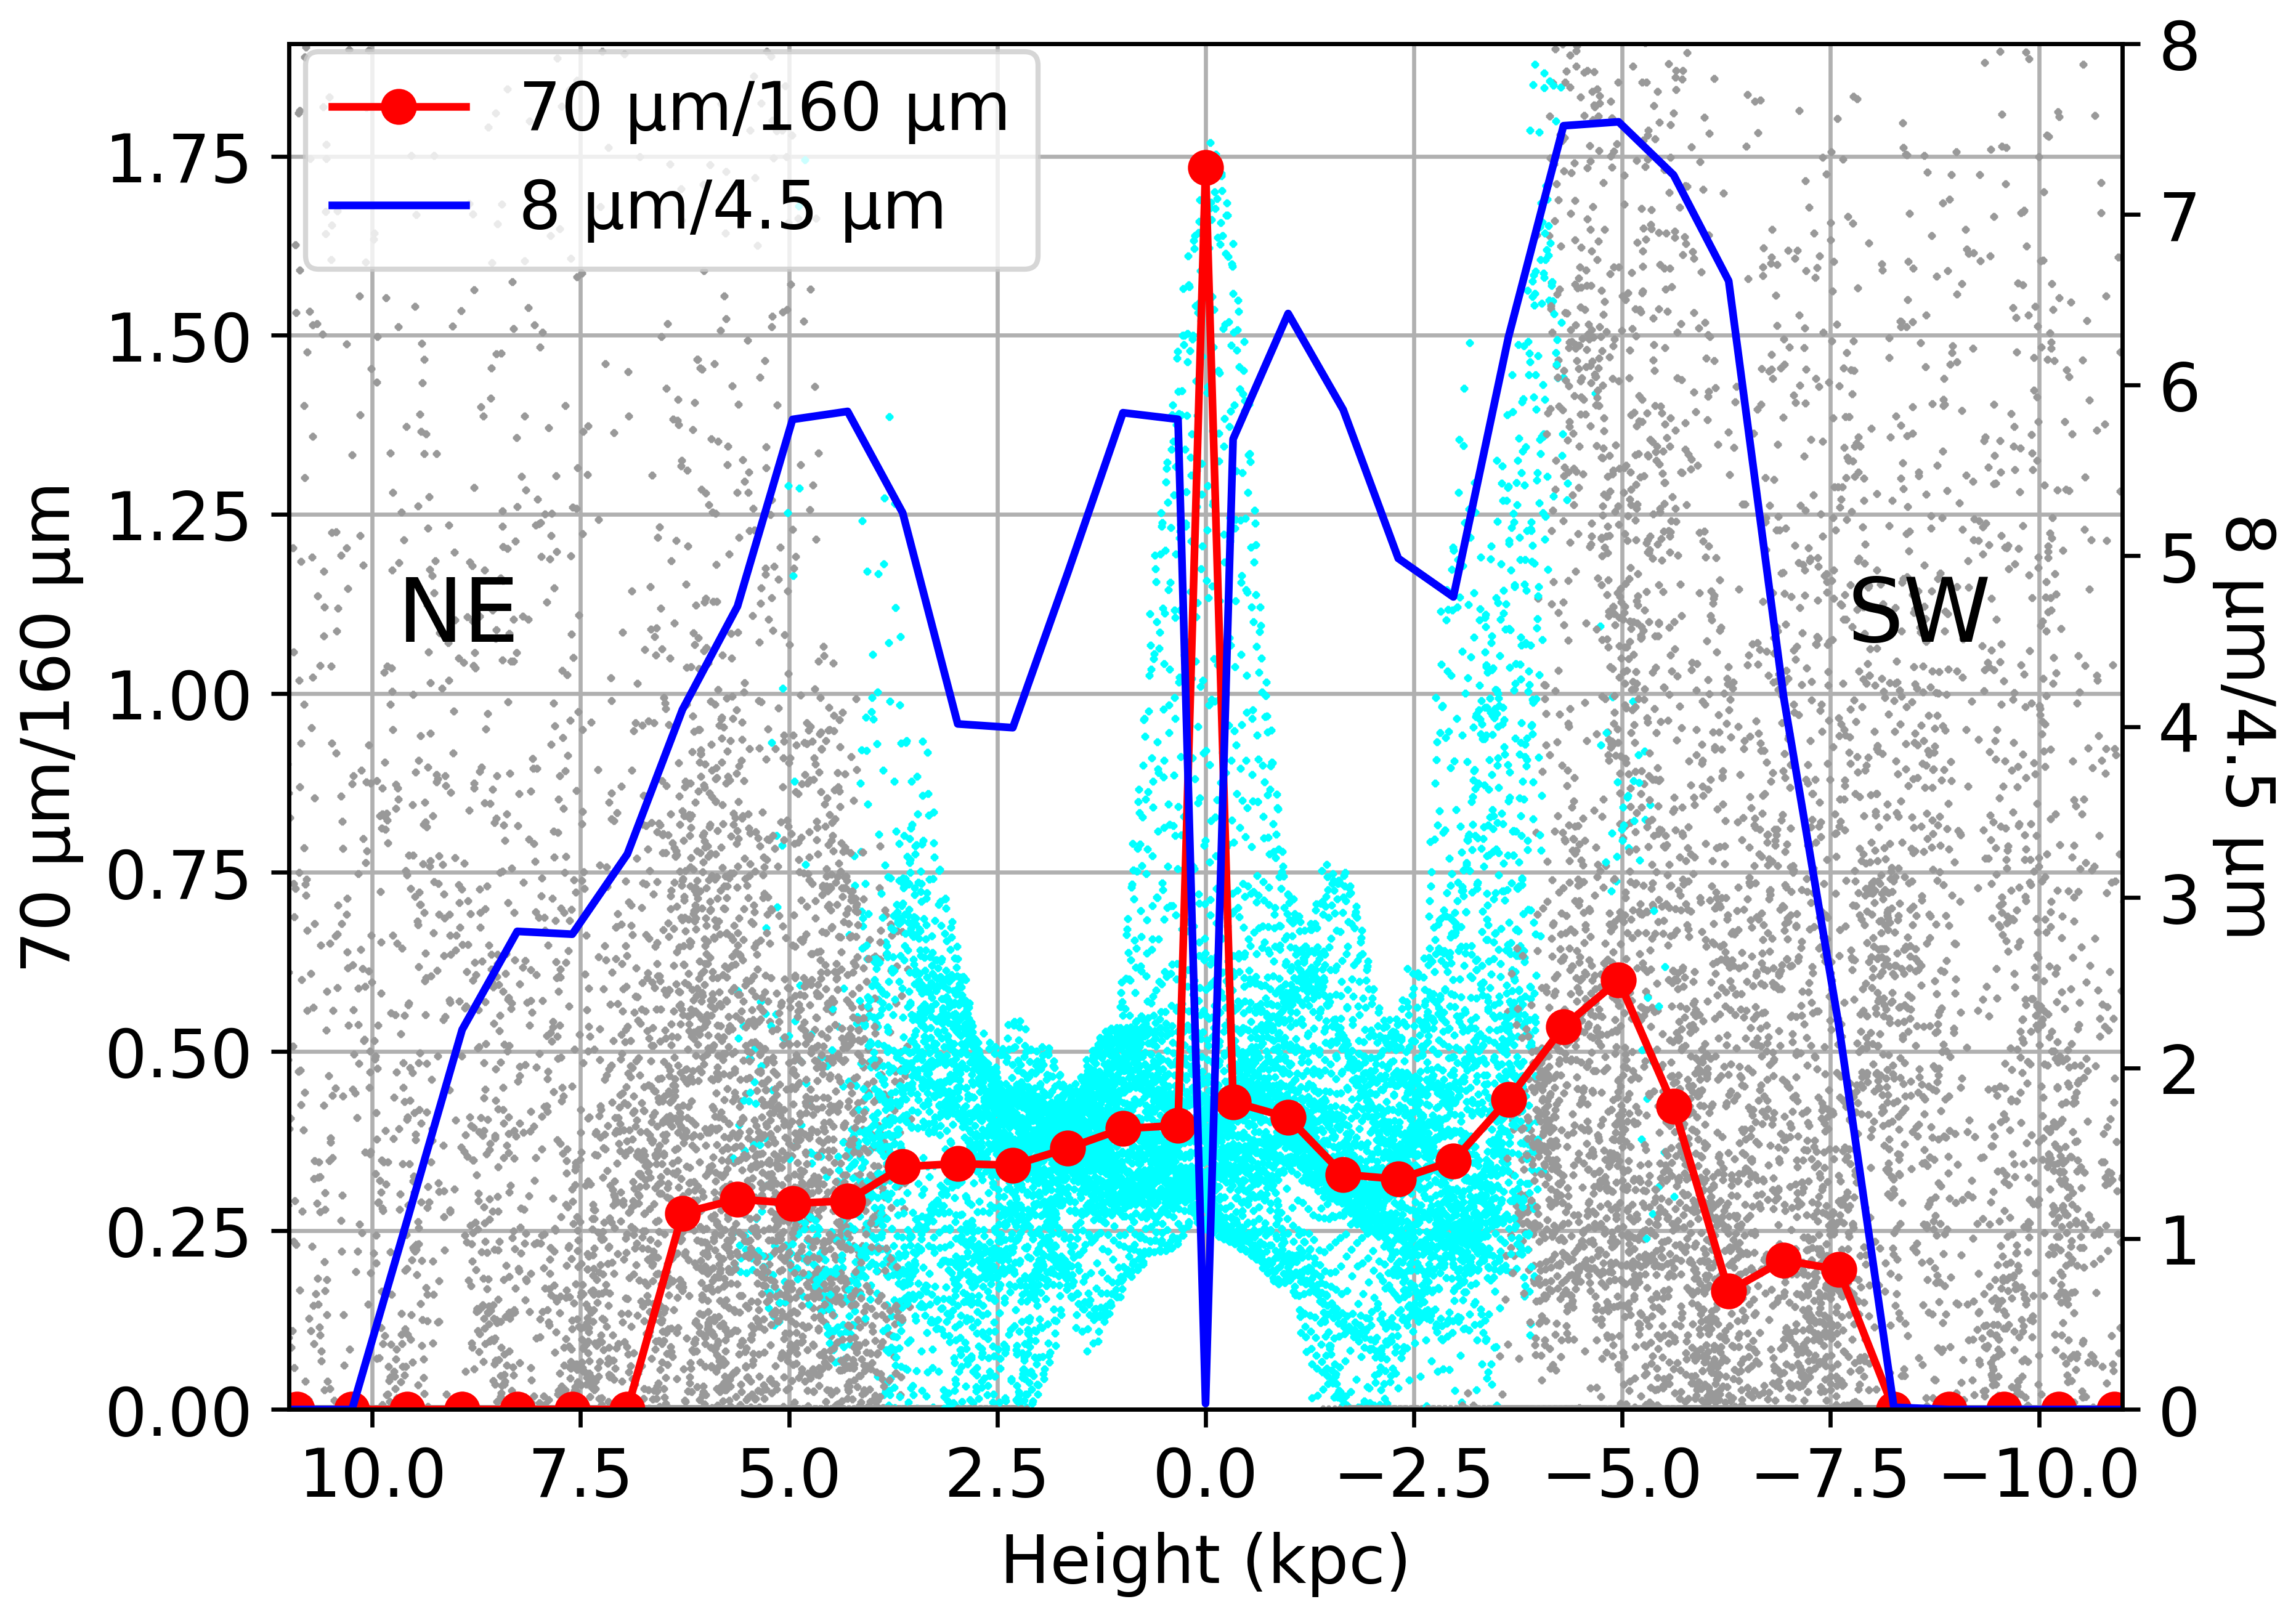
Fig. 3 shows both the and ratios as a function of height from the galactic mid-plane. The FIR ratios in the southern dust feature peak just outside the edge of the stellar bar, before reaching a local minimum between kpc. Although the ratios begin to rise again beyond 7 kpc, this next local peak in the ratios occurs in conjunction with the spiral arms making it difficult to distinguish between extraplanar emission and the underlying disk emission, so we adopt a conservative maximum emission height of 7 kpc for the southwestern dust feature. Similarly, due to the drop-off in both and ratios beyond 7 kpc in the northeast region, we adopt 7 kpc as a conservative maximum height for the northeastern dust feature.
3.3 Comparison to UV and X-Ray Images
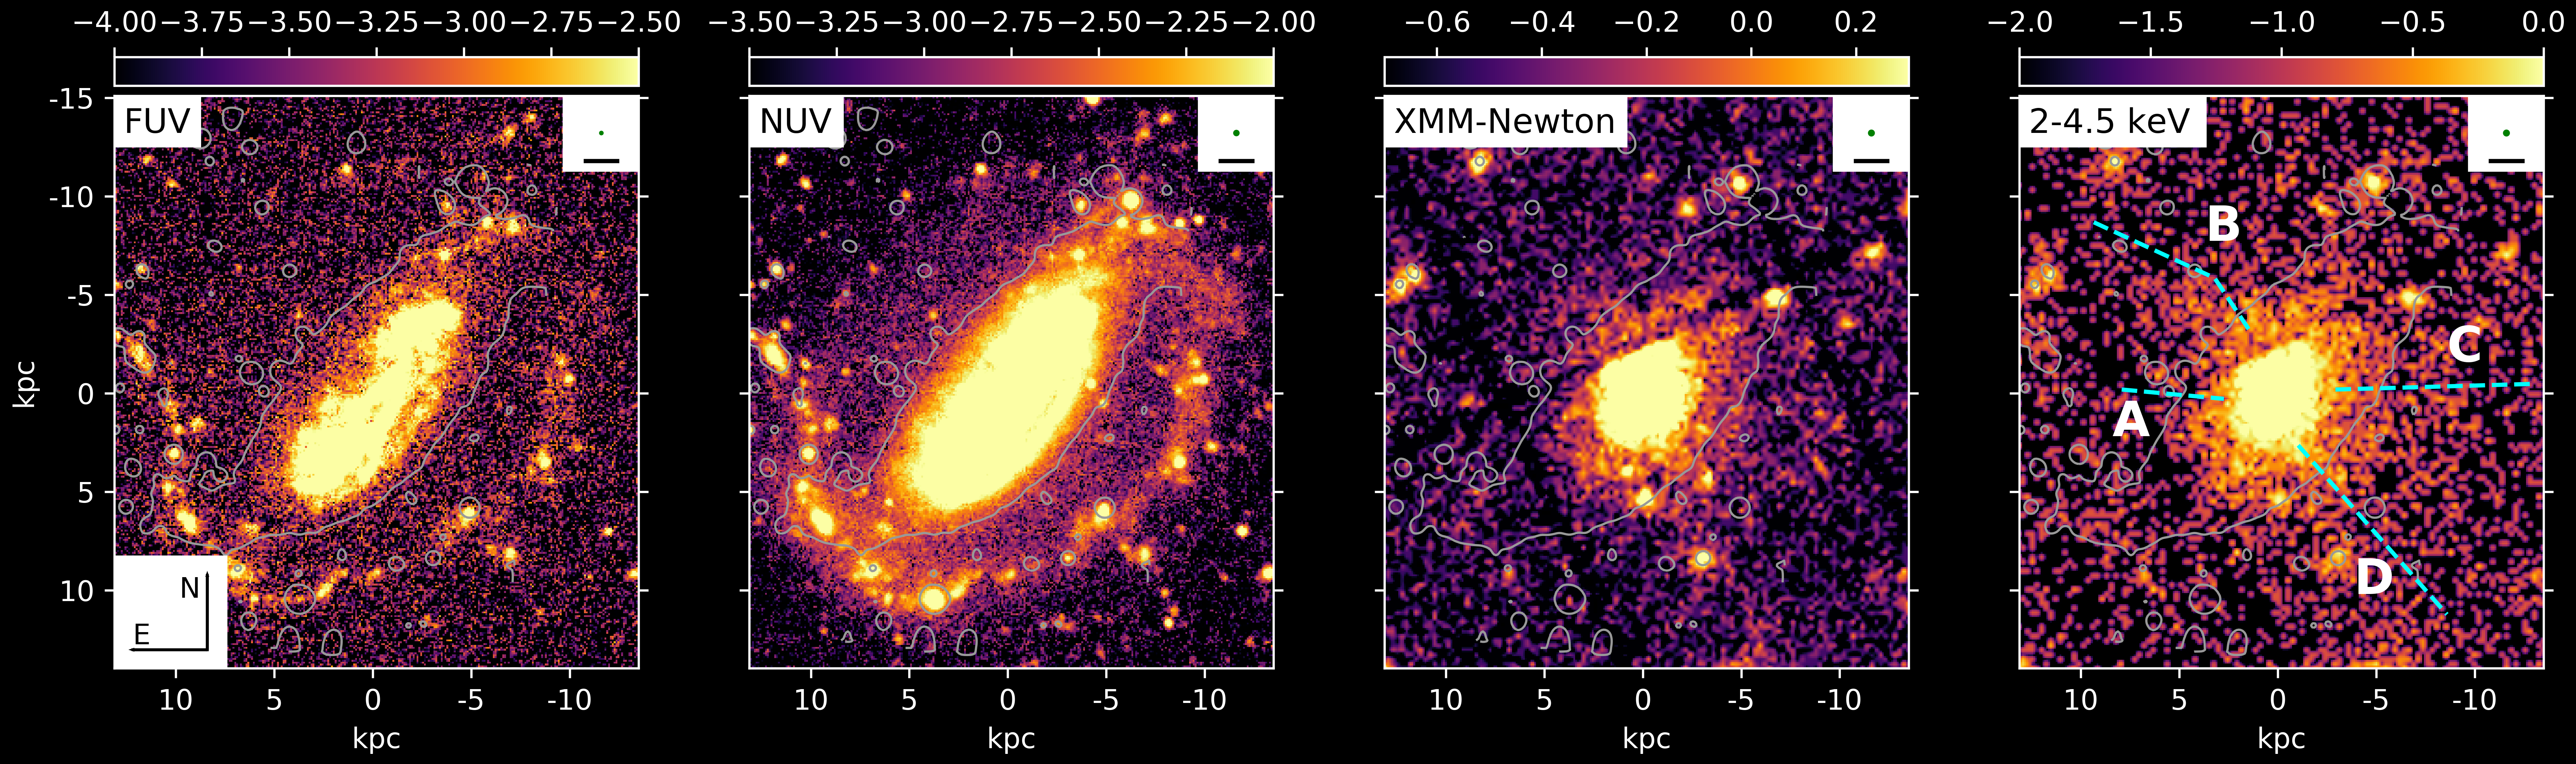
While the spiral structure outside the central bar of NGC 1808 is prominent in both GALEX FUV and NUV images (Fig. 4), the UV emission is notably fainter in the northeast quadrant, possibly due to obscuration by foreground dust associated with the FIR filaments. Part of the spiral structure in the southwest quadrant is co-spatial with the local maximum in the ratio at 8 kpc southwest from the nucleus noted in the previous section. This possible contamination of the extraplanar FIR emission by the spiral arms will be taken into account when deriving the properties of the dusty extraplanar filaments (Sec. 3.4).
The extraplanar X-ray emission in the XMM-Newton data, first pointed out in Jiménez-Bailón et al. (2005), is most visible at keV (Fig. 4), where a streak of emission is aligned with the northernmost feature seen at 70 µm (line B). However, across the full energy band of XMM-Newton (third panel of Fig. 4), the X-ray emission is largely associated with the disk, including some point sources within the spiral arms.
3.4 Dust Masses and Temperatures
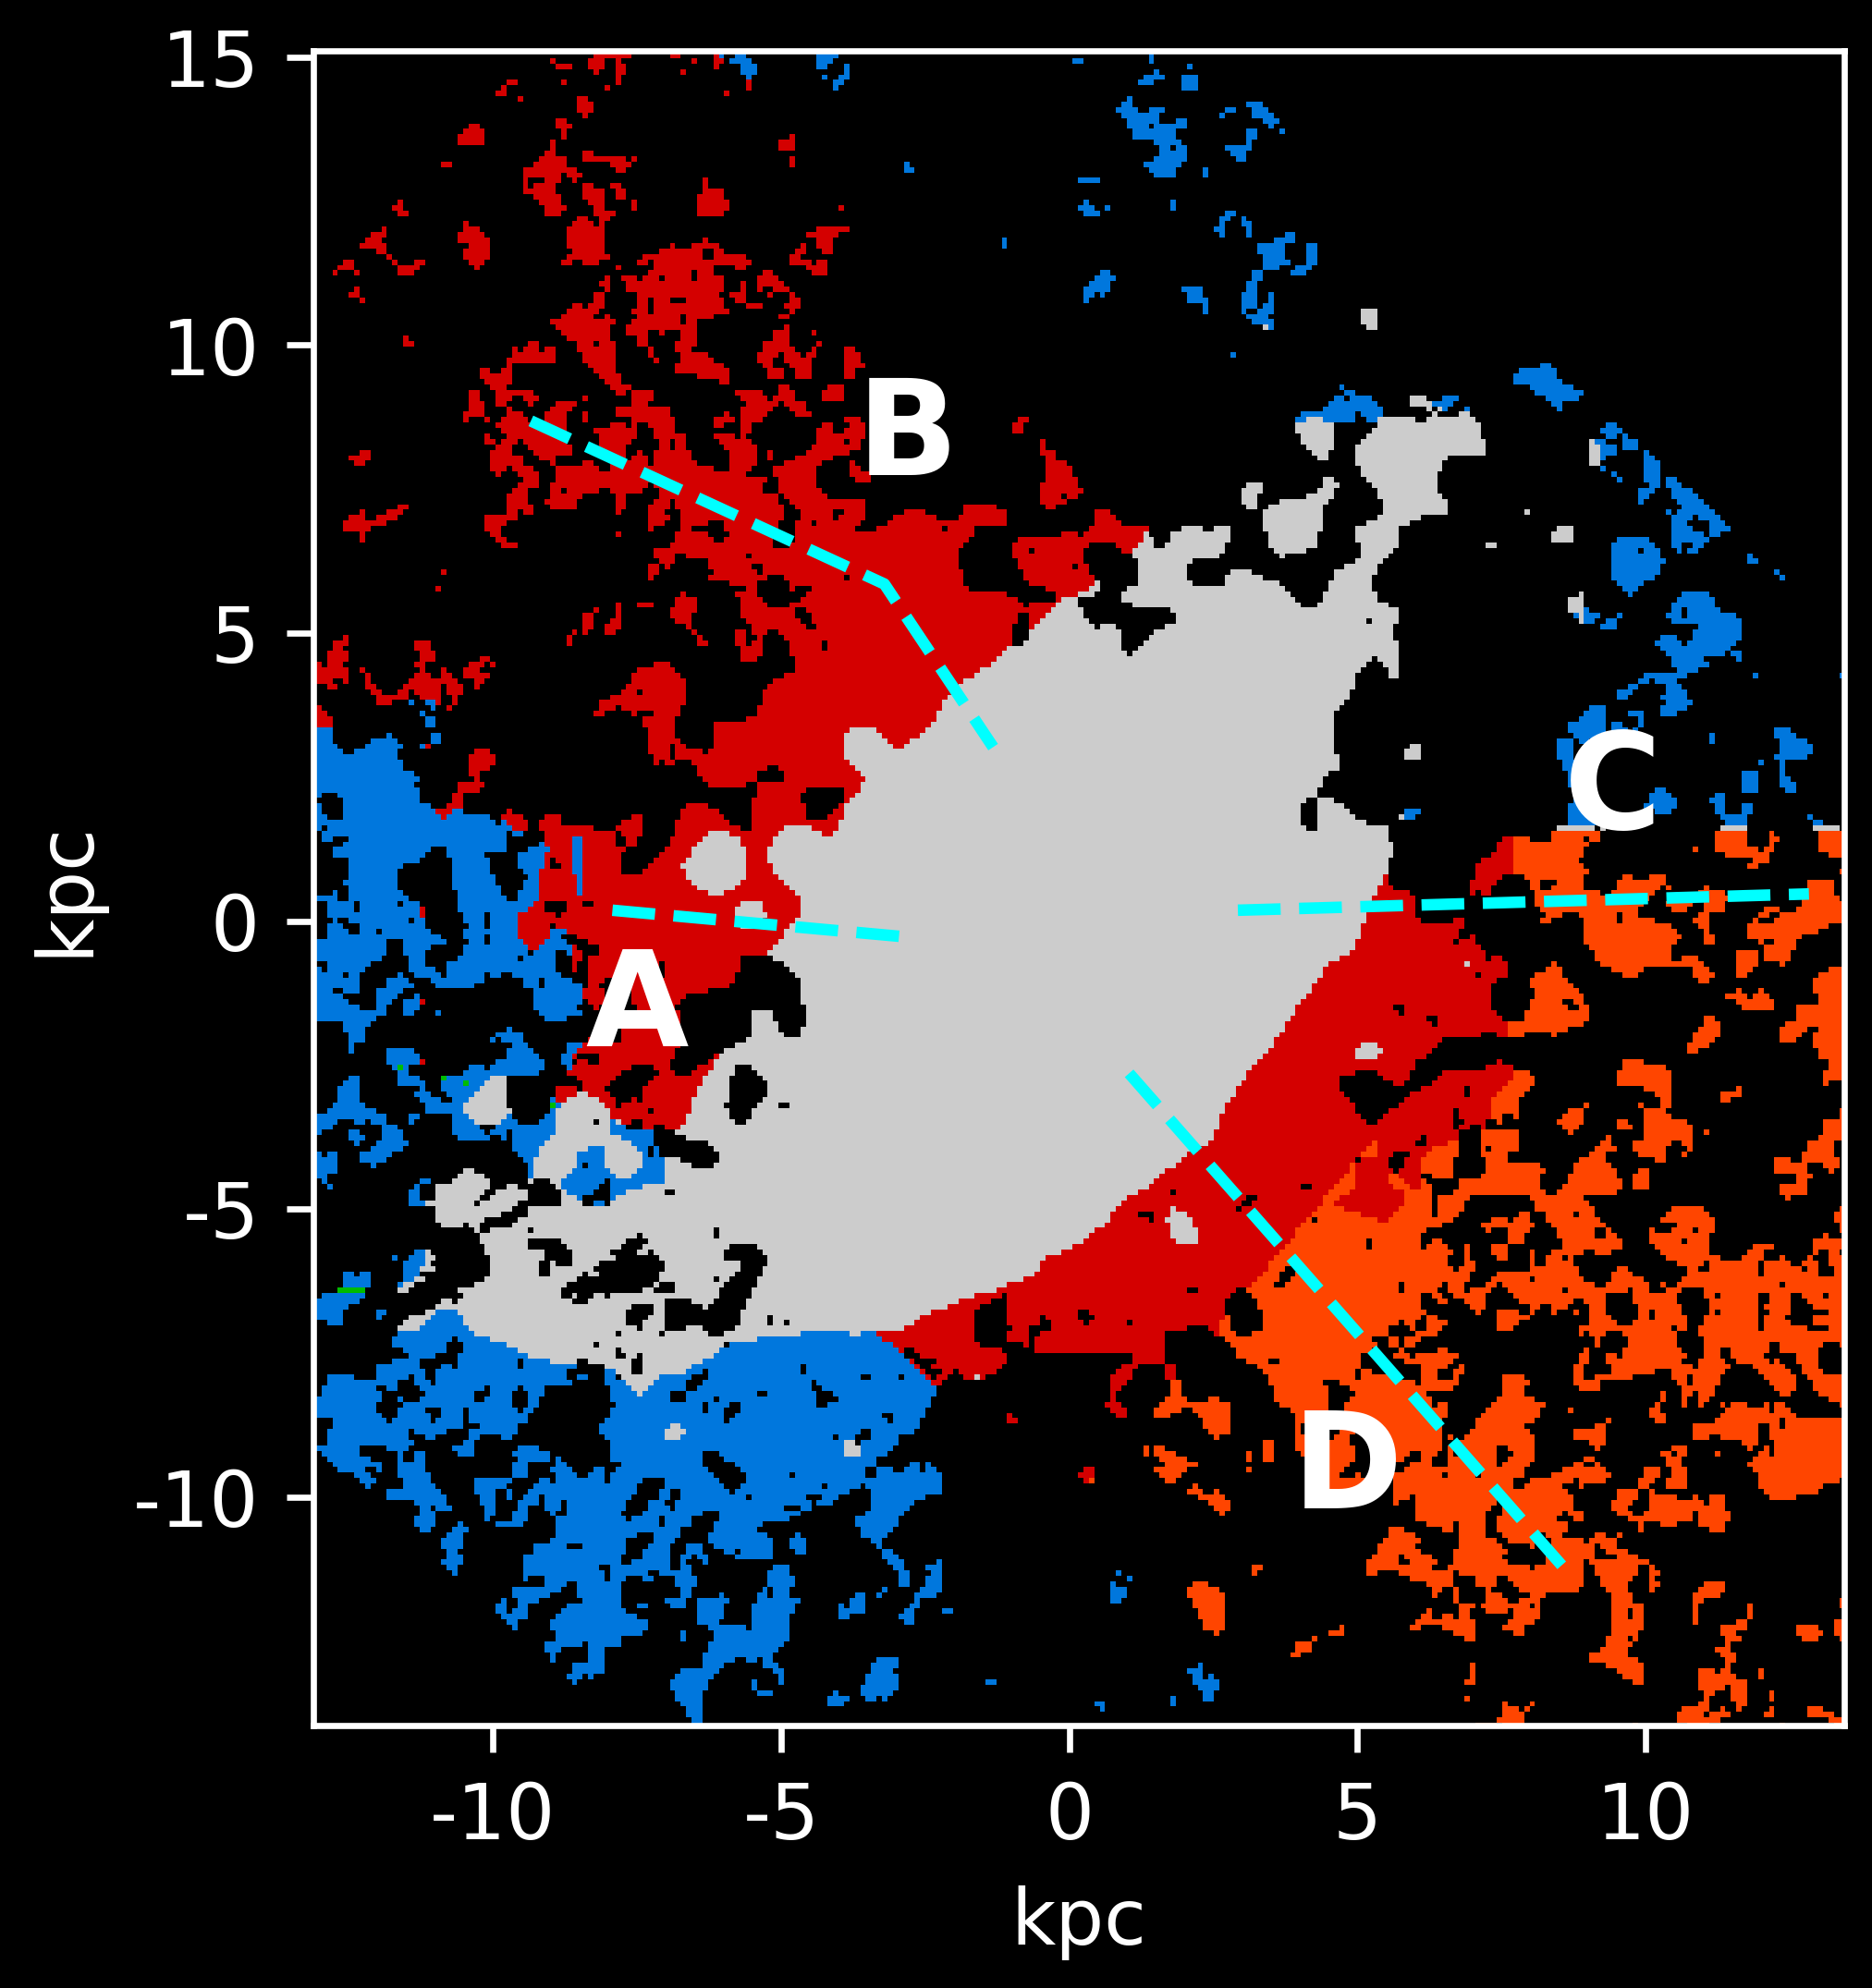
In order to estimate dust masses and temperatures, we divide the galaxy into a series of regions (Fig. 5), including the stellar bar region, the northern extraplanar region, and the southern extraplanar region. The stellar bar is shown in gray, extraplanar regions are shown in shades of red, and unanalyzed regions of the spiral arms are shown in blue. Since the emission in the southern extraplanar region is contaminated by the prominent spiral structure in the foreground disk, we split the southern extraplanar region into two, one that captures the space between the 4.5 µm stellar bar and UV spiral arms (shown in darker red), and another one that includes the potentially contaminated emission (shown in a lighter red). The cone edges labeled C and D extend from the uncontaminated (dark red) region into potentially contaminated space (light red), while the cone edges labeled A and B are not affected by contamination. We again define the stellar bar region by selecting pixels above 0.075 MJy sr-1 in the 4.5 µm map (after reprojection to the 70 µm map scale and convolution to the 160 µm map beam size), a value we found to both trace the emergence of spiral arms from the stellar bar and avoid including the extraplanar regions. The fluxes extracted from these regions are listed in Table 2.
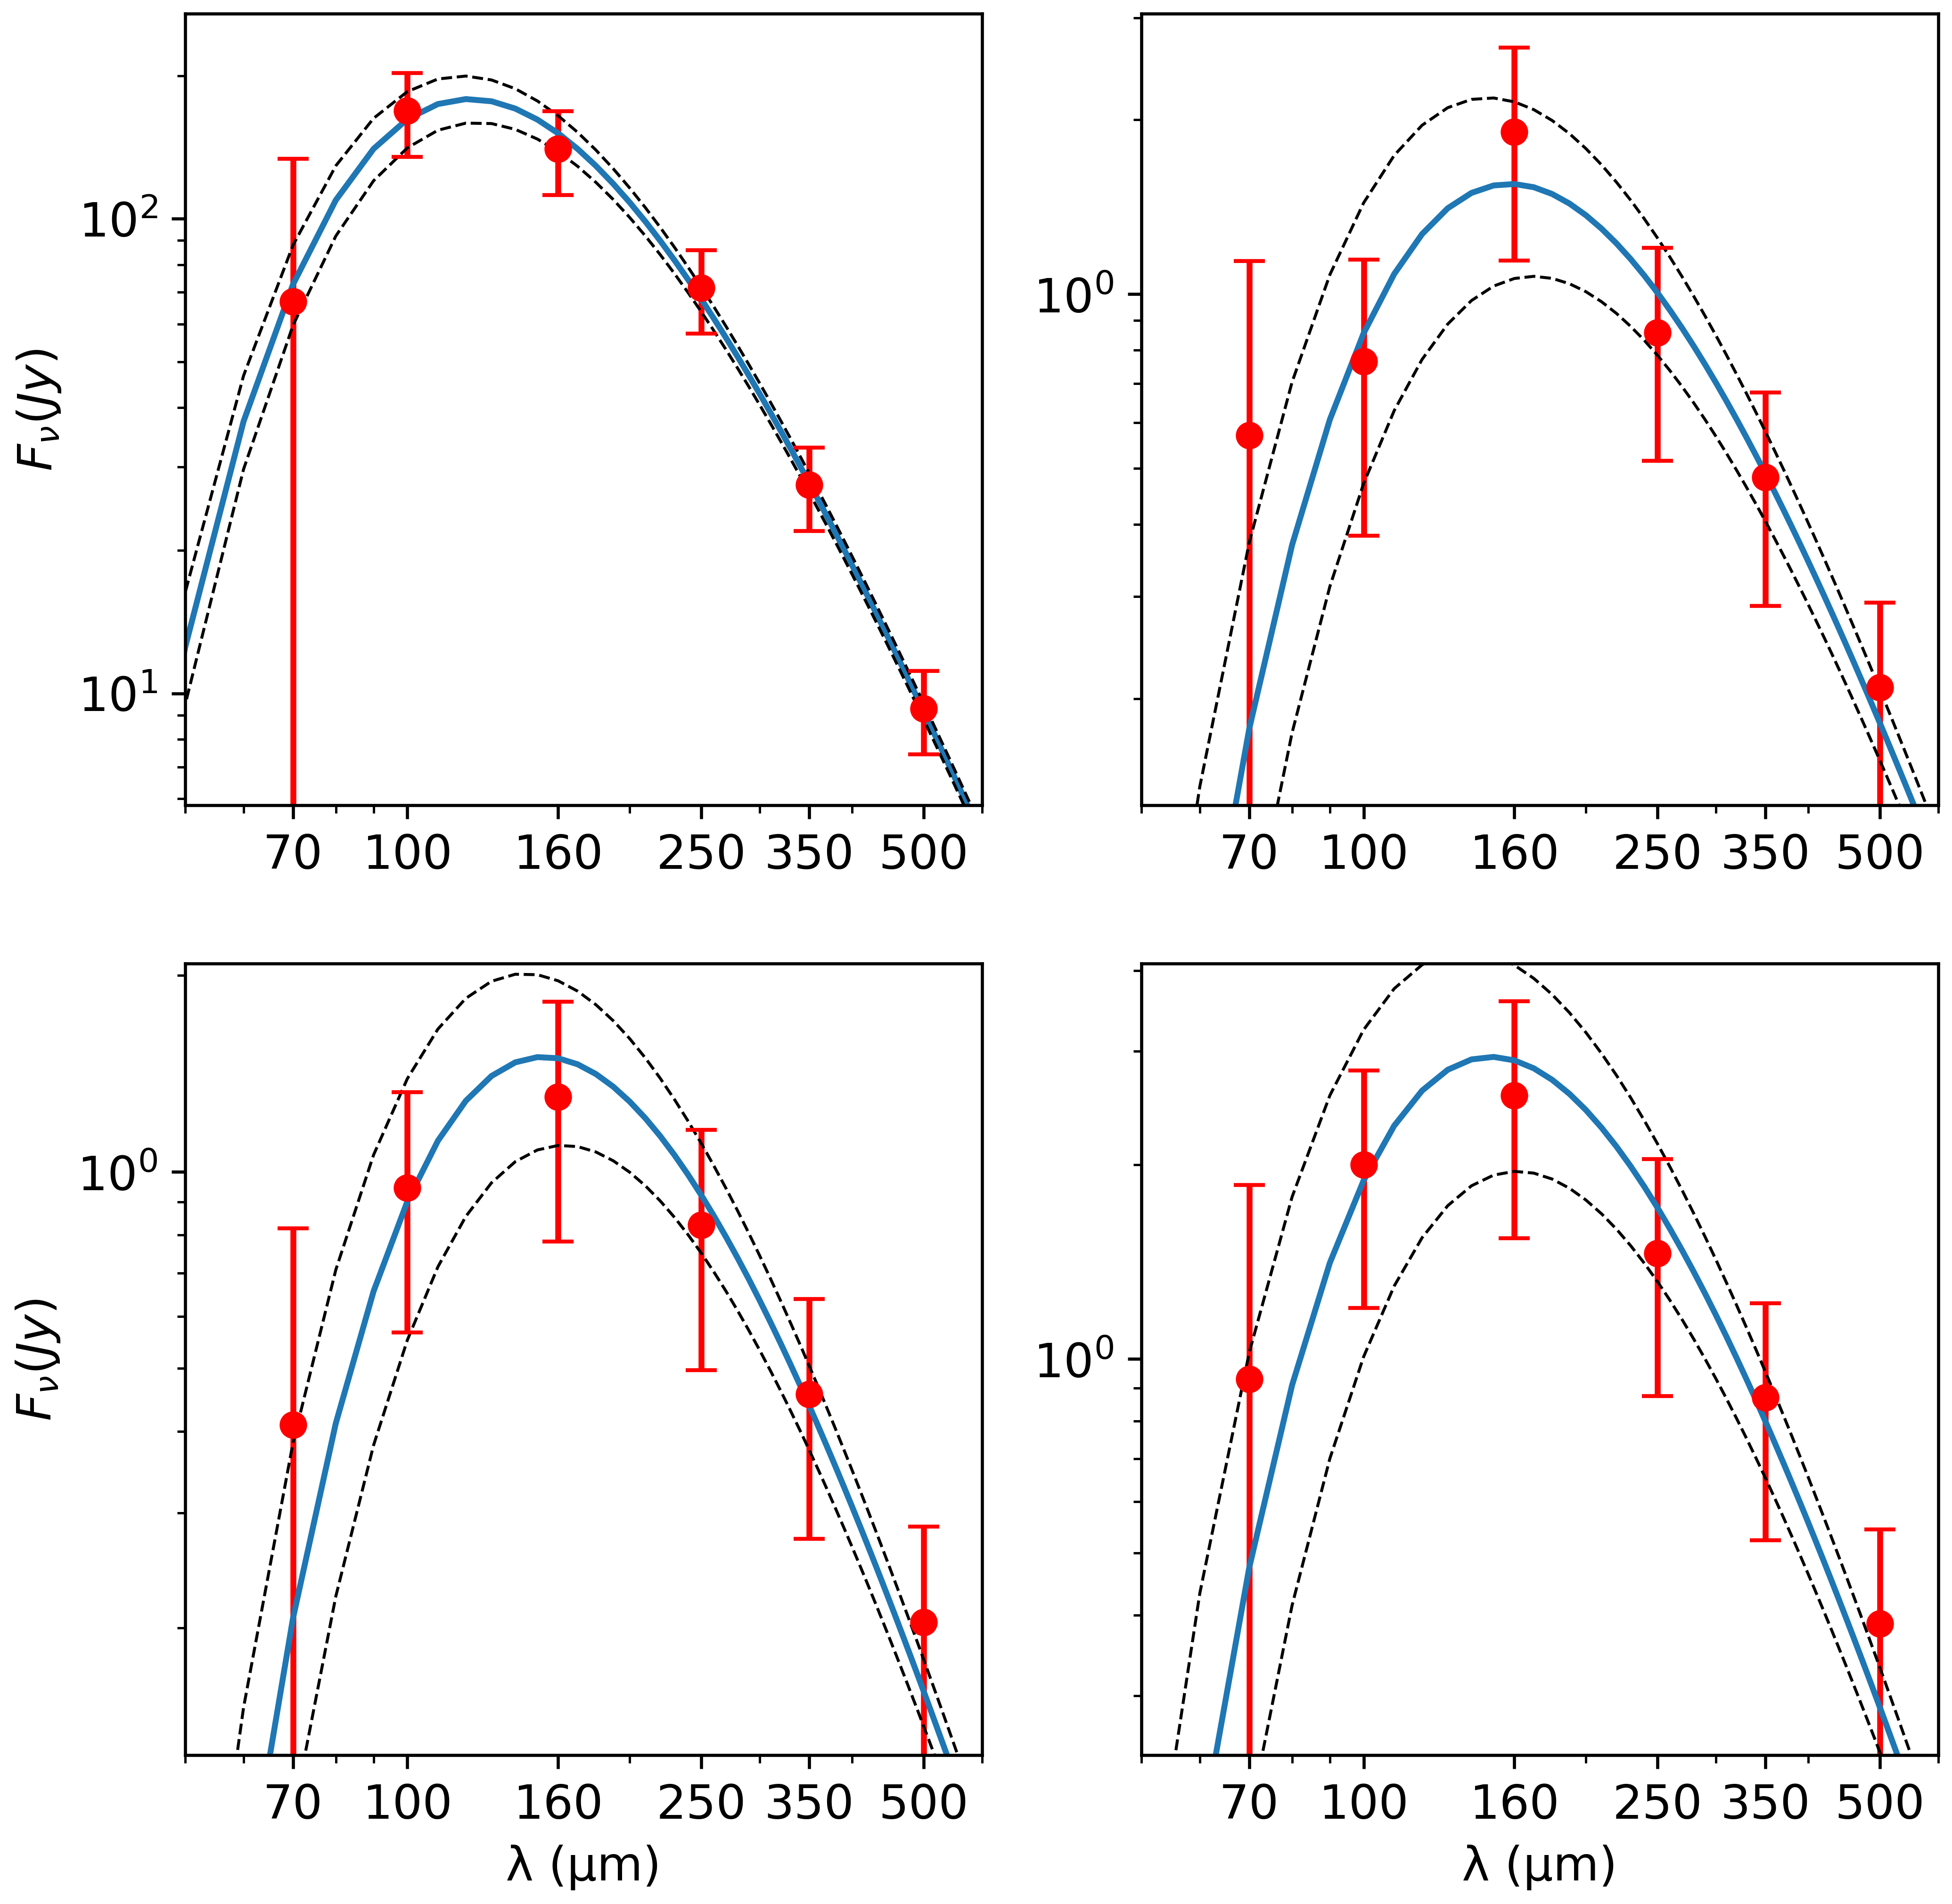
We derive the dust masses and temperatures in these regions by fitting a single-temperature modified blackbody distribution to the spectral energy distribution (SED) measured from the Herschel PACS and SPIRE images according to
| (1) |
where is the flux at the associated wavelength, is the fitted dust mass, is the dust opacity at the associated wavelength, and is the Planck function of the fitted temperature. The dust opacity, , is calculated based on a value of m2 kg-1 at 350 µm, and holding dust emissivity as a fixed parameter at (Meléndez et al., 2015). The IR spectrum above 60 µm is dominated by steady thermal emission from large dust grains as opposed to the time-dependence seen in smaller grains (Draine, 2003), which dominates the emission below this wavelength. So, to reduce the uncertainty stemming from small-grain fluctuations, we follow Meléndez et al. (2015) and fit the FIR fluxes holding the 70 µm flux as an upper limit. To assign uncertainties to the integrated fluxes in all other bands, we add in quadrature the error on mean brightness in each pixel, the standard deviation of pixels used to take the background, and a calibration uncertainty. This calibration uncertainty is 20% in the bar region, increased to 40% in the extraplanar regions, and 50% for the 100 µm measurements in the northern region to account for the gradient in the background. The uncertainties on the mass and temperature from the fits are calculated by taking the 1- spread of 100 SED fits calculated from random photometric data points within the observed error bars.
The results from the SED fitting are shown in Fig. 6 and summarized in Table 3. We find that the dust in the cones is overall slightly cooler than the dust in the stellar bar, despite the 70-to-160 µm ratio map indicating the filaments along the edges are warmer than the disk. Extraplanar dust constitutes 5% of the total dust mass in the galaxy. This value increases to 7% if we include the dust in the southern cone which may be contaminated by spiral arm emission.
| Band | Stellar Bar | N Cone | S Cone (Min.)(a) | S Cone (Max.)(a) |
|---|---|---|---|---|
| (1) | (2) | (3) | (4) | (5) |
| PACS 70 µm | 67.0 67.0 | 0.6 0.6 | 0.4 0.4 | 0.9 0.9 |
| PACS 100 µm | 168.9 33.8 | 0.8 0.4 | 1.0 0.4 | 2.0 0.8 |
| PACS 160 µm | 140.3 28.1 | 1.9 0.8 | 1.3 0.5 | 2.6 1.0 |
| SPIRE 250 µm | 71.6 14.3 | 0.9 0.3 | 0.8 0.3 | 1.5 0.6 |
| SPIRE 350 µm | 27.5 5.5 | 0.5 0.2 | 0.5 0.2 | 0.9 0.4 |
| SPIRE 500 µm | 9.3 1.9 | 0.2 0.1 | 0.2 0.1 | 0.4 0.2 |
(a) The region labeled “South Cone (Min.)” is the sub-region indicated by the darker shade of red in Fig. 5. The region labeled “South Cone (Max.)” is the entire southwestern region including the lighter shade of red in this same figure.
| Region | Mass | Temp. |
|---|---|---|
| () | ||
| (1) | (2) | (3) |
| Stellar Bar | 7.72 | 23.9 0.5 |
| North Cone | 6.22 | 18.4 1.3 |
| South Cone (Min.)(a) | 6.14 | 19.0 1.1 |
| South Cone (Max.)(a) | 6.37 | 19.5 1.5 |
(a) The region labeled “South Cone (Min.)” is the sub-region indicated by the darker shade of red in Fig. 5. The region labeled “South Cone (Max.)” is the entire southwestern region including the lighter shade of red in this same figure.
3.5 Star Formation Rate in the Stellar Bar
First, we estimate the IR-based star formation rate (SFR) in the stellar bar region by integrating the best-fitting SED in this region (Fig. 6, top left) from µm. This yields a total infrared (TIR) luminosity of (erg s-1) = 43.96, implying a SFR of 3.5 yr-1 if we use the Kennicutt & Evans (2012) relation ( yr-1) = (erg s-1) 43.41. This method of estimating SFR assumes that the UV photons from O and B stars are efficiently reprocessed into the infrared by the dust, and thus it does not take into account the unobscured star formation activity traced by the UV radiation or H emission (Bell, 2003). We thus consider this TIR-based estimate of SFR a lower limit to the actual SFR, and use the GALEX UV data to complete the picture.
We measure a FUV luminosity of (erg s-1) = 42.19 in the stellar bar, and after accounting for dust attenuation according to = (Hao et al., 2011; Murphy et al., 2011), this value becomes (erg s-1) = 43.64. Using the Kennicutt & Evans (2012) relation ( yr-1) = (erg s-1) 43.35, this translates into an additional SFR of 1.9 yr-1.
The analysis based on the NUV emission produces similar results: we measure a NUV luminosity of (erg s-1) = 42.35 in the stellar bar, which after accounting for dust attenuation according to = (Hao et al., 2011; Murphy et al., 2011), becomes (erg s-1) = 43.43. Using the Kennicutt & Evans (2012) relation, ( yr-1) = (erg s-1) 43.17, the NUV-based SFR is 1.8 yr-1. We add the highest UV correction to the TIR-derived SFR to yield an upper limit of 5.4 yr-1 on the SFR in the stellar bar of NGC 1808.
4 Discussion: Origin of the Extraplanar Dusty Filaments
The 70 µm flux map and ratio map presented in Fig. 2 display a filamentary morphology that is consistent with an edge-brightened biconical outflow. The filamentary morphology is expected of an evacuated cone, where the column density along the line of sight is highest along the edges of the cones due to projection effects. Were this a filled cone, the emission would be strongest along the cone axis, becoming fainter further from this axis (e.g., Veilleux et al., 2001; Marconcini et al., 2023). This structure overlaps with the kpc-scale dusty filaments visible in the optical broadband () color maps of Phillips (1993), but extends to much larger scale. Edge-brightened conical structures are seen in a number of starburst- and AGN-driven outflows (e.g., Veilleux et al., 2001; Marconcini et al., 2023).
Before discussing the outflow scenario in more detail, we examine the possibility that the extraplanar features are instead associated with tidally-stripped material or illuminated material already existing in the halo. While proximity to NGC 1792 ( 130 kpc) brings support to a tidal origin for the extraplanar features, such a mechanism would not readily create four distinct tails of dust symmetrically distributed on opposite sides of the galactic plane. There are also no notable asymmetries in the HI maps of Koribalski et al. (1993, 1996) to suggest that the dust-bearing HI has been stripped.
Arguably the best evidence for an outflow origin for the inner filaments comes from the detection of P-Cygni Na ID 5890, 5896 profiles with blueshifted absorption and redshifted emission in the northwestern cone (Phillips, 1993; Rupke et al., 2021), and inverse P-Cygni profiles in parts of the southwestern cone (Rupke et al., 2021). In this picture, an over-pressured bubble at the center of the galaxy expands faster along the path of least resistance, i.e. the minor axis of the barred galaxy disk, leading to a bicone once the wind driving the bubble reaches a few scale heights above and below the disk. The wind fluid rapidly expands through the interstellar medium (ISM), eventually pushing that material to the walls of a cone (Chevalier & Clegg, 1985; Heckman et al., 1990; Veilleux et al., 2005).
In this scenario, the dust in the filaments is warmer (higher ratio), heated by the UV photons from young and hot stars in the central starburst and shocks associated with the wind-ISM interface. A simple back-of-the-envelope calculation that assumes a blackbody-like temperature dependence on luminosity, (where is luminosity of the heat source and is the distance between the dust and the heat source), implies that shocks must account for a considerable proportion of the dust heating. Indeed, if we treat the starburst as a point source with a luminosity (erg s-1) 44.13, an overestimate of the radiation that actually heats the extraplanar dust, then dust at 10 kpc of this source of radiation will have a blackbody temperature of only K, assuming the dust absorbs 100% of that luminosity. If we instead assume that this luminosity is evenly distributed over the face of the disk, such that , where is the radius of the disk and the flux remains constant with height, the revised blackbody temperature becomes , yielding K at 10 kpc if we take kpc. Our ratio map (Fig. 2) implies extraplanar dust temperatures above 20 K at heights of 1 10 kpc, so the extraplanar dust is likely heated by an additional source of energy as it is lifted above the disk and entrained in the outflow.
Shocks produced at the interface between the fast wind fluid and the entrained dusty gas filaments will radiate at a rate erg cm-2 s-1, where is the total radiative flux, is the shock velocity, and is the number density of the pre-shock material (Dopita & Sutherland, 1995). This radiative flux therefore exceeds that of the starburst, erg cm-2 s-1, if km s-1 and 1 cm-3. Some of this radiation may contribute to the heating of the dust, although faster shocks may destroy the dust grains (Dopita et al., 2016).
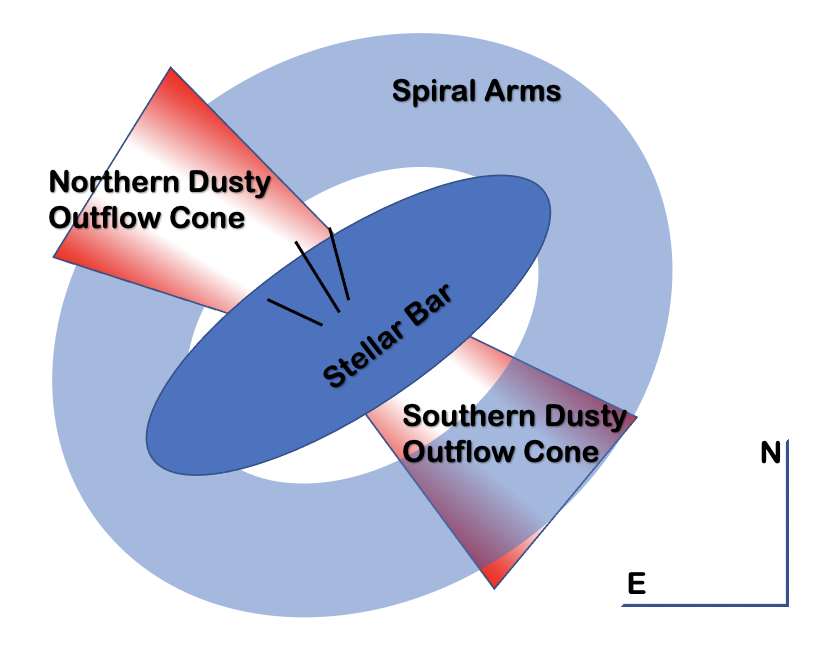
In the end, we therefore favor an outflow origin for the extraplanar dust filaments, heated by the starburst light and radiative shocks (see Fig. 7 for an illustration of the geometry). However, this interpretation requires the outflow to inject sufficient energy into the ISM on a reasonable timescale to lift the material to the observed heights. We therefore need to investigate the energetics associated with the starburst of NGC 1808 and the outflow. We adopt the isothermal sheet model used by Meléndez et al. (2015) and Veilleux et al. (2021) to calculate the potential energy required to lift a mass out of the galactic plane:
where is the mass of lifted material, is the scale height of the galaxy (1.3 kpc, see Sec. 3.1), is the density in the midplane, and is the mean emission height. We use pc-3 based on the density of the Milky Way at the solar position (Meléndez et al., 2015), as normal spirals like NGC 1808 tend to have similar dust properties to the Milky Way (Draine et al., 2007).
In the following discussion, unless explicitly noted otherwise, we take a conservative approach and only consider the southern region between the disk and spiral arm in order to place a lower limit on the energetics required to produce the southern cone. As we see no major changes to the dust properties in the extraplanar regions (consistent temperatures), we derive flux-weighted mean heights based on the 70 µm height profile. We find that the southern dust mass (Table 3) alone requires ergs to be lifted to its mean height of 4.9 kpc (derived from the line in Fig. 3). Assuming a dust-to-gas ratio of 140, like that of the Milky Way (Draine et al., 2007; Meléndez et al., 2015) , the energy requirement becomes ergs, the equivalent energy of 2 105 Type II supernovae (SNe II), assuming each supernova supplies 1051 ergs (Murray et al., 2005). Similarly, we find that ergs is required to lift the northern dust mass (Table 3) to its mean height of 5.1 kpc (Fig. 3). When the Galactic dust-to-gas ratio is incorporated, the energy requirement is ergs, which could be supplied by 3 105 SNe II, or a grand total of 5 105 SNe II to produce all extraplanar filaments.
To address the kinetic energy in the outflow, we combine a model of ballistic motion, neglecting drag, with published velocity values. Rupke et al. (2021) use Na I D lines to find a maximum velocity of 450 km s-1 within the central kpc, which we can use to establish an upper limit to the kinetic energy of extraplanar dust. Given our isothermal sheet potential, material in the southern cone between kpc would have a flux-weighted average velocity of 320 km s-1 if it were all initially traveling at 450 km s-1 at 1 kpc. Material in the northern cone would have a flux-weighted average velocity of 310 km s-1. We can account for up to another ergs in kinetic energy, thus we expect the energy requirement to fall between ergs.
We use the upper limit on the velocity to constrain a minimum dynamical time for this outflow. Our ballistic model demonstrates that the gas has a nearly constant velocity while traveling from the nucleus to the edge of the 1 kpc region. Using 450 km s-1 from Rupke et al. (2021), it takes 2 Myr to travel that distance. Traveling at 450 km s-1 at a height of 1 kpc, it requires an additional 18 Myr to reach a height of 7 kpc. We therefore estimate a total dynamical time = 20 Myr. This timescale may be reduced if our assumption of ballistic motion is incorrect as in the case where a short-lived but highly energetic event in the past boosted the velocity of the dusty material compared with the observed kpc-scale velocity of 450 km s-1.
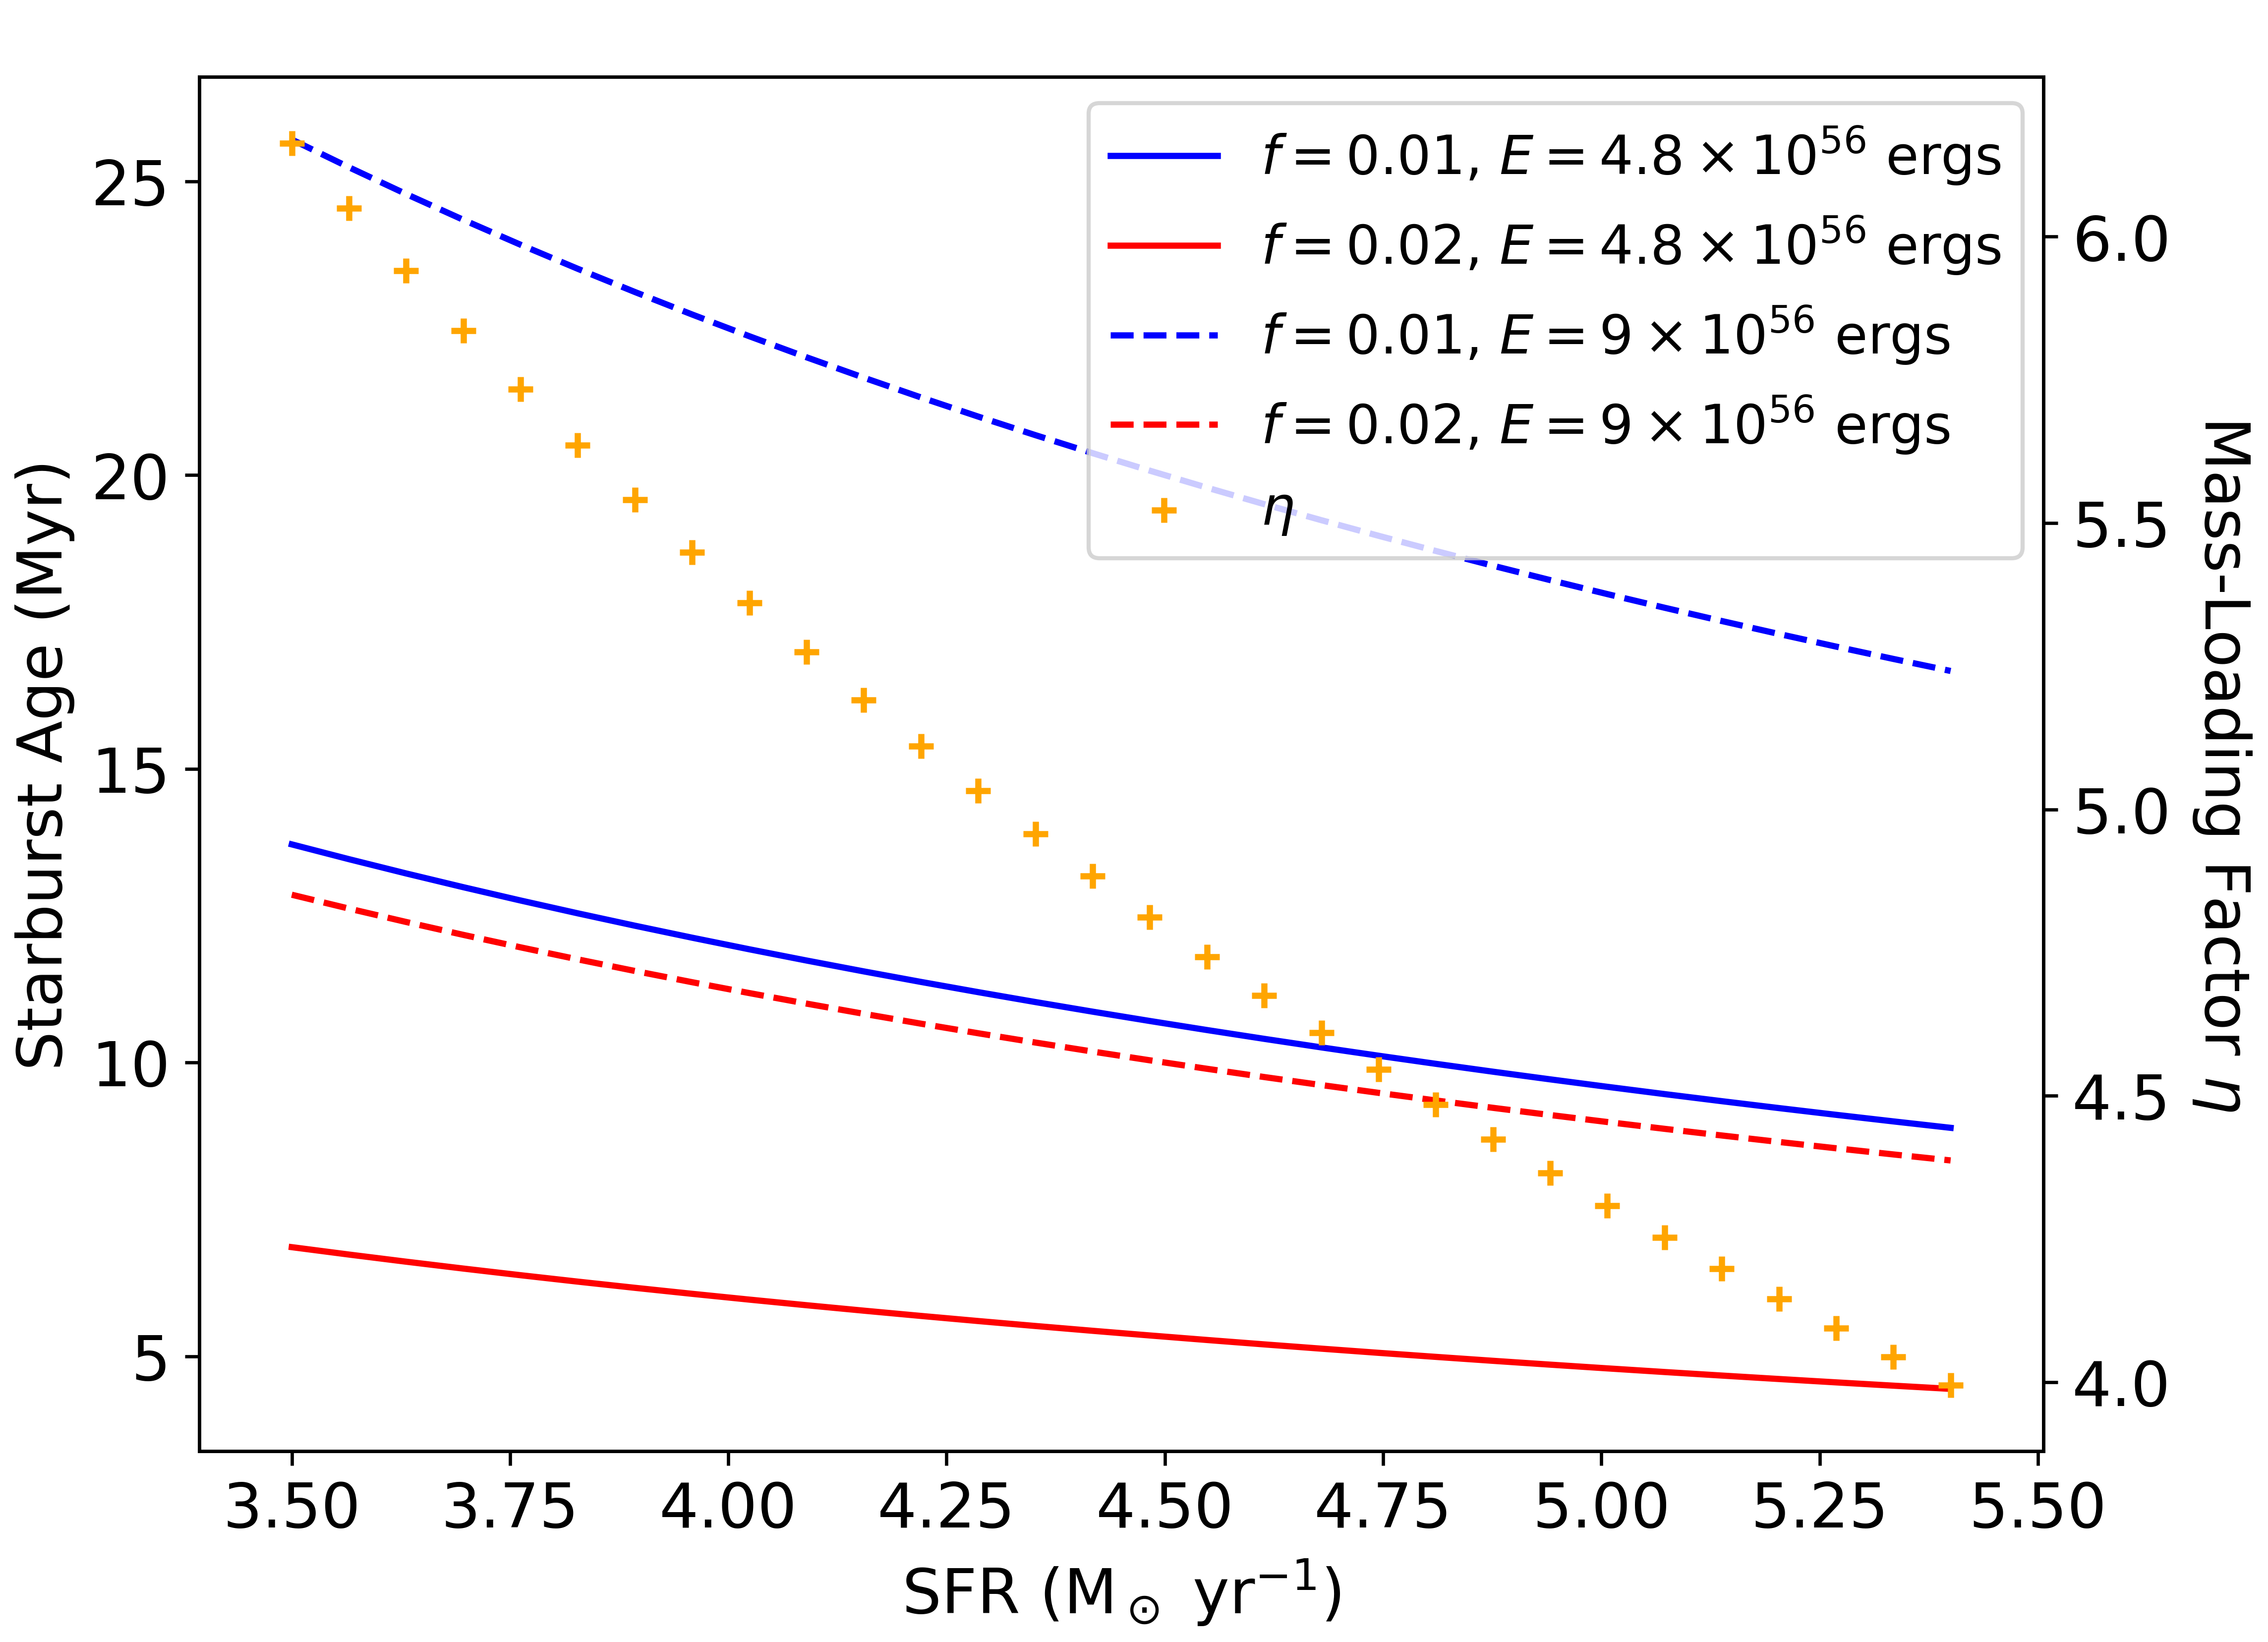
Assuming a ratio of the supernova rate (SNR) to SFR of SNe II/ (depending on the initial mass function), we find that the current star formation episode in NGC 1808 is sufficiently powerful to reproduce the observed dusty cones at kpc as long as the current SFR ( yr-1; Sec. 3.5), and corresponding SNR ( SNe II yr-1), were constant for the past Myr, where is the efficiency of energy transfer from SNe to the surrounding environment. The dependence of the minimum starburst age on the energetics is shown in Fig. 8, assuming a 100% efficiency . This efficiency is heavily dependent on the ISM properties; dense environments are able to absorb a larger portion of the kinetic energy, but gas density and metal content can also make the ISM more susceptible to cooling. The efficiency of energy transfer from SNe to the ISM has been modeled to be as low as 10% (Thornton et al., 1998), but the constraints on efficiency are somewhat relaxed by contributions from heavy stellar winds of high-mass stars which shed dust in their atmospheres. Stellar winds can supply the ISM over their lifespan with a kinetic energy comparable to a supernova (Murray et al., 2005). Radiation from disk stars can also help propel an outflow, although this must be done early in the outflow history because the radiation pressure steeply drops off as .
Next, we combine our best estimates for the outflow dynamical time ( = 20 Myr) and dusty gas mass taking part in the outflow (, from Table 3 and assuming ) to derive the mass outflow rate, = 22 yr-1. Comparing this number with the estimated SFR ( yr-1), we get a mass-loading factor, /SFR = for the outflow traced by the large-scale dusty filaments in NGC 1808 (the dependence of on the SFR is shown in Fig. 8). For comparison, Krieger et al. (2019) found that the nearby starburst galaxy NGC 253 has a present-day SFR between yr-1 while ejecting mass from the central 340 pc at a rate of yr-1 for a mass loading factor of . In independent analyses of the dusty halo of NGC 891, Hodges-Kluck et al. (2018) and Yoon et al. (2021) find that a SFR of yr-1 over a timescale on the order 108 yr is capable of ejecting 109 of gas and dust, yielding a mass-loading factor . Finally, the classic starburst galaxy M82 with the iconic multi-phase galactic wind has (Leroy et al., 2015; Veilleux et al., 2005, 2020; Yuan et al., 2023). The mass-loading factor we find for the dusty outflow in NGC 1808 is therefore typical of starburst galaxies, given the rather large uncertainties on this estimate. For comparison with an AGN-driven outflow, Veilleux et al. (2021) find a mass-loading factor in NGC 3079 above 100. The discrepancy between this value and what we find in NGC 1808 is in line with the conclusions of prior work that the AGN in NGC 1808 is rather weak (Salak et al., 2018) and energetically unimportant in driving the observed large-scale outflow.
Up to now, we have not included the energetics of the southern outflow beyond 7 kpc (light red region in Fig. 5), since beyond that height the outflow emission starts to overlap with the spiral arm emission and we cannot distinguish between the two sources of emission. In that extended region where the spiral arm overlaps with the outflow, we derive a dust mass of (Table 3) out to a height of 9 kpc, with a flux-weighted mid-height of 5.7 kpc. To lift just this dust mass out to this height requires ergs, or ergs when the gas is also considered.
To reach the maximum height of 9 kpc, we must assume a higher initial velocity of 470 km s-1 for the dust material with lower initial velocity will not reach that height. We derive a dynamical time of 36 Myr for material traveling balistically from the nucleus at 470 km s-1 and reaching a height of 9 kpc with zero velocity. We expect material in the region kpc southwest of the bar to have a flux-weighted average velocity of 290 km s-1. The energetics needed to produce the northern cone and extended southern cone is ergs. A constant starburst at the measured SFR can provide this energy in Myr, where is the efficiency of energy injection. Using = 36 Myr, the mass-loading factor ranges over , which is still largely consistent with those of nearby starburst-driven winds. These numbers should be considered upper limits given the likely FIR flux contamination from the spiral arm.
5 Conclusions
The main results from our analysis of multi-wavelength archival data on the multi-phase outflow in the starburst galaxy NGC 1808 are the following:
-
•
Herschel FIR flux maps, particularly at 70 µm and 100 µm, show extraplanar filaments that extend up to heights of 13 kpc from the galactic mid-plane and trace an edge-brightened bicone. Our analysis of the flux ratio map shows that dust along the edges of the cones is warmer than in the surrounding gas. The Spitzer flux ratio map shows emission from PAH molecules within the cones out to heights of kpc. The full extent of the southern FIR emission is uncertain because it overlaps with emission from the spiral arm in that region.
-
•
We derive the dust temperatures and masses in the stellar bar, northern emission cone, and two regions in the southern emission cone via SED fitting. Extraplanar dust constitutes at least of the total dust mass in the galaxy. We derive a star formation rate SFR = 3.5 yr-1 in the stellar bar, based on the total infrared luminosity derived from fits to the FIR data. Unobscured UV radiation may account for up to an additional 1.9 yr-1, for a total SFR of up to 5.4 yr-1. The starburst may not fully account for the elevated temperature of the extraplanar dust; radiative shocks may also contribute to the heating.
-
•
We compare the energy needed to lift the dusty material in the biconical FIR filaments with the energy produced by the starburst in the stellar bar. Assuming a Milky-Way like dust-to-gas ratio, the energy injection rate of the current starburst must have been maintained for the past (4-26) Myr, where is the efficiency of energy transfer from supernovae to the surrounding environment, to reproduce the dusty filaments. The range in the starburst age stems from uncertainties on the SFR and the corresponding supernova rate which depends on the initial mass function.
-
•
Combining the published velocities of the dusty neutral-atomic gas at 1 kpc with our morphological measurements of the dusty filaments, we derive an outflow dynamical time of 20 Myr, a mass outflow rate of 22 yr-1 and mass-loading factor of , similar to that of other nearby starburst-driven outflows.
The Herschel Science Archive has proven to be a valuable source of data to map dust in nearby galaxies with galactic winds, but it does not have the required sensitivity to probe dust on CGM scale. With the recent decommissioning of the Stratospheric Observatory For Infrared Astronomy (SOFIA), this state of affairs will persist for the foreseeable future until the launch of a next-generation far-infrared space observatory, possibly in the next decade as part of NASA’s new astrophysics probe program (e.g., Moullet et al., 2023).
References
- Astropy Collaboration et al. (2013) Astropy Collaboration, Robitaille, T. P., Tollerud, E. J., et al. 2013, A&A, 558, A33, doi: 10.1051/0004-6361/201322068
- Astropy Collaboration et al. (2018) Astropy Collaboration, Price-Whelan, A. M., Sipőcz, B. M., et al. 2018, AJ, 156, 123, doi: 10.3847/1538-3881/aabc4f
- Audibert et al. (2021) Audibert, A., Combes, F., García-Burillo, S., et al. 2021, A&A, 656, A60, doi: 10.1051/0004-6361/202039886
- Bell (2003) Bell, E. F. 2003, ApJ, 586, 794, doi: 10.1086/367829
- Chen et al. (2023) Chen, G., Bendo, G. J., Fuller, G. A., Henkel, C., & Kong, X. 2023, MNRAS, 525, 3645, doi: 10.1093/mnras/stad2450
- Chevalier & Clegg (1985) Chevalier, R. A., & Clegg, A. W. 1985, Nature, 317, 44, doi: 10.1038/317044a0
- Dahlem et al. (1990) Dahlem, M., Aalto, S., Klein, U., et al. 1990, A&A, 240, 237
- Dahlem et al. (1994) Dahlem, M., Hartner, G. D., & Junkes, N. 1994, ApJ, 432, 598, doi: 10.1086/174598
- Dopita et al. (2016) Dopita, M. A., Seitenzahl, I. R., Sutherland, R. S., et al. 2016, ApJ, 826, 150, doi: 10.3847/0004-637X/826/2/150
- Dopita & Sutherland (1995) Dopita, M. A., & Sutherland, R. S. 1995, ApJ, 455, 468, doi: 10.1086/176596
- Draine (2003) Draine, B. T. 2003, ARA&A, 41, 241, doi: 10.1146/annurev.astro.41.011802.094840
- Draine et al. (2007) Draine, B. T., Dale, D. A., Bendo, G., et al. 2007, ApJ, 663, 866, doi: 10.1086/518306
- Engelbracht et al. (2006) Engelbracht, C. W., Kundurthy, P., Gordon, K. D., et al. 2006, ApJ, 642, L127, doi: 10.1086/504590
- Faucher-Giguère & Oh (2023) Faucher-Giguère, C.-A., & Oh, S. P. 2023, ARA&A, 61, 131, doi: 10.1146/annurev-astro-052920-125203
- Forbes et al. (1992) Forbes, D. A., Boisson, C., & Ward, M. J. 1992, MNRAS, 259, 293, doi: 10.1093/mnras/259.2.293
- Gardner et al. (2006) Gardner, J. P., Mather, J. C., Clampin, M., et al. 2006, Space Sci. Rev., 123, 485, doi: 10.1007/s11214-006-8315-7
- Hao et al. (2011) Hao, H., Elvis, M., Civano, F., & Lawrence, A. 2011, ApJ, 733, 108, doi: 10.1088/0004-637X/733/2/108
- Heckman et al. (1990) Heckman, T. M., Armus, L., & Miley, G. K. 1990, ApJS, 74, 833, doi: 10.1086/191522
- Heike & Awaki (2007) Heike, K., & Awaki, H. 2007, PASJ, 59, 531, doi: 10.1093/pasj/59.3.531
- Hodges-Kluck & Bregman (2014) Hodges-Kluck, E., & Bregman, J. N. 2014, ApJ, 789, 131, doi: 10.1088/0004-637X/789/2/131
- Hodges-Kluck et al. (2016) Hodges-Kluck, E., Cafmeyer, J., & Bregman, J. N. 2016, ApJ, 833, 58, doi: 10.3847/1538-4357/833/1/58
- Hodges-Kluck et al. (2018) Hodges-Kluck, E. J., Bregman, J. N., & Li, J.-t. 2018, ApJ, 866, 126, doi: 10.3847/1538-4357/aae38a
- Hoopes et al. (2005) Hoopes, C. G., Heckman, T. M., Strickland, D. K., et al. 2005, ApJ, 619, L99, doi: 10.1086/423032
- Jiménez-Bailón et al. (2005) Jiménez-Bailón, E., Santos-Lleó, M., Dahlem, M., et al. 2005, A&A, 442, 861, doi: 10.1051/0004-6361:20053022
- Jo et al. (2018) Jo, Y.-S., Seon, K.-i., Shinn, J.-H., et al. 2018, ApJ, 862, 25, doi: 10.3847/1538-4357/aacbca
- Junkes et al. (1995) Junkes, N., Zinnecker, H., Hensler, G., Dahlem, M., & Pietsch, W. 1995, A&A, 294, 8
- Kennicutt & Evans (2012) Kennicutt, R. C., & Evans, N. J. 2012, ARA&A, 50, 531, doi: 10.1146/annurev-astro-081811-125610
- Koribalski et al. (1993) Koribalski, B., Dahlem, M., Mebold, U., & Brinks, E. 1993, A&A, 268, 14
- Koribalski et al. (1996) Koribalski, B., Dettmar, R. J., Mebold, U., & Wielebinski, R. 1996, A&A, 315, 71
- Krabbe et al. (1994) Krabbe, A., Sternberg, A., & Genzel, R. 1994, ApJ, 425, 72, doi: 10.1086/173964
- Krieger et al. (2019) Krieger, N., Bolatto, A. D., Walter, F., et al. 2019, ApJ, 881, 43, doi: 10.3847/1538-4357/ab2d9c
- Laurent et al. (2000) Laurent, O., Mirabel, I. F., Charmandaris, V., et al. 2000, A&A, 359, 887, doi: 10.48550/arXiv.astro-ph/0005376
- Leroy et al. (2015) Leroy, A. K., Walter, F., Martini, P., et al. 2015, ApJ, 814, 83, doi: 10.1088/0004-637X/814/2/83
- Marconcini et al. (2023) Marconcini, C., Marconi, A., Cresci, G., et al. 2023, A&A, 677, A58, doi: 10.1051/0004-6361/202346821
- McCormick et al. (2013) McCormick, A., Veilleux, S., & Rupke, D. S. N. 2013, ApJ, 774, 126, doi: 10.1088/0004-637X/774/2/126
- McCormick et al. (2018) McCormick, A., Veilleux, S., Meléndez, M., et al. 2018, MNRAS, 477, 699, doi: 10.1093/mnras/sty634
- Meléndez et al. (2015) Meléndez, M., Veilleux, S., Martin, C., et al. 2015, ApJ, 804, 46, doi: 10.1088/0004-637X/804/1/46
- Ménard & Fukugita (2012) Ménard, B., & Fukugita, M. 2012, ApJ, 754, 116, doi: 10.1088/0004-637X/754/2/116
- Moullet et al. (2023) Moullet, A., Kataria, T., Lis, D., et al. 2023, arXiv e-prints, arXiv:2310.20572, doi: 10.48550/arXiv.2310.20572
- Muñoz-Mateos et al. (2015) Muñoz-Mateos, J. C., Sheth, K., Regan, M., et al. 2015, ApJS, 219, 3, doi: 10.1088/0067-0049/219/1/3
- Murphy et al. (2011) Murphy, E. J., Condon, J. J., Schinnerer, E., et al. 2011, ApJ, 737, 67, doi: 10.1088/0004-637X/737/2/67
- Murray et al. (2005) Murray, N., Quataert, E., & Thompson, T. A. 2005, ApJ, 618, 569, doi: 10.1086/426067
- Obied et al. (2016) Obied, G., Zakamska, N. L., Wylezalek, D., & Liu, G. 2016, MNRAS, 456, 2861, doi: 10.1093/mnras/stv2850
- Peek et al. (2015) Peek, J. E. G., Ménard, B., & Corrales, L. 2015, ApJ, 813, 7, doi: 10.1088/0004-637X/813/1/7
- Phillips (1993) Phillips, A. C. 1993, AJ, 105, 486, doi: 10.1086/116447
- Pilbratt et al. (2010) Pilbratt, G. L., Riedinger, J. R., Passvogel, T., et al. 2010, A&A, 518, L1, doi: 10.1051/0004-6361/201014759
- Rigby et al. (2023) Rigby, J., Perrin, M., McElwain, M., et al. 2023, PASP, 135, 048001, doi: 10.1088/1538-3873/acb293
- Roussel et al. (2010) Roussel, H., Wilson, C. D., Vigroux, L., et al. 2010, A&A, 518, L66, doi: 10.1051/0004-6361/201014567
- Rupke et al. (2021) Rupke, D. S. N., Thomas, A. D., & Dopita, M. A. 2021, MNRAS, 503, 4748, doi: 10.1093/mnras/stab743
- Salak et al. (2016) Salak, D., Nakai, N., Hatakeyama, T., & Miyamoto, Y. 2016, ApJ, 823, 68, doi: 10.3847/0004-637X/823/1/68
- Salak et al. (2019) Salak, D., Nakai, N., Seta, M., & Miyamoto, Y. 2019, ApJ, 887, 143, doi: 10.3847/1538-4357/ab55dc
- Salak et al. (2017) Salak, D., Tomiyasu, Y., Nakai, N., et al. 2017, ApJ, 849, 90, doi: 10.3847/1538-4357/aa91cb
- Salak et al. (2018) —. 2018, ApJ, 856, 97, doi: 10.3847/1538-4357/aab2ac
- Seon et al. (2014) Seon, K.-i., Witt, A. N., Shinn, J.-h., & Kim, I.-j. 2014, ApJ, 785, L18, doi: 10.1088/2041-8205/785/1/L18
- Sharp & Bland-Hawthorn (2010) Sharp, R. G., & Bland-Hawthorn, J. 2010, ApJ, 711, 818, doi: 10.1088/0004-637X/711/2/818
- Sheth et al. (2010) Sheth, K., Regan, M., Hinz, J. L., et al. 2010, PASP, 122, 1397, doi: 10.1086/657638
- Shinn (2018) Shinn, J.-H. 2018, ApJS, 239, 21, doi: 10.3847/1538-4365/aae3e5
- Thornton et al. (1998) Thornton, K., Gaudlitz, M., Janka, H. T., & Steinmetz, M. 1998, ApJ, 500, 95, doi: 10.1086/305704
- Tully et al. (2009) Tully, R. B., Rizzi, L., Shaya, E. J., et al. 2009, AJ, 138, 323, doi: 10.1088/0004-6256/138/2/323
- Tully et al. (2013) Tully, R. B., Courtois, H. M., Dolphin, A. E., et al. 2013, AJ, 146, 86, doi: 10.1088/0004-6256/146/4/86
- Tumlinson et al. (2017) Tumlinson, J., Peeples, M. S., & Werk, J. K. 2017, ARA&A, 55, 389, doi: 10.1146/annurev-astro-091916-055240
- Veilleux et al. (2005) Veilleux, S., Cecil, G., & Bland-Hawthorn, J. 2005, ARA&A, 43, 769, doi: 10.1146/annurev.astro.43.072103.150610
- Veilleux et al. (2020) Veilleux, S., Maiolino, R., Bolatto, A. D., & Aalto, S. 2020, A&A Rev., 28, 2, doi: 10.1007/s00159-019-0121-9
- Veilleux et al. (2001) Veilleux, S., Shopbell, P. L., & Miller, S. T. 2001, AJ, 121, 198, doi: 10.1086/318046
- Veilleux et al. (2021) Veilleux, S., Meléndez, M., Stone, M., et al. 2021, MNRAS, 508, 4902, doi: 10.1093/mnras/stab2881
- Veilleux et al. (2023) Veilleux, S., Liu, W., Vayner, A., et al. 2023, ApJ, 953, 56, doi: 10.3847/1538-4357/ace10f
- Wylezalek et al. (2016) Wylezalek, D., Zakamska, N. L., Liu, G., & Obied, G. 2016, MNRAS, 457, 745, doi: 10.1093/mnras/stv3022
- Wylezalek et al. (2022) Wylezalek, D., Vayner, A., Rupke, D. S. N., et al. 2022, ApJ, 940, L7, doi: 10.3847/2041-8213/ac98c3
- Yoon et al. (2021) Yoon, J. H., Martin, C. L., Veilleux, S., et al. 2021, MNRAS, 502, 969, doi: 10.1093/mnras/staa3583
- Yuan et al. (2023) Yuan, Y., Krumholz, M. R., & Martin, C. L. 2023, MNRAS, 518, 4084, doi: 10.1093/mnras/stac3241
- Zakamska et al. (2006) Zakamska, N. L., Strauss, M. A., Krolik, J. H., et al. 2006, AJ, 132, 1496, doi: 10.1086/506986