Percolation of nonequilibrium assemblies of colloidal particles in active chiral liquids
Abstract
The growing interest in the non-equilibrium assembly of colloidal particles in active liquids is driven by the motivation to create novel structures endowed with tunable properties unattainable within the confines of equilibrium systems. Here, we present an experimental investigation of the structural features of colloidal assemblies in active liquids of chiral E. coli. The colloidal particles form dynamic clusters due to the effective interaction mediated by active media. The activity and chirality of the swimmers strongly influence the dynamics and local ordering of colloidal particles, resulting in clusters with persistent rotation, whose structure differs significantly from those in equilibrium systems with attractive interactions, such as colloid-polymer mixtures. The colloid-bacteria mixture displays several hallmark features of a percolation transition at a critical density, where the clusters span the system size. However, a closer examination of the critical exponents associated with cluster size distribution, average cluster size, and correlation length in the vicinity of the critical density suggest strong deviations from the prediction of the standard continuum percolation model. Therefore, our experiments reveal a richer phase behavior of colloidal assemblies in active liquids.
I Introduction
A defining characteristic of active matter is the internal energy source that drives the system out of equilibrium[1, 2]. Various living and synthetic systems, spanning a wide range of length scales and featuring diverse interaction rules among their elementary constituents, fall within this category. Examples include living systems, ranging from animals to bacteria, and synthetic systems such as microtubules driven by molecular motors [3], suspensions of Janus particles [4] or Quincke rollers [5], and others. The distinguishing feature of active systems lies in their departure from the principles of detailed balance and time reversal symmetry. This deviation from equilibrium constraints gives rise to fascinating emergent phenomena, such as flocking [6, 5, 7], motility-induced phase separation [8, 9, 10], active turbulence [11], and superfluidity [12]. Nonequilibrium fluctuations in active systems have been exploited for various applications, including the self-assembly of novel biomimetic materials with diverse functionalities and drug delivery, among others [2].
In recent years, there has been a growing interest in understanding the phase behavior of mixtures involving both active and passive components, particularly emphasizing the phase behavior of passive entities in active liquids. Earlier experiments investigated the hierarchical organization of bio-polymers driven by molecular motors, leading to considerable insight into active gels [13, 14, 15, 16]. These materials are inherently out of equilibrium, mimicking the nonlinear mechanical properties of cellular materials. Such studies have inspired the investigation of colloidal analogs of active gels. However, experiments on this topic are limited [17]. The aspects that have received attention include the transport properties of colloidal particles at dilute densities [18, 19, 20, 21] and the effective interaction between a pair of colloidal particles in active fluids [22, 23, 24, 25, 26, 27]. This has led to a better understanding of the interaction between passive and active particles. Despite these advances, the collective behavior of dense assemblies of colloidal particles in active liquids remains poorly explored in experimental systems. Recent experiments have reported dynamic clustering of colloidal particles in active liquids of E. coli suspensions [28, 29, 30]. The structure and size of the aggregates were reported to depend on the size ratio of colloidal particles to active particles [31, 29] and the density of active particles [28, 30]. Earlier studies have revealed that E. coli swims in clockwise circular trajectories close to solid boundaries [32, 33], and their chiral motion leads to interesting effects, such as the persistent rotational motion in microscopic gear-like structures suspended in such liquids [34, 35]. A recent study had investigated the effect of chiral liquids on the phase behavior of sticky colloidal beads. The colloids were shown to form unconventional gel structures endowed with novel properties not achievable in equilibrium analogs [17]. The thermal analogs of such gels, assembled using colloid-polymer mixtures, have received wide attention [36, 37, 38, 39, 40], and the emergence of rigidity in these systems is well studied. The role of percolating networks, particularly the directed percolation and isotropic percolation scenarios [41, 39, 42, 40], is well appreciated. However, there is limited discussion about percolation of colloidal assemblies in active liquids where the colloids form dynamic clusters [43, 44, 45].
Here, we present the findings of an experimental investigation of the percolation transition in a system of non-sticky colloids suspended in active liquids of chiral E. coli. The experiments are conducted in close proximity to a solid-liquid interface, where the swimmers exhibit chiral trajectories. Two notable differences between our experiments and those presented in [17] are that our spheres are athermal and non-sticky. In our system, the effective interaction between the colloidal particles arises from the activity of the bath, leading to the formation of dynamic clusters [28, 29, 31], in contrast to the irreversible aggregates formed in [17]. Furthermore, the interactions of swimmers with the colloidal particles break the chiral symmetry of colloids, resulting in clusters with persistent rotations. It hinders the orientational ordering of colloids within the clusters, leading to distinct structural features compared to equilibrium colloid-polymer mixtures. The clusters in our system grow with increasing density of colloids and eventually span the system size. This phenomenon displays several hallmark features of equilibrium percolation [46, 47, 48]. However, the presence of activity and chirality gives rise to exponents that deviate from standard percolation models.
II Experimental set-up
In our study, we have realized an active-passive mixture by dispersing polystyrene beads of size 15 in active suspensions of E. coli. The procedure for preparing the active fluid is same as the one detailed in our prior publication [29]. Throughout our experiments, we maintained a constant bacterial density equivalent to , where cells/ml, unless specified explicitly. To investigate the percolation transition, we systematically varied the colloidal area-fraction from . The colloidal beads used in our study are sufficiently large, which makes the Brownian fluctuations negligible. The dynamic behavior of colloidal beads within the active fluid is exclusively driven by the inherent activity of the fluid medium and their hydrodynamic interactions[26, 27]. To facilitate our measurements, we constructed an observation chamber by affixing a circular cavity of 1 cm in diameter and 100 in depth to a coverslip coated with polyethylene glycol (PEG), using double-sided tape.
For experimentation, we thoroughly mixed the active fluid and colloidal particles before introducing them into the sample chamber, which was subsequently mounted on the microscope stage. Following the loading procedure, we allowed the system to sediment, evolve and, equilibrate for a duration of 1.5 hours before commencing our measurements. All the measurements were made in the stationary state, we captured snapshots of the sample at a speed of 10 FPS over a total duration of 500 seconds.
III Results
III.1 Chiral active liquids and chiral colloidal assemblies
 |
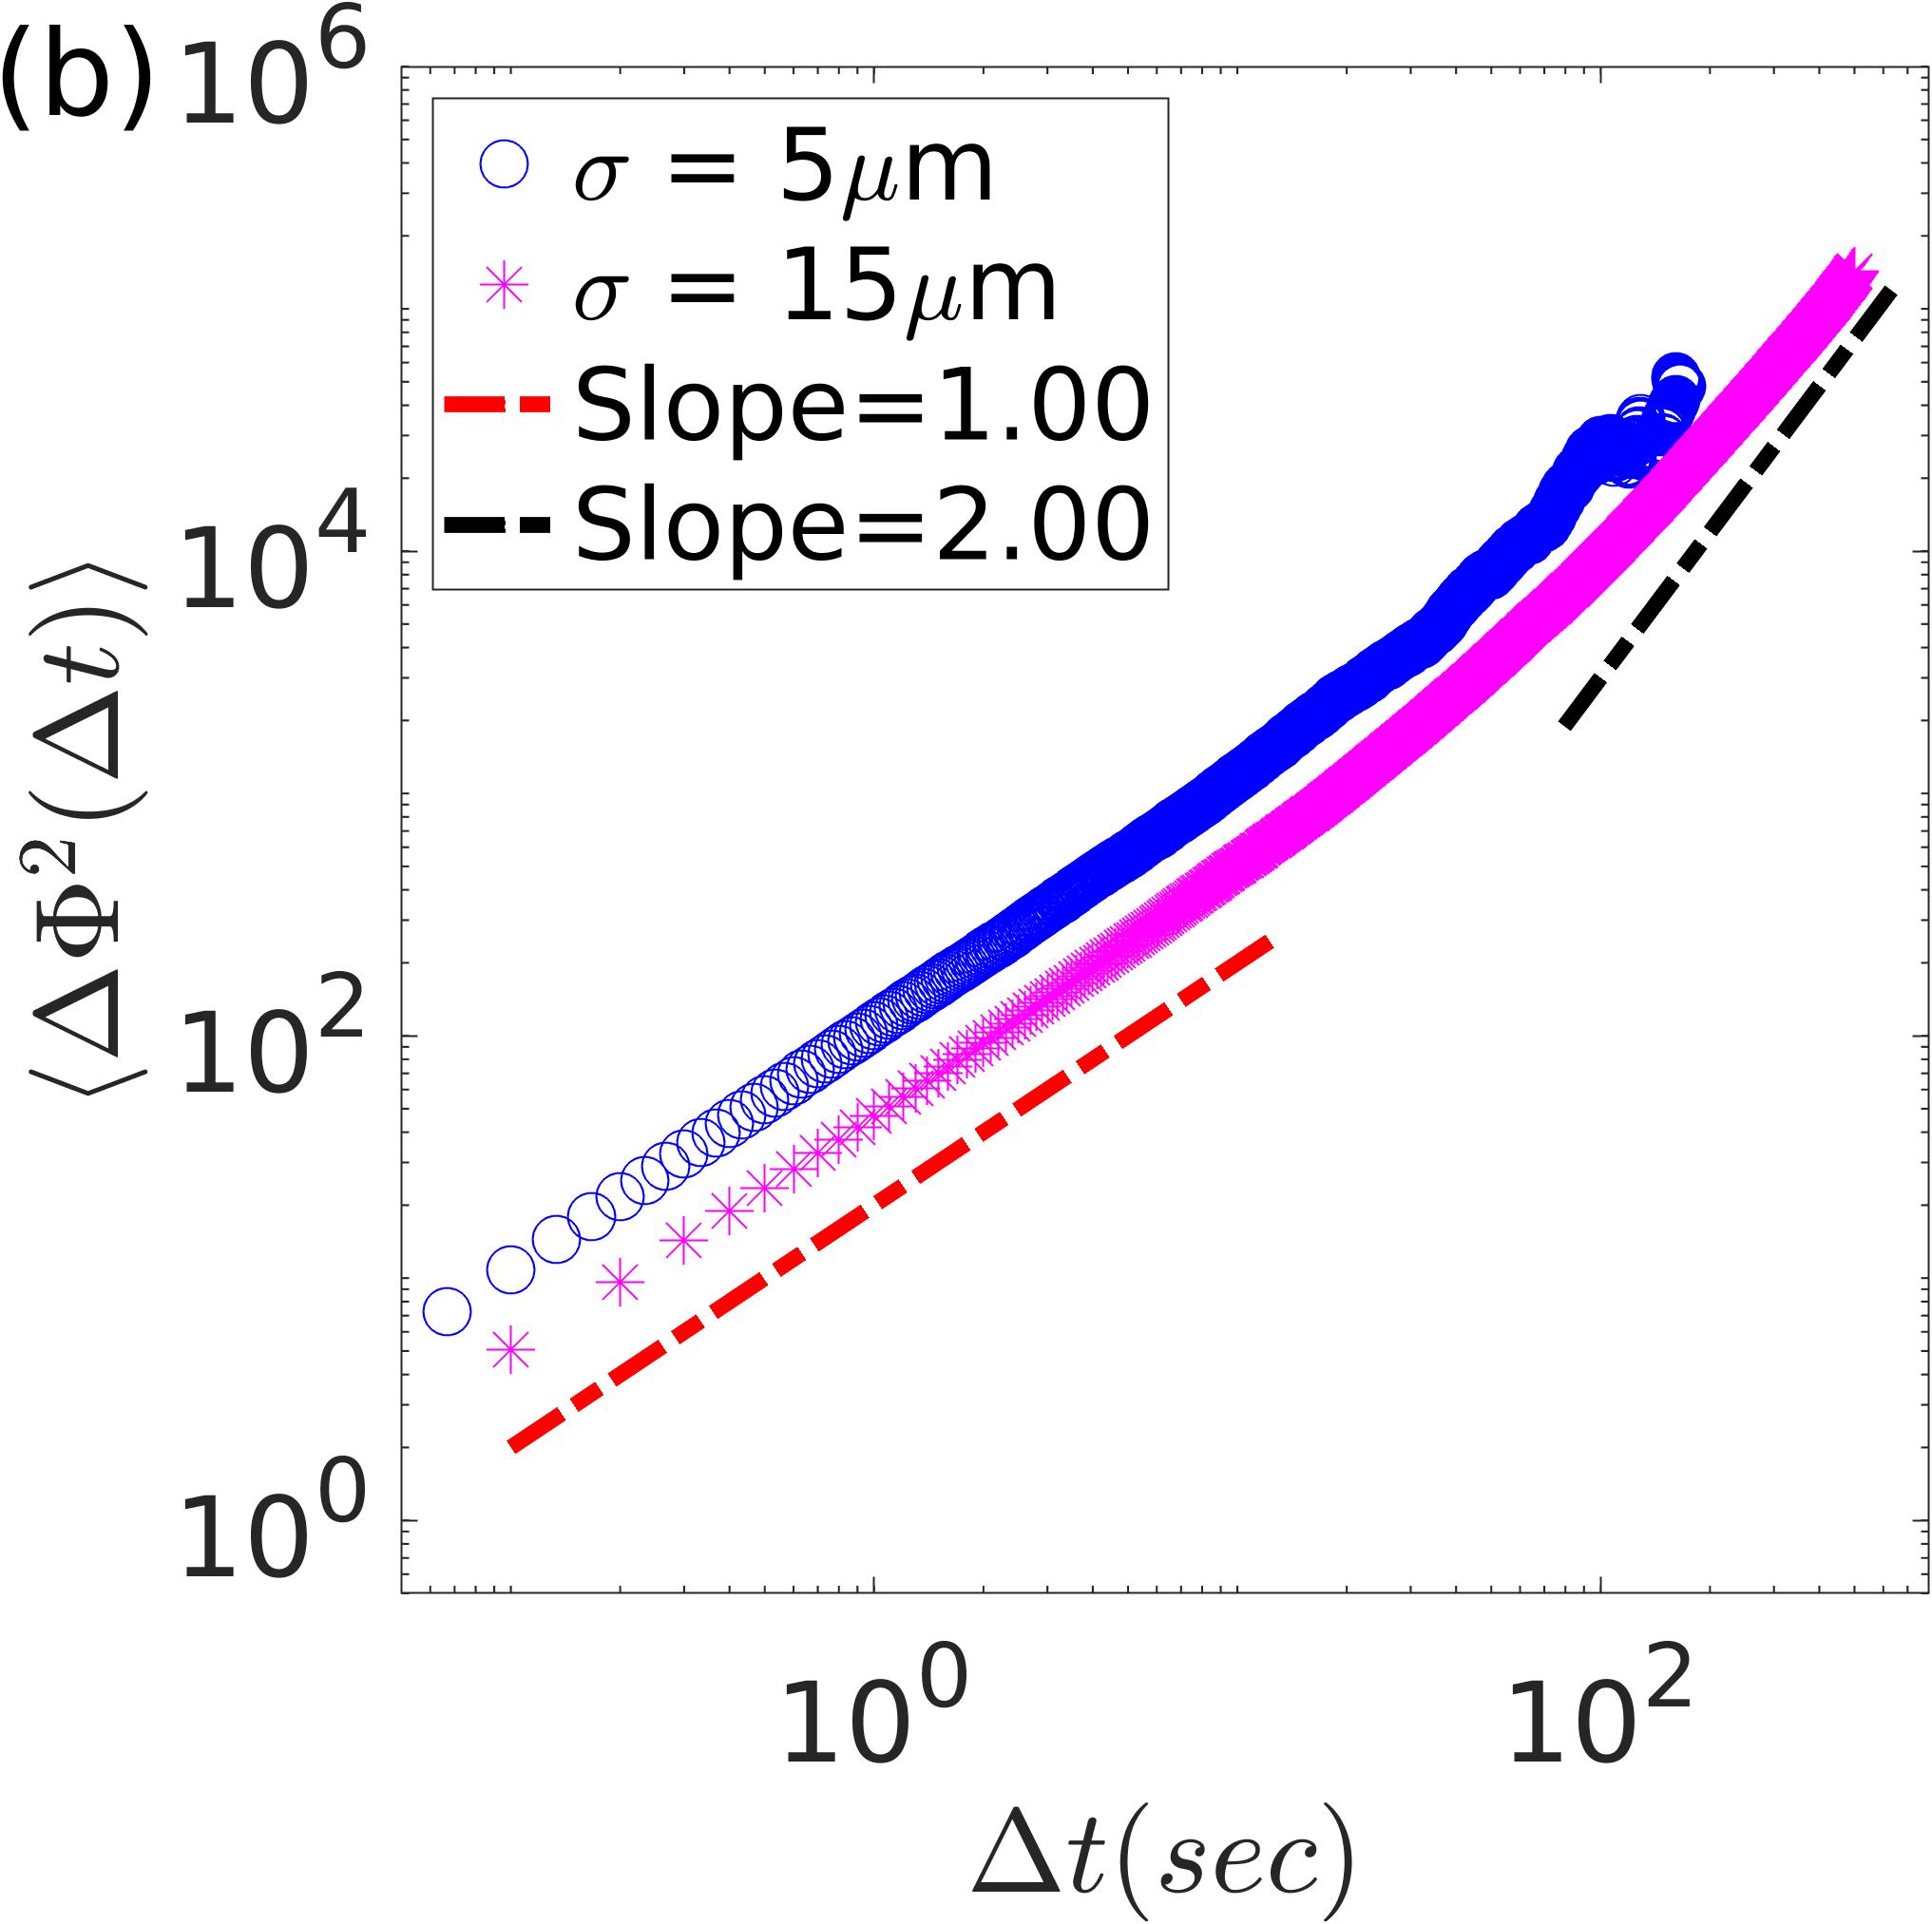 |
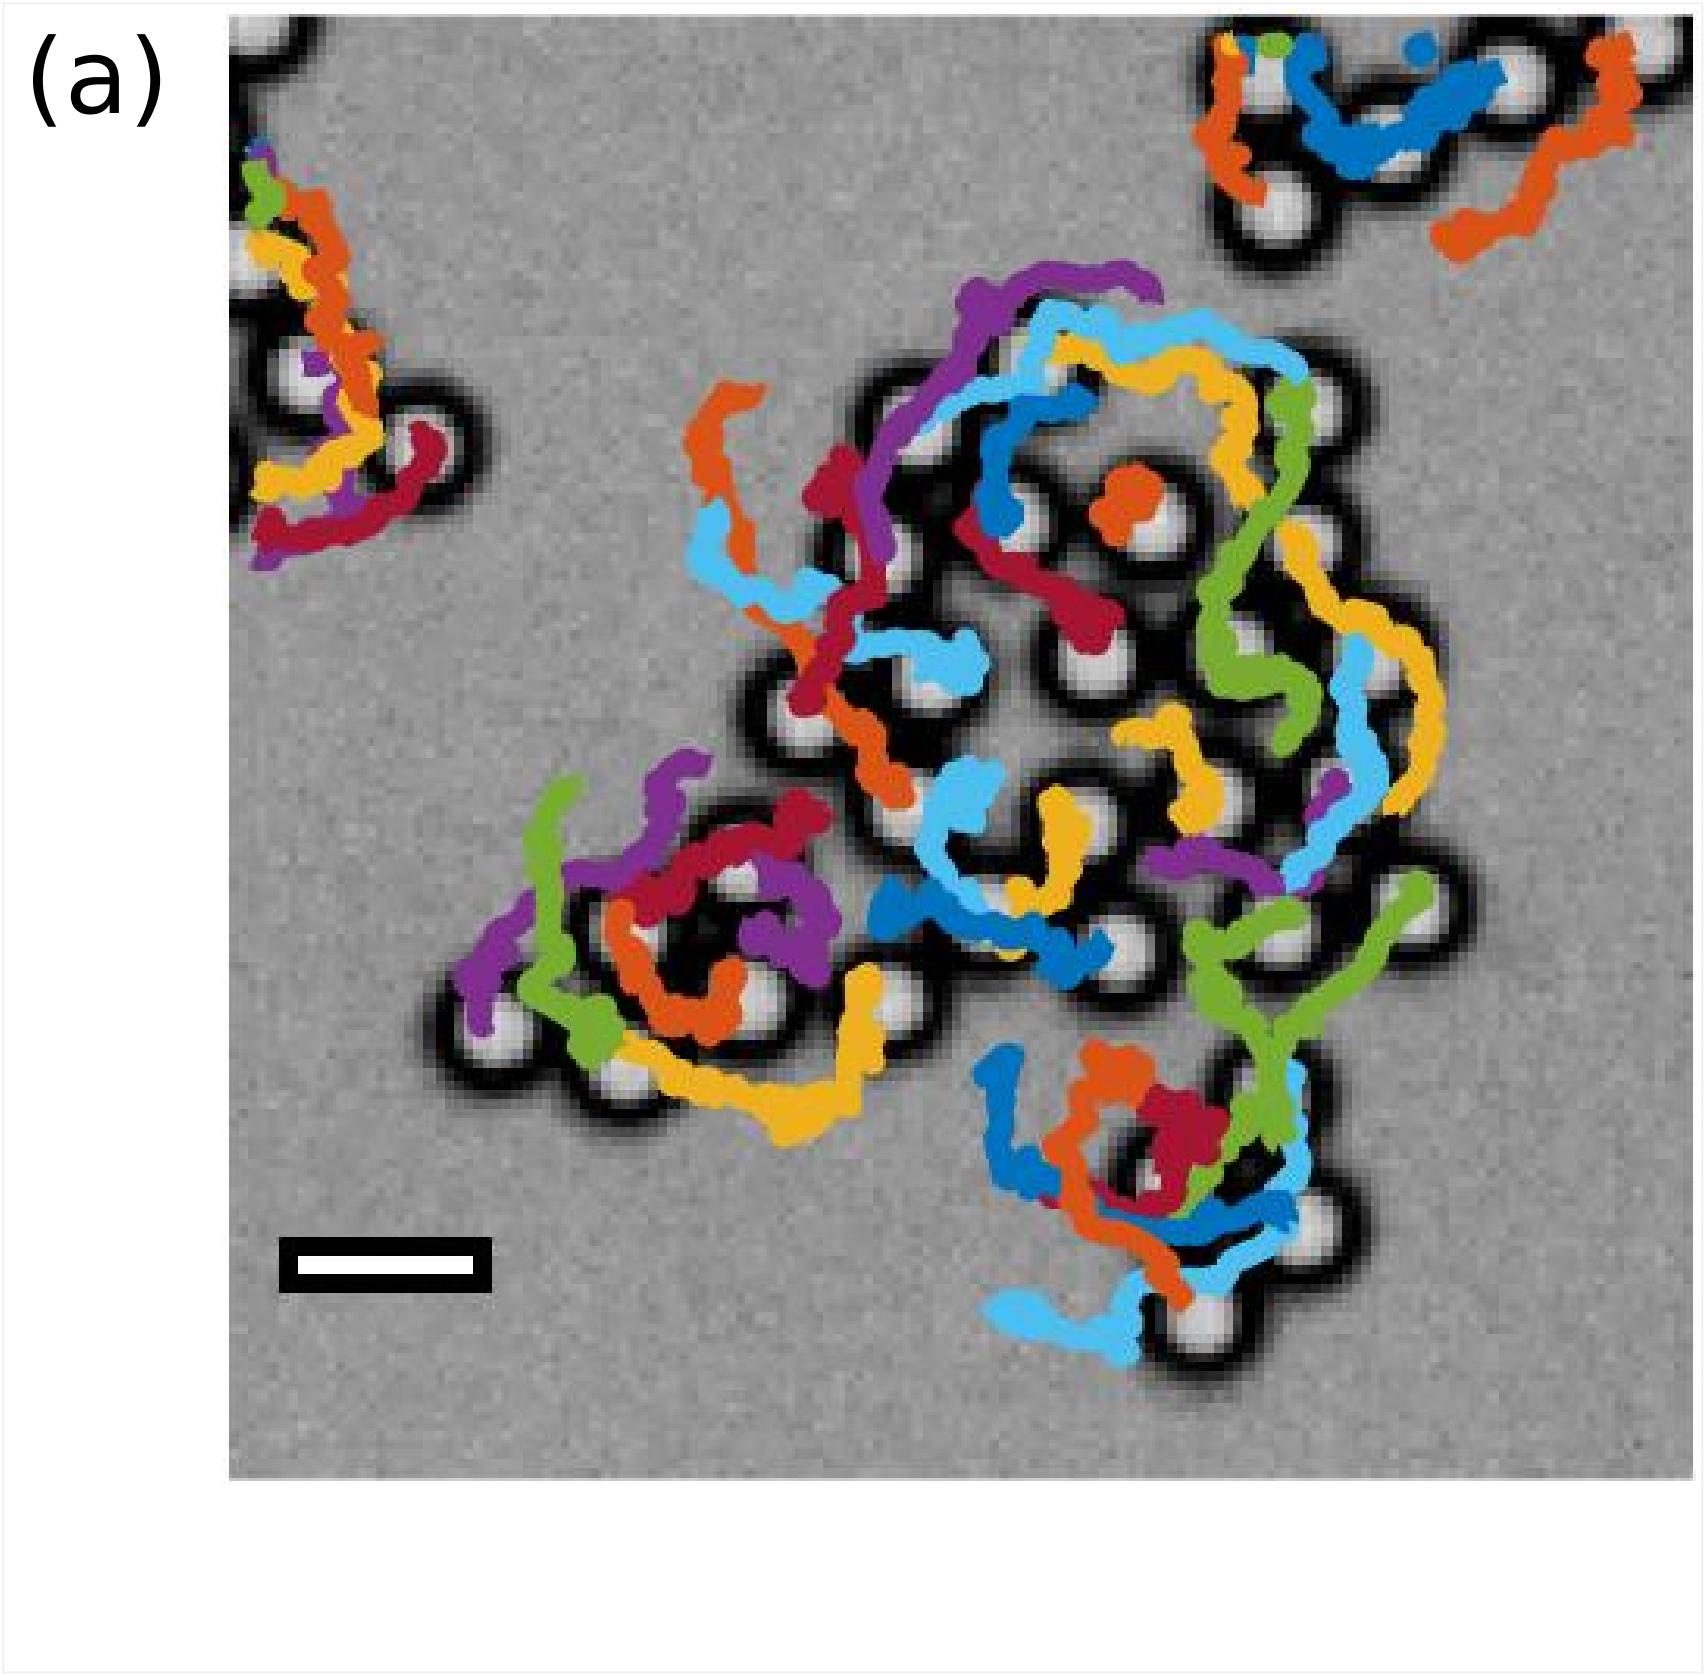
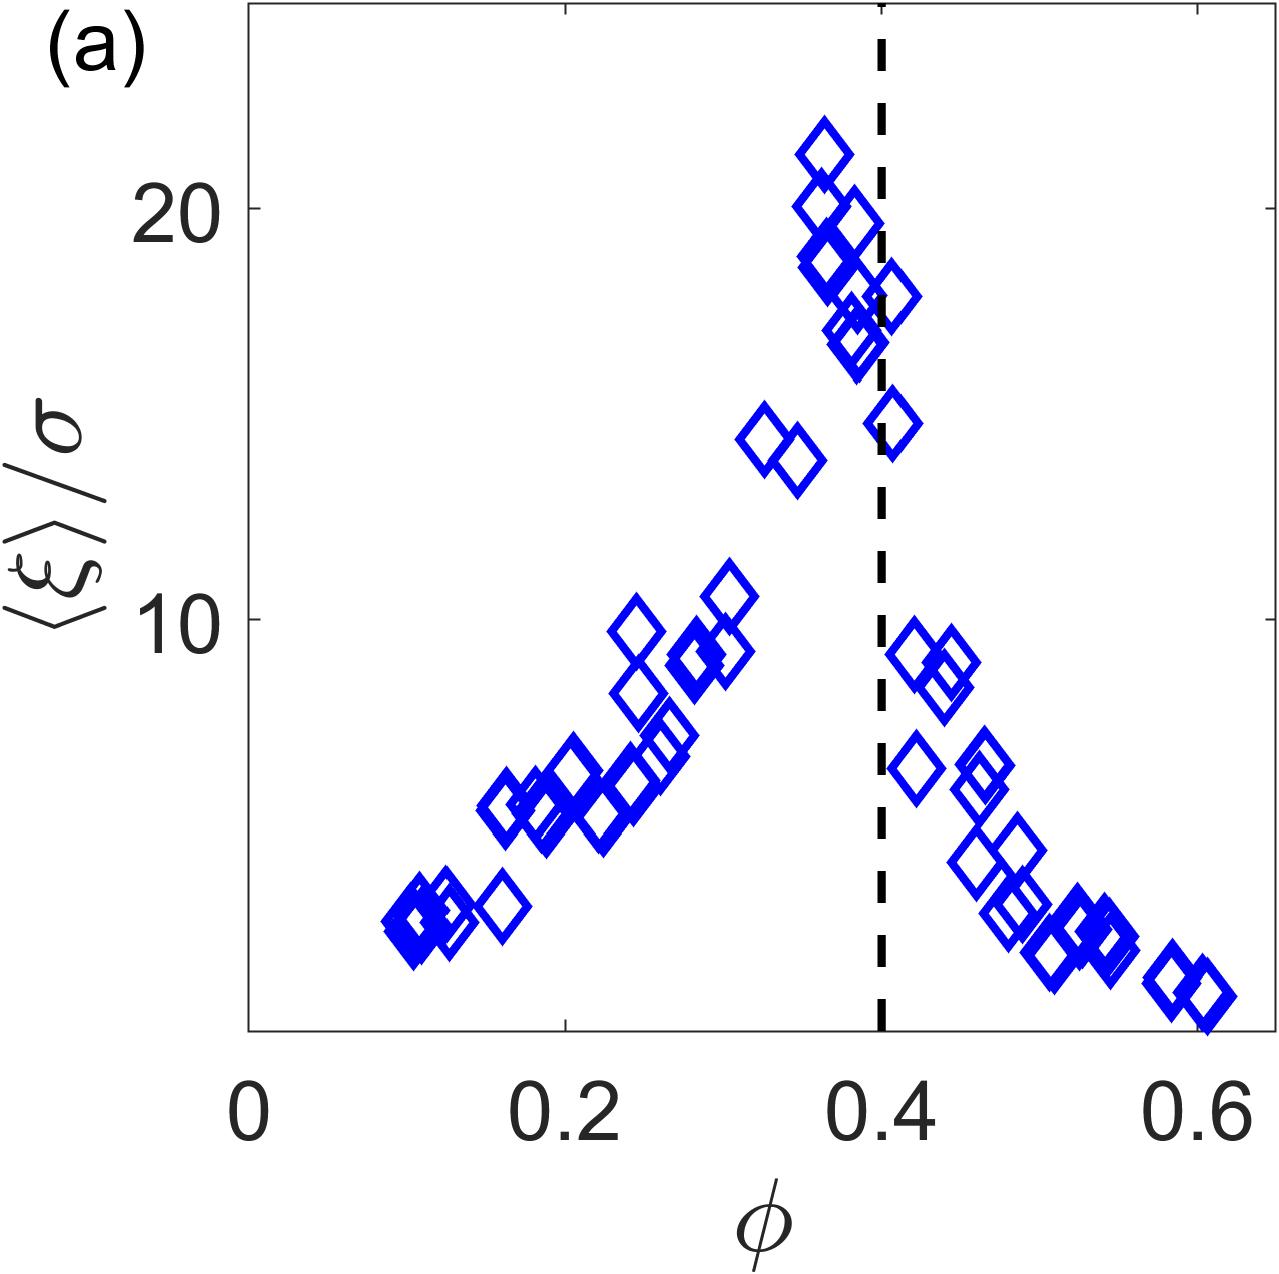
The experiments detailed in this article are conducted in close proximity to the lower boundary of the chamber, specifically at the solid-liquid interface. It is well-established that E. coli break their chiral symmetry when they swim near a boundary, resulting in curved trajectories displaying clockwise rotation [49, 32]. The colloidal particles employed in our investigation are in size and are about 5 times larger compared to the size of bacteria, so they experience a noticeable net torque due to interactions with bacteria, thereby breaking their chiral symmetry as well [34, 35, 17]. The rotation of individual colloidal particle can be visualised by suspending a Janus particle as shown in the supplementary video SV1. Furthermore, the effective interactions between colloidal particles in active liquids leads to formation of dynamic clusters [28, 29], which show persistent rotations, see supplementary video SV2 and SV3. To illustrate the rotational motion, we have plotted the trajectories of a few colloidal paticles in Fig. 1a, where the chiral motion is evident from the curved trajectories. We further compute their mean square angular displacement, which is an angular analogue of the mean square displacement. The unbounded mean square angular displacement is defined as [50], where is the total angular displacement that is integrated over the instantaneous angular displacements . The results are depicted in Fig. 1b for different sizes of colloidal particles and at a bacterial density of . The observed angular motion of particles reveals diffusive characteristics with a slope approaching 1 at short time intervals. However, over larger time scales, the larger particles clearly exhibit a persistent angular rotation, characterized by a slope nearing 2. This effect is prominent for larger () particles, compared to the smaller ones () that show super-diffusive chiral motion on measurement time scales. This chiral motion of colloidal particles and bacteria leads to interesting features as the clusters grow and percolate at a critical area-fraction of colloids.
III.2 Clusters of colloidal particles
 |
 |
 |
 |
 |
 |
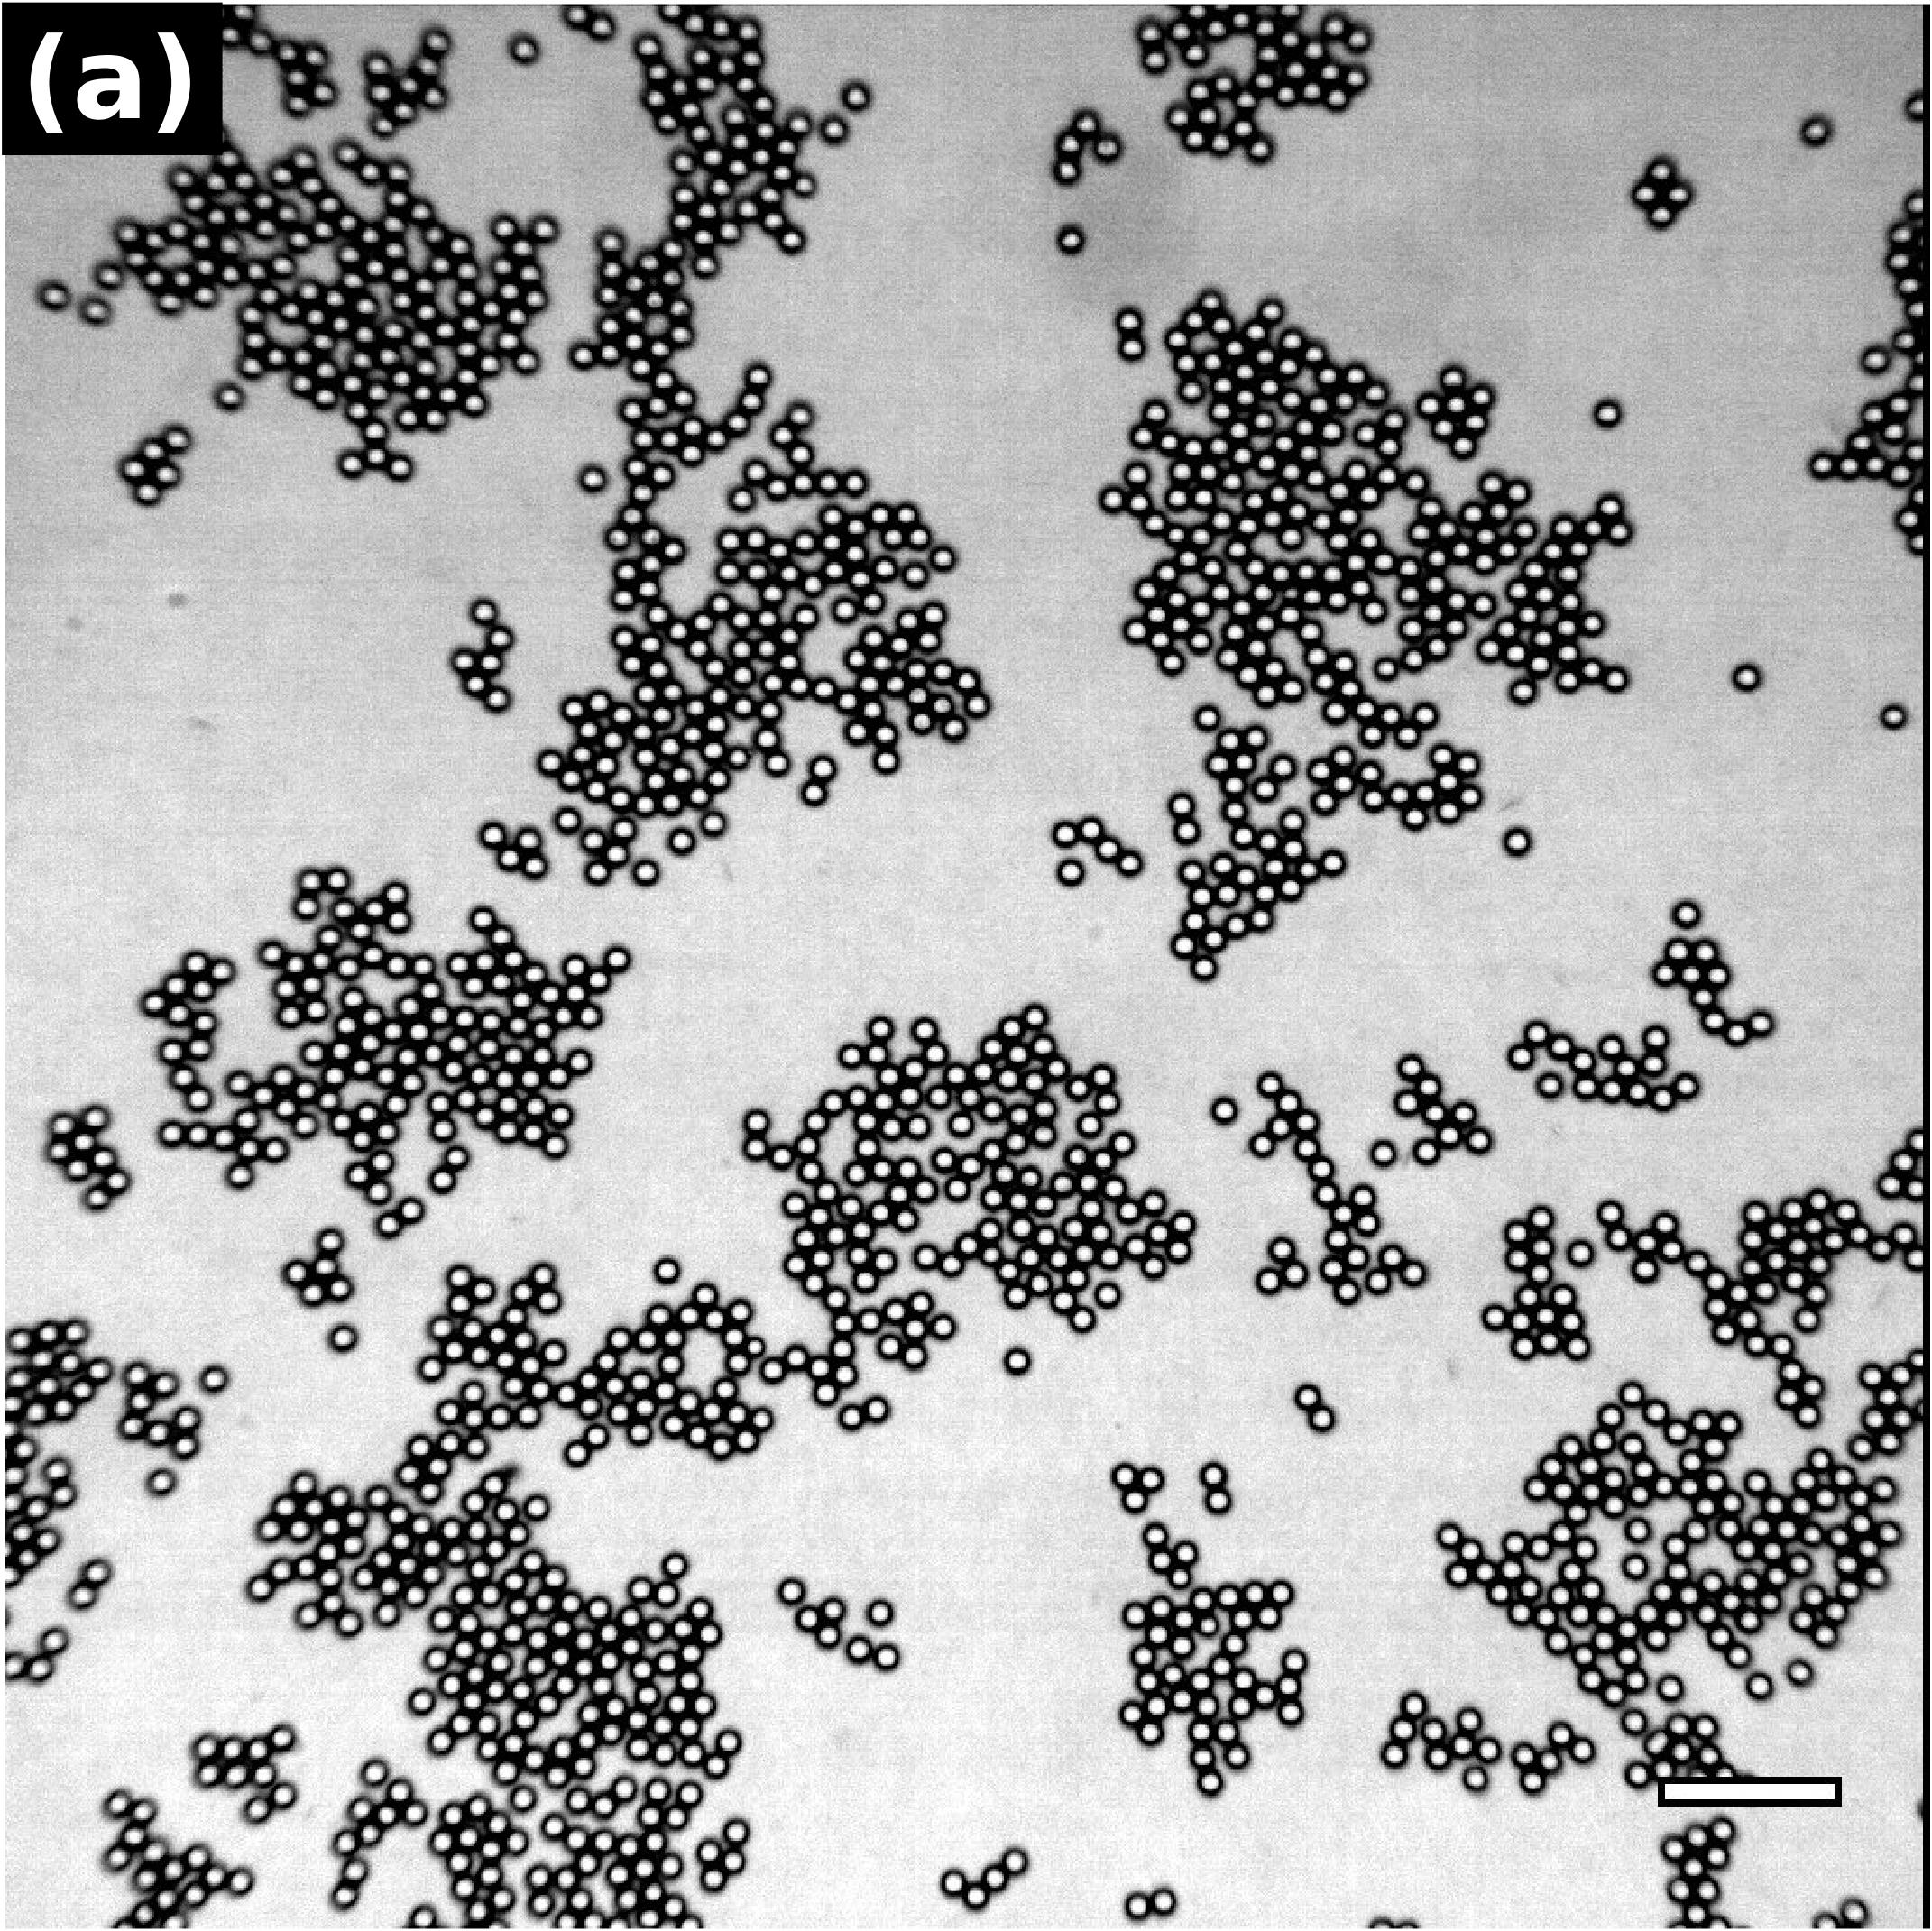
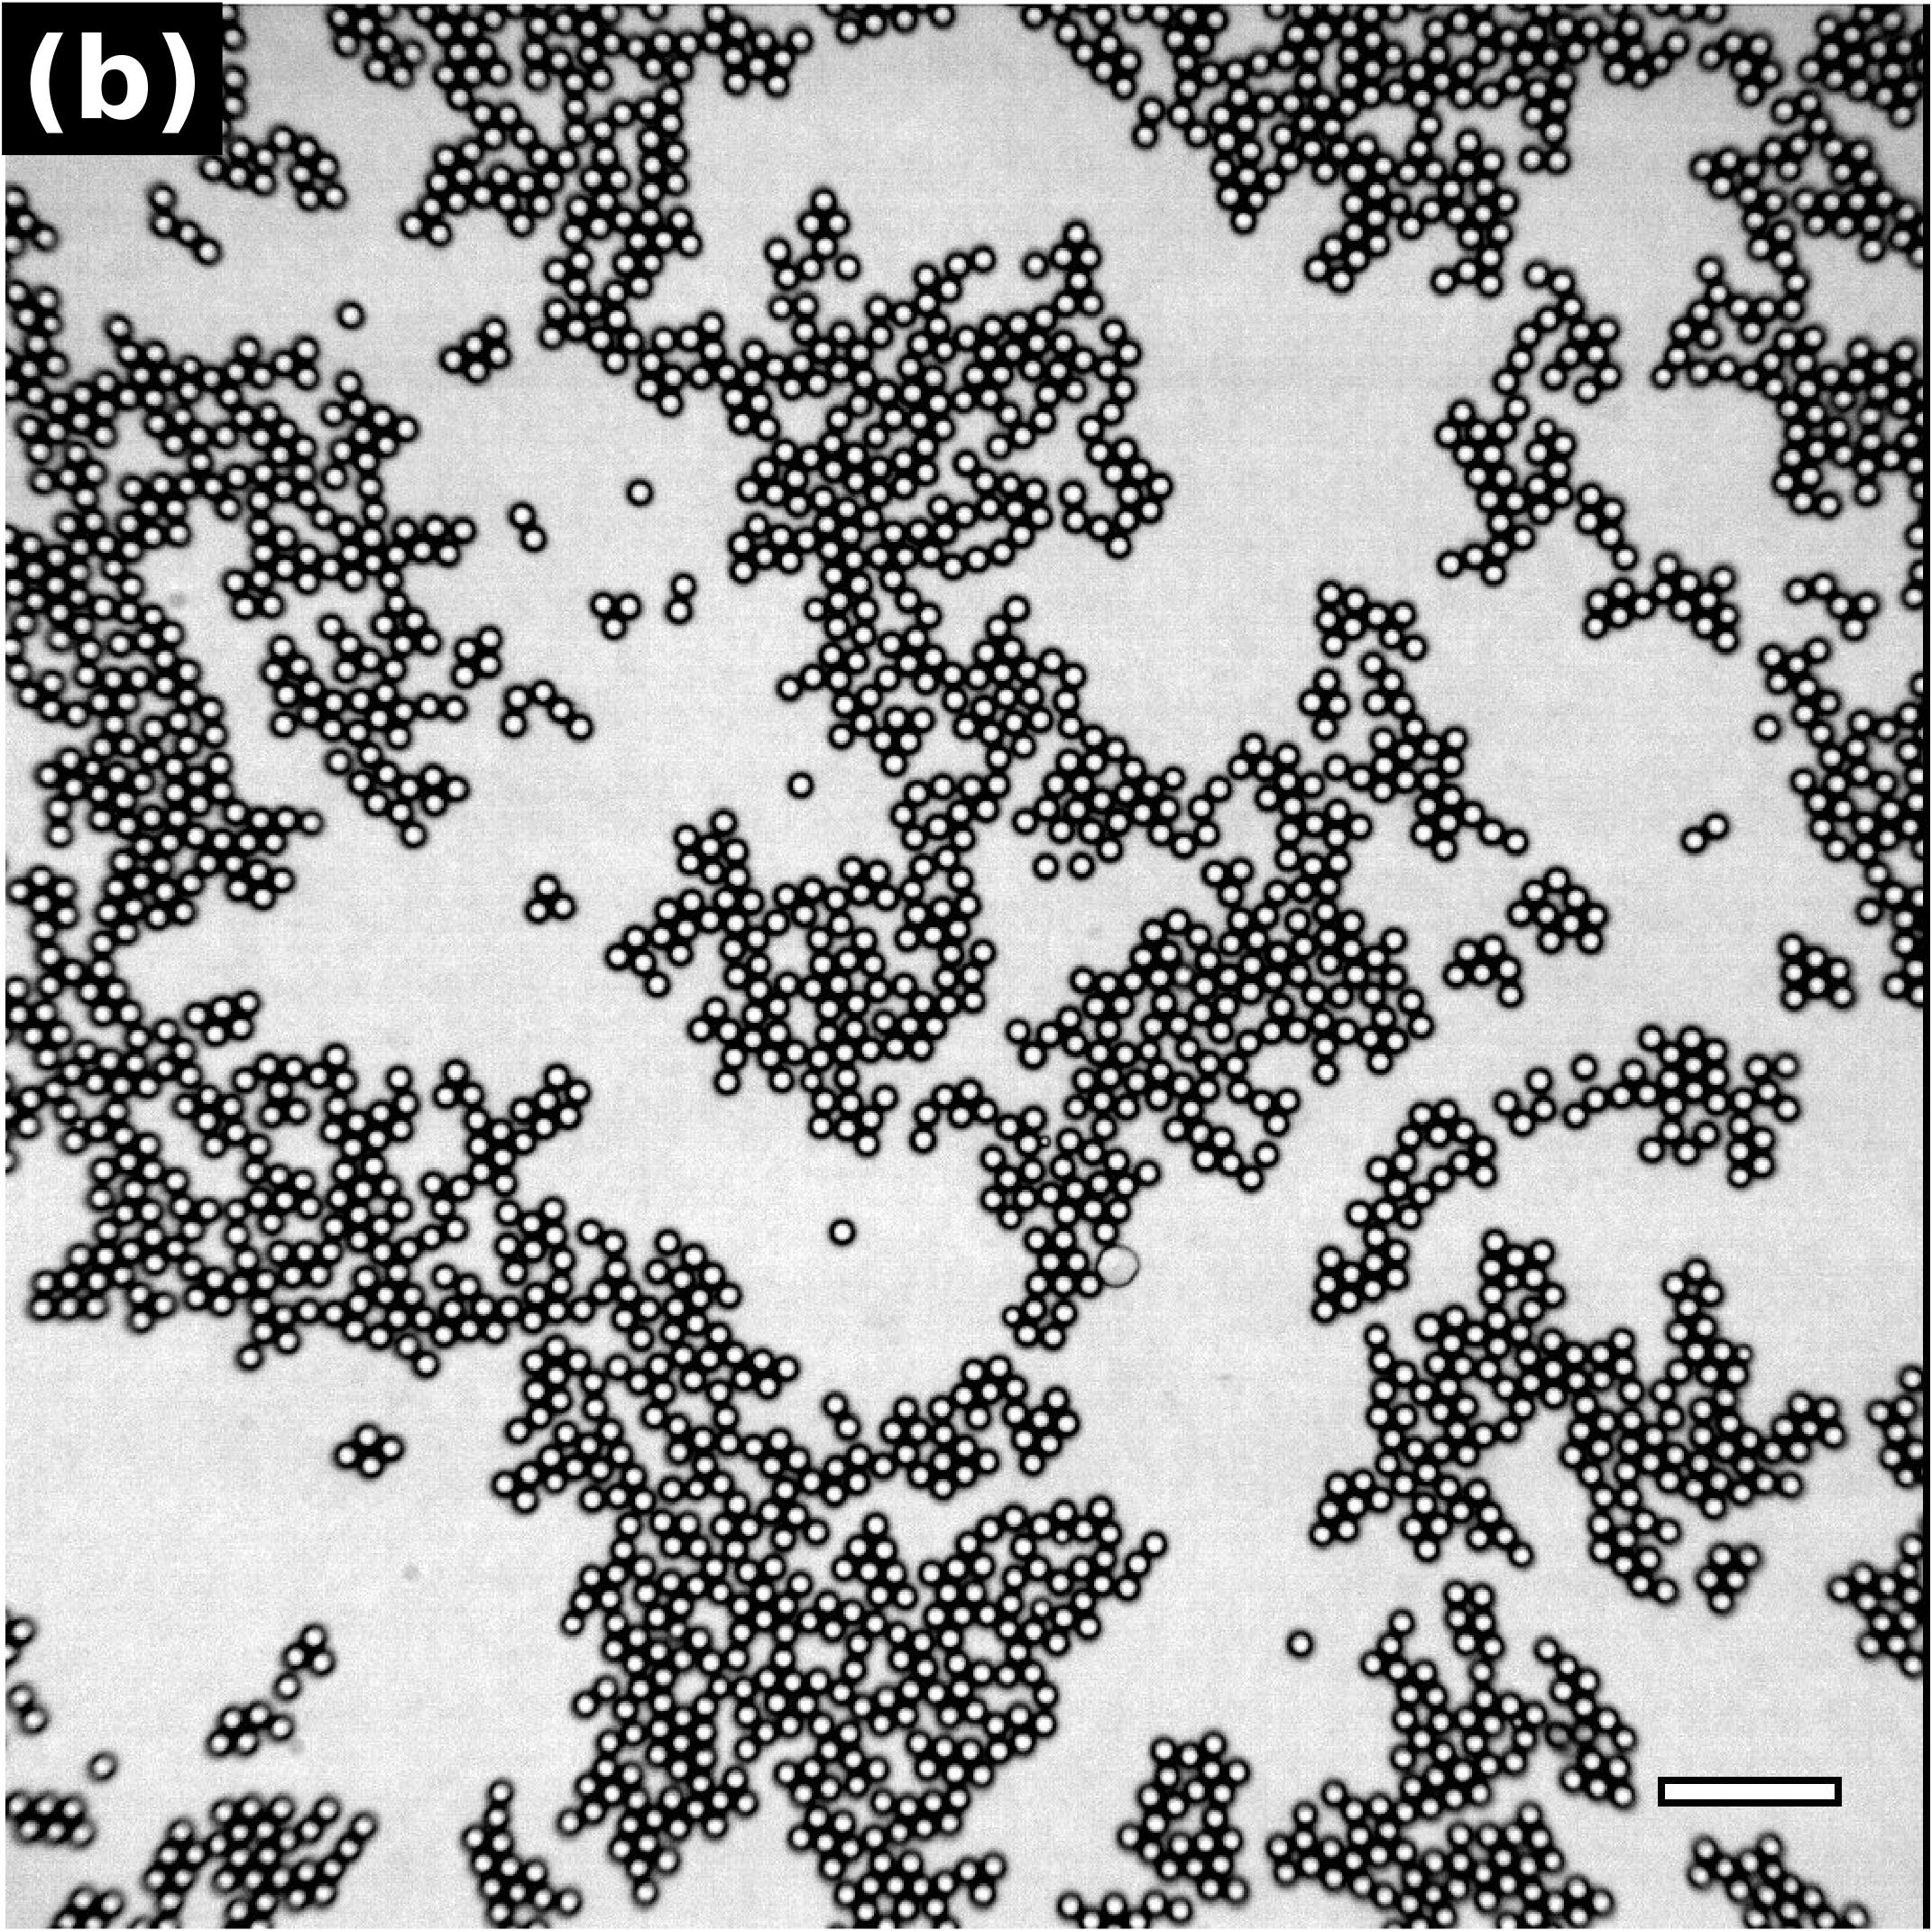
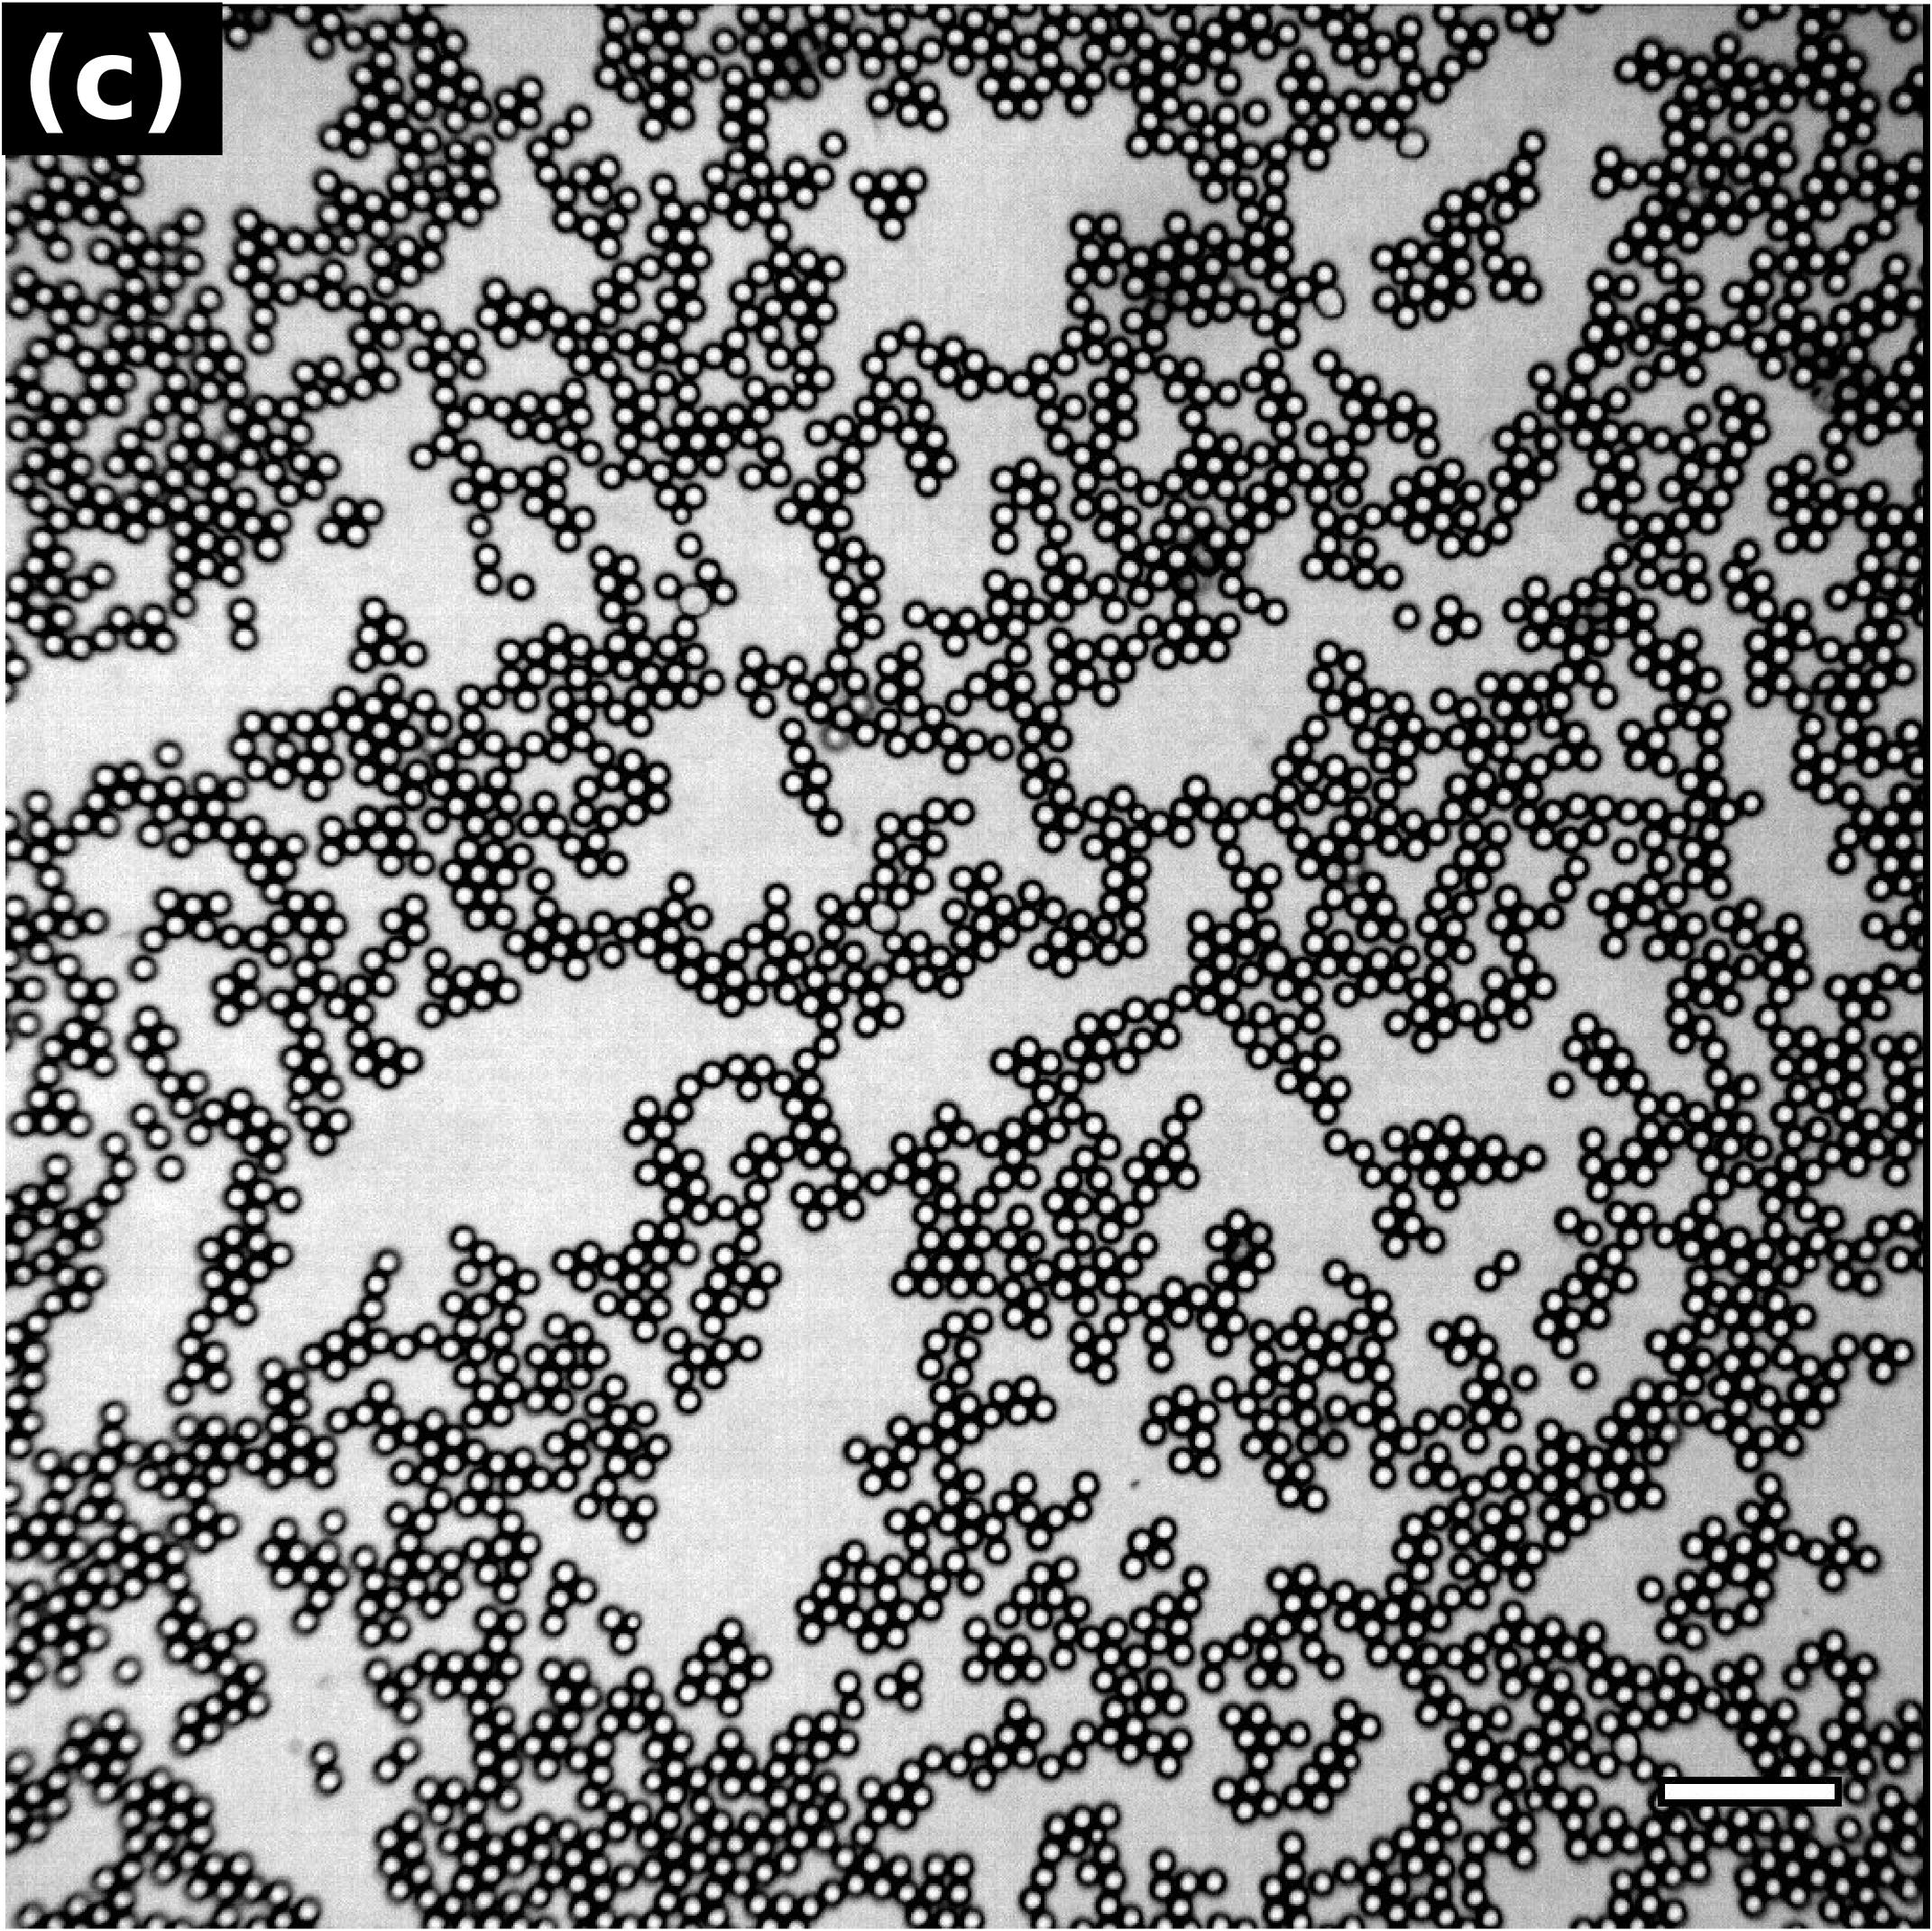
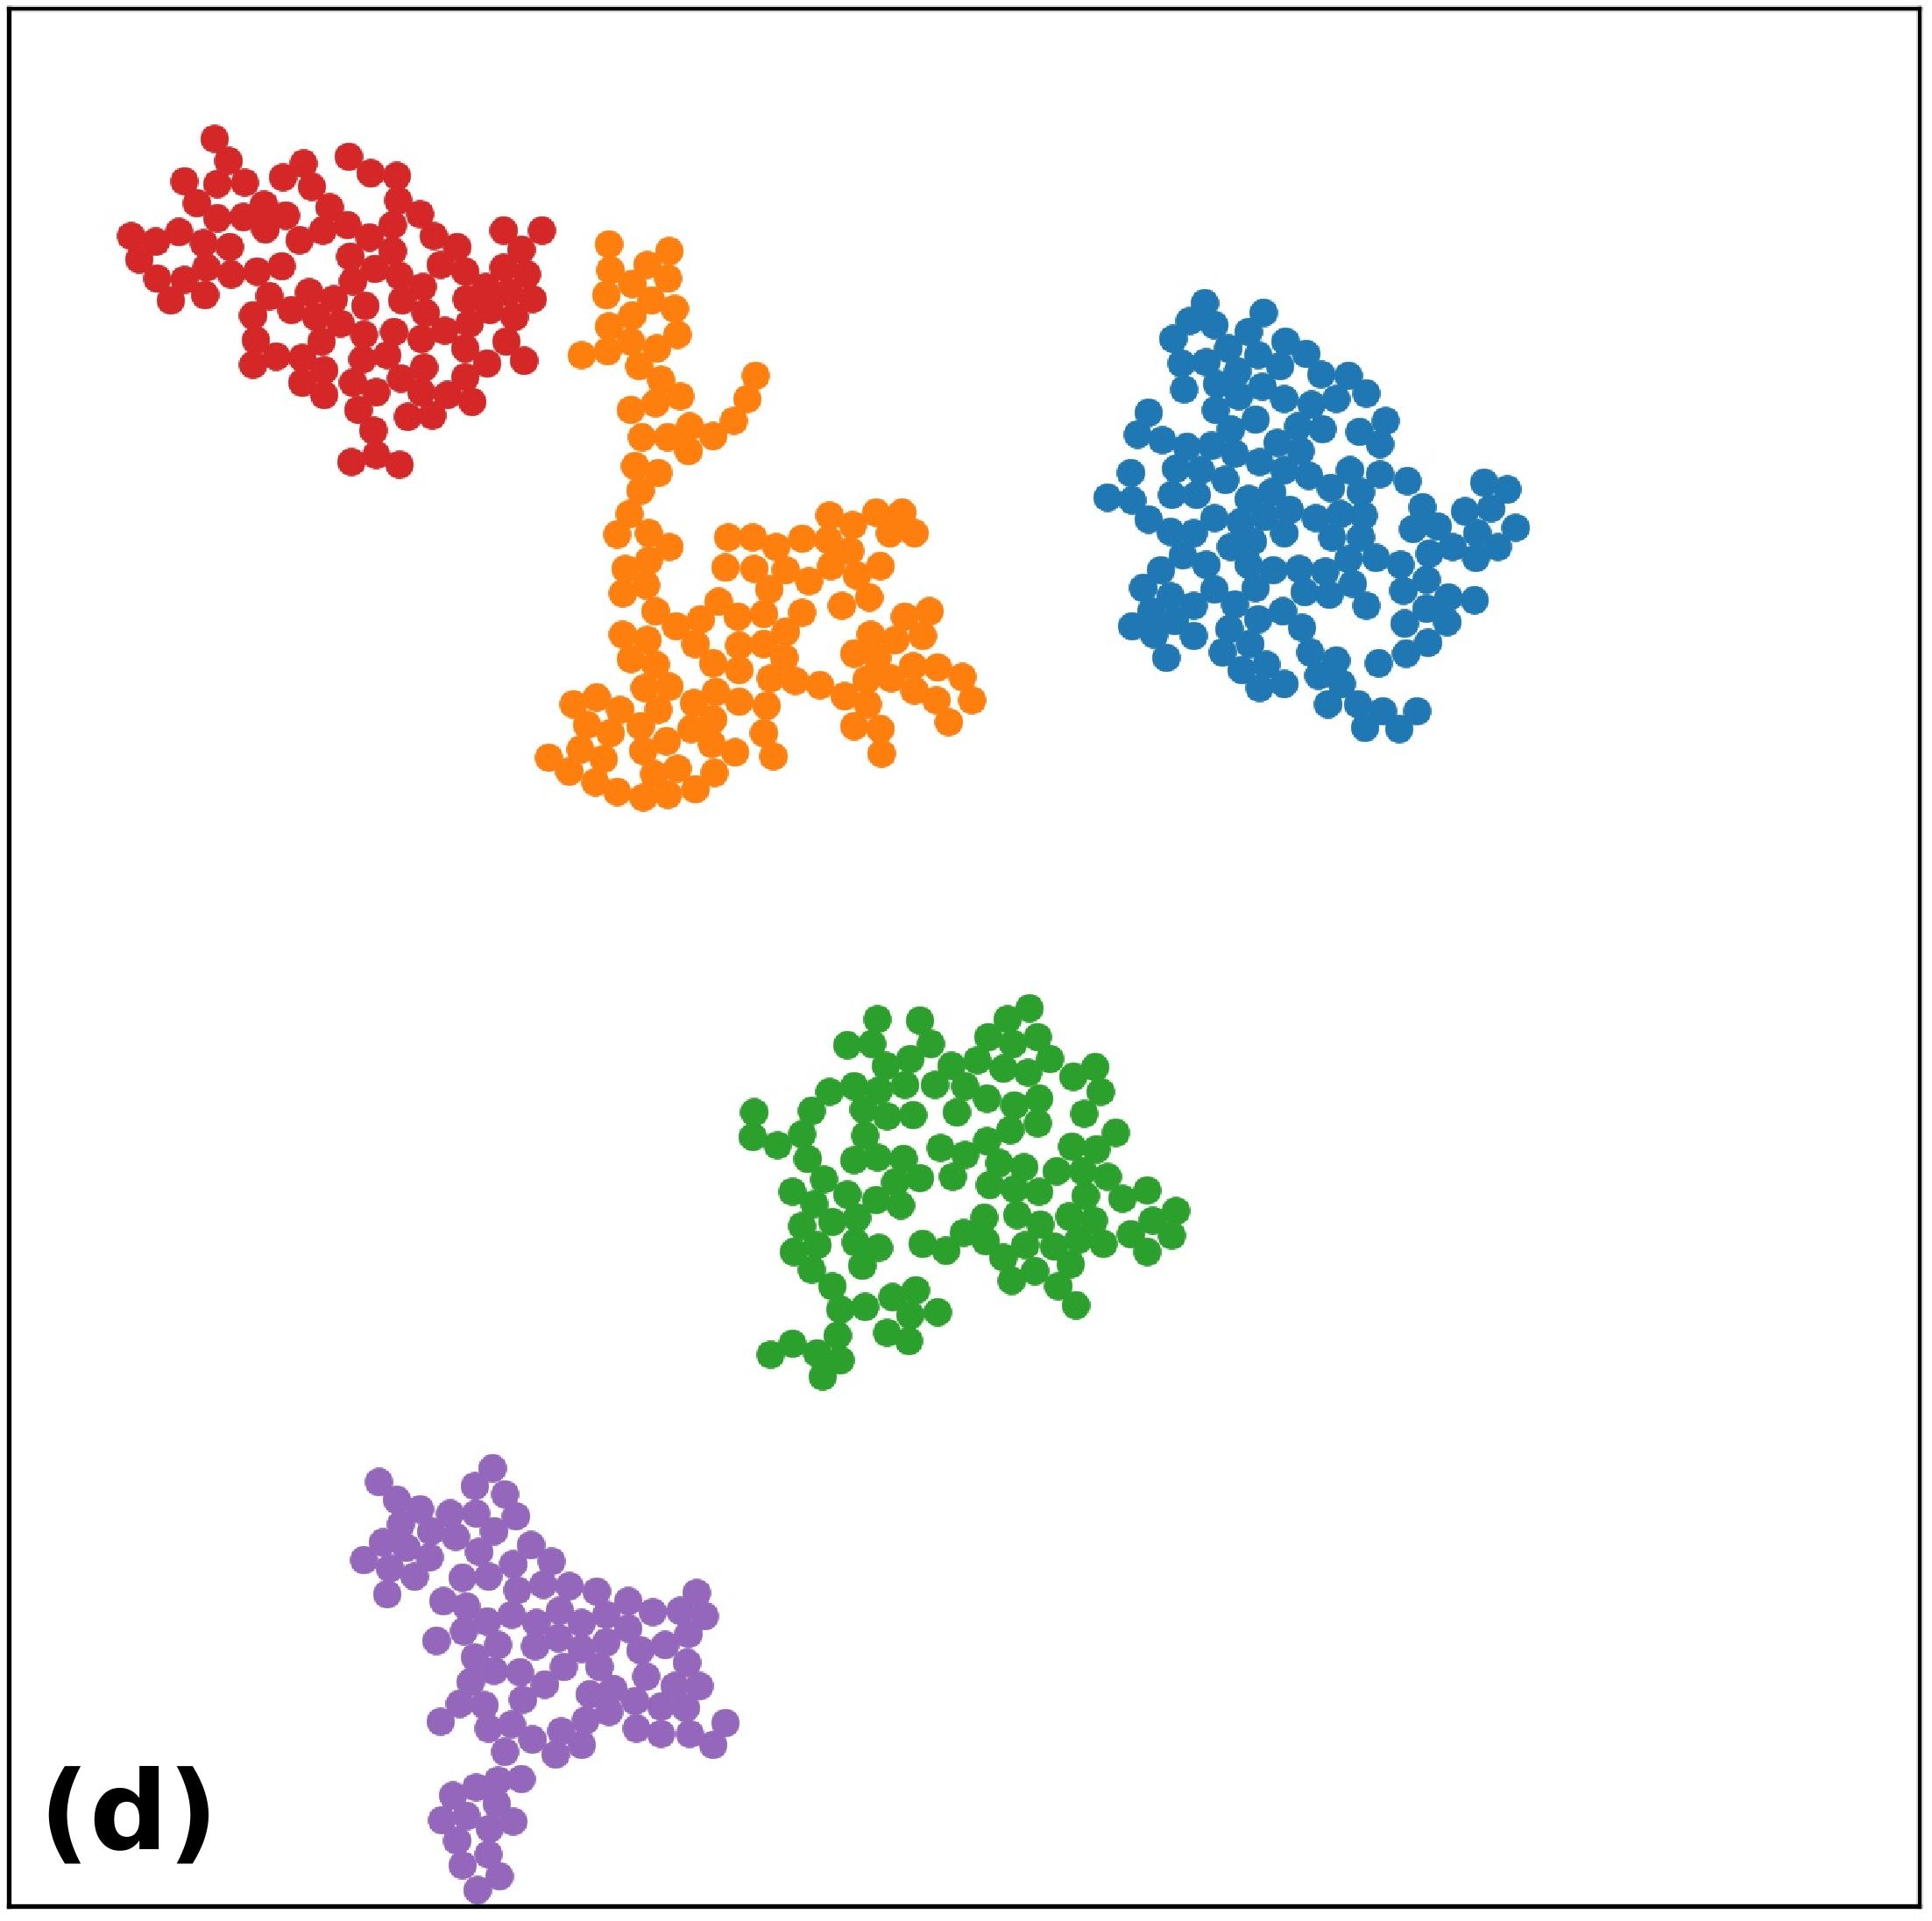
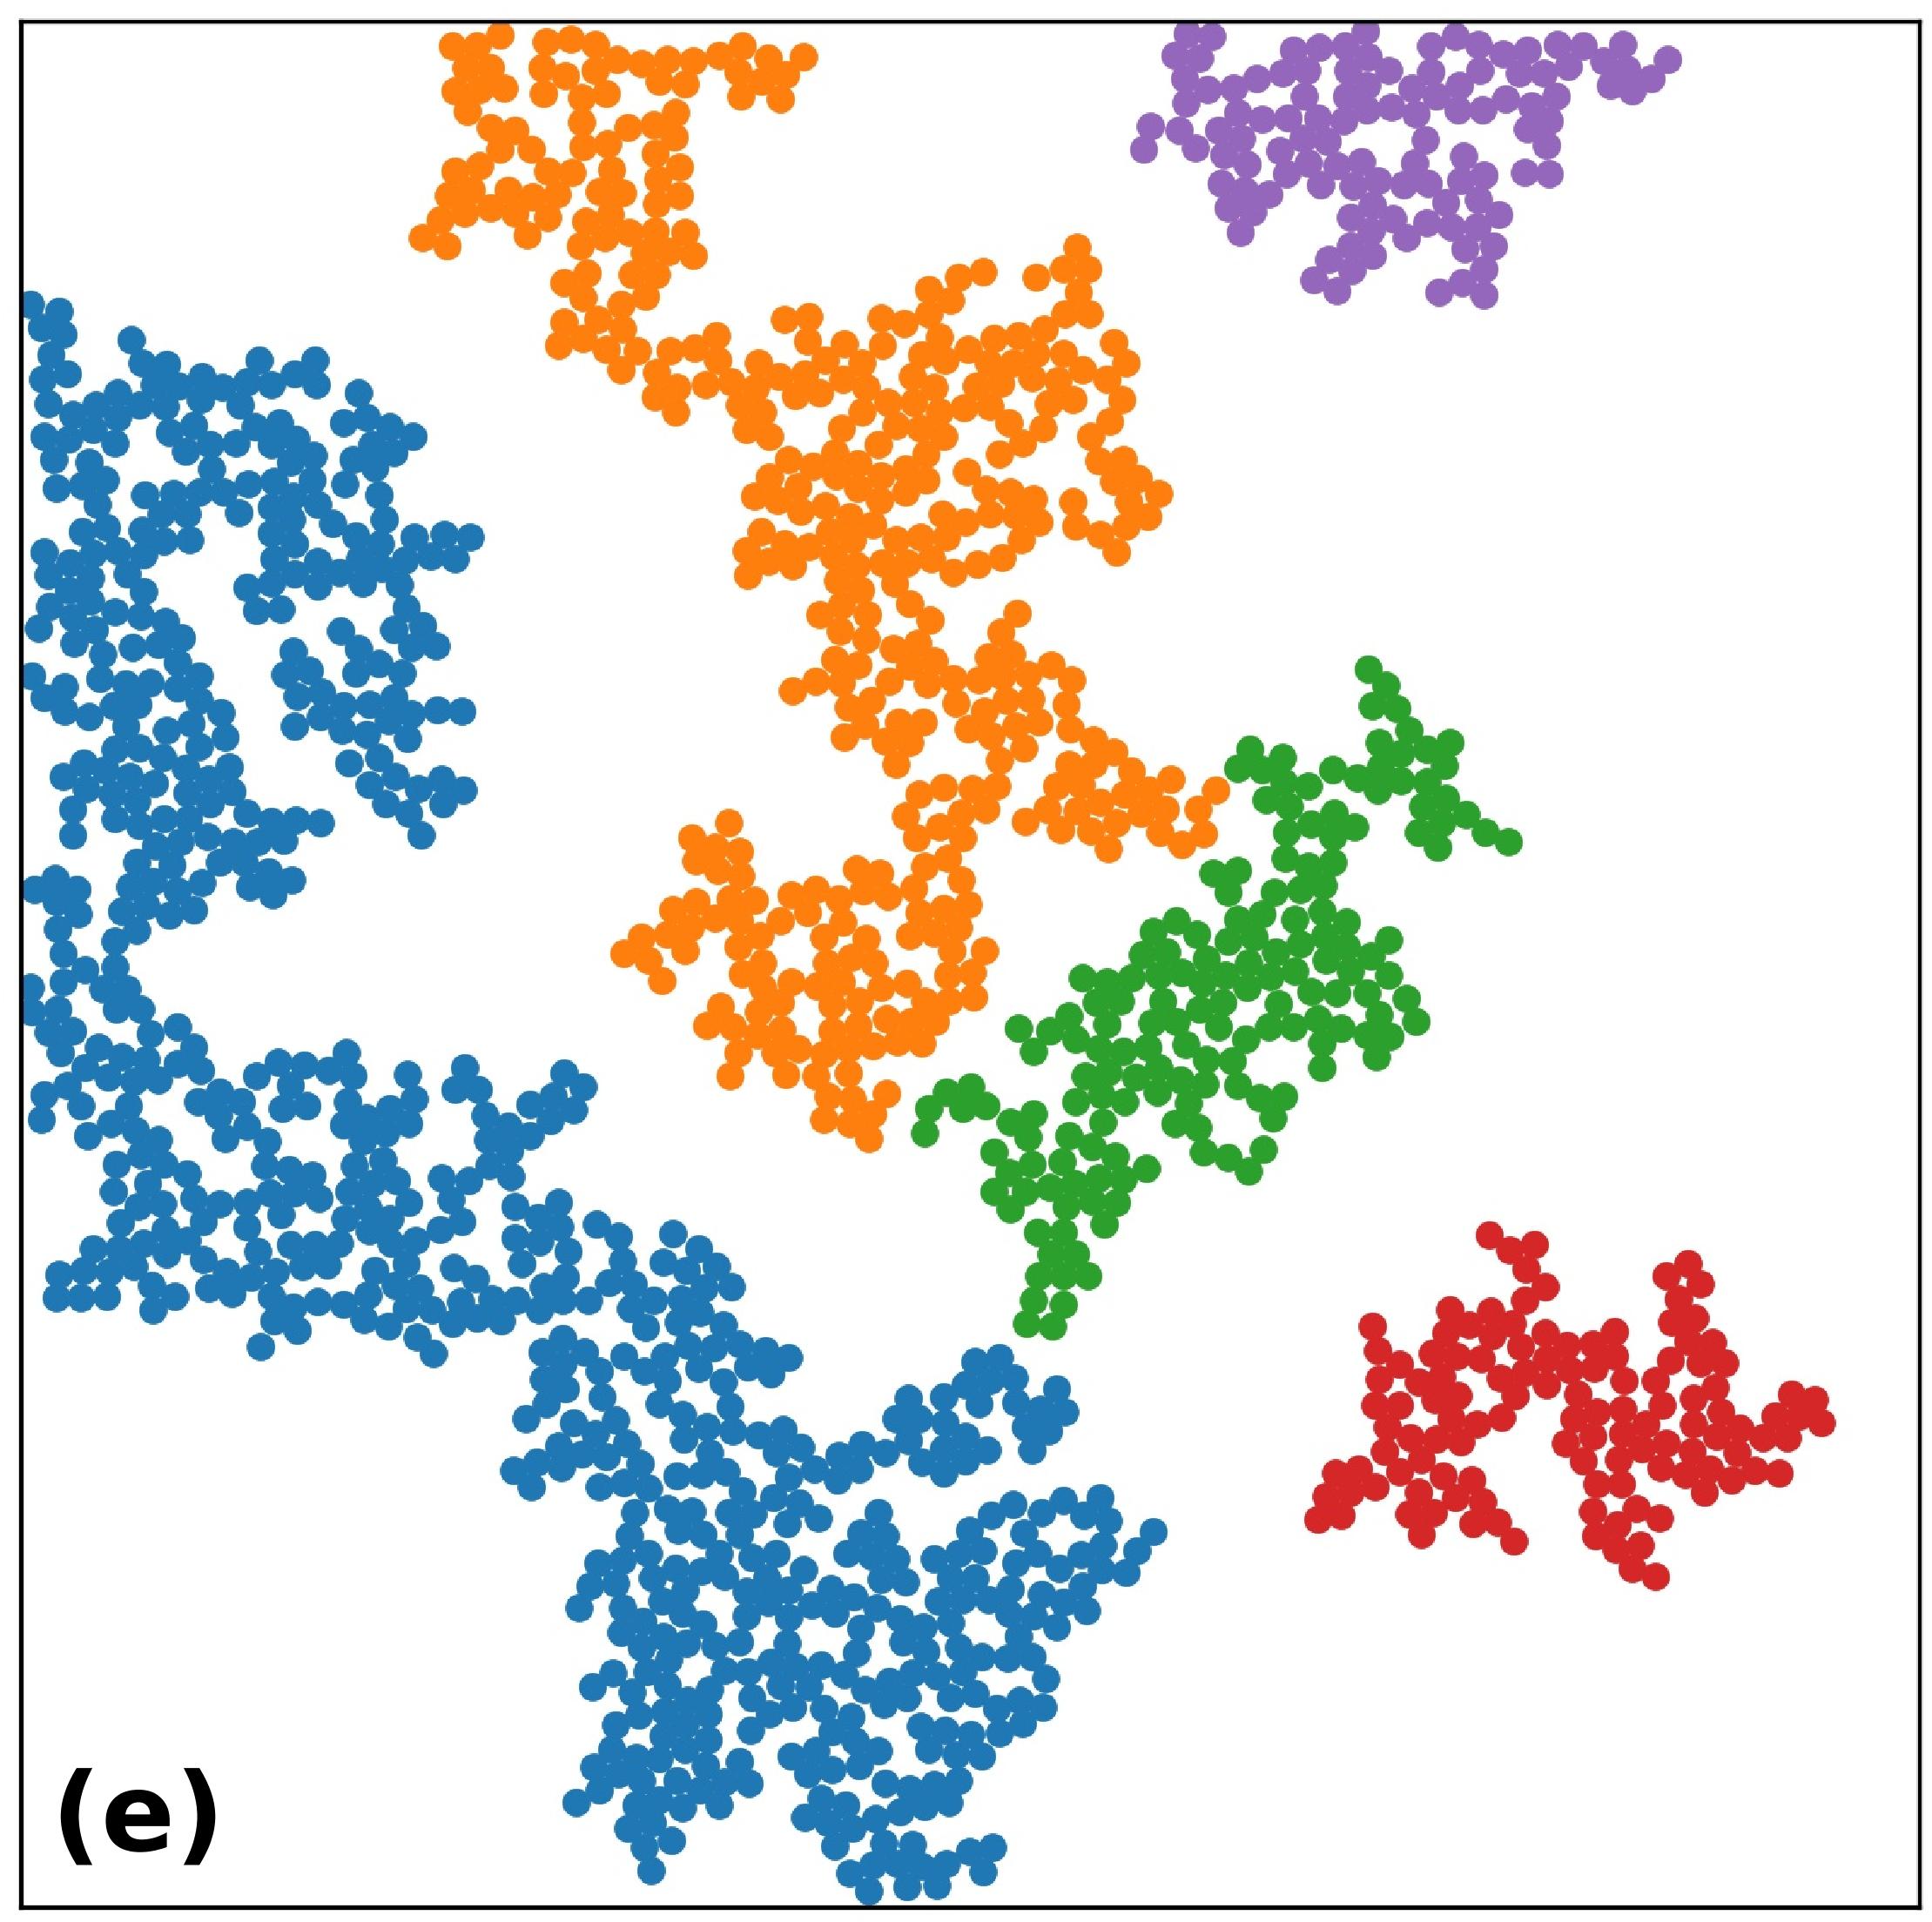
We next display the bright-field images of colloidal assemblies in active liquids in Fig. 2. The panels Figs.2(a)-2(c) correspond to several area-fractions of colloids with and , respectively. The scale bar in these images measures 100 . This is reminiscent of the sol-gel transition in colloidal suspensions with attractive interactions [38]. The clusters at in Fig. 2(a) appear to be compact and isolated. However, as increases, the clusters grow in size and become ramified, eventually spanning the entire field of view. To further illuminate these observations, we have depicted the first five largest clusters of Figs. 2(a)-2(c) in Figs. 2(d)-2(f). In these images, the colors blue, orange, green, red, and violet correspond to the first to fifth largest clusters, respectively. The Figs. 2(d)-2(f) provide better insights into the evolution of these clusters with changing . The first largest cluster, depicted in blue, gradually grows with increasing and becomes increasingly ramified with a fractal-like structure. Further, the second largest cluster, shown in orange, experiences growth initially but later diminishes in size as most particles are absorbed into the first largest cluster.
III.3 Spanning probability and percolation threshold
 |
 |
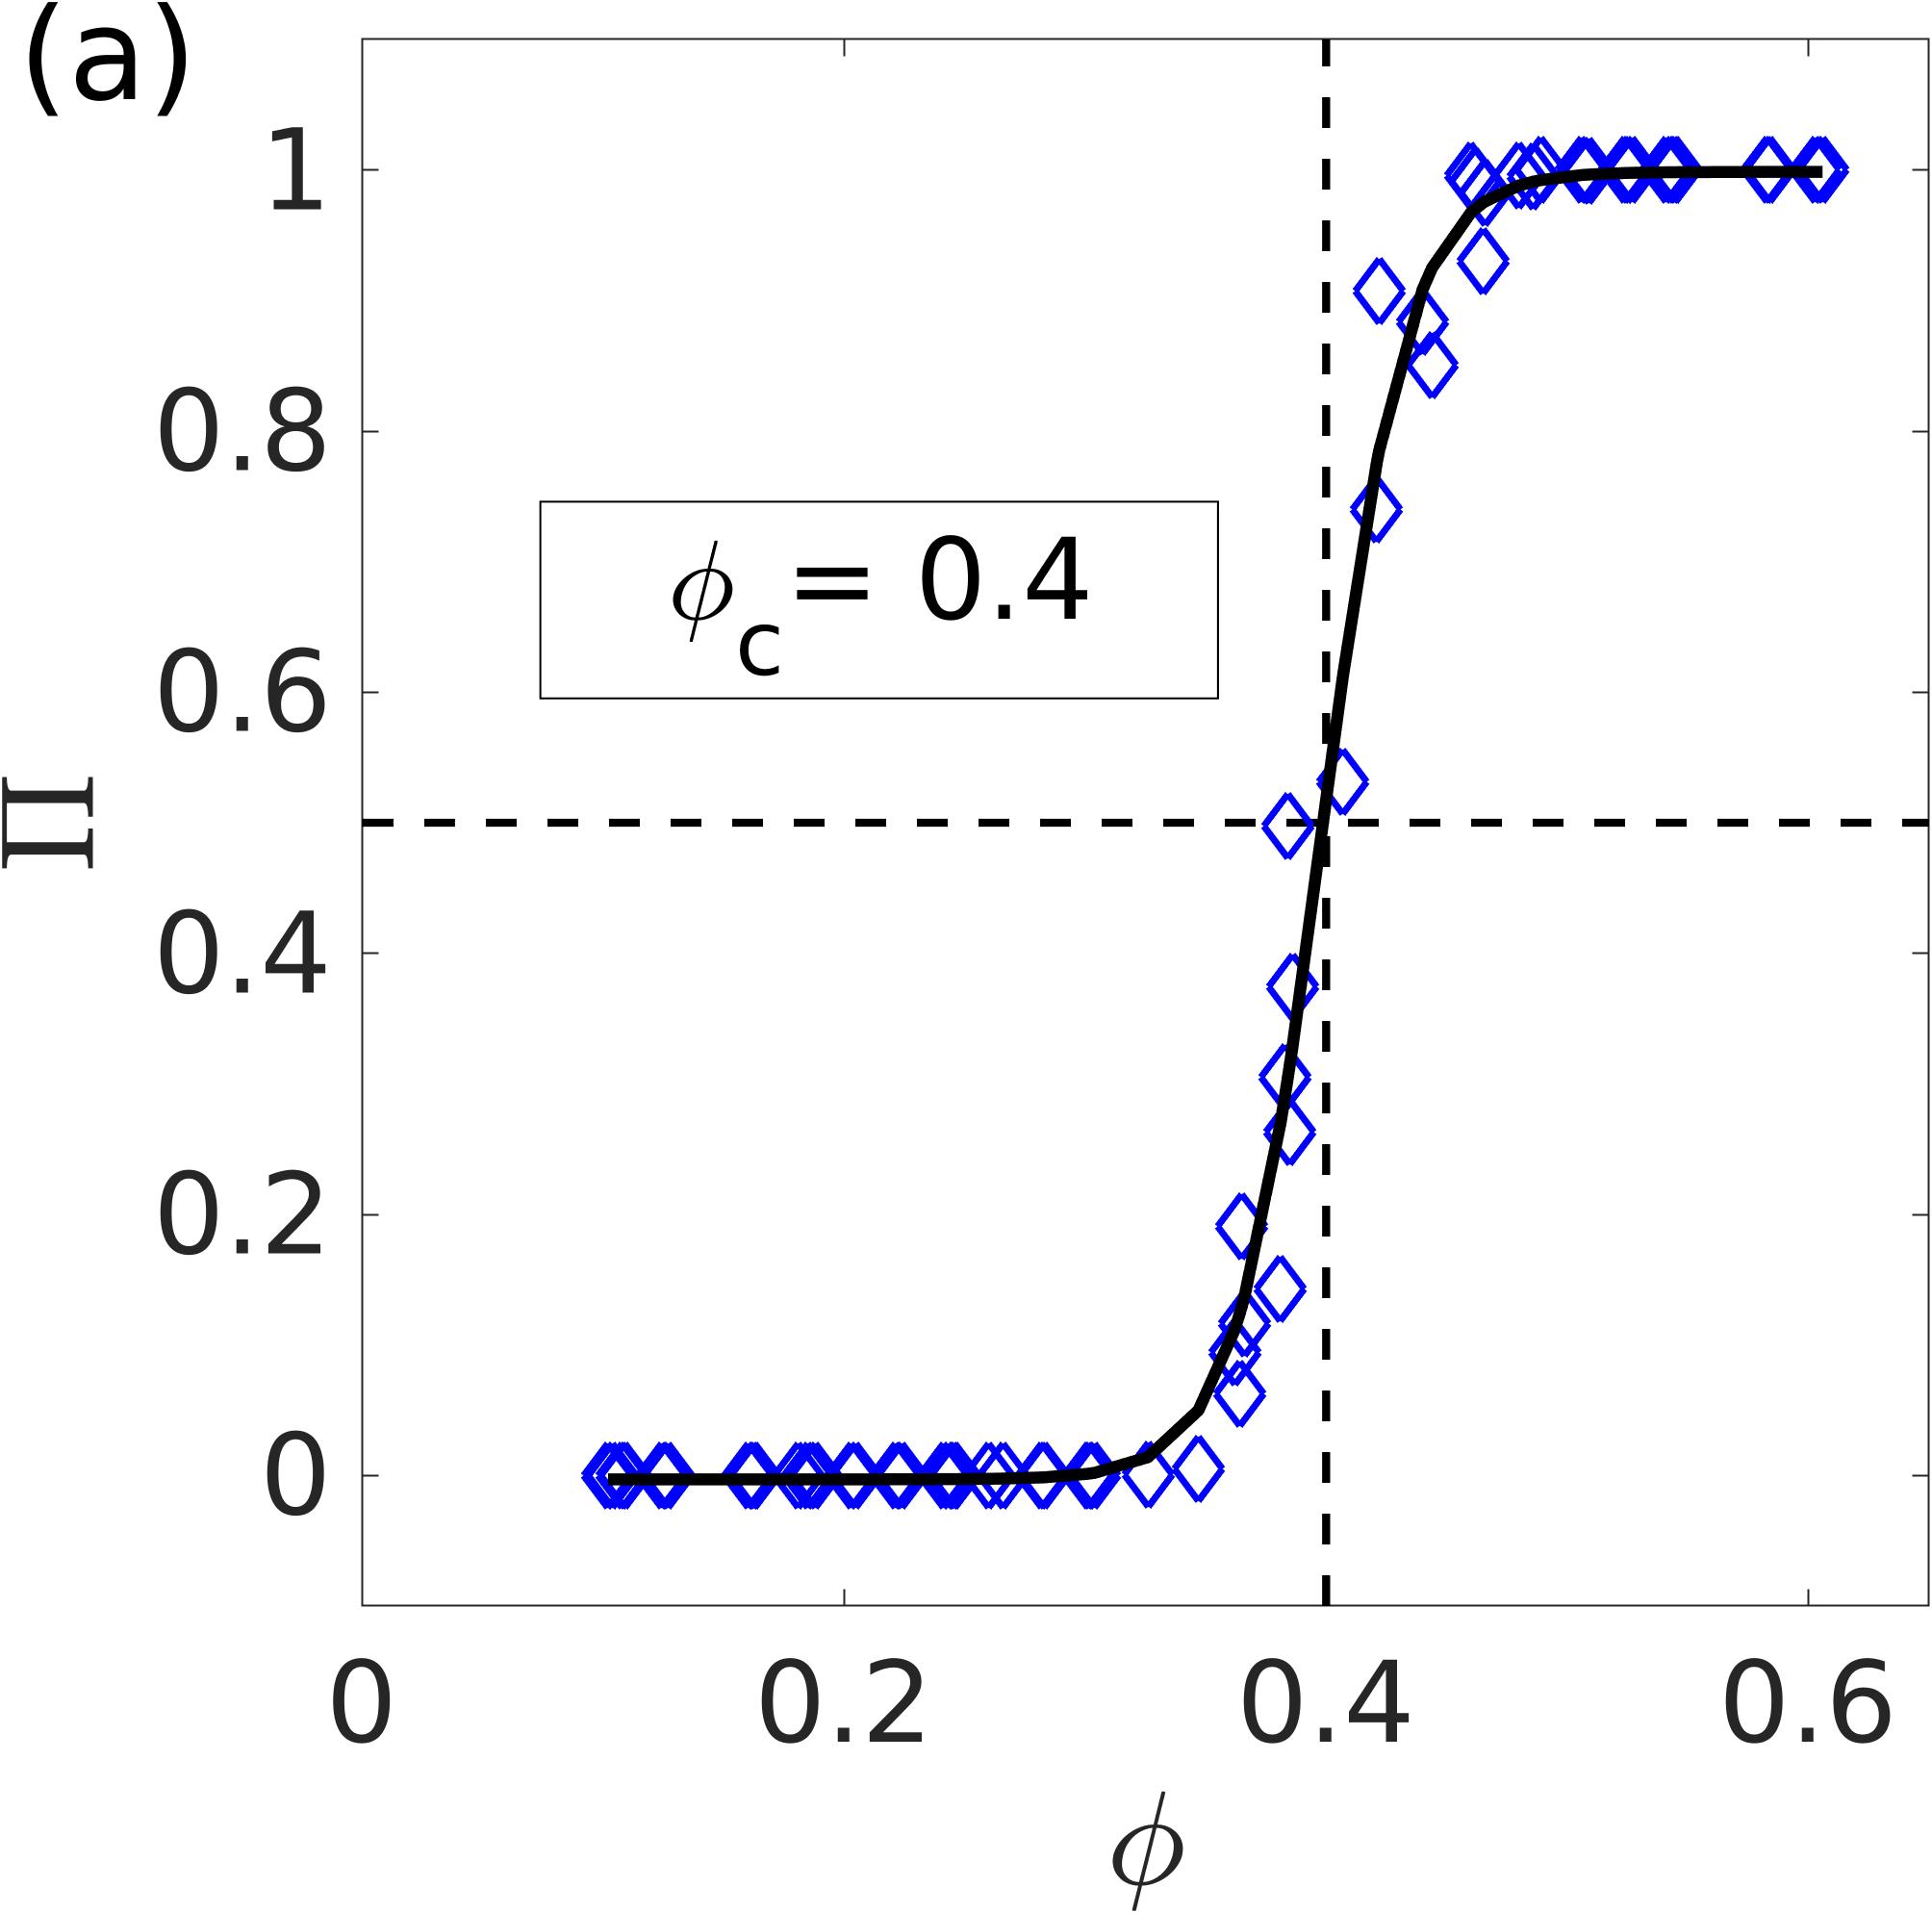
As evident from the results in Fig. 2, an increase in the area fraction leads to the growth of the first largest cluster, which eventually spans the entire field of view. In our pursuit of investigating percolation properties, we first determine the percolation threshold, denoted as . To ascertain this threshold, we employed the concept of spanning probability, denoted as . Spanning probability is the fraction of configurations in which the clusters span in both horizontal and vertical directions for a given . This procedure is repeated at several area-fractions of colloidal particles. The critical density or the percolation threshold is defined as the area-fraction where the spanning probability attains a value of 0.5 [51, 52].
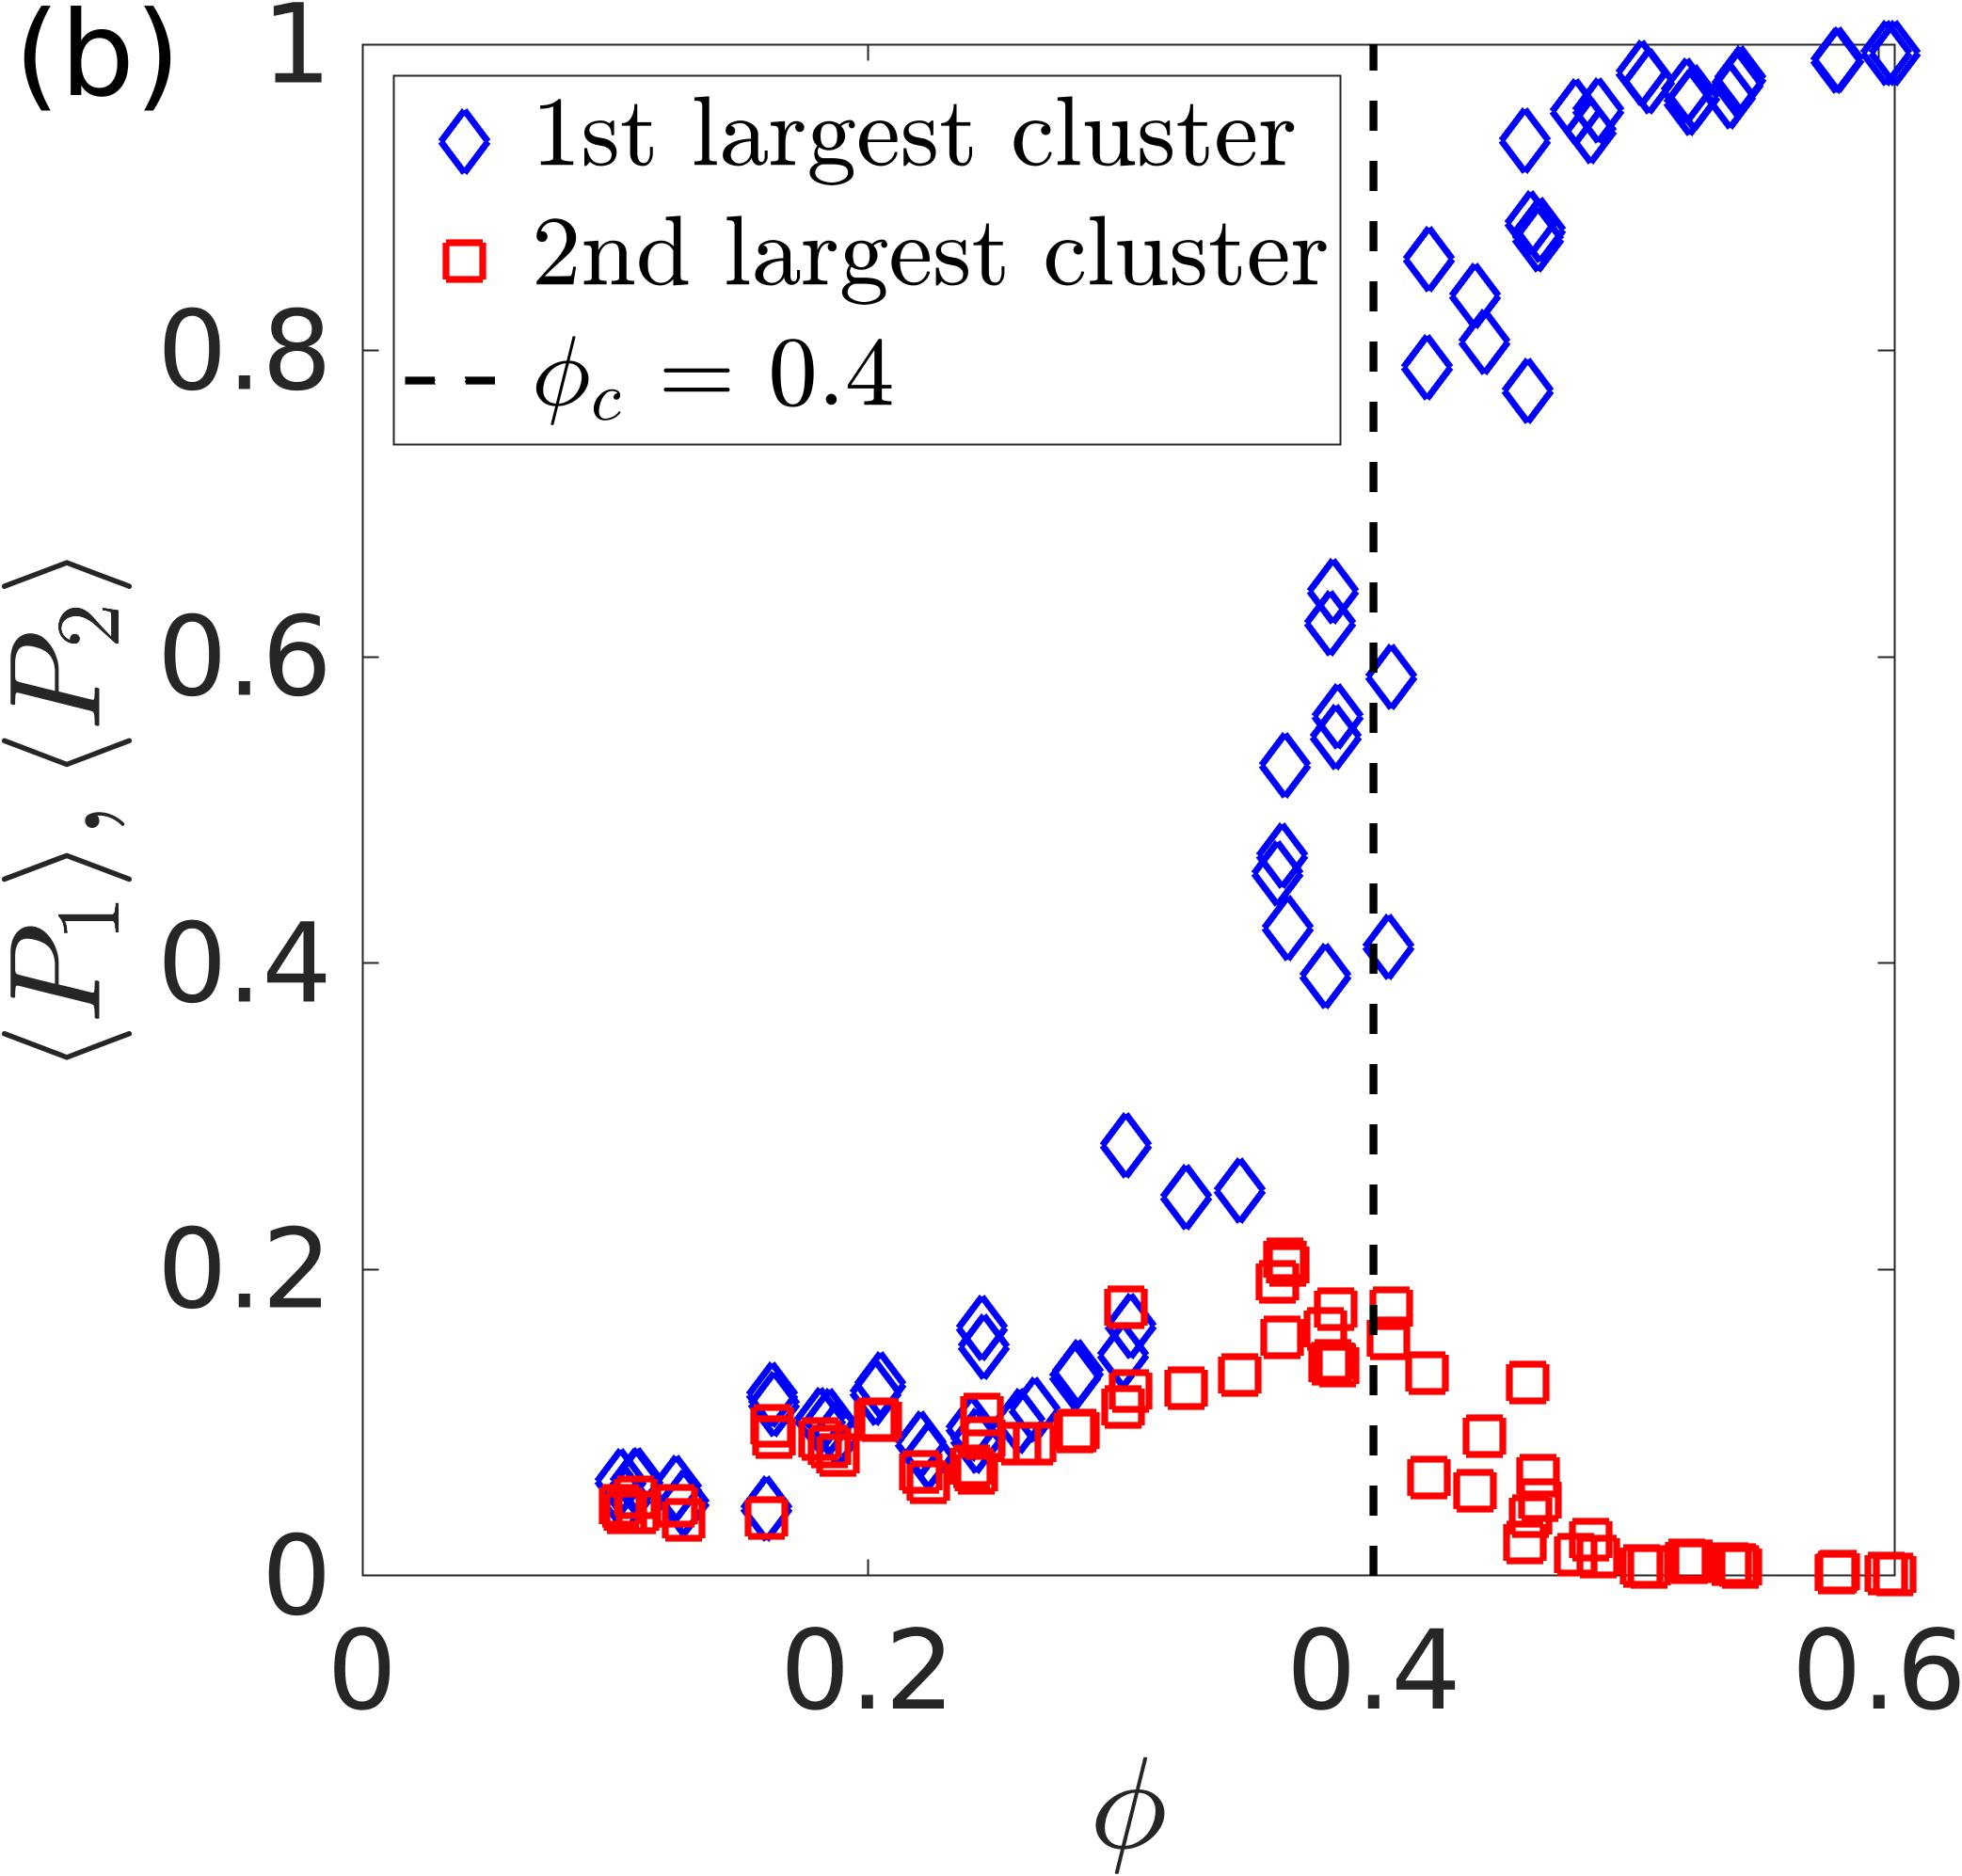
Figure 3(a) shows the plot of spanning probability as a function of . The blue diamonds represent the experimental data points, while the solid black curve is guide to the eye. Additionally, the black dashed horizontal and vertical lines gives the intersection point between the spanning probability curve and the curve. From this intersection point, we determined the percolation threshold to be . Varying the concentration of the bacteria shifts the percolation threshold, it moves to the higher values of with decreasing concentration of swimmers. This effect is shown in Fig. 9 in the appendix section. Moving to Fig. 3(b), we explore the fraction of particles in the first and second largest clusters, denoted as and , respectively, as a function of . The experimental data points for and are represented by blue diamonds and red squares, respectively. The black dashed line is drawn at to denote critical density. In Fig. 3(b), we observe that the fraction of particles in the first largest cluster increases and eventually saturates as increases. In contrast, the fraction of particles in the second largest cluster initially increases until and decreases beyond. This behavior is a signature of percolation transition, which has been used for defining in other studies.[39, 53].
III.4 Cluster size distribution and radius of gyration
The percolation transitions are associated with scale-free size distribution of clusters, with no characteristic cluster size at . To investigate these aspects of cluster formation in our experiments, we investigate their size distribution. We identify clusters by adopting a fixed cutoff distance for connected particles, set at , which is based on the first minima of the pair correlation function g(r). The cluster size distribution denoted as is defined as where is the frequency of clusters of size .
 |
 |
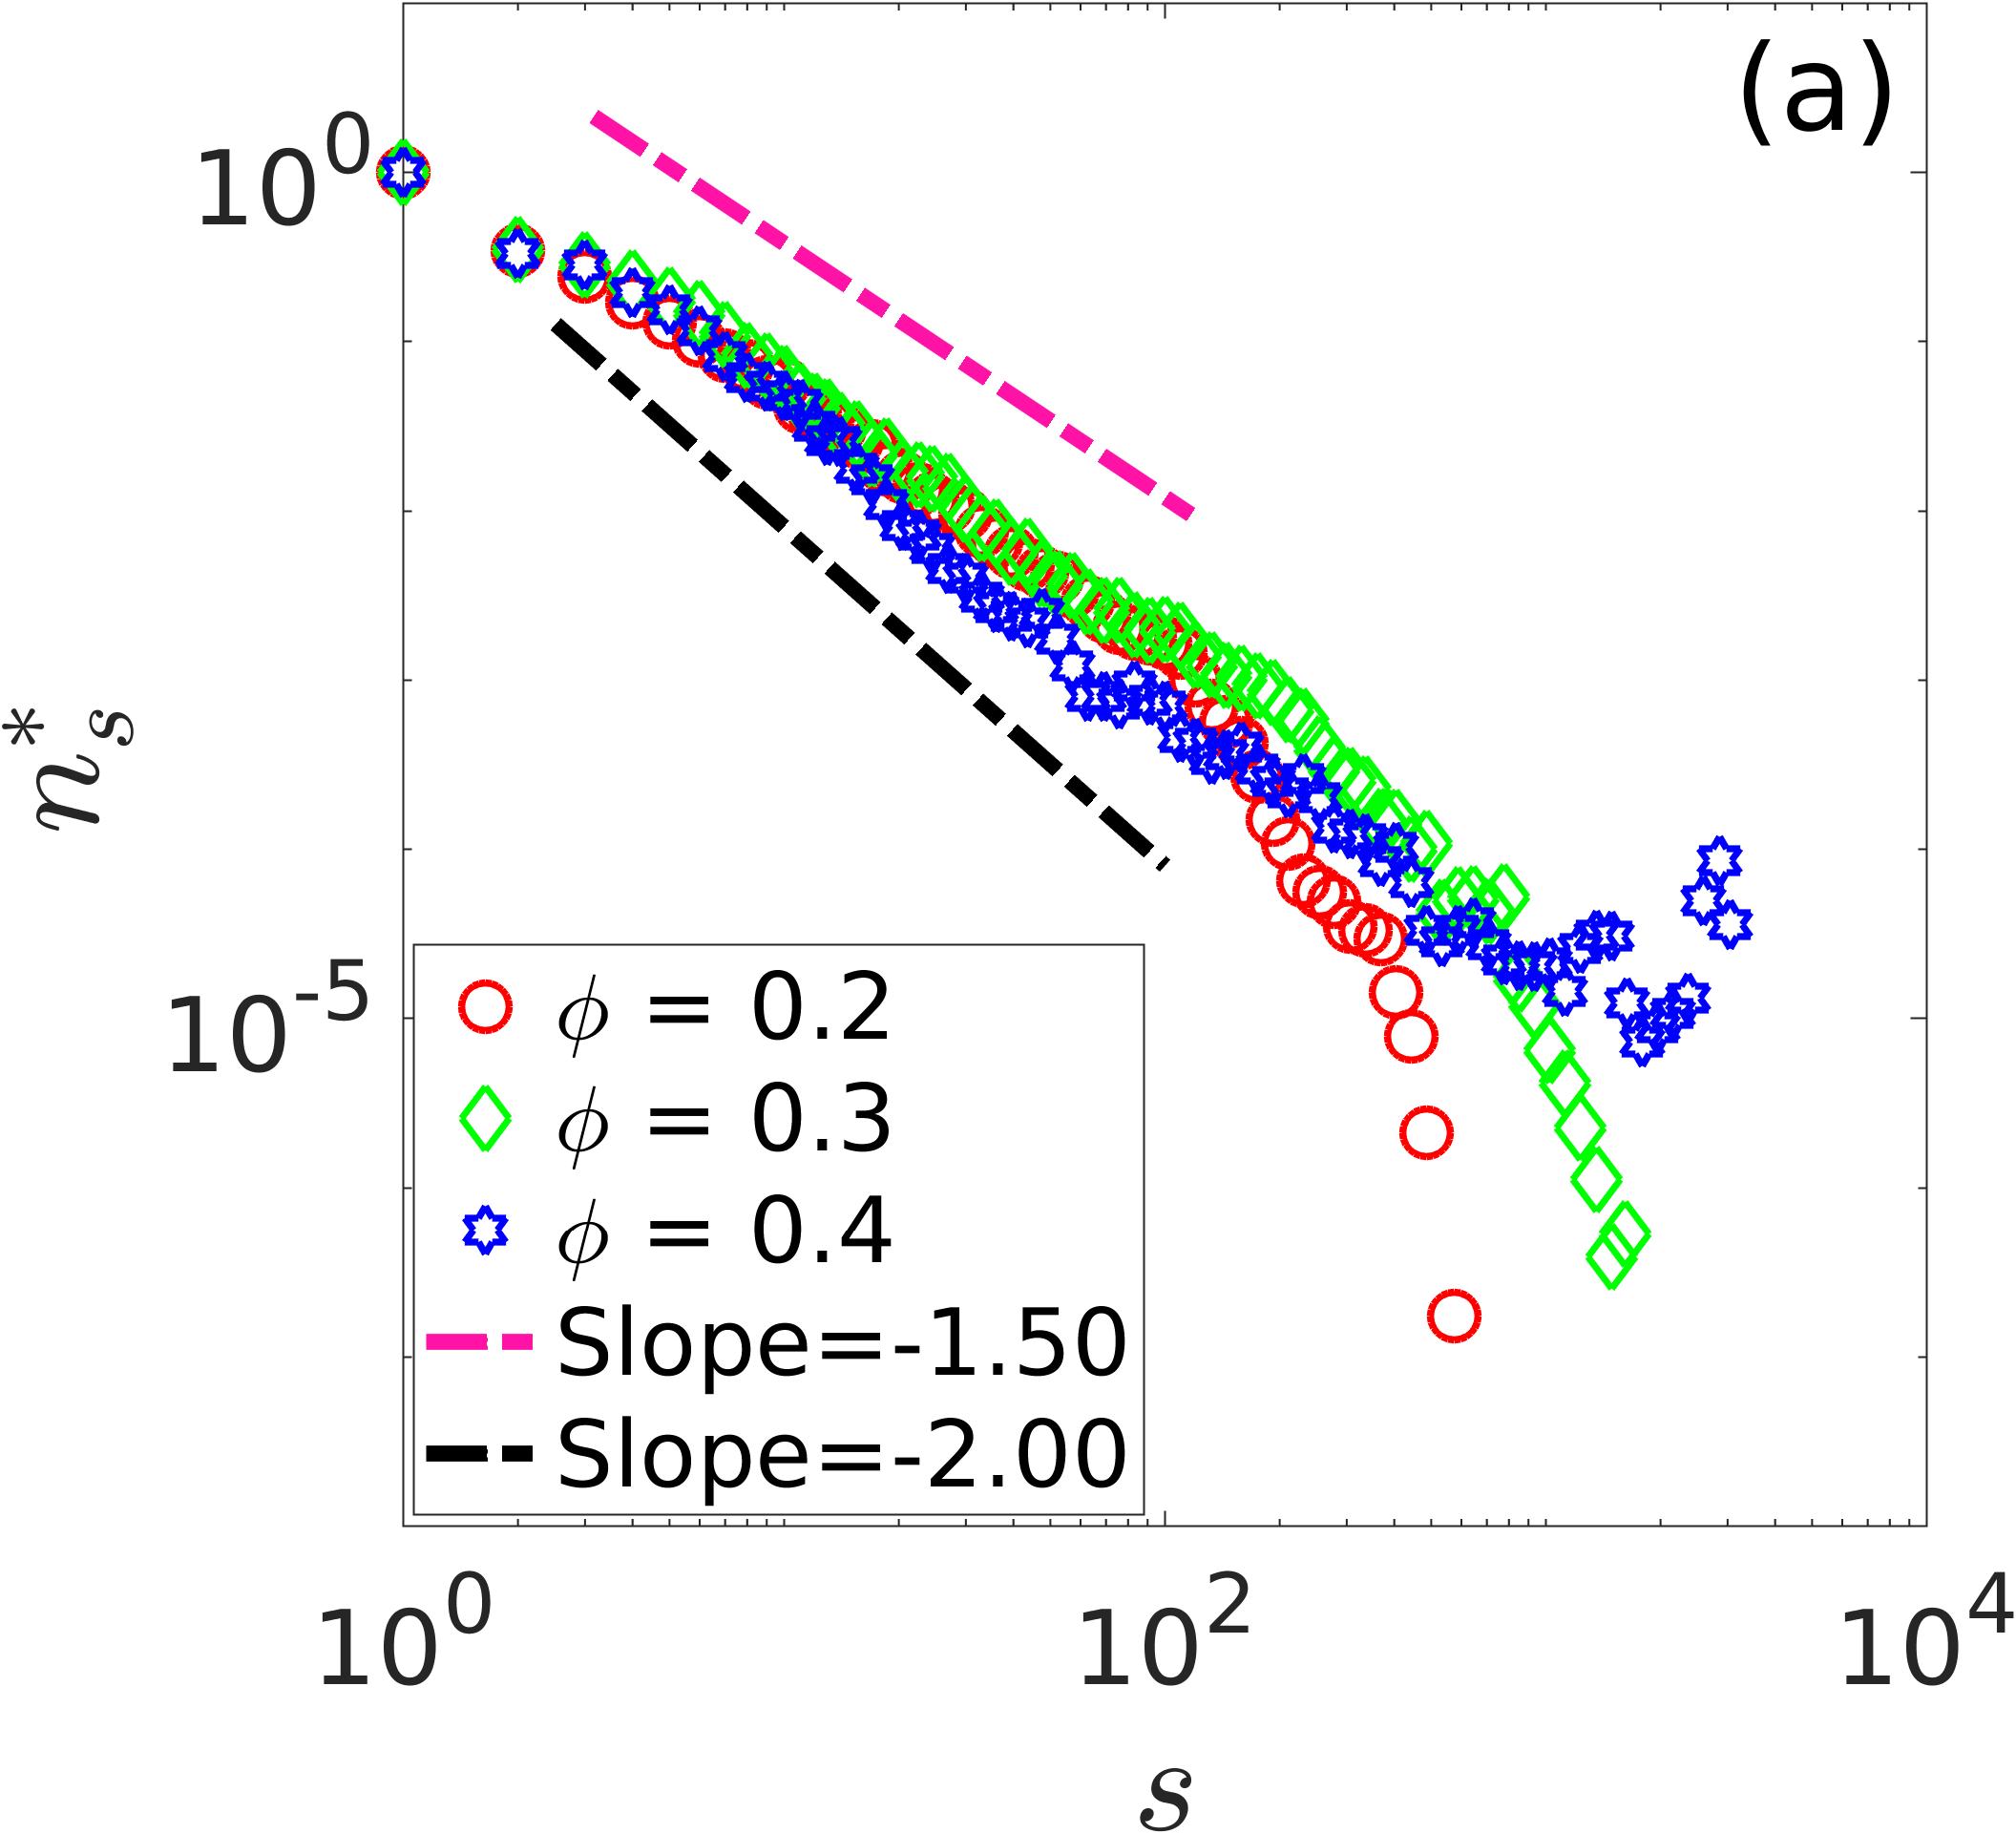
The Fig. 4(a) shows the cluster size distribution at colloidal densities of and , denoted by red circles, green diamonds, and blue hexagons, respectively. For the ease of comparison, is scaled by . The magenta and black dashed lines featuring slopes of -1.5 and -2, respectively, are included for reference. Previous studies [46, 54] have shown that cluster size distribution in the vicinity of percolation transition is given by the following expression:
| (1) |
where represents the cutoff length scale of cluster size, and denotes one of the critical exponents. The distribution exhibits a power-law dependence with an exponential cutoff below , however, as approaches , it approaches a power-law indicating the absence of a characteristic length scale leading to . According to the continuum percolation theory of disks (CPT), the exponent in two dimensions [47] . From Fig. 4(a) it is clear that for below , the has nature of power law decay with exponential cutoff, as approaches to , it has only power-law dependence. The exponent determined from the best-fit procedure yields a value of at , which deviates from the predictions of CPT. Interestingly, the nonequilibrium structure formation in conserved mass models with diffusion, aggregation and fragmentation displays phase transition beyond a critical density [55]. The mean-field model predicts , where is the cluster size, below . However, at , the cluster size distribution has a power-law form . The inclusion of activity in such models could lead to insightful results.
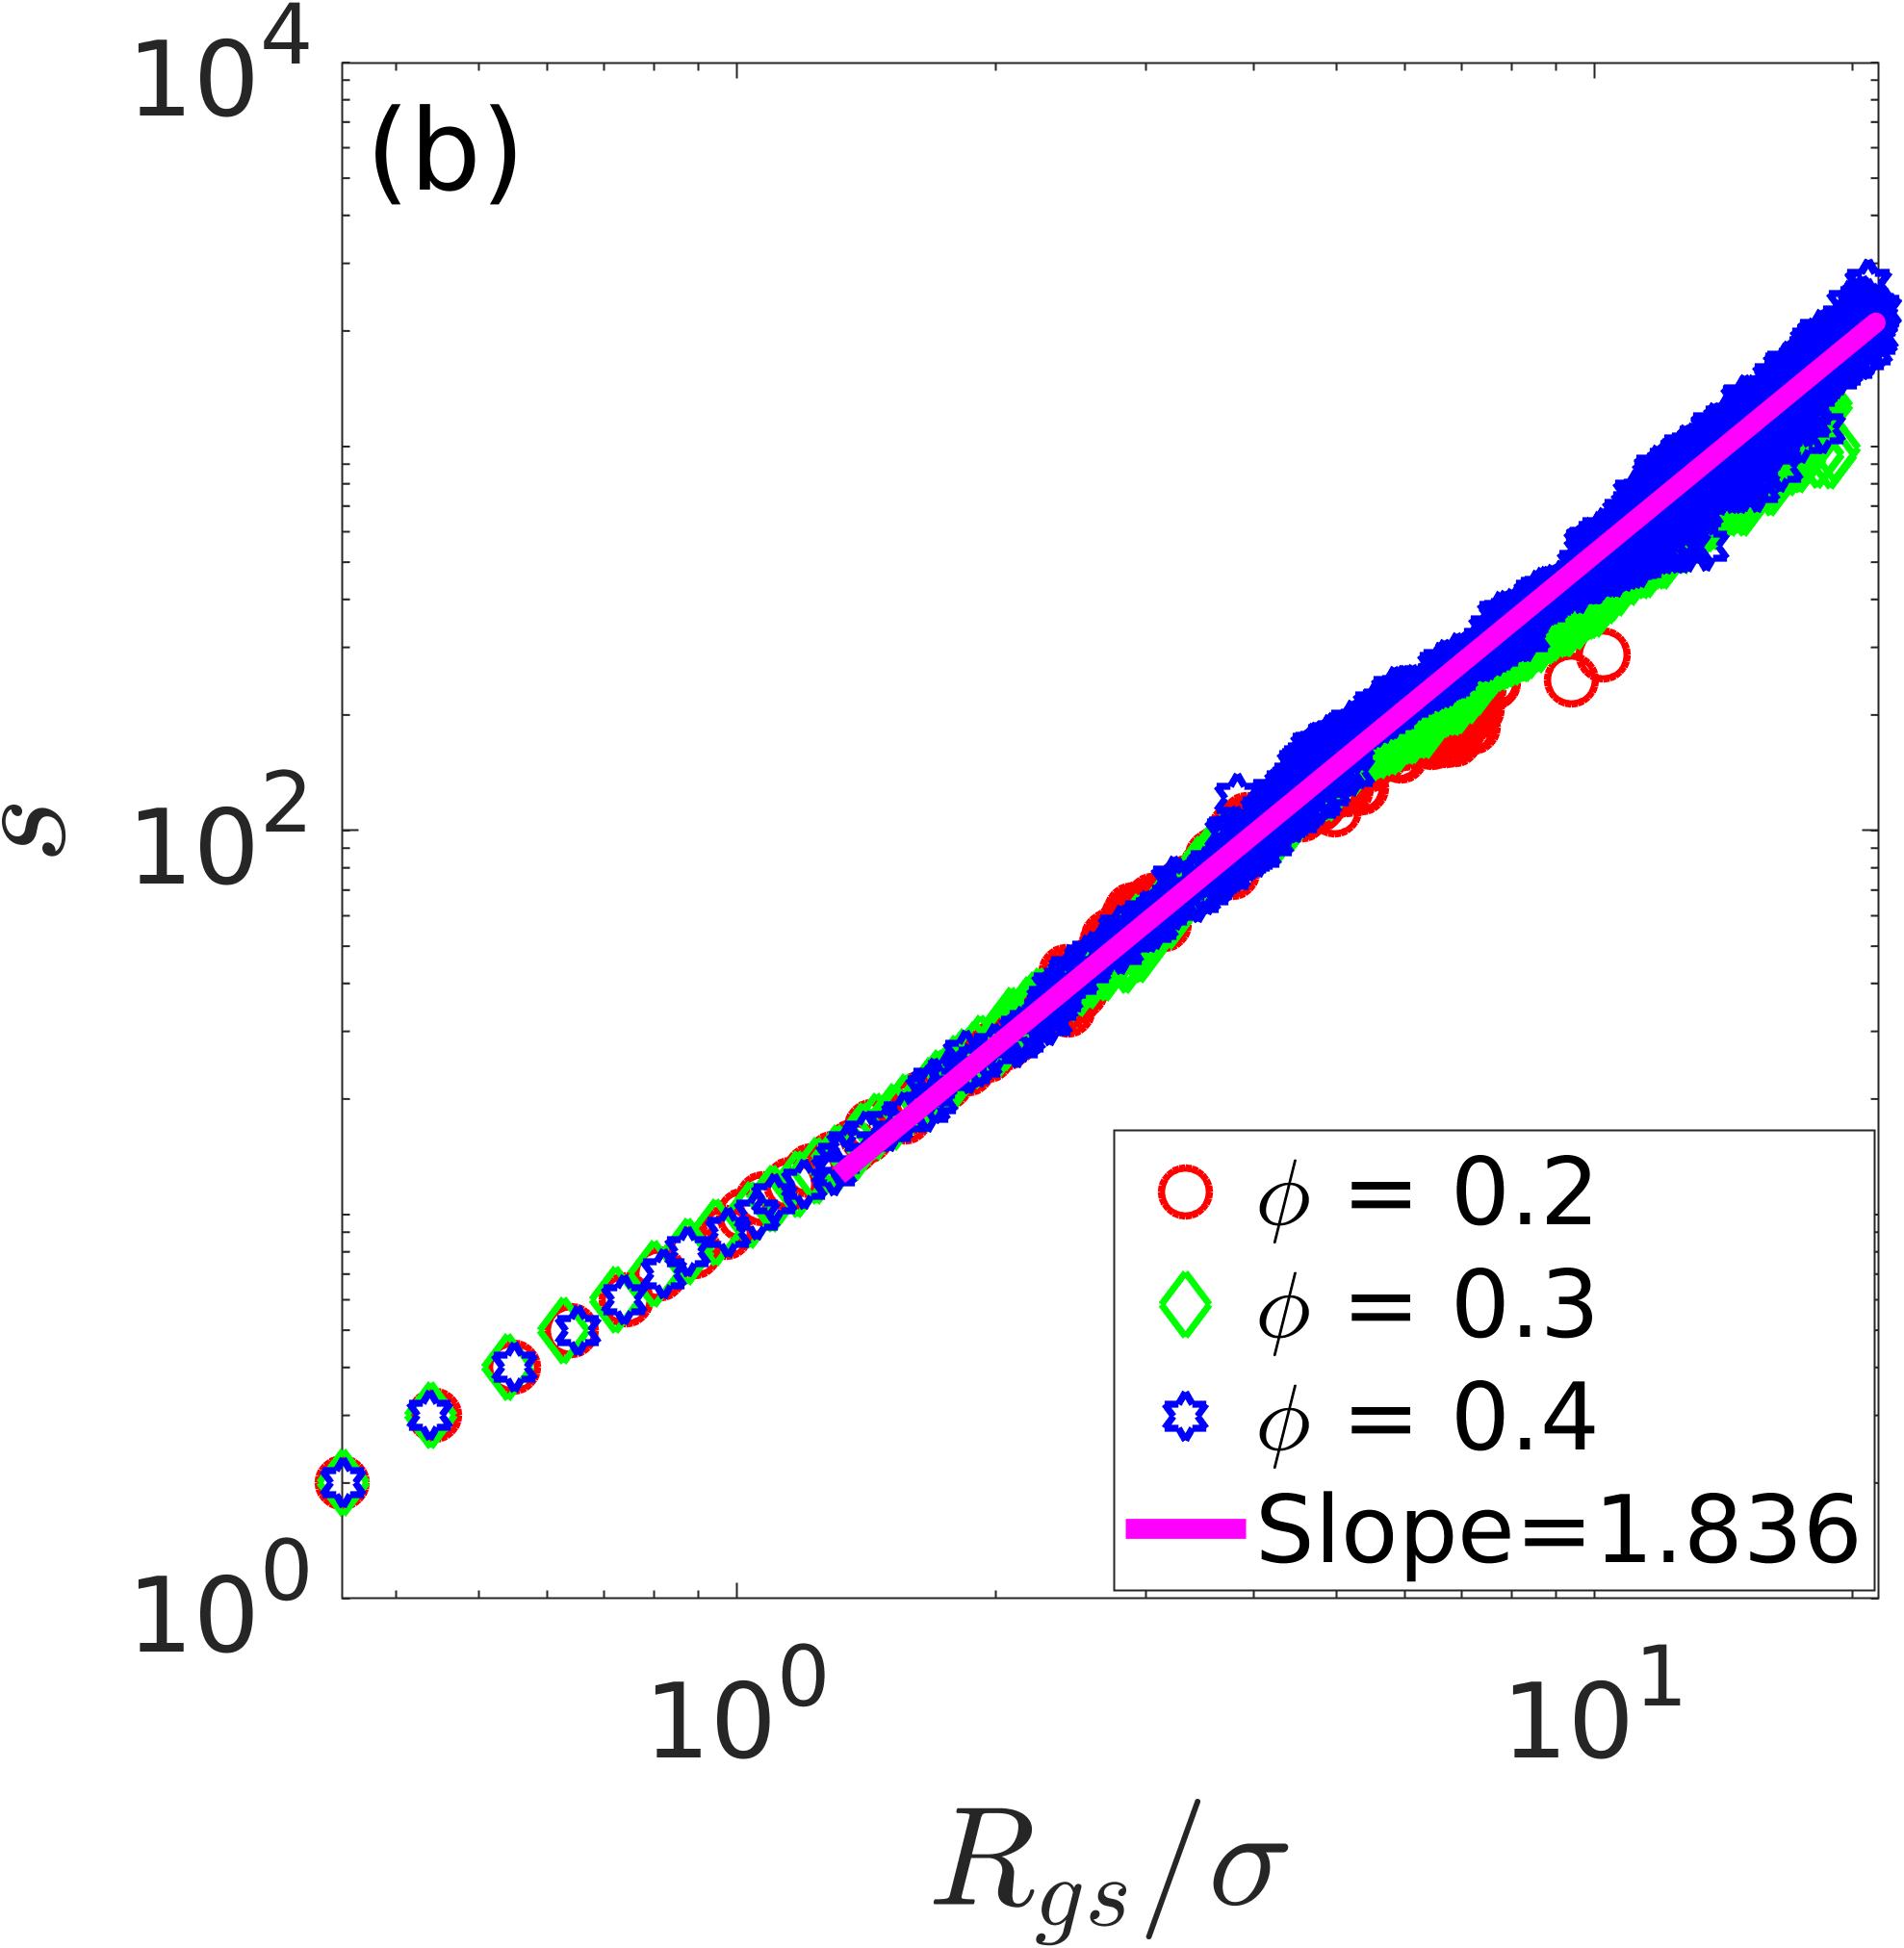
We turn our attention to the morphology of the clusters. It appears from Fig. 2 that the clusters acquire a fractal-like structure on approach to percolation transition. This can be tested by calculating the radius of gyration and the associated fractal dimension . The radius of gyration, , is defined as [46]:
| (2) |
where and represent position vectors of particles within a cluster of size [46, 54]. Near the percolation threshold, the cluster size is connected to the radius of gyration by the relation[46]:
| (3) |
where is the fractal dimension. For a two-dimensional system, the from the CPT [56]. The data in Fig. 4(b) shows the relation between the radius of gyration and cluster sizes. The red circles, green diamonds, and blue hexagons represent data points for and , respectively. The magenta solid line corresponds to the fitting of at for , and the slope of the fitted curve gives , which appears to be in close agreement with the continuum percolation model [47].
 |
 |
III.5 Average cluster size and correlation length of clusters
We proceed further with the analysis of other quantities to establish the nature of percolation transition observed in our experiments. In equilibrium systems quantities like average cluster size and correlation length exhibit power-law scaling with the distance from the critical point. The average cluster size obeys the following relation in the the vicinity of the critical point[46]:
| (4) |
where is the critical exponent associated with . The CPT predicts for two-dimensional (2D) systems [47]. The is defined as the second moment of cluster size distribution and is give by the following equation[46]:
| (5) |
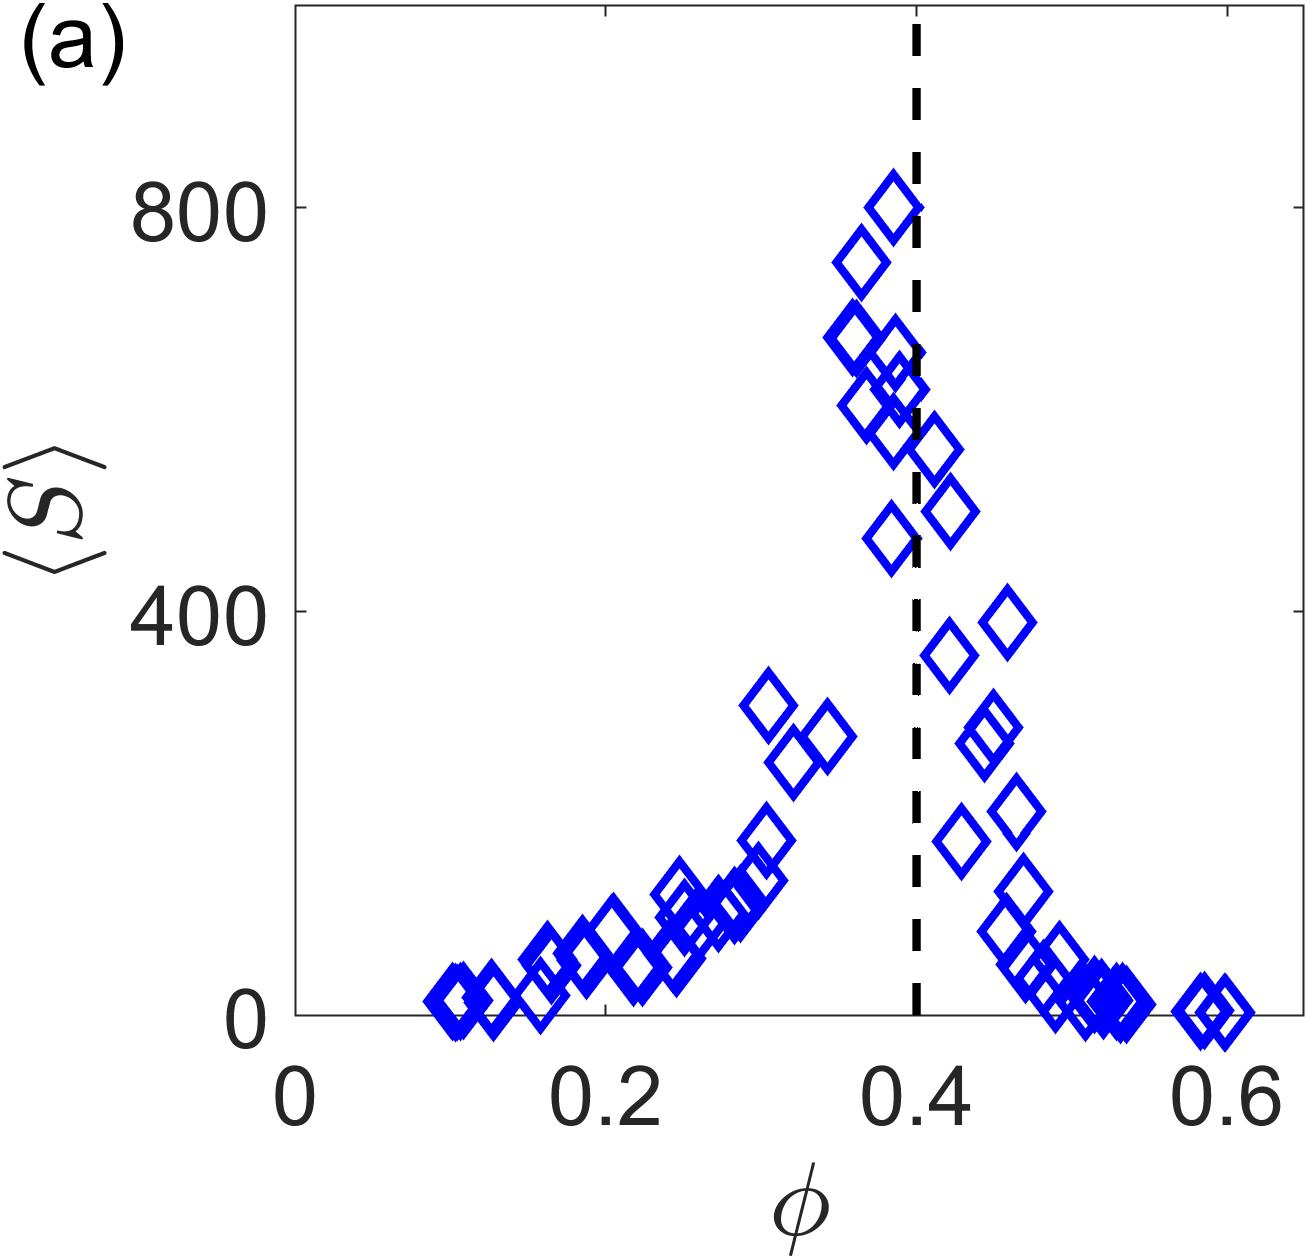
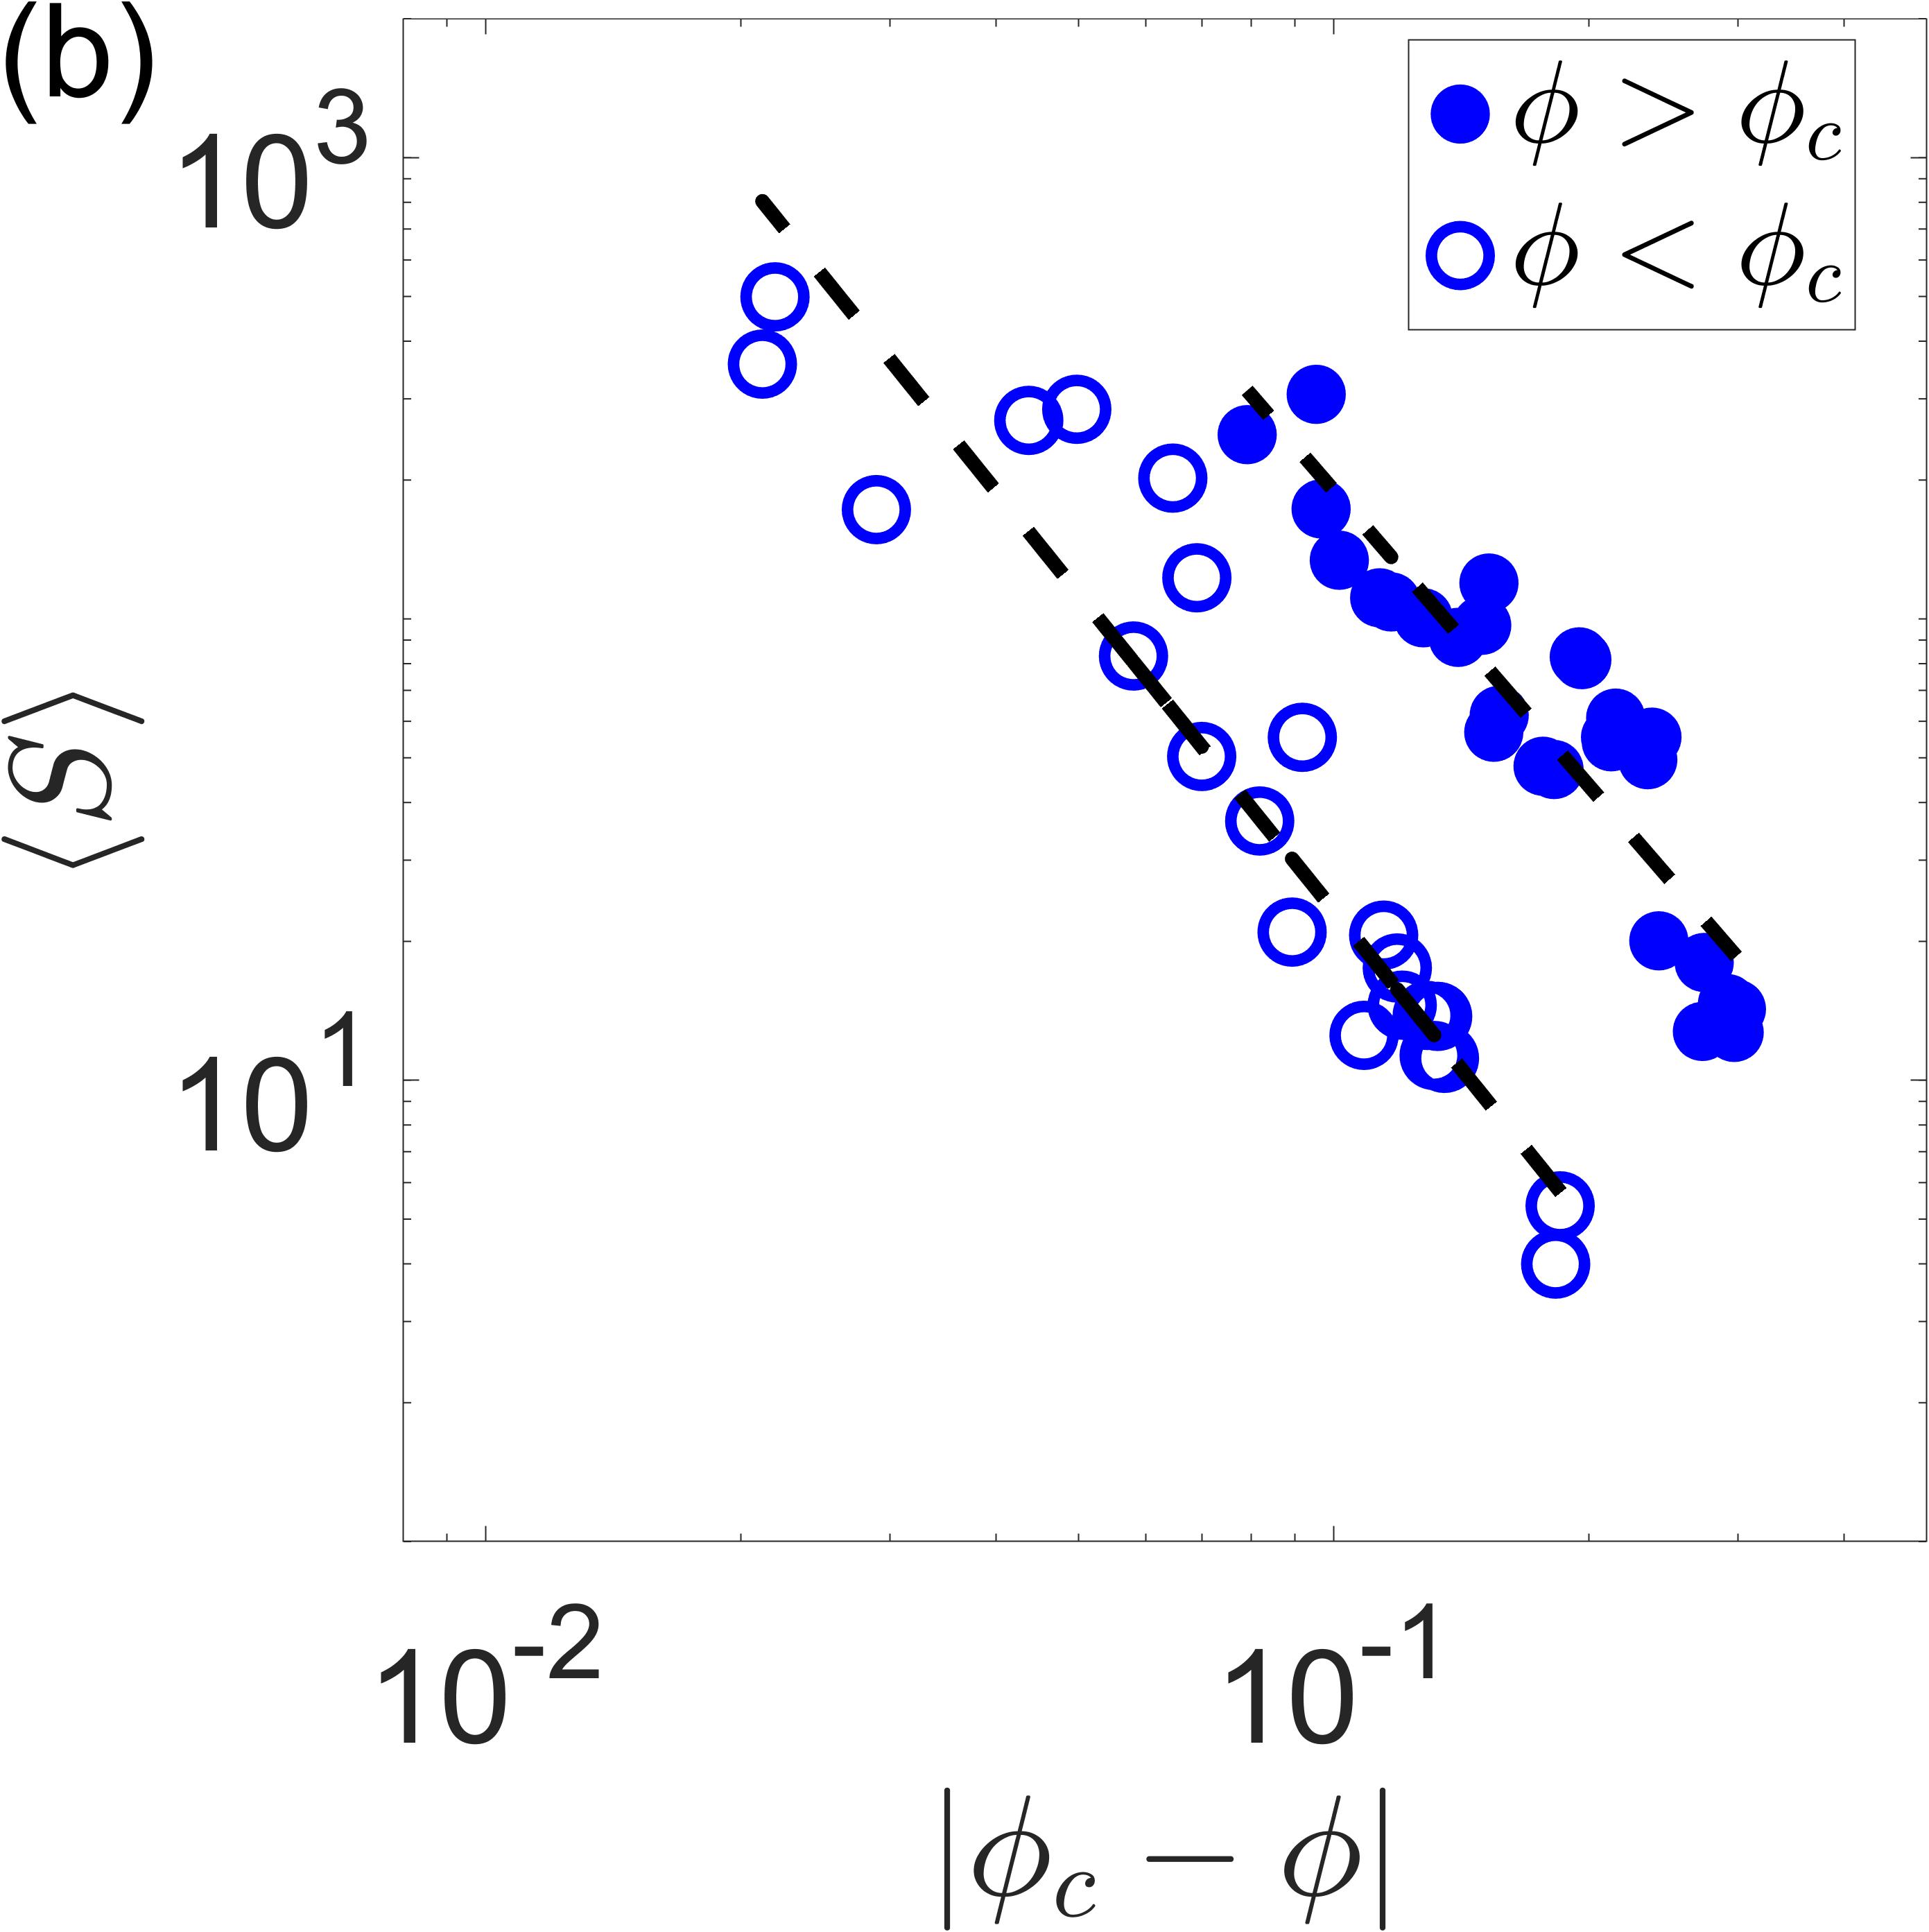
In the above equation, represents the size of individual clusters, and denotes the frequency of clusters with size . The notation signifies that the summation excludes contributions from the spanning cluster or the first largest cluster. The variation of with changing area-fraction of colloids across is shown in Fig. 5(a). It is important to note that our calculations exclude contributions from spanning clusters, focusing on the behavior of finite-sized clusters. It illustrates a familiar trend close to the critical point. Initially, increases as approaches the critical point and it decreases beyond . The Fig. 5(b) shows the variation of as a distance from the critical point on a double logarithmic scale. The open circles correspond to and filled circles correspond to . The slopes of best-fit lines to the data yields when and the slope is for . In conclusion, our analysis reveals that the critical exponent associated with show deviations from the standard percolation models [47].
 |
 |
Along with , the equilibrium correlation length of the clusters is known to obey a scaling relation described by the following equation [46]:
| (6) |
where the critical exponent for a two dimensional system [47]. The correlation length is calculated using the equation[46]:
| (7) |
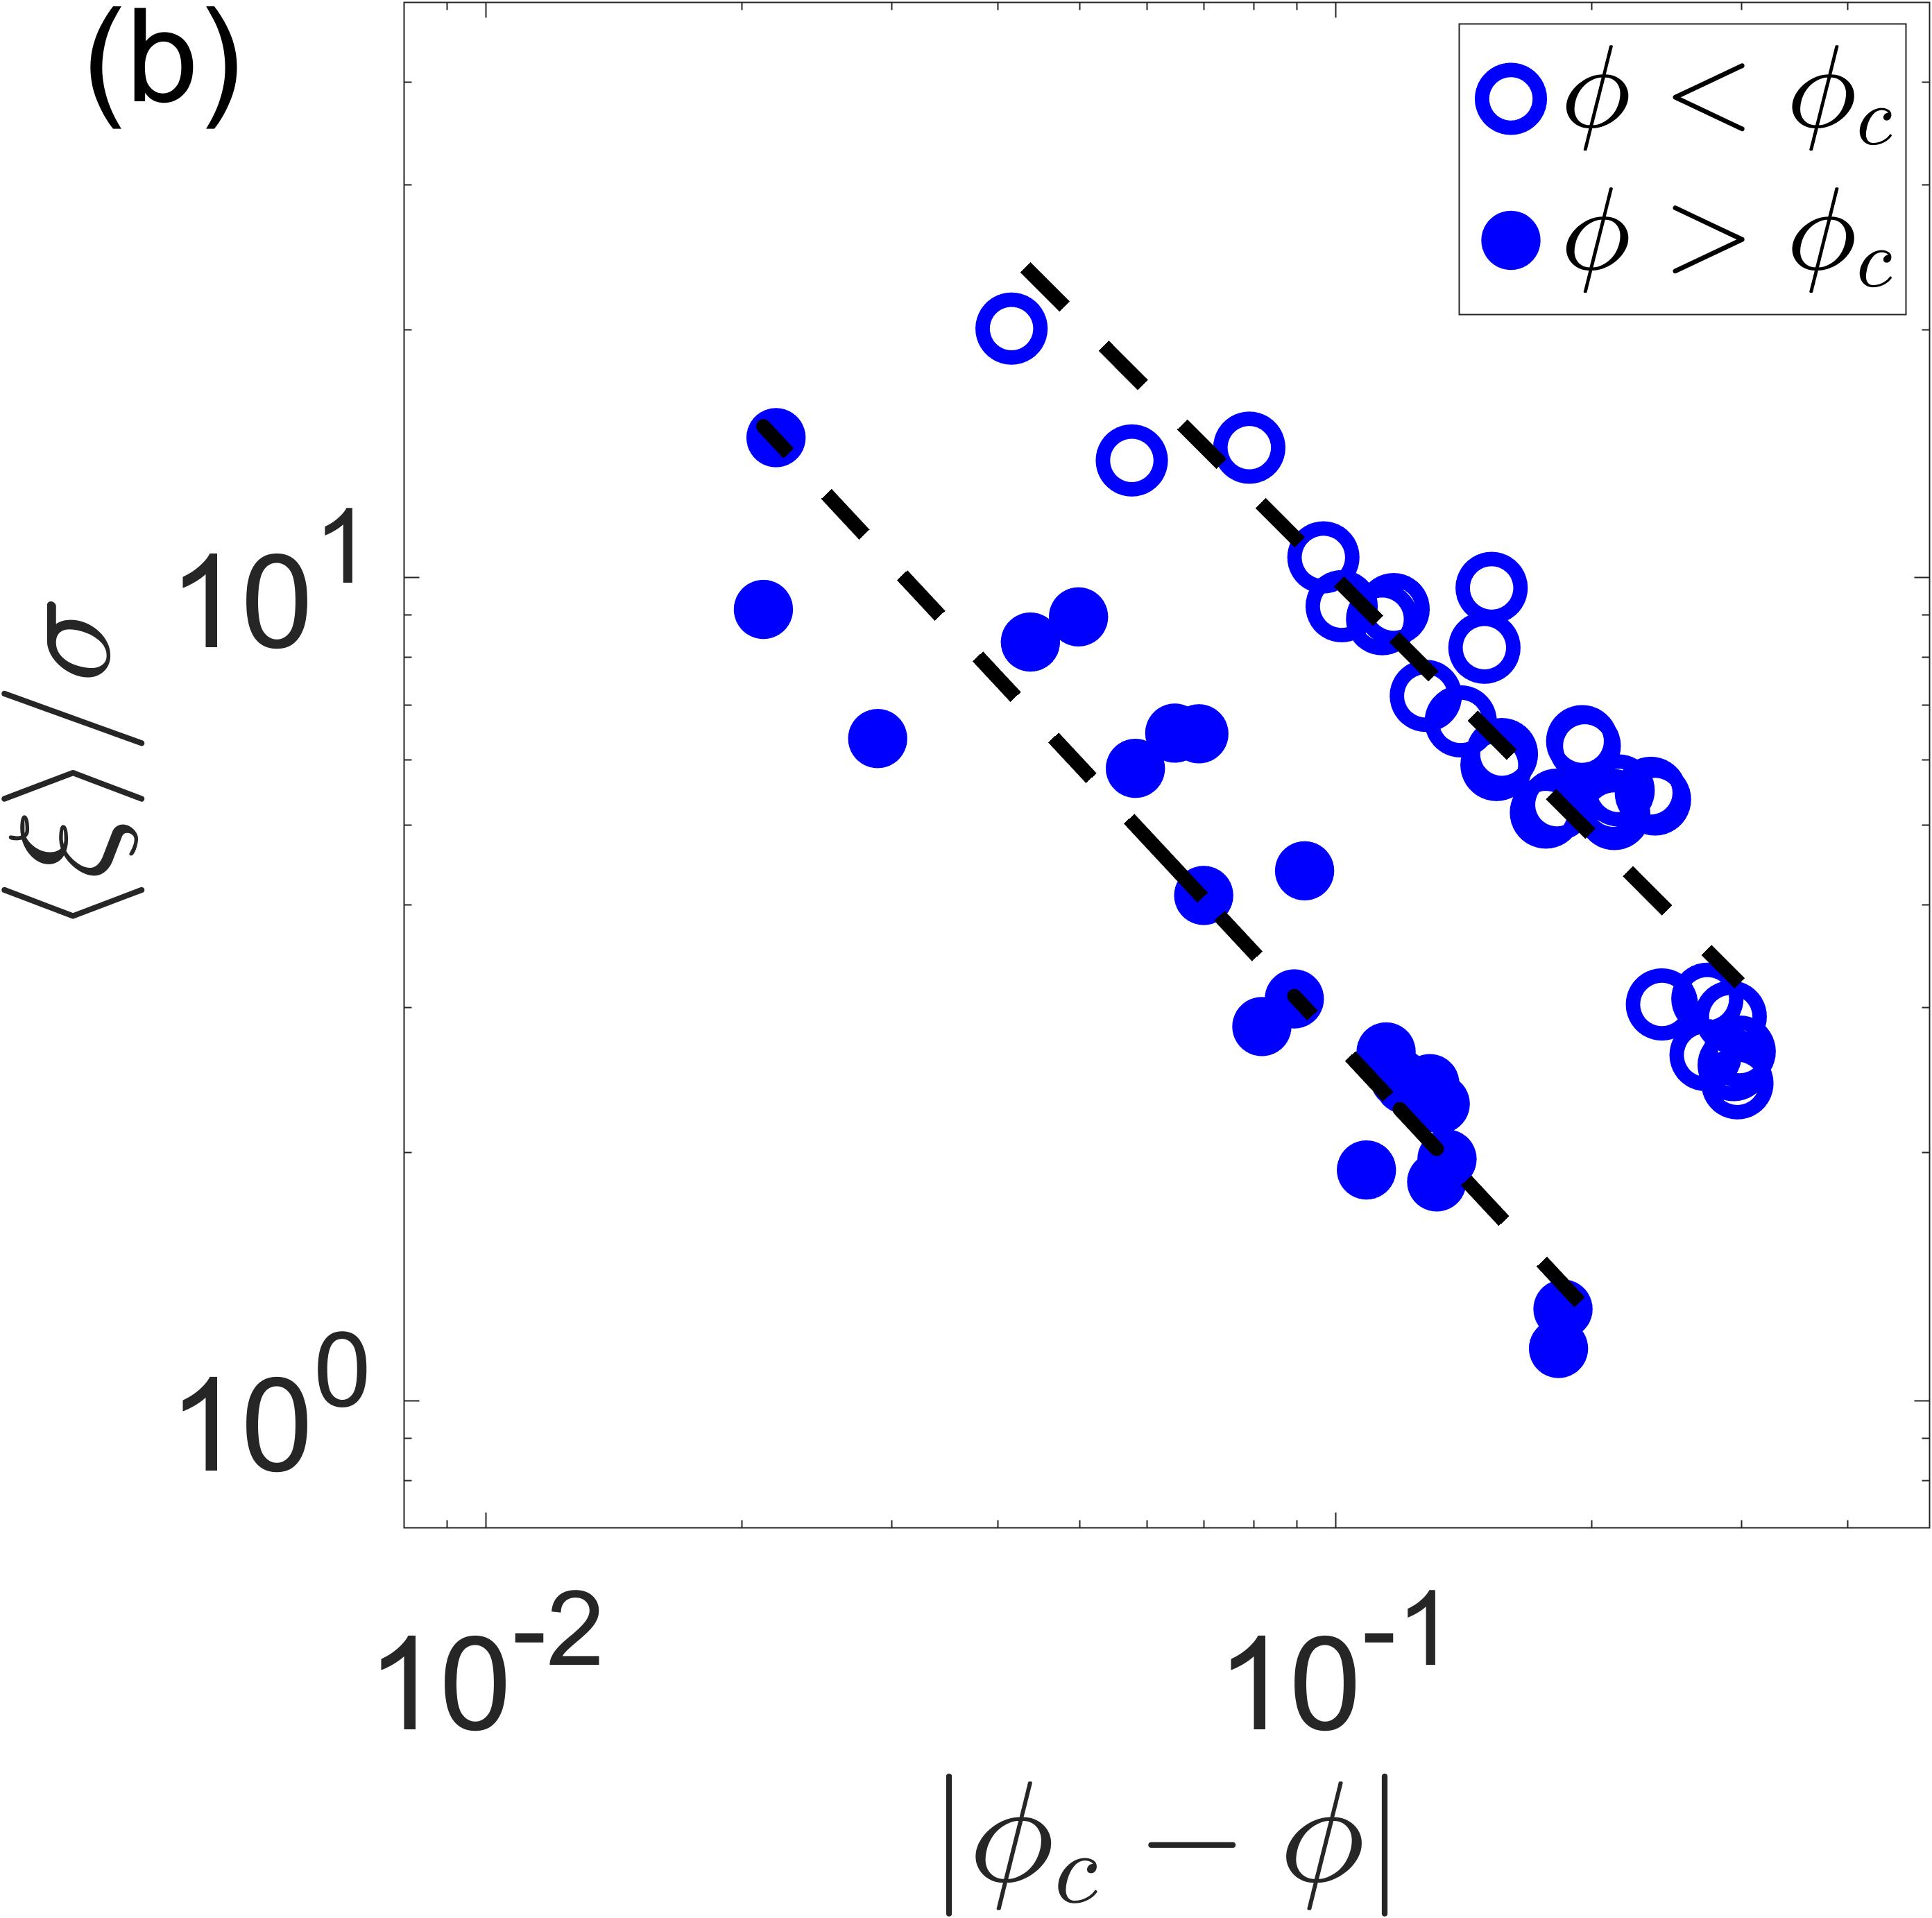
where represents the radius of gyration of clusters containing s-particles, and denotes the frequency of clusters with size . Similar to previous definitions, the primed sum excludes contributions from the spanning cluster. The analysis of in our experiments at various densities of colloids in Fig. 6(a) reveals a similar trend as , in the neighborhood of . We can gain a better understanding by presenting the data on a double logarithmic plots in Fig. 6(b). The data in Fig. 6(b) shows the variation of as a function of distance from the critical point . The open circles correspond to and filled circles correspond to . The slopes of best-fit lines to the data yields when and the slope is for . The exponents on both the sides of is far from the standard continuum model.
The results from our analysis of cluster sizes distribution , average cluster size , and correlation length reveal that their respective exponents , , and show deviations from the standard exponents predicted by continuum percolation theory for 2D equilibrium systems. The exponents reported here could have finite size effects and in addition it is difficult to accurately pinpoint the critical density in experiments. Our results motivate novel theoretical models and simulations to determine the true values of exponents. Our current results appear to support recent numerical studies on percolation transition in purely active particle systems [43, 45] that have reported critical exponents deviating from standard percolation models, hinting at a new universality class of percolation model for active systems. A confirmation of these observation needs further investigation into these aspects.
III.6 Effect of chiral swimmers on the structure of clusters
 |
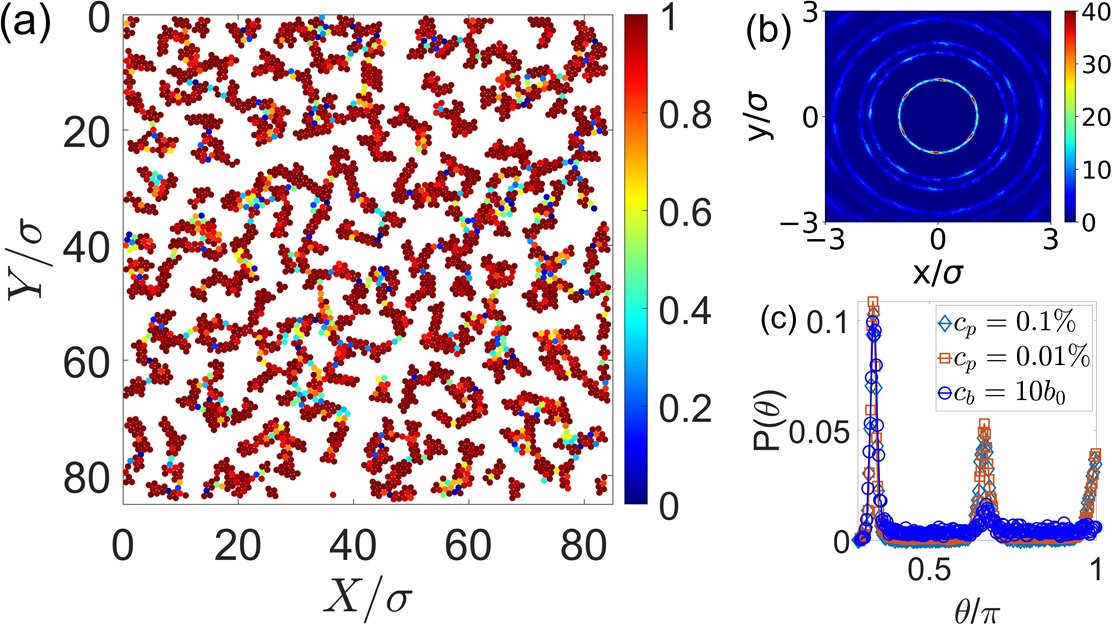
In this section, we discuss the influence of chirality on the organization of colloids within the clusters. To elucidate this effect, we analyze the microscopic structure of clusters using conventional structural measures such as the local bond orientational order parameter and the pair correlation function. The local bond orientational order parameter is defined as , where is the orientation of the link connecting the two neighboring particles , and the sum runs over nearest neighboring particles within a cutoff distance of . Figure 7(a) presents the local at the percolation threshold , where the color coding is based on the values of the particles. This plot reveals weak orientational ordering of particles in the clusters, further confirmed by the polar plot of the pair correlation function in Fig. 7(b). The plot of demonstrates a liquid-like isotropic structure of the system. We next display the distribution of angles between two successive bonds [41] in Fig. 7(c). The plot shows with a prominent peak at and a small one at . These results are robust and persist over a range of densities and bacteria concentration. They are illuminating when interpreted in light of our understanding of equilibrium colloid-polymer mixtures [36, 57]. Figs. 8(a)-8(c) in the appendix depict the ordering of colloids within clusters of colloid-polymer mixture. The presence of prominent peaks in these plots points to strong directional ordering, which is reported to be responsible for directed percolation transition in colloid-polymer mixtures [41, 42, 58]. Apparently, the weak structural ordering in colloid-bacteria mixture is a result of activity and chirality of the swimmers, which also alter the nature of the percolation transition.
In summary, we have studied the non-equilibrium percolation of colloidal assemblies in active liquids of chiral swimmers. The colloids form dynamic clusters due to effective interactions mediated by the active bath. The chirality of swimmers strongly influences the dynamics of individual particles and their aggregates, and it leads to persistent clockwise rotations of individual particles and their clusters. It also hinders the local orientational ordering of colloids, which is observed in equilibrium colloid-polymer mixtures. With the increasing density of colloids, the size of the clusters grows and eventually spans the entire system at a critical density , which was determined from the spanning probability. Further analysis of various parameters, including cluster size distribution , radius of gyration , average cluster size , and correlation length , along with their associated exponents , , , and , suggests that colloid-bacteria mixtures displays several hallmark features of percolation transition. However, the exponents show marked deviations from the exponents of standard continuum percolation model. These results need confirmation from finite system size analysis, which is possible with particle simulation methods [31, 44, 43]. Our experiments reveal richer and tunable structures of colloidal assemblies in non-equilibrium baths, and it should inspire further investigations to unveil novel rheological properties of colloidal assemblies in active liquids.
IV Appendix
IV.1 Structure of clusters in colloid-polymer mixture
In this section, we investigate the structure of clusters in a colloid-polymer mixture, which was prepared utilizing silica beads of diameter of 3.34 and sodium polystyrene sulfonate (NaPSS) polymer of molecular weight Da. The preparation involved two distinct polymer concentrations, namely and , both suspended in deionized (DI) water. The particles sediment to the bottom to form a monolayer of particles, which is evidenced from their gravitational length . For our silica beads, it turns out to be , which is much smaller than the size of the particle [59].
The Fig. 8(a) depicts the local bond orientational order parameter () for a polymer concentration of and a colloidal area-fraction of , where the colors illustrates the magnitude of . Additionally, the Fig. 8(b) presents the two-dimensional pair correlation with the color indicating the magnitude of g(x,y) at same and . The local ordering of colloidal particles is evident from the results in these two figures. There is a strong hexatic ordering in Fig. 8(a), while Fig. 8(b) shows distinct peaks in the first two inner rings corresponding to hexagonal symmetry.
The two-dimensional pair correlation g(x,y) is defined as [60]
| (8) |
where is a Dirac delta function, is the area density, represents the average over all reference particles .
Figure 8(c) shows the distribution of angles between two successive bonds[41] for two different polymer concentrations, and , at , respectively. This analysis also includes the colloid-bacteria mixture at a cell concentration of and a colloidal area-fraction of . The curve displays a prominent peak at , along with enhanced peaks at and . Apparently, such directional ordering is absent in the clusters of colloidal-bacteria system.
IV.2 Effect of varying swimmer density on the spanning probability
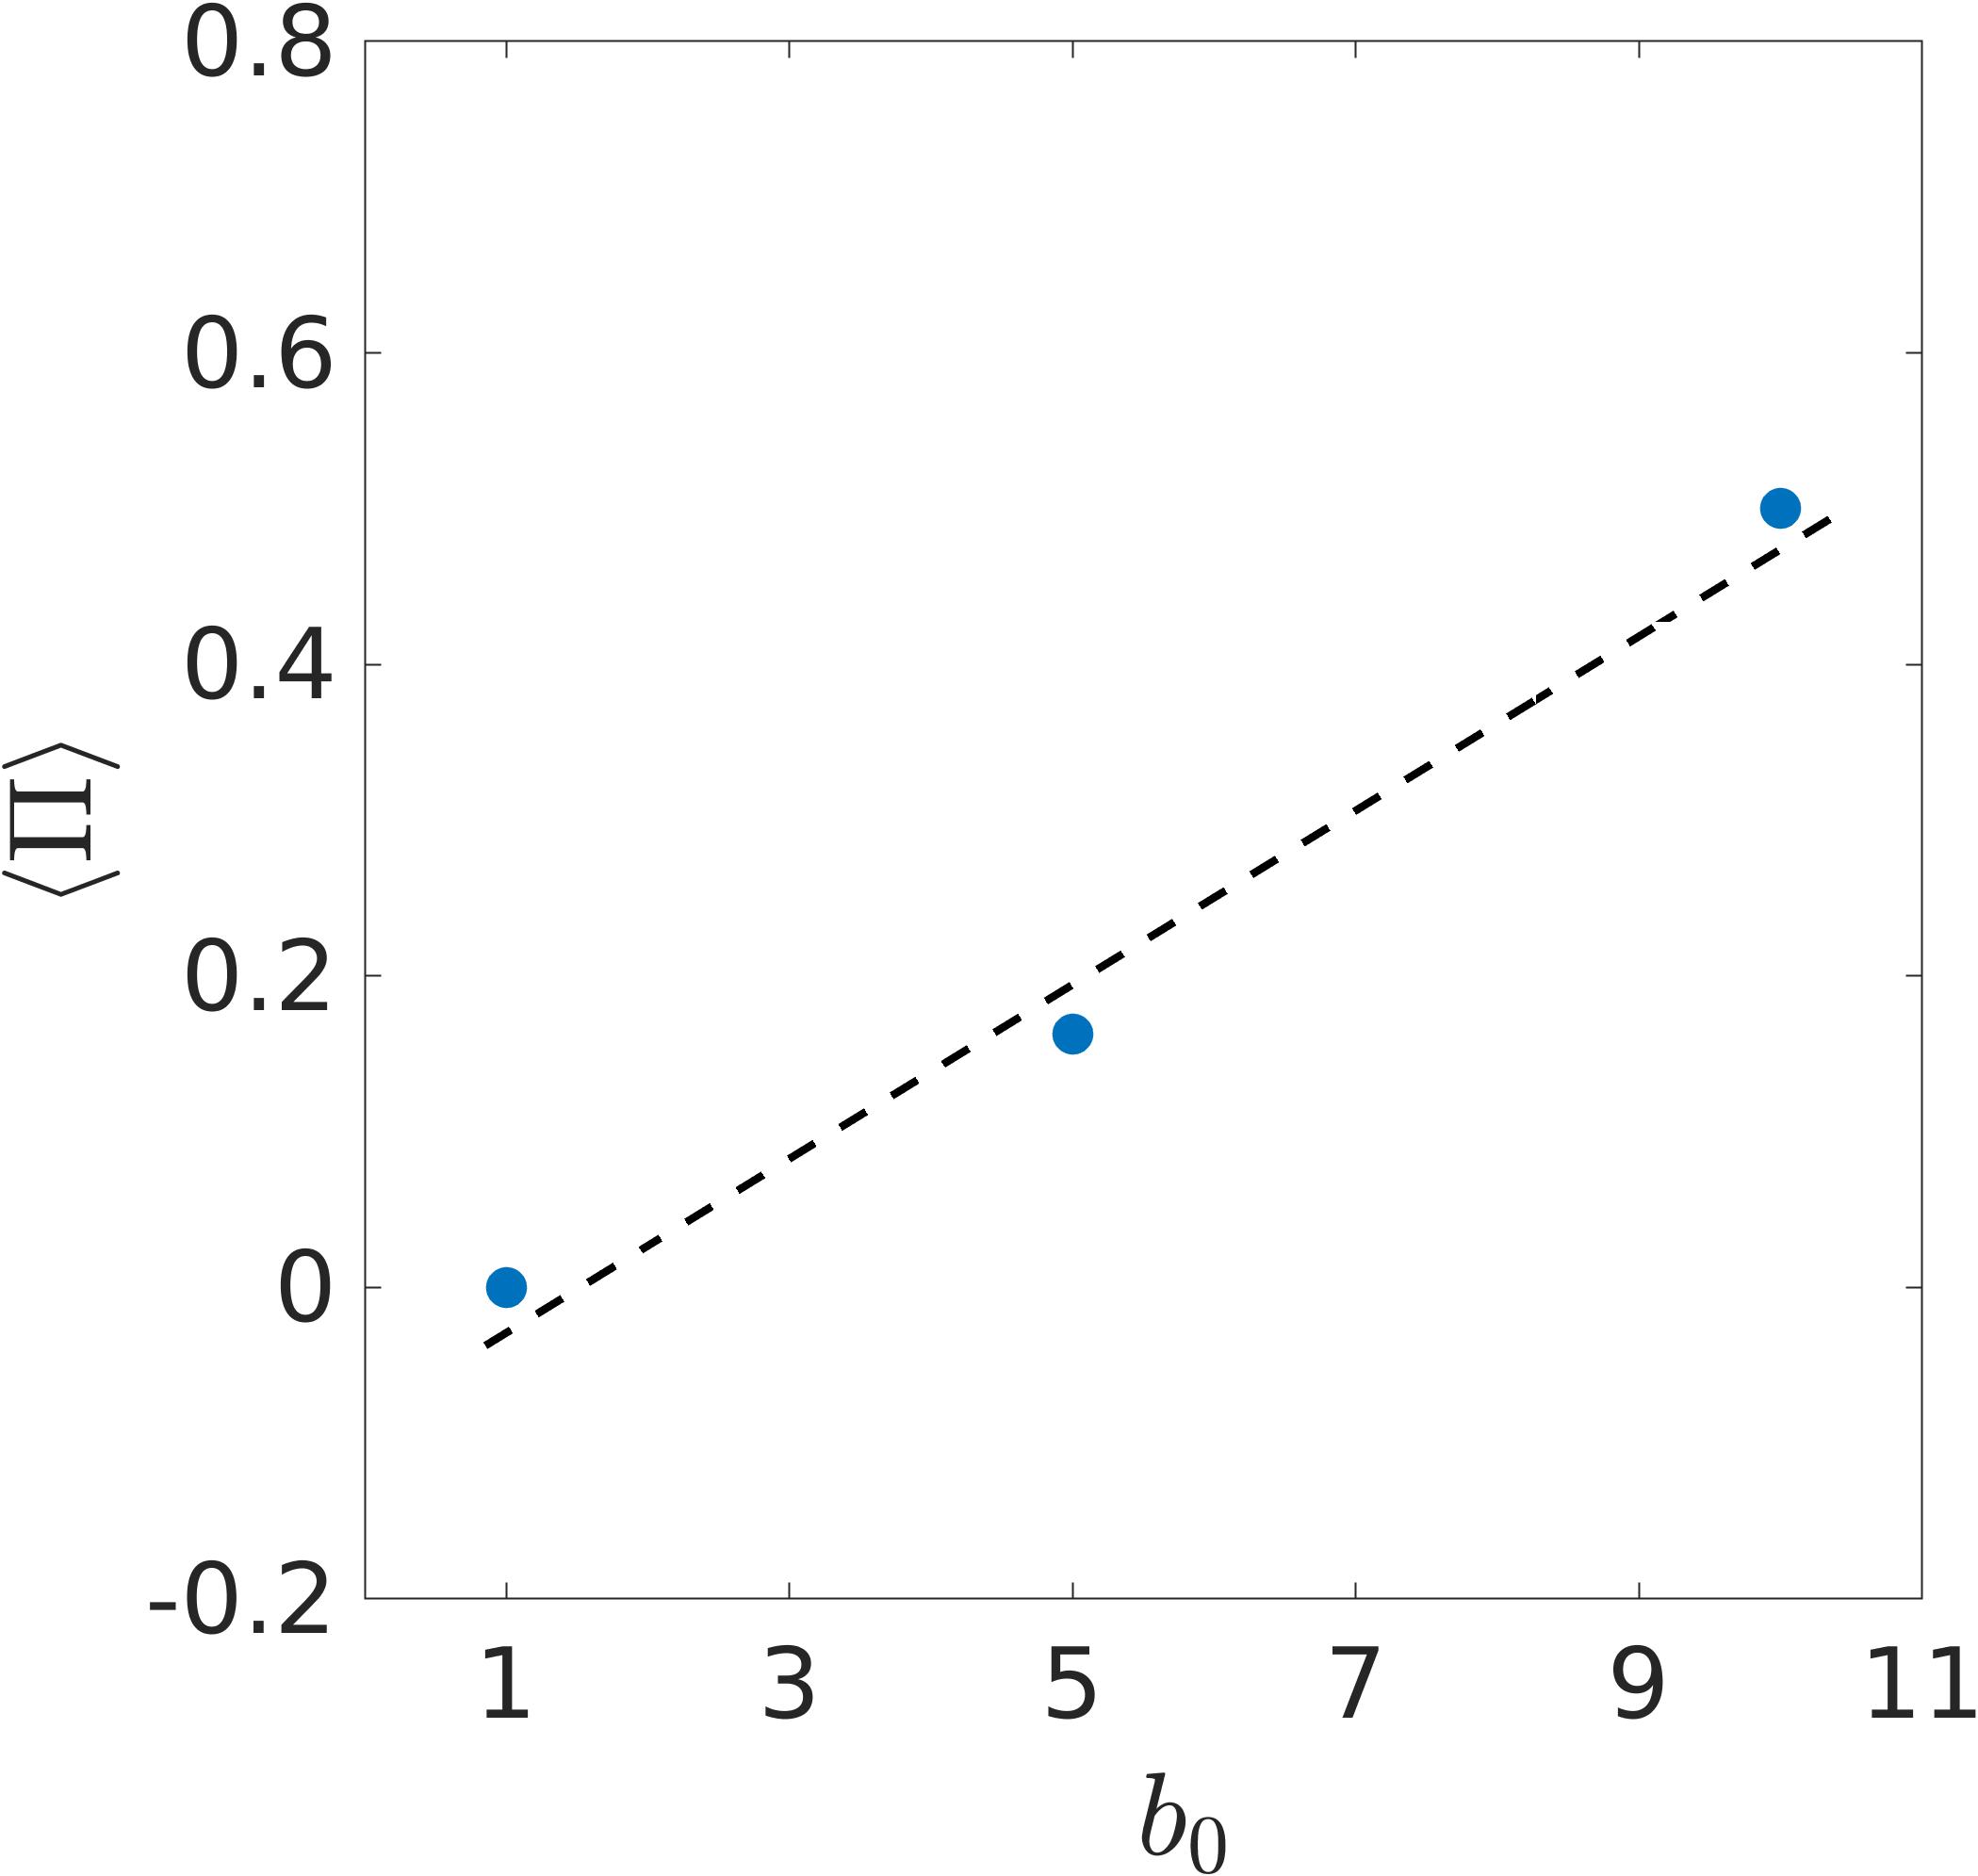
Figure 9 shows the effect of varying the density of swimmers on the spanning probability of colloidal clusters. The density of bacteria used in all the measurements in the main paper is . Here, we have varied the density of swimmers from to . The spanning probability increases with increasing concentration of bacteria. This suggests that the clusters grow in size with increasing density of bacteria [28].
References
- Marchetti et al. [2013] M. C. Marchetti, J.-F. Joanny, S. Ramaswamy, T. B. Liverpool, J. Prost, M. Rao, and R. A. Simha, Hydrodynamics of soft active matter, Reviews of modern physics 85, 1143 (2013).
- Bechinger et al. [2016] C. Bechinger, R. Di Leonardo, H. Löwen, C. Reichhardt, G. Volpe, and G. Volpe, Active particles in complex and crowded environments, Reviews of Modern Physics 88, 045006 (2016).
- Ndlec et al. [1997] F. Ndlec, T. Surrey, A. C. Maggs, and S. Leibler, Self-organization of microtubules and motors, Nature 389, 305 (1997).
- Palacci et al. [2010] J. Palacci, C. Cottin-Bizonne, C. Ybert, and L. Bocquet, Sedimentation and effective temperature of active colloidal suspensions, Physical Review Letters 105, 088304 (2010).
- Bricard et al. [2013] A. Bricard, J.-B. Caussin, N. Desreumaux, O. Dauchot, and D. Bartolo, Emergence of macroscopic directed motion in populations of motile colloids, Nature 503, 95 (2013).
- Vicsek et al. [1995] T. Vicsek, A. Czirók, E. Ben-Jacob, I. Cohen, and O. Shochet, Novel type of phase transition in a system of self-driven particles, Physical review letters 75, 1226 (1995).
- Bricard et al. [2015] A. Bricard, J.-B. Caussin, D. Das, C. Savoie, V. Chikkadi, K. Shitara, O. Chepizhko, F. Peruani, D. Saintillan, and D. Bartolo, Emergent vortices in populations of colloidal rollers, Nature communications 6, 7470 (2015).
- Stenhammar et al. [2015] J. Stenhammar, R. Wittkowski, D. Marenduzzo, and M. E. Cates, Activity-induced phase separation and self-assembly in mixtures of active and passive particles, Physical review letters 114, 018301 (2015).
- Buttinoni et al. [2013] I. Buttinoni, J. Bialké, F. Kümmel, H. Löwen, C. Bechinger, and T. Speck, Dynamical clustering and phase separation in suspensions of self-propelled colloidal particles, Physical review letters 110, 238301 (2013).
- Palacci et al. [2013] J. Palacci, S. Sacanna, A. P. Steinberg, D. J. Pine, and P. M. Chaikin, Living crystals of light-activated colloidal surfers, Science 339, 936 (2013).
- Wensink et al. [2012] H. H. Wensink, J. Dunkel, S. Heidenreich, K. Drescher, R. E. Goldstein, H. Löwen, and J. M. Yeomans, Meso-scale turbulence in living fluids, Proceedings of the national academy of sciences 109, 14308 (2012).
- López et al. [2015] H. M. López, J. Gachelin, C. Douarche, H. Auradou, and E. Clément, Turning bacteria suspensions into superfluids, Physical review letters 115, 028301 (2015).
- Köhler et al. [2011] S. Köhler, V. Schaller, and A. R. Bausch, Structure formation in active networks, Nature materials 10, 462 (2011).
- Koenderink et al. [2009] G. H. Koenderink, Z. Dogic, F. Nakamura, P. M. Bendix, F. C. MacKintosh, J. H. Hartwig, T. P. Stossel, and D. A. Weitz, An active biopolymer network controlled by molecular motors, Proceedings of the National Academy of Sciences 106, 15192 (2009).
- Alvarado et al. [2013] J. Alvarado, M. Sheinman, A. Sharma, F. C. MacKintosh, and G. H. Koenderink, Molecular motors robustly drive active gels to a critically connected state, Nature physics 9, 591 (2013).
- Sanchez et al. [2012] T. Sanchez, D. T. Chen, S. J. DeCamp, M. Heymann, and Z. Dogic, Spontaneous motion in hierarchically assembled active matter, Nature 491, 431 (2012).
- Grober et al. [2023] D. Grober, I. Palaia, M. C. Uçar, E. Hannezo, A. Šarić, and J. Palacci, Unconventional colloidal aggregation in chiral bacterial baths, Nature Physics , 1 (2023).
- Wu and Libchaber [2000] X.-L. Wu and A. Libchaber, Particle diffusion in a quasi-two-dimensional bacterial bath, Physical review letters 84, 3017 (2000).
- Jepson et al. [2013] A. Jepson, V. A. Martinez, J. Schwarz-Linek, A. Morozov, and W. C. Poon, Enhanced diffusion of nonswimmers in a three-dimensional bath of motile bacteria, Physical Review E 88, 041002 (2013).
- Mino et al. [2011] G. Mino, T. E. Mallouk, T. Darnige, M. Hoyos, J. Dauchet, J. Dunstan, R. Soto, Y. Wang, A. Rousselet, and E. Clement, Enhanced diffusion due to active swimmers at a solid surface, Physical review letters 106, 048102 (2011).
- Morozov and Marenduzzo [2014] A. Morozov and D. Marenduzzo, Enhanced diffusion of tracer particles in dilute bacterial suspensions, Soft Matter 10, 2748 (2014).
- Angelani et al. [2011] L. Angelani, C. Maggi, M. Bernardini, A. Rizzo, and R. Di Leonardo, Effective interactions between colloidal particles suspended in a bath of swimming cells, Physical review letters 107, 138302 (2011).
- Zaeifi Yamchi and Naji [2017] M. Zaeifi Yamchi and A. Naji, Effective interactions between inclusions in an active bath, The Journal of chemical physics 147 (2017).
- Feng et al. [2021] F. Feng, T. Lei, and N. Zhao, Tunable depletion force in active and crowded environments, Physical Review E 103, 022604 (2021).
- Harder et al. [2014] J. Harder, S. Mallory, C. Tung, C. Valeriani, and A. Cacciuto, The role of particle shape in active depletion, The Journal of chemical physics 141 (2014).
- Liu et al. [2020] P. Liu, S. Ye, F. Ye, K. Chen, and M. Yang, Constraint dependence of active depletion forces on passive particles, Physical review letters 124, 158001 (2020).
- Ning et al. [2023] L. Ning, X. Lou, Q. Ma, Y. Yang, N. Luo, K. Chen, F. Meng, X. Zhou, M. Yang, and Y. Peng, Hydrodynamics-induced long-range attraction between plates in bacterial suspensions, Physical Review Letters 131, 158301 (2023).
- Gokhale et al. [2022] S. Gokhale, J. Li, A. Solon, J. Gore, and N. Fakhri, Dynamic clustering of passive colloids in dense suspensions of motile bacteria, Physical Review E 105, 054605 (2022).
- Kushwaha et al. [2023] P. Kushwaha, V. Semwal, S. Maity, S. Mishra, and V. Chikkadi, Phase separation of passive particles in active liquids, Physical Review E 108, 034603 (2023).
- Bouvard et al. [2023] J. Bouvard, F. Moisy, and H. Auradou, Ostwald-like ripening in the two-dimensional clustering of passive particles induced by swimming bacteria, Physical Review E 107, 044607 (2023).
- Dolai et al. [2018] P. Dolai, A. Simha, and S. Mishra, Phase separation in binary mixtures of active and passive particles, Soft Matter 14, 6137 (2018).
- Lauga et al. [2006] E. Lauga, W. R. DiLuzio, G. M. Whitesides, and H. A. Stone, Swimming in circles: motion of bacteria near solid boundaries, Biophysical journal 90, 400 (2006).
- DiLuzio et al. [2005] W. R. DiLuzio, L. Turner, M. Mayer, P. Garstecki, D. B. Weibel, H. C. Berg, and G. M. Whitesides, Escherichia coli swim on the right-hand side, Nature 435, 1271 (2005).
- Di Leonardo et al. [2010] R. Di Leonardo, L. Angelani, D. Dell’Arciprete, G. Ruocco, V. Iebba, S. Schippa, M. P. Conte, F. Mecarini, F. De Angelis, and E. Di Fabrizio, Bacterial ratchet motors, Proceedings of the National Academy of Sciences 107, 9541 (2010).
- Sokolov et al. [2010] A. Sokolov, M. M. Apodaca, B. A. Grzybowski, and I. S. Aranson, Swimming bacteria power microscopic gears, Proceedings of the National Academy of Sciences 107, 969 (2010).
- Poon [2002] W. C. Poon, The physics of a model colloid–polymer mixture, Journal of Physics: Condensed Matter 14, R859 (2002).
- Lu et al. [2008] P. J. Lu, E. Zaccarelli, F. Ciulla, A. B. Schofield, F. Sciortino, and D. A. Weitz, Gelation of particles with short-range attraction, Nature 453, 499 (2008).
- Zaccarelli [2007] E. Zaccarelli, Colloidal gels: Equilibrium and non-equilibrium routes, Journal of Physics: Condensed Matter 19, 323101 (2007).
- Rouwhorst et al. [2020] J. Rouwhorst, C. Ness, S. Stoyanov, A. Zaccone, and P. Schall, Nonequilibrium continuous phase transition in colloidal gelation with short-range attraction, Nature communications 11, 3558 (2020).
- Tsurusawa et al. [2019] H. Tsurusawa, M. Leocmach, J. Russo, and H. Tanaka, Direct link between mechanical stability in gels and percolation of isostatic particles, Science advances 5, eaav6090 (2019).
- Kohl et al. [2016] M. Kohl, R. Capellmann, M. Laurati, S. Egelhaaf, and M. Schmiedeberg, Directed percolation identified as equilibrium pre-transition towards non-equilibrium arrested gel states, Nature Communications 7, 11817 (2016).
- Tsurusawa et al. [2020] H. Tsurusawa, S. Arai, and H. Tanaka, A unique route of colloidal phase separation yields stress-free gels, Science Advances 6, eabb8107 (2020).
- Schwarzendahl and Mazza [2022] F. J. Schwarzendahl and M. G. Mazza, Active percolation in pusher-type microswimmers, Europhysics Letters 140, 47001 (2022).
- Sanoria et al. [2022] M. Sanoria, R. Chelakkot, and A. Nandi, Percolation transition in phase-separating active fluid, Physical Review E 106, 034605 (2022).
- Levis and Berthier [2014] D. Levis and L. Berthier, Clustering and heterogeneous dynamics in a kinetic monte carlo model of self-propelled hard disks, Phys. Rev. E 89, 062301 (2014).
- Stauffer and Aharony [2018] D. Stauffer and A. Aharony, Introduction to percolation theory (CRC press, 2018).
- Gawlinski and Stanley [1981] E. T. Gawlinski and H. E. Stanley, Continuum percolation in two dimensions: Monte carlo tests of scaling and universality for non-interacting discs, Journal of Physics A: Mathematical and General 14, L291 (1981).
- Safran et al. [1985] S. Safran, I. Webman, and G. S. Grest, Percolation in interacting colloids, Physical Review A 32, 506 (1985).
- Lopez and Lauga [2014] D. Lopez and E. Lauga, Dynamics of swimming bacteria at complex interfaces, Physics of Fluids 26 (2014).
- Edmond et al. [2012] K. V. Edmond, M. T. Elsesser, G. L. Hunter, D. J. Pine, and E. R. Weeks, Decoupling of rotational and translational diffusion in supercooled colloidal fluids, Proceedings of the National Academy of Sciences 109, 17891 (2012).
- Ziff [1992] R. M. Ziff, Spanning probability in 2d percolation, Physical review letters 69, 2670 (1992).
- Lee and Torquato [1990] S. B. Lee and S. Torquato, Monte carlo study of correlated continuum percolation: Universality and percolation thresholds, Physical Review A 41, 5338 (1990).
- Ghosh et al. [2017] A. Ghosh, Z. Budrikis, V. Chikkadi, A. L. Sellerio, S. Zapperi, and P. Schall, Direct observation of percolation in the yielding transition of colloidal glasses, Physical review letters 118, 148001 (2017).
- Christensen [2002] K. Christensen, Percolation theory, Imperial College London 1 (2002).
- Majumdar et al. [1998] S. N. Majumdar, S. Krishnamurthy, and M. Barma, Nonequilibrium phase transitions in models of aggregation, adsorption, and dissociation, Physical review letters 81, 3691 (1998).
- Lorenz et al. [1993] B. Lorenz, I. Orgzall, and H.-O. Heuer, Universality and cluster structures in continuum models of percolation with two different radius distributions, Journal of Physics A: Mathematical and General 26, 4711 (1993).
- Lekkerkerker et al. [2011] H. N. Lekkerkerker, R. Tuinier, H. N. Lekkerkerker, and R. Tuinier, Depletion interaction (Springer, 2011).
- Tanaka [2022] H. Tanaka, Viscoelastic phase separation in biological cells, Communications Physics 5, 167 (2022).
- Hunter [2001] R. Hunter, Foundations of Colloid Science (Oxford University Press, 2001).
- Zhang et al. [2010] H.-P. Zhang, A. Be’er, E.-L. Florin, and H. L. Swinney, Collective motion and density fluctuations in bacterial colonies, Proceedings of the National Academy of Sciences 107, 13626 (2010).