LiSTA: Geometric Object-Based Change Detection
in Cluttered Environments
††thanks: This work has been carried out within the framework of the EUROfusion Consortium, funded by the European Union via the Euratom Research and Training Programme (Grant Agreement No 101052200 — EUROfusion). Views and opinions expressed are those of the author(s) do not necessarily reflect those of the European Union or the European Commission. Neither the European Union nor the European Commission can be held responsible for them. Additional funding from an EPSRC IAA grant (EP/X525777/1) and a Royal Society University Research Fellowship (Fallon).
For the purpose of open access, the authors have applied a Creative Commons Attribution (CC BY) license to any Accepted Manuscript version arising.
Abstract
We present LiSTA (LiDAR Spatio-Temporal Analysis), a system to detect probabilistic object-level change over time using multi-mission SLAM. Many applications require such a system, including construction, robotic navigation, long-term autonomy, and environmental monitoring. We focus on the semi-static scenario where objects are added, subtracted, or changed in position over weeks or months. Our system combines multi-mission LiDAR SLAM, volumetric differencing, object instance description, and correspondence grouping using learned descriptors to keep track of an open set of objects. Object correspondences between missions are determined by clustering the object’s learned descriptors. We demonstrate our approach using datasets collected in a simulated environment and a real-world dataset captured using a LiDAR system mounted on a quadruped robot monitoring an industrial facility containing static, semi-static, and dynamic objects. Our method demonstrates superior performance in detecting changes in semi-static environments compared to existing methods.
I Introduction
Change detection is an important capability for autonomous robots doing environmental monitoring, infrastructure management, and disaster response. LiDAR and cameras are used when monitoring and assessing structural changes and damages to buildings, roads, bridges, and infrastructure, ensuring maintenance and safety [1, 2, 3]. In addition, the use of 3D imaging has the potential to enhance the effectiveness and surpass some of the restrictions of conventional 2D image-based change detection [4]. Camera images capture fine visual detail which enable corrosion detection and instrument reading [5], while LiDAR is complementary by accurately detecting any physical changes.
The DARPA Subterranean Challenge demonstrated that 3D mapping systems are now highly accurate and increasingly mature [6]. Acquiring large, long-term mapping datasets is becoming increasingly feasible, however to automate change detection one must consider the noisy and incomplete observations from mobile robot surveys of a facility. Beyond the process of detecting change, it is advantageous to identify which objects have moved, and to where, providing valuable information for the surveyor.
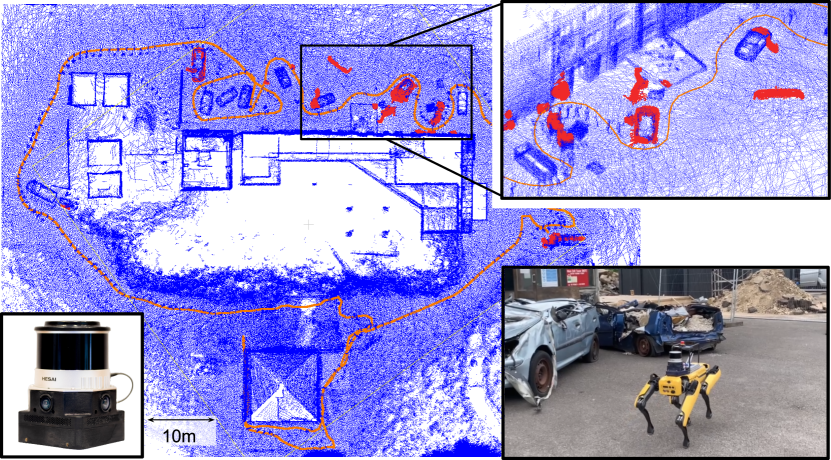
In this work, we present a novel LiDAR-based change detection framework that estimates object correspondences using a learning-based object descriptor. Our method uses octrees to represent the environment volumetrically. By differencing octrees from different robot missions, we can identify clusters corresponding to changes in the environment. To demonstrate the potential for real-world applications, we collected datasets with an autonomous Boston Dynamics Spot robot patrolling an industrial environment, see Fig. 1. We also quantitatively evaluated the approach on simulated datasets.
Our approach works without the need for pre-training on a set of specific objects. This is particularly important when operating in cluttered industrial environments containing unusual plant equipment, atypical to pre-trained model classes. The key contributions are:
-
•
A holistic approach to LiDAR object-level change detection, combining multi-mission SLAM, advanced data representation, segmentation, and deep learning techniques.
-
•
A change detection algorithm that allows us to segment and classify discrete objects that are repositioned between multiple missions, without requiring pre-training on a closed set of objects.
-
•
A correspondence grouping method and a confidence metric that offers a solution to quantify uncertainty when classifying the changed objects.
-
•
The multi-mission simulated LiDAR change detection dataset111https://ori.ox.ac.uk/labs/drs/datasets-drs/ used in our evaluations, which could be useful to others researching object-level change detection.
II Related Work
II-A Change Detection
Generally, the two approaches taken to detect changes at the object-level are direct model comparison and classification-based comparison [7]. Direct comparison detects changes directly from the raw multi-temporal data, while classification-based comparison classifies objects and subsequently tracks their movements. Classification-based methods that use learning, such as HGI-CD [8] can achieve remarkable performance, although one significant limitation is the challenge of class imbalance; this can lead to a bias towards a majority class and poor performance in minority classes. Our method can overcome the class imbalance problem by introducing a confidence metric for label-less classification, as well as the ability to generalize without pre-training on specific object categories.
Methods carrying out direct comparison, such as Saarinen et al. [9], use an occupancy grid with the assumption that each voxel is an independent Markov chain, while Andreasson et al. [10] used a 3D version of the Normal Distribution Transform (NDT) to detect not only geometric but also RGB variations between a reference mission and a new observation. Fehr et al. [11] used RGB-D cameras for TSDF generation, and performed unsupervised object discovery. Although RGB-D cameras are low cost, they have limited depth perception at long ranges and are sensitive to lighting conditions [12], making them less useful for our application; these issues are not present in LiDAR. LiSTA acts by performing unsupervised classification of changed objects, determined directly from raw data. We offer a robust solution for accurate change detection, even when the changed objects are atypical, such as those in a cluttered industrial environments.
II-B Correspondence Grouping
Traditionally, object classification or correspondence grouping methods use a pre-trained neural network, trained on a library of known and labeled objects [13, 14, 15], however, these often don’t generalize to other domains. Since point cloud annotation is time-consuming and laborious, these pre-trained model datasets are often severely constrained in data size and data diversity. In realistic situation we often find objects which are atypical to training datasets, causing erroneous classification and labeling, for example, labeling data to classify all the objects found in a nuclear facility would be labour intensive and impractical. We perform 3D object recognition through correspondence grouping, in order to cluster the set of point-to-point correspondences obtained after a 3D descriptor matching stage into model instances that are present in the current scene. Both data-driven and metric-driven approaches are explored. Metric-driven methods, such as RIFT (Rotation-Invariant Feature Transform) [16] or SHOT (Signature of Histograms of OrienTations) [17], calculate 3D feature descriptors for downsampled point cloud objects and match them against a database of object descriptors, generating a list of instance to instance correspondences without the requirement of a neural network with labeled training data.
RIFT is a descriptor designed to be invariant to the rotation of the object, and operates by partitioning a local region around each point of interest into multiple concentric rings and quantizing the point distribution within these rings. The resulting histogram encodes information about the spatial distribution of points, which makes it robust to changes in viewpoint. Whereas SHOT encodes the geometric properties of a point by computing a histogram of surface normal orientations within its local neighborhood. However, these traditional surface geometry point cloud descriptors have limitations in terms of computational efficiency and the ability to capture complex patterns. Furthermore, when matching objects in a large database, efficiently comparing the RIFT or SHOT descriptors can become a bottleneck, especially for dense point clouds.
In contrast, learning-based descriptors, such as PointNet [18], can adapt to the complexity of the data. They learn discriminative features directly from the point cloud data, making them effective at capturing intricate patterns, which can be challenging for traditional descriptors. However, learning-based methods struggle to run in real time for mobile robotic applications. Our previous work InstaLoc [19], can localize an individual LiDAR scan within a prior map by matching object instances in the query scan with those in the map. It uses a fast and efficient descriptor network to describe each object. In this work, we adapt the descriptor network to learn the objects’ 3D features and group similar objects into a cluster. Details are discussed in Sec III-C.
III Method
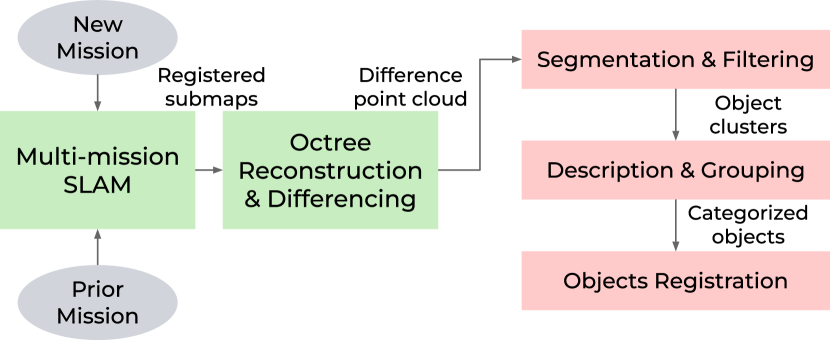
The system overview is presented in Fig. 2. It first uses multi-mission pose-graph LiDAR simultaneous localization and mapping (SLAM) to create co-registered point cloud maps. Octrees are then produced and differenced to determine occupancy probabilities. Voxels containing change are projected back into raw point clouds. Discrete objects are then segmented, and finally correspondences are established between the discovered objects.
III-A 3D Reconstruction
III-A1 Multi-Mission Point Cloud SLAM
Our approach begins with the acquisition of multiple SLAM maps using our VILENS SLAM system [24] (which won the 2021 Hilti SLAM Challenge), this system uses LiDAR inertial odometry as a basis and a pose-graph optimization based on iSAM2 [25] with intra-mission loop closures detected during operation. Point clouds obtained in the different missions need to be aligned in a common reference frame to facilitate direct comparison. To ensure map consistency we do not directly register the global point cloud maps output by each SLAM mission as that would result in erroneous change being detected (see an example in Sec. IV-B2). Instead we first jointly align the multi-mission pose-graphs.
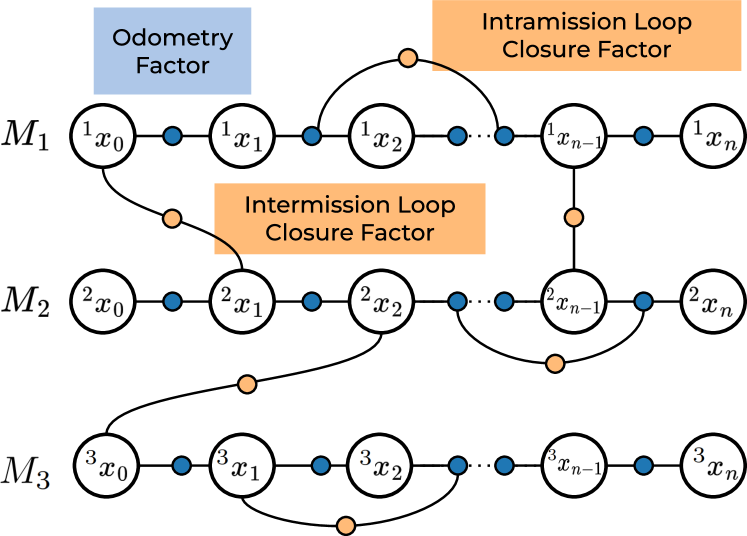
To do this we employ multi-mission pose-graph SLAM as illustrated in Fig 3. First, candidates for intermission loop closure are proposed by matching ScanContext [26] descriptors between the individual LiDAR scans from each mission with each loop closure candidate then refining using iterative closest point (ICP) registration to form the factor. The missions can then be jointly optimized when loop closure constraints are identified between them. Finally, the combined pose-graph is optimized to obtain the final trajectory for the missions in a common coordinate frame. This assumes that the individual missions overlap with at least one other mission.
This approach allows the creation of a unified “4-D” map that represents the entire environment explored by the robot across the different missions, and enables direct change detection by comparing the point cloud map between different missions in the same reference frame. This method of registration is also robust to geometric change intermission as loop closures are inherently local.
III-A2 Octree Reconstruction and Differencing
The registered local maps were then used to generate an octree, allowing efficient and accurate volumetric differencing. The octree data structure, from OctoMap [27], was chosen for change detection because it can finely represent occupied and unoccupied 3D space through ray casting from the sensor to observed points, distinguishing between unobserved and unoccupied areas.
The resolution of the octree was chosen to be to match the cloud density produced by our Hesai XT32 LiDAR and is consistent with other works, Tab. I.
To identify the differences between the octrees, we iterated through the overlapping octree nodes and compared the occupancy probabilities of the corresponding voxels. To distinguish changed from static elements, we set an occupancy threshold of . Voxels with occupancy probabilities exceeding this threshold were considered changed, indicating areas where changes had occurred between missions. Conversely, voxels with occupancy probability difference below the threshold were classified as static, representing parts of the environment that remained unchanged.
III-B Segmentation and Filtering
The octree was then projected back onto the mission’s point cloud map to give a difference point cloud at the resolution of the original points. This process includes extracting the region of interest with a box filter and implementing a ground filter using RANSAC to remove ground points. We also smoothed the point cloud surfaces using Moving Least Squares (MLS) smoothing [28]. Sensor noise in the object point clouds is filtered through erosion dilation to give a more accurate representation of the object point cloud. We then used Euclidean clustering to group points into distinct clusters, each potentially representing an object. To refine the clusters, we used region growing with normal estimation, allowing us to handle overlapping objects efficiently, as in [11]. To better manage object overlap, we developed a custom method that can either merge or separate clusters based on their overlap ratio. This helps alleviate a common issue in direct model comparison, specifically, overlapping changes.
These discrete object point clouds were then passed to an instance descriptor neural network.
III-C Instance Descriptor Generation
For feature description, we used a neural network for object instance description which generates a SE(3) invariant descriptor for correspondence queries based on the method described in our previous work, InstaLoc [19]. The descriptor network can generate object-level descriptors and can handle variations due to different viewpoints and partial observations. It employed a deep neural network to infer directly on 3D point cloud data using sparse tensors and spatially sparse convolutions for efficiency. In comparison, we saw that RIFT and SHOT descriptors did not scale well to large databases of objects due to their computational complexity, making the task of exhaustive comparison and matching objects in such databases resource intensive and time consuming.
We adapt the InstaLoc descriptor network to determine object-level correspondences in multi-temporal data. We train the descriptor neural network on a large set of labeled point clouds, enabling it to generalize and perform well on unseen data. This is particularly useful for long-term autonomy in cluttered environments, as the robot can encounter unlabelled objects and still recognize them as changed, without the need for retraining. This is a significant advantage over traditional supervised methods that experience a domain gap and applications in one location does not transfer well to another.
III-D Instance Grouping
To determine the object correspondences between missions, the descriptors are clustered. This was achieved by performing K-means clustering while automatically determining the most suitable number of clusters based on the elbow method, using Within Cluster Sum of Squares (WCSS) [29].
Each cluster has a confidence level based on the density of the cluster. Let be sets of feature descriptors, each representing a cluster, where contains feature descriptors, and each is an -dimensional feature descriptor.
For each cluster , the centroid is given by:
| (1) |
The average distance of each descriptor in the cluster to its centroid is calculated as:
| (2) |
Where represents the -norm (Euclidean norm), and is the number of dimensions of the data point and centroid , in our case .
The confidence metric for each cluster is then given by the min-max normalized distance, given by:
| (3) |
Where is the minimum average distance among all clusters, and is the maximum average distance among all clusters.
Thus, for each cluster , cluster lies in the range , with indicating maximum compactness (all points close to the centroid) and indicating minimum compactness (high dispersion of points from the centroid).
III-D1 Correspondence Confidence
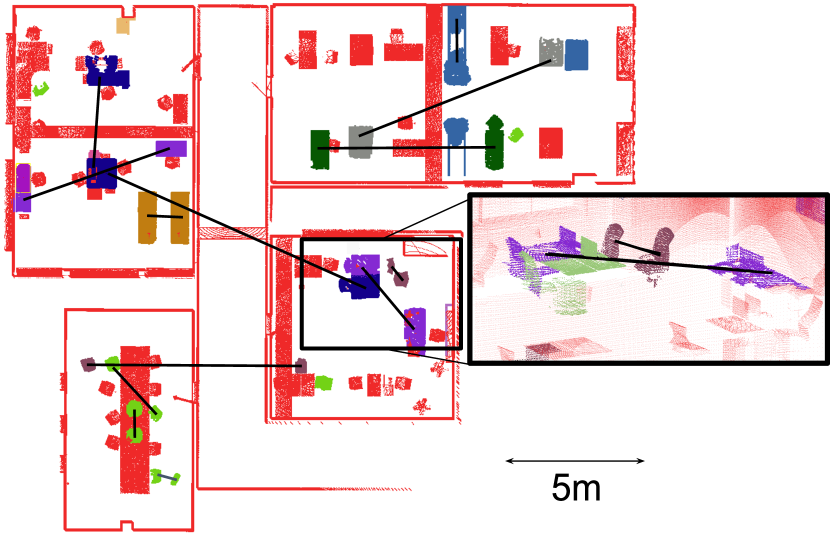
The next step is to determine the correspondences between objects intermission. If there are more than two instances of an object in the same class, exact intermission correspondences can only be estimated, so, we utilize a synthetic confidence metric for each object, a quantifiable measure to determine the normalized Euclidean distance between a data point and the centroid of its assigned cluster . This ensures that data points closer to the centroid receive higher confidence scores, indicating a stronger alignment with the class. Then, classifications can be reported for the objects with confidence scores, as shown in the match matrix. Our synthetic confidence metric normalizes the confidence metric for each cluster based on the range of average distances across all clusters. Normalization allows for a consistent and comparable confidence metric across different clusters, even if they have different scales of average distances. The correspondences are then determined by minimizing the weighted normalized physical and descriptor distances, , as shown in Eq. 4, where is the distance in physical space, is the distance in descriptor space. The weights are and , respectively, and are user specifiable, such that if the space in which change is detected is small, and it is known that objects will not move far, then the physical distance can be up-weighted, and vice versa.
| (4) |
An odd number of objects in a class implies additive or subtractive change, and so the object instance with the greatest weighted distance to other objects does not have a correspondence.
III-D2 Changed Object Registration
For each point cloud representing a changed model instance in the scene, the correspondence grouping identifies the 6DOF pose estimation between the prior model and the instance of the model in the current scene. To determine the transformation between the corresponding objects, rigid point cloud registration technique was used. The translation is found by assuming the matched objects have the same centroid, and singular value decomposition (SVD) on the covariance matrix is used to recover the orientation [30].
IV Experimental Results
In this section, we present results and analysis from both simulated (Fig. 6) and real LiDAR mapping experiments (Fig. 1). With the simulated LiDAR, every point is paired with its ground truth object label. We use this later to measure change detection performance. The real-world experiment was conducted in Fire Service College (FSC), an outdoor training ground for firefighters. Our results demonstrate the system working robustly in both indoor and outdoor environments.
IV-A Experiment with Simulated LiDAR Scans
IV-A1 Overview
Using Unreal Engine 4 and AirSim [31], we generated three simulated LiDAR datasets in an office scene to quantitatively evaluate our change detection methods. This allowed us to determine metrics using the simulator ground truth (GT). The top-down orthographic projection of one of the office scenes is shown in Fig. 6(a) , the ground and ceiling are filtered out for visualization purposes. To demonstrate our method can work on different LiDAR configurations, we generated scans with the characteristics of the Ouster OS0-128 LiDAR which has a field of view of 90 degrees and moved around following a route similar to an inspection mission. Each dataset consists of two missions, and the change detected between them was evaluated at a per-point level.
| Exp. | Precision | Recall | Specificity | F-Score | IoU |
|---|---|---|---|---|---|
IV-A2 Change Detection
We evaluated precision, recall, and specificity to understand the performance of the change detection algorithm. The results are shown in Tab. II. On average across three datasets, we achieve a precision of and a recall of . Note that these metrics are partly dependent on the consistency of the raw observations intermission. Exp. 3 exhibited lower recall value due to many overlapping object changes intermission, causing incomplete segmentation. Whereas Exp. 2 had fewer overlapping changed objects.
IV-B Experiment with Real World LiDAR Scans
IV-B1 Overview
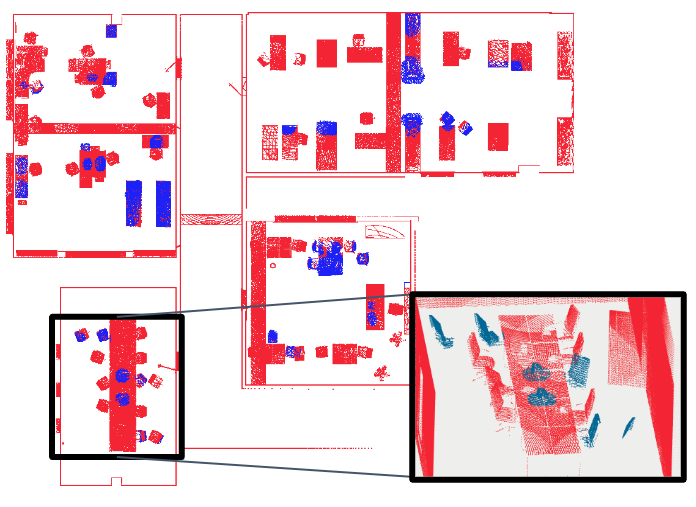
As shown in Fig. 1, our system is intended to be used by a Boston Dynamics Spot robot performing routine inspections in an industrial facility. The sensor payload comprises a 3D LiDAR, multiple cameras, and a self-contained IMU, as shown in Fig. 1. In particular, we use the Hesai PandarXT-32 LiDAR. Real world data was collected using this platform at the Fire Service College (FSC), where there were a variety of atypical objects, e.g. crates of furniture and wood. Multiple missions were executed where the robot autonomously followed a predefined path. Typically, the trajectory executed by the robot fell within of the desired trajectory, making the experiments highly repeatable.
IV-B2 Change Detection
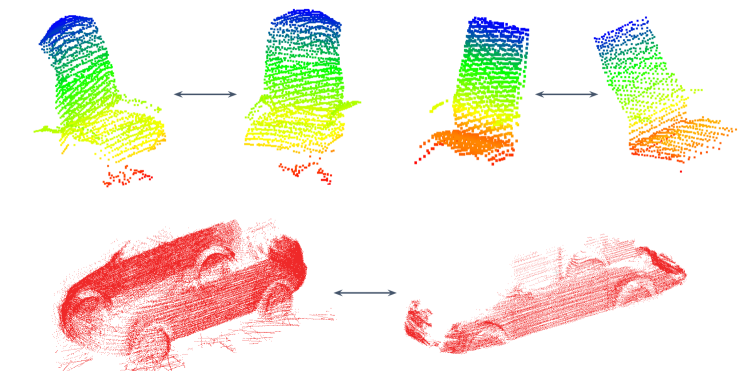
Two of the missions registered using multi-mission pose-graph optimization are shown in Fig. 1, showing that the multi-mission SLAM makes the system robust to subtle inaccuracies within the point cloud maps. The changed objects identified from the prior mission are highlighted in red. A further example of a changed object is shown at the bottom of Fig. 4. Our approach retains the capability to establish correspondences for partially observed objects, demonstrating the robustness of both the descriptor and the classifier.
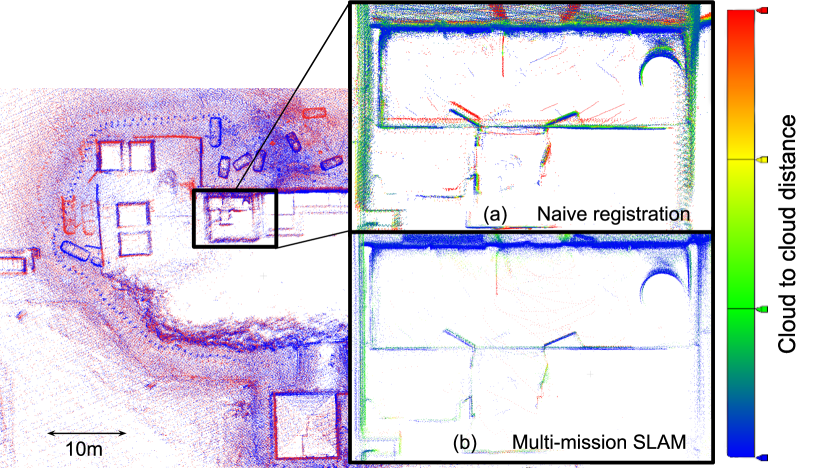
Alternatively, if the missions had been registered using ICP on the full global maps from each mission, some of the points would not be well aligned due to imprecision in the SLAM. As a direct comparison, we used ICP to register two global maps from two FSC missions, shown in Fig. 5. As shown in Fig. 5 (a) and (b), this misregistration can then cause erroneous change detection. Furthermore, the sensor origin is also needed to produce correct representation of free space using octrees.
IV-B3 Instance Grouping
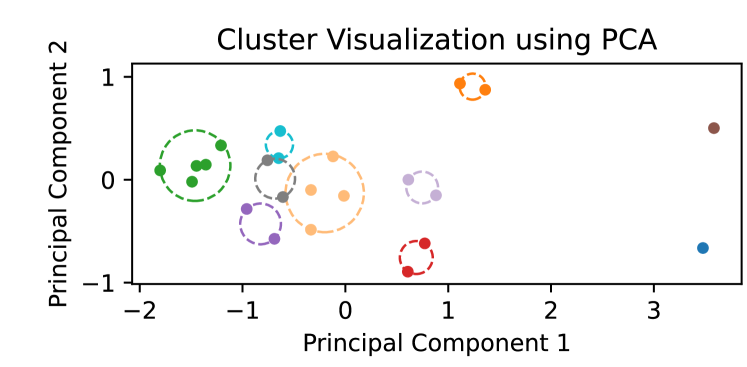
The classified object feature descriptors are shown in Fig. 7, with Principal Component Analysis (PCA) used for dimensionality reduction (from 16) for ease of presentation. This is presented to show that our clustering algorithm can effectively group the high dimensional point cloud descriptors.
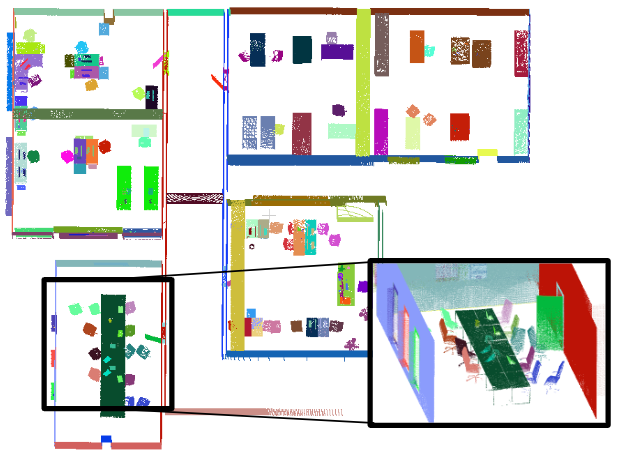
Fig. 4 shows instances of one of the changed objects, after classification of learned descriptors.
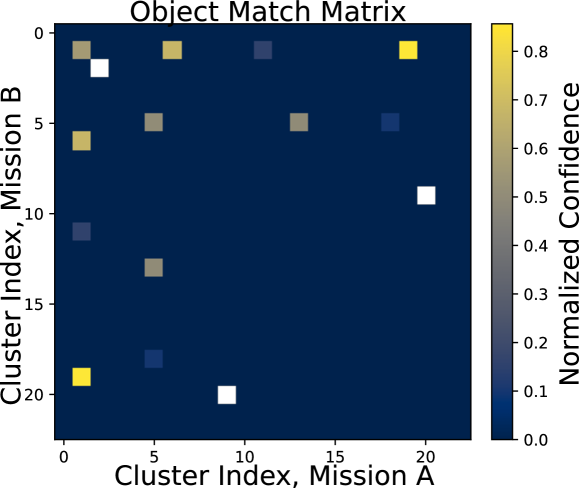
In particular, this figure illustrates that incomplete observations do not affect the performance of the classifier. The match matrix for classified objects is shown in Fig. 8, where the colormap corresponds to the confidence of the classification, based on the descriptor cluster density. In this figure, all potential matches are shown for each object within the class.
As a comparison, we ran SHOT and RIFT descriptors on objects after down-sampling point clouds to . Their matching performance is poor as SHOT and RIFT are per-point descriptors, which means that we need to find per-point correspondences for each object to determine if two objects are similar. As importantly, it took for SHOT and for RIFT for each object. In contrast, our descriptor network is much faster, taking only about for each object.
IV-C Implementation Details
These experiments were performed on a system with Intel Core i7-10875H CPU @ 2.30GHz 16 cores, 32GB RAM. For the simulated LiDAR office scene Exp. 1, the octree reconstruction and differencing took , segmentation and filtering , and instance description, grouping and objects registration .
It took between 10 and for the Spot robot to execute each FSC mission, which was in length. For the FSC experiments octree reconstruction and differencing took , segmentation and filtering , and instance description, grouping and object registration .
IV-D Challenges/Assumptions
-
1.
Objects are assumed to be rigid, non-deformable, and spatially coherent – assuming that nearby points belong to the same distinct object.
-
2.
If multiple instances of the same object class are moved between missions, identical objects could be confused. The estimated correspondences are determined by maximising the confidence in the descriptor clustering.
-
3.
We assume that the environment is sufficiently consistent that the SLAM missions can be registered according to the method described in Sec. III-A1
-
4.
Objects which move by less than the size of the object present a challenge for change detection algorithms as part of the physical space is still overlapping. This causes pairwise cloud differencing to fail and to merge clouds. This merging forms larger composite segments, concealing complete changes at the object level.
V Conclusion
In this paper, we proposed LiSTA, an object-level LiDAR change detection approach. LiSTA can be used to determine the semi-static changes between successive SLAM missions, and report the correspondences between the changed objects intermission. LiSTA can determine correspondences without requiring pre-training on a dataset of known objects. Our method provides effective segmentation and object extraction capabilities from point cloud data. In future, we aim to use color/visual information to further improve segmentation and correspondence grouping. Lastly, we aim to implement octree submapping to allow for scalability to very large scenes and real-time operation - enabling our quadruped’s autonomy system to re-plan its missions online when change is identified.
VI Acknowledgment
We acknowledge Ren Komatsu (University of Tokyo) for his contribution in the early stages of this project and Tobit Flatscher for his help with the real-world experiments.
References
- [1] H. Chen and Z. Shi, “A spatial-temporal attention-based method and a new dataset for remote sensing image change detection,” Remote. Sens., vol. 12, no. 10, p. 1662, 2020.
- [2] L. Wellhausen, R. Dubé, A. Gawel, R. Siegwart, and C. Cadena, “Reliable real-time change detection and mapping for 3d lidars,” in IEEE Intl. Symposium on Safety, Security and Rescue Robotics, pp. 81–87, 2017.
- [3] D. Marinelli, C. Paris, and L. Bruzzone, “A novel approach to 3-d change detection in multitemporal lidar data acquired in forest areas,” IEEE Trans. Geosci. Remote. Sens., vol. 56, no. 6, pp. 3030–3046, 2018.
- [4] Q. Rongjun, T. Jiaojiao, and P. Reinartz, “3D change detection – approaches and applications,” ISPRS J. of Photogrammetry and Remote Sensing (P&RS), vol. 122, pp. 41–56, 2016.
- [5] J. Huang, J. Wang, Y. Tan, D. Wu, and Y. Cao, “An automatic analog instrument reading system using computer vision and inspection robot,” IEEE Trans. Instrum. Meas., vol. 69, no. 9, pp. 6322–6335, 2020.
- [6] T. H. Chung, V. Orekhov, and A. Maio, “Into the Robotic Depths: Analysis and Insights from the DARPA Subterranean Challenge,” Annual Review of Control, Robotics, and Autonomous Systems, vol. 6, pp. 477–502, 5 2023.
- [7] A. Singh, “Digital change detection techniques using remotely-sensed data,” Intl. J. of Remote Sensing, vol. 10, no. 6, pp. 989–1003, 1989.
- [8] T. Ku, S. Galanakis, B. Boom, R. C. Veltkamp, D. Bangera, S. Gangisetty, N. Stagakis, G. Arvanitis, and K. Moustakas, “SHREC 2021: 3D point cloud change detection for street scenes,” Comput. Graph., vol. 99, pp. 192–200, 2021.
- [9] J. Saarinen, H. Andreasson, and A. J. Lilienthal, “Independent markov chain occupancy grid maps for representation of dynamic environment,” in IEEE/RSJ Intl. Conf. on Intelligent Robots and Systems (IROS), pp. 3489–3495, 2012.
- [10] H. Andreasson, M. Magnusson, and A. J. Lilienthal, “Has something changed here? autonomous difference detection for security patrol robots,” in IEEE/RSJ Intl. Conf. on Intelligent Robots and Systems (IROS), pp. 3429–3435, 2007.
- [11] M. Fehr, F. Furrer, I. Dryanovski, J. Sturm, I. Gilitschenski, R. Siegwart, and C. Cadena, “TSDF-based Change Detection for Consistent Long-Term Dense Reconstruction and Dynamic Object Discovery,” in IEEE Intl. Conf. on Robotics and Automation (ICRA), 2017.
- [12] C. Debeunne and D. Vivet, “A review of visual-lidar fusion based simultaneous localization and mapping,” MDPI J. of Sensors, vol. 20, no. 7, p. 2068, 2020.
- [13] K. Alhamzi, M. M. Elmogy, and S. I. Barakat, “3D object recognition based on local and global features using point cloud library,” Intl. J. of Advancements in Computing Technology, vol. 7, pp. 43–54, 2015.
- [14] J. Mingyang, W. Yiran, and L. Cewu, “PointSIFT: A SIFT-like network module for 3D point cloud semantic segmentation,” ArXiv, vol. abs/1807.00652, 2018.
- [15] F. Zhang, J. Fang, B. W. Wah, and P. H. S. Torr, “Deep FusionNet for point cloud semantic segmentation,” in Eur. Conf. on Computer Vision (ECCV), vol. 12369, pp. 644–663, 2020.
- [16] G. Arbeiter, S. Fuchs, R. Bormann, J. Fischer, and A. Verl, “Evaluation of 3D feature descriptors for classification of surface geometries in point clouds,” in IEEE/RSJ Intl. Conf. on Intelligent Robots and Systems (IROS), pp. 1644–1650, 2012.
- [17] A. Aldoma, Z. C. Marton, F. Tombari, W. Wohlkinger, C. Potthast, B. Zeisl, R. Rusu, S. Gedikli, and M. Vincze, “Tutorial: Point cloud library: Three-dimensional object recognition and 6 DOF pose estimation,” IEEE Robotics and Automation Magazine, vol. 19, no. 3, pp. 80–91, 2012.
- [18] C. R. Qi, H. Su, K. Mo, and L. J. Guibas, “PointNet: Deep learning on point sets for 3D classification and segmentation,” in IEEE Int. Conf. Computer Vision and Pattern Recognition (CVPR), pp. 77–85, 2017.
- [19] L. Zhang, S. Tejaswi Digumarti, G. Tinchev, and M. Fallon, “InstaLoc: One-shot Global Lidar Localisation in Indoor Environments through Instance Learning,” in Robotics: Science and Systems (RSS), 2023.
- [20] B. O. Arnesen, S. S. Sandøy, I. Schjølberg, J. A. Alfredsen, and I. B. Utne, “OctoMap: A probabilistic, flexible, and compact 3D map representation for robotic systems,” in IEEE Intl. Conf. on Robotics and Automation (ICRA), 2010.
- [21] Y. Wang, M. Ramezani, and M. Fallon, “Actively mapping industrial Structures with information gain-based planning on a quadruped robot,” in IEEE Intl. Conf. on Robotics and Automation (ICRA), pp. 8609–8615, 5 2020.
- [22] V. Reijgwart, A. Millane, H. Oleynikova, R. Siegwart, C. Cadena, and J. Nieto, “Voxgraph: Globally Consistent, Volumetric Mapping using Signed Distance Function Submaps,” IEEE Robot. Autom. Lett. (RA-L), vol. 5, pp. 227–234, 4 2020.
- [23] V. Reijgwart, C. Cadena, R. Siegwart, and L. Ott, “Efficient volumetric mapping of multi-scale environments using wavelet-based compression,” in Robotics: Science and Systems (RSS), 2023.
- [24] M. Camurri, L. Zhang, D. Wisth, and M. Fallon, “HILTI SLAM Challenge Submission: VILENS and SLAM,” tech. rep., Oxford Robotics Institute, University of Oxford, 2022.
- [25] F. Dellaert and M. Kaess, “Factor Graphs for Robot Perception,” Foundations and trends in robotics, vol. 6, pp. 1–139, 2017.
- [26] G. Kim and A. Kim, “Scan context: Egocentric spatial descriptor for place recognition within 3D point cloud map,” in IEEE/RSJ Intl. Conf. on Intelligent Robots and Systems (IROS), pp. 4802–4809, 2018.
- [27] A. Hornung, K. M. Wurm, M. Bennewitz, C. Stachniss, and W. Burgard, “OctoMap: an efficient probabilistic 3D mapping framework based on octrees,” Auton. Robots, vol. 34, no. 3, pp. 189–206, 2013.
- [28] P. Lancaster and K. Salkauskas, “Surfaces generated by moving least squares methods,” Mathematics of Computation, vol. 37, no. 155, pp. 141–158, 1981.
- [29] T. Kodinariya and P. Makwana, “Review on determining of cluster in K-means clustering,” Intl. J. of Advance Research in Computer Science and Management Studies, vol. 1, pp. 90–95, 01 2013.
- [30] S. Marden and J. Guivant, “Improving the Performance of ICP for Real-Time Applications using an Approximate Nearest Neighbour Search,” in Australasian Conference on Robotics and Automation (ACRA), 2012.
- [31] S. Shah, D. Dey, C. Lovett, and A. Kapoor, “AirSim: High-fidelity visual and physical simulation for autonomous vehicles,” in Field and Service Robotics, vol. 5, pp. 621–635, 2017.