Supervision, Funding acquisition
Conceptualization, Methodology, Software, Validation, Formal analysis, Data Curation, Investigation, Writing – original draft, Writing - Review & Editing, Visualization
Methodology, Software, Validation
Supervision, Writing - Review & Editing
Supervision, Writing - Review & Editing
Resources
Supervision, Writing - Review & Editing
1] organization=School of Information Science and Engineering, Yanshan University, city=QinHuangDao, postcode=066004, country=China
2] organization=School of Information Science and Engineering, Xinjiang University Of Science & Technology, city=Korla, postcode=841000, country=China
3] organization=School of Mechanical Engineering, Yanshan University, city=QinHuangDao, postcode=066004, country=China
4] organization=School of Computer Science and Engineering, Hunan University, city=ChangSha, postcode=410012, country=China
Dual-Granularity Medication Recommendation Based on Causal Inference
Abstract
As medical demands grow and machine learning technology advances, AI-based diagnostic and treatment systems are garnering increasing attention. Medication recommendation aims to integrate patients’ long-term health records with medical knowledge, recommending accuracy and safe medication combinations for specific conditions. However, most existing researches treat medication recommendation systems merely as variants of traditional recommendation systems, overlooking the heterogeneity between medications and diseases. To address this challenge, we propose DGMed, a framework for medication recommendation. DGMed utilizes causal inference to uncover the connections among medical entities and presents an innovative feature alignment method to tackle heterogeneity issues. Specifically, this study first applies causal inference to analyze the quantified therapeutic effects of medications on specific diseases from historical records, uncovering potential links between medical entities. Subsequently, we integrate molecular-level knowledge, aligning the embeddings of medications and diseases within the molecular space to effectively tackle their heterogeneity. Ultimately, based on relationships at the entity level, we adaptively adjust the recommendation probabilities of medication and recommend medication combinations according to the patient’s current health condition. Experimental results on a real-world dataset show that our method surpasses existing state-of-the-art baselines in four evaluation metrics, demonstrating superior performance in both accuracy and safety aspects. Compared to the sub-optimal model, our approach improved accuracy by 4.40%, reduced the risk of side effects by 6.14%, and increased time efficiency by 47.15%.
keywords:
Intelligent healthcare management\sepMedication recommendation\sepRecommender systemsWe introduce a new medication recommendation framework named DGMed.
We propose a method for feature alignment at the molecular level, addressing the heterogeneity between medications and diseases.
We introduce a bias correction method based on causal inference, correcting biases in the results recommended by embeddings matching.
DGMed achieve improvements in accuracy, safety, and time efficiency, surpassing the most advanced models in comprehensive evaluation.
1 Introduction
In recent years, the issue of imbalance between the supply and demand of medical resources has become increasingly pronounced, leading to a further deterioration of conditions for many patients due to the limitations of medical resources. As the recognition of the unprecedented pressure on the healthcare system grows, diagnostic and treatment systems based on artificial intelligence have begun to receive widespread attention.
Medication recommendation systems, as a key development direction in the field of AI-based medical technology, recommend suitable medication combinations by comprehensively analyzing a patient’s historical medical records and current health status, with the aid of a rich medical knowledge base. This approach not only provides customized treatment plans based on specific patient history data but also accelerates the treatment process faster than traditional medical methods. The medication recommendation system is one of the effective strategies to address the imbalance between the supply and demand of medical resources, playing a crucial role in enhancing the efficiency, reliability, and long-term sustainability of the healthcare system.
Medication recommendation systems share several commonalities with traditional recommender systems (RSs) [3, 23, 40]. Taking session-based recommendations [28, 5] as a representative example, these RSs reveal user preferences by analyzing the sessions from users’ past interaction records and predict items that users might be interested in future sessions, thereby providing personalized recommendations. However, despite the fact that both involve inputting multiple sets and outputting a single set, the unique complexities of the medication recommendation prevent traditional RSs algorithms from being directly applicable. There are several non-negligible challenges inherent in this area. Firstly, compared to traditional RSs, medication recommendation systems focus not only on the accuracy of the recommendations but also place significant emphasis on the widespread issue of Drug-Drug Interactions (DDI) [2, 22, 7]. Therefore, in medication recommendations, the safety of the outcomes becomes a crucial consideration. On the other hand, in the most typical category of RSs, commodity recommendations, the model often decides whether to recommend a product to a user based on the similarity between the candidate product and the user’s past purchases. In contrast, medication recommendations rely more on the patient’s current symptoms to make medication choices, with past medication records mainly serving as auxiliary information. Therefore, there is a significant difference in the emphasis on data sources between medication recommendations and traditional RSs.
Early medication recommendation systems [32, 1, 37] primarily focus on patients’ immediate health conditions, neglecting their long-term medical history. Subsequent researchers [19, 16, 51] significantly improve the accuracy of results by modelling sequences of historical medical records. More recently, with advancements in the study of DDI [24, 6], some works [45, 46] propose incorporating molecular-level knowledge into medication recommendations, playing a key role in enhancing the safety of medication recommendations. Despite significant achievements in existing researches, there remain limitations in the following aspects:
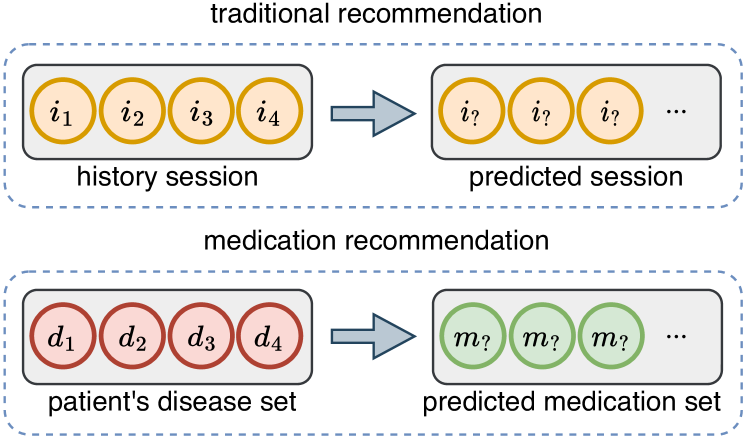
(1) Heterogeneity between diseases and medications. As shown in Figure 1, models in traditional recommendation systems generally decide whether to recommend a product to a user based on the similarity between the candidate item and items with which the user has previously interacted. In such cases, the historical items and candidate items are homogenous, thus recommendations are usually based on the similarity of embeddings. However, in the context of medication recommendations, the data source consists of diseases, while the candidates are medications, making them heterogenous. Simple similarity calculations are inappropriate when dealing with two types of heterogenous items. Previous methods often overlooked this crucial difference, leading to a failure in accurately capturing the complex relationships between medications and diseases.
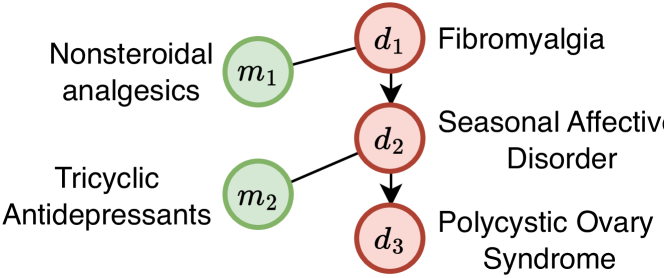
(2) Ambiguity in the relationship between diseases and medications. When there is a connection between medications and diseases, they often exhibit a high co-occurrence frequency, but a high co-occurrence rate does not directly equate to a direct connection. As illustrated in Figure 2, although every pair of disease and medication in the figure has a high co-occurrence rate, in reality, only is directly related to , and to . Since can lead to , which in turn can lead to , also shows a high co-occurrence rate with and . Therefore, some medications and diseases may have a high co-occurrence frequency without a direct connection. Previous studies, when addressing multi-disease issues, relied on co-occurrence relationships which could lead to ambiguity in the medication-disease relationship, and such errors might be amplified in feedback, affecting the accuracy and safety of the recommendations.
(3) Failure to integrate entity strategies with molecular strategies. In previous research there are two main approaches: one focuses on directly learning the representations of medication entities from data; the other emphasizes the importance of the molecular level and converts medications to the molecular level before proceeding with downstream tasks. However, existing methods tend to focus on only one method and fail to effectively integrate the overall effects of medications and the consideration of their chemical structures on diseases, which restricts the accuracy and comprehensiveness of the recommendation results.
To overcome the mentioned limitations, we develop a medication recommendation method based on feature alignment through causal inference, named DGMed. Specifically, we employ causal inference to explore the potential connections between diseases and medications, aiming to eliminate the false correlations that co-occurrence relationships may introduce. This approach enables us to more accurately determine the relationship between a patient’s disease and the corresponding medications, and based on this relationship, quantify the therapeutic effect of specific medications on specific diseases, thereby overcoming the the ambiguous relationship between diseases and medications (Limitation 2). Additionally, leveraging the relationships generated through causal inference, we develop a method that can map both diseases and medications to the molecular level, aligning their features. This approach, by utilizing a unified representation space, effectively addresses the heterogeneity issue between diseases and medications (Limitation 1). After generating the recommendation probabilities for each medication based on molecular-level features, we introduce a bias correction module based on entity relationships. This module adaptively adjusts the recommendation probabilities for each medication using the relationships at the entity level, aiming to correct the recommendation biases introduced by molecular embeddings. Through this integration of molecular and entity levels, we effectively address the issues caused by relying solely on entity-based or molecular-based methods (Limitation 3). Our implementation has been open-sourced on GitHub 111https://github.com/lixiang-222/DGMed.
In summary, the primary contributions of this paper can be summarized as follows:
-
•
We propose an innovative medication recommendation framework that addresses the challenge of heterogeneity between diseases and medications by achieving feature alignment at the molecular level.
-
•
We develop a causality-based method to uncover the deep connections between diseases and medications, effectively resolving the ambiguity in the relationship between diseases and medications when dealing with multiple diseases.
-
•
We combine knowledge at both the molecular and entity levels to introduce a bias correction method, significantly improving the accuracy of recommendation results.
-
•
We conduct extensive experiments on real-world datasets, and the results significantly outperformed existing state-of-the-art models.
Below, we provide an overview of the different sections of the text: (1) Introduction: Introduces the main innovations and the motivation behind this work. (2) Related Work: Summarizes typical studies and current trends in related fields. (3) Methods: Presents the core ideas of the model and the specific details of its implementation. (4) Experiments: Describes the experimental background, testing methods, and specific experimental results. (5) Discussion: Delves into an analysis of the experimental results and proposes a series of supportive experiments. (6) Conclusion: Summarizes the research findings and offers perspectives on future research directions.
2 Related Works
We leverage causal inference technology to uncover the latent relationships between medical entities, achieving alignment of features of various medical entities at the molecular level, thereby enhancing the model’s rationality. Simultaneously, it introduces a bias correction method based on causal effects, effectively correcting biases introduced during the embedding matching process, significantly improving the accuracy of medication recommendation results. Therefore, in this section, we will elaborate on the related work from medication recommendation, causal inference and feature alignment three perspectives.
2.1 Medication Recommendation
The field of medication recommendation has developed rapidly in recent years, with its primary objective being to provide the most suitable medication combination based on the patient’s specific condition.
Early works in medication recommendation like [49] are instance-based, prescribing on single-visit data, and viewing medication recommendation as a multi-instance and multi-label classification task. After that, studies like [8] employ sequential models to integrate longitudinal visit data. Recently, the research falls into three categories. The first category of work, exemplified by studies like [20, 52, 21], treats medication recommendation as a package, sequence, and other mature recommendation tasks, utilizing advanced algorithms to enhance model quality. The second category of work integrates techniques from other fields, such as [44, 41, 53]. They combine the task of medication recommendation with translation models, generative models, or technologies from other domains, achieving a method that transforms patient states into medication combinations. The third category of work, such as [30, 45, 46, 4], incorporates external knowledge related to medications to fill the knowledge gaps in the data, thereby achieving more accurate representations of medications.
2.2 Causal Inference in RSs
The incorporation of causal inference [10] into RSs still presents as a relatively novel concept and ongoing research directions can be broadly categorized into three main categories.
The primary objective of the first research category is to tackle data bias issues. For instance, methods such as the backdoor criterion employed by [39, 50, 38] aim to eliminate confounding factors, addressing challenges like popularity bias and exposure bias in the dataset. In the second category of work, as references [48, 42, 35], the collection of real-world data is integrated with the application of inverse probability weighting and counterfactual methodologies. This process encompasses the incorporation of counterfactual interactions that are in contradiction with empirical observations, aimed at bridging data voids or attenuating noise. Additionally, a direction that has not been extensively explored concentrates on improving the interpretability and fairness of models. Researches [34, 31, 36] present the integration of causal discovery and counterfactual reasoning within RSs to address the inherent issues of opacity associated with deep learning models.
2.3 Feature Alignment
Feature alignment is a pivotal concept in machine learning and data mining, and finds diverse applications as methodologies adapt to varied application scenarios.
In the realm of segmentation tasks like semantic and video segmentation, studies such as [15] have developed techniques for aligned feature aggregation and context modelling, enhancing feature alignment across various resolutions and contexts. Another research [14] introduced an implicit feature alignment function using coordinate-based neural networks for precise alignment, improving semantic segmentation. Additionally, [26] tackled appearance and motion feature discrepancies in unsupervised video object segmentation through feature alignment and adaptation modules. Beyond the realm of segmentation, the technique of feature alignment demonstrates noteworthy outcomes. For example, research [11] achieves alignment between visual and linguistic elements through hierarchical feature alignment, thereby enhancing the performance of downstream tasks. Similarly, study [33] tackles the challenge of identifying salient objects in complex scenarios via a hybrid feature alignment network, and [47] enhances the accuracy of image translation and manipulation through dual-level feature alignment. In the context of federated learning, [43] employs feature alignment for model optimization, showcasing the versatility and wide-ranging applicability of feature alignment methods across various disciplines.
3 Problem Definition
3.1 Medical Entity
This article introduces the concept of medical entities, defining relatively complete medical concepts in medical data as medical entities. In this study, medical entities mainly include three types: diseases, procedures, and medications. These are denoted by the symbols , , and for diseases, procedures, and medications, respectively. Additionally, it’s noteworthy that molecules are not considered part of entities.
3.2 Input and Output
The model uses Electronic Health Records (EHR) as its data source, covering a wide range of patient visits and treatment records after organization. Each patient’s record is denoted as , where the input part contains multiple visit records . Each visit record encompasses three datasets: , , and , all of which are represented using multi-hot encoding of 0s and 1s. The model’s output is denoted as , which is the predicted medication combination for the visit .
3.3 DDI Matrix
Drug-Drug interactions are particularly noteworthy in the field of medication recommendation, as they suggest that certain combinations of medications may pose serious safety risks. By timely identifying these interactions, it is possible to reduce adverse events caused by medication interactions, thereby enhancing the safety of medication therapy. Our DDI is extracted from the Adverse Event Reporting Systems [13]. We represent DDI information using a binary matrix , where indicates the presence of an interaction between and . A high frequency of DDI suggests potential safety issues in recommended results.
3.4 Causal Discovery and Inference
Causal discovery and causal inference are key to understanding the interactions between variables [12]. Causal discovery employs statistical tools and machine learning to identify potential causal relationships from data, requiring in-depth analysis and various algorithms. Causal inference, on the other hand, uses observational data to quantify the effects of these relationships, which is crucial for decision-making and policy formulation. It involves techniques like experimental controls, instrumental variables, and regression discontinuity, helping estimate the true causal effects, especially in complex data scenarios.
4 Methods
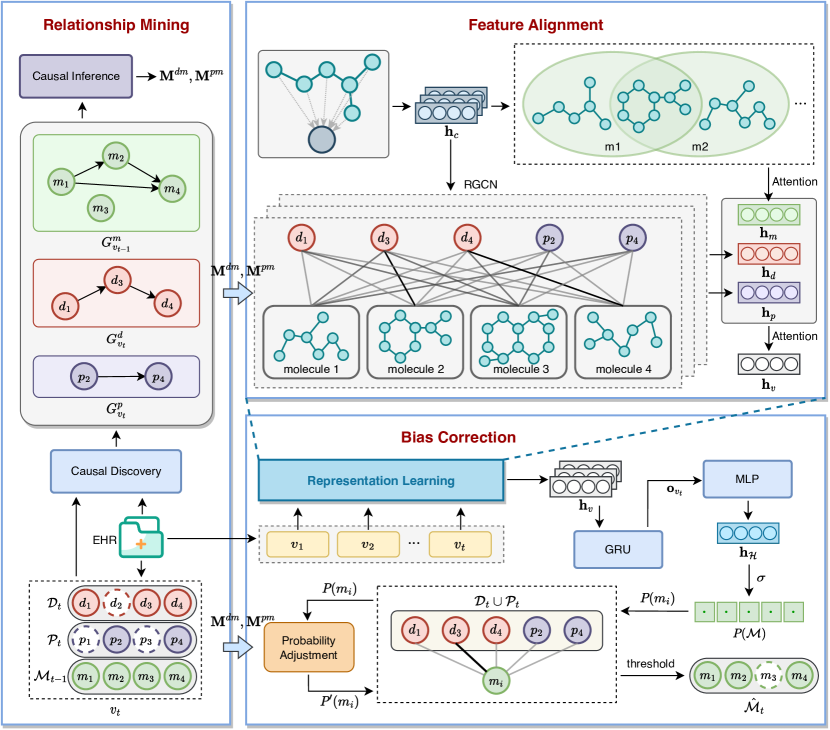
Figure 3 illustrates our model, which is comprised of four main components.
(1) In the relationship mining stage, we are dedicated to uncovering the relationships between entities based on causal theories. Utilizing causal discovery, we can construct a set of personalized pathological relationships based on the specific conditions of patients during their visits, and rank each disease or procedure according to its importance. Moreover, we establish connections between diseases or procedures and molecules based on molecular-level knowledge.
(2) In the feature alignment stage, our goal is to construct aligned representations of entities through the established relationships between molecules and entities. With these connections between molecules and entities, we map entities to the molecular level, generating representations for patients in clinical visits that include diseases, procedures, and medications. Simultaneously, based on the rank results of entities obtained in the previous stage, we conduct a more comprehensive modelling of patients’ medical visits.
(3) By modelling the sequential relationships of a patient’s historical medical visits, the information aggregation stage aims to generate a comprehensive representation of the patient and calculate the recommendation probabilities for various medications from the representation level.
(4) In the bias correction stage, we aim to rectify inaccuracies resulting from embedding matches from the perspective of entity relationships. Based on causal inference, we correct the probability bias for each medication according to the current health condition of the patient, recommending those medications that exceed a predetermined threshold.
4.1 Relationship Mining
In this phase, we aim to delve deeper into the relationships between entities. This involves two types of relationships: homogenous relationships and heterogeneous relationships. In terms of homogenous relationships, we focus on the pathological connections between diseases and procedures, as well as the interactions among medications. On the other hand, in the realm of heterogeneous relationships, we are dedicated to learning the quantified causal effects between diseases or procedures and medications. The outcomes of this module will provide an important foundation for subsequent modules.
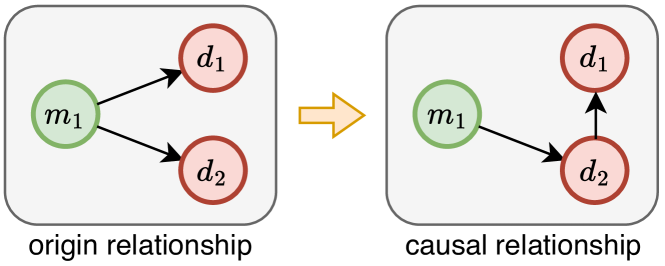
Specifically, first, based on the data distribution in the EHR, we use a causal discovery algorithm to construct a causal graph. We adopt an equivalence score criterion to generate Bayesian equivalence classes, representing the quality of causal graph learned from the data . Considering the large scale of medical data, we choose the Greedy Intervention Equivalence Search (GIES) [25] algorithm in our causal discovery module. GIES employs a greedy search method to continuously optimize Bayesian equivalence classes from the data, ultimately finding the most suitable causal graph. As illustrated in figure 4, the causal relationships generated by this method, based on the backdoor criterion for causal discovery, effectively eliminate spurious associations between medications and diseases. This serves as a foundation for further learning of the relationships between medications and diseases/procedures in subsequent tasks.
| (1) | |||
| (2) |
where represents the number of variables or nodes in the Bayesian network, denotes the -th variable (node) in the network, and stands for the parents of variable in the graph , representing the set of nodes that directly influence according to the Bayesian network’s structure. The optimizes and learns an optimized graph from the initial graph and the equivalence score .
It is important to note that in the causal graph generated by the causal discovery algorithm, a unique cyclical structure often emerges. Specifically, this refers to a closed loop between two nodes that have a reciprocal causal relationship. The occurrence of such cycles is due to the high co-occurrence rate between the two entities, leading to ambiguity in determining the direction of causality. Given that the main purpose of this module is to utilize the mined interactions between the patient’s current conditions to enhance the accuracy of the visit representation, we systematically excluded such relationships. Therefore, the causal graph is represented as a Directed Acyclic Graph (DAG).
Utilizing the aforementioned method, we construct three isomorphic session-level causal graphs , , and for , which includes the influences among various aspects of the patient’s condition, as well as the interrelationships between medications taken by the patient.
Subsequently, we propose a dynamic adaptive categorization mechanism that learns interactions between similar entities from causal graphs and integrates them into visit representations. Taking diseases as an example, based on the causal positions of entities in the session graph , we divide into four sets : (1) Causal Entity: entities capable of causing the occurrence of other diseases, acting as the root cause in the pathway, representing the primary diseases in this clinical visit. (2) Effect Entity: entities influenced by other diseases, serving as the result in the pathway, representing secondary symptoms in the visit. (3) Middle Entity: entities capable of causing the occurrence of other diseases while being influenced by other diseases, acting as intermediate nodes in the causal pathway. (4) Independent Entity: entities existing independently in this visit without a direct causal relationship with other diseases.
| (3) |
where assigns to a specific category . By executing the above steps for each entity within a single clinical visit, we ultimately complete the categorization of entities, obtaining data used to generate clinical visit features.
On the other hand, for heterogeneous relations, drawing from data distribution within the causal graph , we utilize causal inference to ascertain the causal impact of each medication on the entire range of diseases or procedures. This method serves to quantify the precise therapeutic influence of the drugs on the patient’s health status. Specifically, we represent the causal graph as a binary variable and employ a discretized Generalized Linear Model (GLM) to model the causal effect between diseases/procedures and medication. Specifically:
| (4) |
where denotes the logit link function, represents the probability of a binary variable, is the intercept, and are the corresponding coefficients. represent the model’s independent variables, including the records of diseases/procedures and medications. In this model, the probability of the binary variable indicates the likelihood of a positive response from medications to patients with identified diseases or procedures, elucidating the causal effect of a specific disease or procedure on medication. Ultimately, we obtained the causal effect matrices for dis-med and proc-med, denoted as and .
4.2 Feature Alignment
The primary goal of this phase is to align the representations of various entities in the medical system through the relationships between molecules and entities, enabling medications, diseases, and procedures to learn from each other within the same representation space.
In the real-world diagnosis and treatment process, doctors determine prescriptions based on the patient’s current condition and their historical medical records. In our model, we use the current disease and procedure to represent the current condition and regard the medication from the previous visit as the historical medical record. These combined data sources provide a comprehensive overview of the current visit, helping us to simulate the real-world medical consultation process. We initially establish embedding tables and for diseases and procedures, with each row corresponding to a specific disease or procedure. Additionally, considering the pivotal role of molecules at the principle level, we similarly construct a molecule embedding table .
| (5) |
where , , and represent specific medical entities, represents the embedding for entity , and and follow the same logic for entities and , respectively.
Subsequently, we derive the medication embeddings based on the relationships between medications and molecules. Considering that most medications are composed of multiple structures, we develop a learnable medication-molecule relationship matrix , where indicates the significance of molecule in medication . To accurately represent the characteristics of medications, an attention mechanism is employed to construct the medication embeddings based on their compositional structures.
| (6) |
where is the embedding of medication , represents learnable weights, and is the embedding of molecule . And if it is the patient’s first visit, there is no historical record. In this case, we represent the history of medication with an all-zero vector.
Based on generating and , and incorporating the relationship between medications and molecules, we can determine the relevance between molecules and the patient’s diseases and procedures. Then we adopt the stratification approach from previous research [21]. We apply an adaptive gradient stratification to all relevances, ultimately generating a layer hierarchical structure of relevance levels .
| (7) |
where refers to the layer of the molecule-disease relationship, is the number of relationships at the top layer, in denotes the gradient of stratification, and the superscript represents the power. The same formula and method are also applied to the relationship between molecules and procedures.
Following this relevance stratification, we develop a bipartite graph . In this graph, one group of nodes signifies diseases and procedures, and the other group signifies molecules. The edges within graph are divided into categories, reflecting the relevance among various entities. Utilizing Relational Graph Convolutional Networks (RGCN), we refine and update the embeddings for all molecules , as well as for the current diseases and procedures . Taking as an example, the representation of at layer is then updated on the relevance stratification using the following formula:
| (8) | |||
| (9) |
where is the weight matrix to relationship at layer , is the weight matrix to node itself, is the set of neighbouring nodes of concerning relation and is a normalization factor ensuring consistency in the influence of neighbouring nodes under different relations. is the identity matrix, is the weight update matrix for relation at layer . We similarly repeat the aforementioned process, ultimately obtaining the entity embeddings , .
Based on the entity classification information extracted from the causal graph in the previous phase, which reflects the importance of diseases, procedures, and medications in current clinical visit, we apply an attention mechanism to update the representation of each entity, aiming to enhance the expressive power of key entities. The specific formulas are as follows:
| (10) | |||
| (11) |
where self-adaptive weight is generated by attention, and are trainable weight matrix and bias term, represents the sum of embeddings of diseases within the set, and is the embedding of . We extend the same approach to procedures and medications, obtained and , which are then concatenated to the representation for the current clinical visit.
| (12) |
Finally, we pass the representation of the current clinical visit, , to the next stage for further processing.
4.3 Information Aggregation
This stage aims to aggregate the patient’s historical records and generate a representation of the patient, which is then transformed into the recommended probability of all medications.
We collectively refer to the Relationship Mining and Feature Alignment modules as ’Representation Learning’, which is shared across patients’ historical visit records to generate multiple visit embeddings . The sequence relationships are modeled using a Gated Recurrent Unit and then processed through a Multilayer Perceptron to generate the patient representation .
| (13) | |||
| (14) |
where is an intermediate variable generated by the , and we represent with a zero vector. Finally, we use a nonlinear activation function to transform the patient embeddings to the predicted probability for each medication .
| (15) |
4.4 Bias Correction
The medication recommendation probabilities generated in the previous stage are based on the embedding matches aligned at the molecular level between medications and diseases/procedures, reflecting the degree of match between the medication and the disease/procedure. However, this method of embedding matching may lead to biases in the recommendation results due to uneven data distribution. In this bias correction stage, our goal is to use causal inference methods to adjust the probability of each medication being recommended based on the more detailed quantified causal effects between different categories of entities. This aims to correct the biases caused by embedding matching, ultimately achieving a medication combination recommendation that more in line with the actual condition of the patient.
All diseases and procedures during a patient’s last visit are considered indicators of the patient’s current health condition. We use the same causal inference method as previously described to analyze the treatment effect of each medication on all diseases/procedures included in this report, generating causal effect matrices and . For any medication that has a significant therapeutic effect on a specific disease or procedure, we encourage its recommendation and increase its recommendation probability . Conversely, if the medication has a therapeutic effect lower than a certain quantified treatment effect threshold for any disease or procedure in this visit, we prefer not to recommend it and decrease its probability .
| (16) |
where and represent the adjustable magnitudes for probability modification. and are pre-established quantified effect thresholds, where is the upper threshold for the expected effect and is the lower threshold. is the adjusted recommendation probability for the medication as calculated by this method.
Ultimately, we include all medications whose predicted probabilities exceed the preset threshold in the recommended medication combination for this visit, thereby generating the final prescription result for each medication.
| (17) |
4.5 Model Training
We define the medication recommendation process as a multi-label binary classification task and employ both the binary cross-entropy loss function and the multi-label margin loss function . Additionally, we define a DDI loss , which is implemented by calculating the occurrence probability of medication pairs with potential DDI risk within the medication combination. The specific formulas for the three loss functions are as follows:
| (18) | |||
| (19) | |||
| (20) |
where represents the true value of the th medication during the current visit, while represents the model’s predicted value for the th medication, both of which are binary variables.
Even though DDI indicates potential risks associated with medication combinations, such combinations may still be utilized in clinical practice due to a range of medical considerations. Pursuing minimal DDI rate without consideration of clinical context could compromise the effectiveness of the prescription. Consequently, a threshold is established wherein the emphasis on DDI is mitigated once the model’s predicted level of DDI aligns with the observed level of DDI in actual clinical settings. During the development of the composite loss function, methodologies consistent with prior research [46] are employed to ensure a balanced consideration of each loss function.
| (21) | |||
| (22) |
where is hyperparameters, and the controllable factor is relative to DDI rate, is a DDI acceptance rate and is a correcting factor for the proportional signal.
5 Experiments
This section will provide a detailed comparative analysis of our model and the baseline models, including the experimental setup and the evaluation metrics used.
5.1 Setup Protocol
First, we will detail the specific settings of the experiment, including the configuration and parameter selection of the model, as well as the sampling method adopted during the testing phase.
5.1.1 Experimental Environment
The experiments are carried out on an Ubuntu 22.04 system equipped with 30GB of memory, 12 CPUs, and a 24GB NVIDIA RTX3090 GPU, utilizing PyTorch 2.0.0 and CUDA 11.7.
5.1.2 Configuration and Parameter
For embedding tables of , , and , the dimension is set at 64 with initialization across a uniform distribution from -0.1 to 0.1. The graph net utilizes a 2-layer GCN without hidden embeddings. The MLP comprises a linear layer with a Sigmoid activation function and a dropout rate of 0.5. The RNN employs a GRU with 64 hidden units. The probability adjustment thresholds are set with the upper limit at 0.97 of the maximum value and the lower limit at 0.90. The loss function maintains consistent hyperparameters across training, testing, and validation, with at 0.95, at 0.05, and an acceptance rate of 0.06. Training involves 20 epochs for each phase, utilizing the Adam optimizer with a learning rate of = 0.0005 and a regularization factor = 0.05.
5.1.3 Sampling Approach
5.2 Datasets
| Item | MIMIC-III | MIMIC-IV |
| # patients | 6,350 | 60,125 |
| # clinical events | 15,032 | 156,810 |
| # diseases | 1,958 | 2,000 |
| # procedures | 1,430 | 1,500 |
| # medications | 131 | 131 |
| avg. # of visits | 2.37 | 2.61 |
| avg. # of medications | 11.44 | 6.66 |
We utilize the MIMIC-III [18] and MIMIC-IV [17] datasets, which are extensively applied in the research and analysis of clinical data from the Intensive Care Unit (ICU). These datasets comprise a comprehensive collection of ICU patient clinical records, physiological monitoring data, laboratory test results, and medication records, among other information. We adopt the same data processing methodology as in previous studies, and the detailed parameters of the processed datasets are shown in Table 1.
5.3 Evaluation Metrics
We delve into the performance evaluation of our method using four principal metrics: Jaccard, DDI rate, F1, and PRAUC. Here’s an in-depth explanation of each metric and its application in our study.
Jaccard (Jaccard Similarity Score) is employed to gauge the similarity between two sets, calculated by dividing the intersection’s size by the union’s size of the sets. In medication recommendation, a higher Jaccard score indicates that the predicted prescription is more consistent with the actual medication regimen, indicating higher accuracy.
| (23) | |||
| (24) |
where represents the multi-hot vector of the predicted outcome, represents the real label, represents the evaluation result at visit , and represents the total number of visits for patient .
DDI (Drug-Drug Interaction Rate) measures the occurrence of interactions within the recommended combinations, a lower rate indicates higher safety of the medication combination.
| (25) |
where denotes the total number of visits for patient , and denote the real and predicted multi-label at the visit , denotes the entry of , is the prior DDI relation matrix and is an indicator function which returns 1 when = 1, otherwise 0.
F1 (F1-score) combines precision and recall, reflecting the model’s ability to accurately identify correct medications while ensuring comprehensive coverage.
| (26) | |||
| (27) | |||
| (28) | |||
| (29) |
where represents the total number of visits for patient .
PRAUC (Precision-Recall Area Under Curve) assesses model performance across different recall levels, indicating the ability to maintain precision with increasing recall.
| (30) | |||
| (31) |
where denotes the number of medications, is the rank in the sequence of the retrieved medications, and represents the precision at cut-of in the ordered retrieval list and denotes the change of recall from medication to . We averaged the PRAUC across all of the patient’s visits to obtain the final result,
| (32) |
where represents the total number of visits for patient .
Avg. # of Drugs (Average number of drugs) measures the average number of medications per recommendation. A higher value indicates that each recommended combination contains more medications, which may increase the complexity of the treatment plan and the risk of adverse reactions. Conversely, a lower value suggests that the medication combinations may be safer, helping to minimize unnecessary medication use as much as possible. It should be noted that this metric is for reference only and the size of a combination should not be used as a rigid criterion for evaluation.
| (33) |
where represents the total number of visits for patient and denotes the number of predicted medications in visit of patient .
5.4 Baselines
To validate our proposed model, we select the following high-performing methods as baseline models for comparison.
LR (Logistic Regression) is a linear classification algorithm that estimates the probability of an outcome belonging to a certain category by a linear combination of input features, widely used in probability prediction and data classification tasks.
ECC [29] (Ensemble of Classifier Chains) employs a series of interconnected classifiers to enhance the precision of predictions, where each classifier uses its output as the input for the next classifier. This method is specifically designed for multi-label classification tasks and can effectively improve the overall performance of the model.
RETAIN [8] is an attention-based model tailored for sequence data analysis, adept at integrating temporal dynamics and specific features for accurate disease forecasting and disease. By dynamically capturing critical clinical events of a patient’s history, RETAIN offers medication recommendations.
GAMENet [30] is a medication recommendation that integrates the strengths of graph neural networks with memory networks and effectively discerns patterns and temporal sequences within medical data, thereby enhancing the precision of its predictions.
SafeDrug [45] leverages the combination of patients’ health conditions and medication-related molecular knowledge. This approach, by reducing the impact of DDIs, can recommend safer medication combinations.
MICRON [44] focuses on customizing medication recommendation plans based on the dynamic changes in patients’ physical conditions. It does not produce new recommendations, but updates medication combinations according to patients’ new symptoms to enhance therapeutic effects while reducing potential side effects.
COGNet [41] employs the Transformer architecture for drug recommendations, using a translation approach to infer medications from illnesses. It also features a copy mechanism to integrate beneficial drugs from past prescriptions into new recommendations.
MoleRec [46] delves into the importance of specific molecular substructures in medications. This approach enhances the precision of medication recommendations by leveraging finer molecular representations.
5.5 Performance Comparison
| Model | MIMIC-III | MIMIC-IV | ||||||||
| Jaccard | DDI | F1 | PRAUC | Avg.#Med | Jaccard | DDI | F1 | PRAUC | Avg.#Med | |
| LR | 0.4924 | 0.0830 | 0.6490 | 0.7548 | 16.0489 | 0.4569 | 0.0783 | 0.6064 | 0.6613 | 8.5746 |
| ECC | 0.4856 | 0.0817 | 0.6438 | 0.7590 | 16.2578 | 0.4327 | 0.0764 | 0.6129 | 0.6530 | 8.7934 |
| RETAIN | 0.4871 | 0.0879 | 0.6473 | 0.7600 | 19.4222 | 0.4234 | 0.0936 | 0.5785 | 0.6801 | 10.9576 |
| LEAP | 0.4526 | 0.0762 | 0.6147 | 0.6555 | 18.6240 | 0.4254 | 0.0688 | 0.5794 | 0.6059 | 11.3606 |
| GAMENet | 0.4994 | 0.0890 | 0.6560 | 0.7656 | 27.7703 | 0.4565 | 0.0898 | 0.6103 | 0.6829 | 18.5895 |
| SafeDrug | 0.5154 | 0.0655 | 0.6722 | 0.7627 | 19.4111 | 0.4487 | 0.0604 | 0.6014 | 0.6948 | 13.6943 |
| MICRON | 0.5219 | 0.0727 | 0.6761 | 0.7489 | 19.2505 | 0.4640 | 0.0691 | 0.6167 | 0.6919 | 12.7701 |
| COGNet | 0.5312 | 0.0839 | 0.6744 | 0.7708 | 27.6335 | 0.4775 | 0.0911 | 0.6233 | 0.6524 | 18.7235 |
| MoleRec | 0.5293 | 0.0726 | 0.6834 | 0.7746 | 22.0125 | 0.4744 | 0.0722 | 0.6262 | 0.7124 | 13.4806 |
| DGMed | 0.5526 | 0.0684 | 0.7033 | 0.7955 | 22.4693 | 0.4912 | 0.0635 | 0.6419 | 0.7324 | 14.8019 |
In this section, we compare our model with baseline models, with a focus on safety and accuracy from various perspectives. For baselines with accessible test files, we directly evaluate them using the test files they provided. For those without available test files, we retrain and test them using the best settings described in their respective studies. Table 2 details the results of this comparison.
Based on traditional machine learning, LR and ECC perform slightly poorly in terms of accuracy and, despite prescribing fewer medications, still struggle with a higher DDI rate. Meanwhile, sequence-based models like LEAP, which incorporate advanced deep learning methods, can not surpass traditional methods in effectiveness, indicating potential limitations of generative models in this task. RETAIN introduces sequence models in medication recommendation but overlooks the relationships between medications, leading to an increase in the DDI rate.
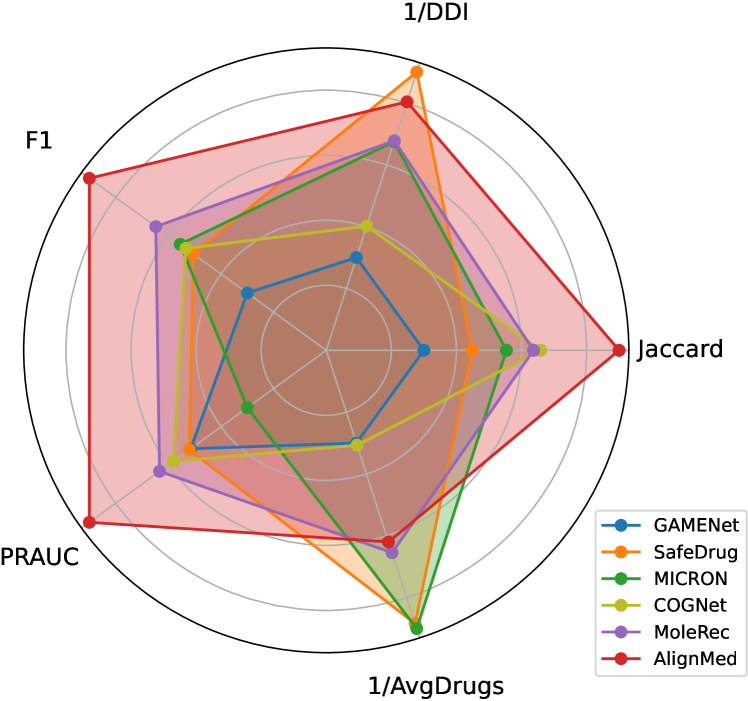
Given the growing interest in medication recommendation systems, significant progress has been made in this field in recent years. Therefore, we conduct a more comprehensive comparison and discussion of excellent experiments in recent years. To compare experimental results more intuitively, we integrate all evaluation metrics from the experiments into a single figure. It is important to note that there are substantial differences in the timing across different models, which makes discerning more granular differences within the same figure challenging so that efficiency metrics are not included in the figure. Among the five indicators, Jaccard, F1-score, and PRAUC are for accuracy testing, while DDI and Avg. # of Drugs are for safety testing. We unify scores on multiple indicators and standardize them to a range between 30% and 90%, as shown in Figure 5. Given that lower DDI and Avg. # of Drugs values imply enhanced safety, their reciprocals are used for representation in Figure 5. Each edge of a different colour in the pentagon is associated with the results of a specific model. Each vertex represents the performance of a specific model on that metric, with vertices closer to the outer ring indicating superior performance on that metric.
| method | Convergence Epoch | Training Time /Epoch(s) | Total Training Time(s) | Inference Time(s) |
| GAMENet | 39 | 45.31 | 1767.09 | 19.27 |
| SafeDrug | 54 | 38.32 | 2069.28 | 20.15 |
| MICRON | 40 | 17.48 | 699.20 | 14.48 |
| COGNet | 103 | 38.85 | 4001.55 | 142.91 |
| MoleRec | 25 | 249.32 | 6233.00 | 32.10 |
| DGMed | 10 | 329.41 | 3294.10 | 21.85 |
On the other hand, these leading algorithms are primarily based on deep learning, and their model efficiency is also crucial. This paper compares and analyzes time efficiency, including the average training time per epoch, the convergence epoch, and the total training time. In addition, the time required for a single round of inference on the test set (involving about 2,000 recommendations) is also evaluated. Table 3 will present the efficiency results of all models.
GAMENet stands out by integrating patient history into its framework, which significantly boosts its accuracy over prior models. Its structure is straightforward and exhibits moderate efficiency, yet it still leaves room for improvement in reducing DDI rates. SafeDrug excels in minimizing DDI rates through a detailed analysis of molecular-level interactions. However, it falls short in fully capturing the complex relationships between medications and diseases, which could enhance its accuracy further. MICRON brings a remarkable increase in precision by adapting medication combinations in response to changes in a patient’s health status between visits. Its simplicity and the preliminary data screening process contribute to its swift training capabilities. COGNet introduces a novel translation model and duplication mechanism, achieving marked improvements in the Jaccard index. However, its reliance on small-batch training necessitates numerous iterations for optimal convergence, affecting its time efficiency. While it implements certain safety measures, its primary mechanisms may not adequately address all safety concerns. MoleRec leverages external molecular knowledge to connect molecular substructures with diseases, yielding consistent improvements in accuracy metrics without substantially impacting safety. However, its extensive network and deep message-passing approach significantly slow down its training speed compared to other models.
Our model, by applying causal inference methods, precisely captures the relationships between medical entities and achieves alignment of disease and medication features at the molecular level, effectively eliminating heterogeneity between them and enhancing the model’s rationality. Additionally, we design a bias correction method based on entity relationships to adjust the medication recommendation probabilities learned at the molecular level, thereby significantly improving the accuracy of the recommendation results. Lastly, thanks to the relative simplicity of the involved graph network structure, our model also demonstrates excellent performance in terms of efficiency.
When assessing through both individual metrics and an overall view, DGMed significantly outshines other baseline models. Utilizing MoleRec as a comparative benchmark, DGMed notably lowers safety risks by reducing the DDI rate by 6.14%, boosts accuracy metric Jaccard by 4.40%, and also cuts down on training time by 47.15%, showcasing its efficiency and effectiveness in medication recommendation.
6 Discussions
In this section, we delve into a detailed analysis of the experimental outcomes previously discussed. Additionally, we carry out a series of supplementary experiments to affirm the comprehensiveness and logic behind our approach, ensuring its robustness and the validity of its advancements in the field.
6.1 Effectiveness Analysis
The aforementioned results fully demonstrate the exceptional performance of our model in terms of effectiveness and safety. We here conduct a comprehensive analysis of the experimental outcomes.
In traditional recommendation systems, recommendations are typically based on historical interaction records to suggest similar items. However, in the domain of medication recommendation, recommendations are based on the current health conditions of patients to suggest the most suitable medications. Therefore, past research efforts are focused on traditional recommendation systems on the one hand, and on exploring methods based on other types of systems (such as translation tasks, etc.) on the other. Despite the continuous proof that traditional recommendation system methods are more suitable for the medication recommendation domain, these methods fail to fully consider the heterogeneity issue between the recommended items and the data sources.
In contrast, we adopt a causal inference-based feature alignment method, which effectively eliminates this heterogeneity by aligning the representations of medications and diseases at the molecular level. We also note that although some previous methods attempt to leverage molecular-level knowledge in training, they were not able to effectively integrate the learning outcomes based on molecules with those based on entities. Similarly, through the results based on causal inference, we propose a bias correction method, successfully combining these two types of learning outcomes. Our proposed method addresses issues overlooked by other models, significantly enhancing the rationality and overall performance of the medication recommendation system.
6.2 Efficiency Analysis
To clearly analyze the efficiency issues, we first calculate the time complexity of this work step by step: In the relationship mining module, the main task is to utilize causal discovery to unearth the relationships between various entities and quantify these relationships through causal inference, with a time complexity of , where represents the number of samples and dim represents the dimension of the features. Next, the feature alignment stage employs attention mechanisms and Graph Neural Networks (GNN) for computation. The time complexity of this stage is primarily affected by the length of the input sequence () and the dimension of the model (dim). The time complexity of the attention mechanism is , while that of the GNN is . Additionally, the computational cost of integrating embeddings through adaptive classifiers and attention mechanisms is . Therefore, the overall time complexity of the feature alignment stage can be expressed as . In the information aggregation module, the process mainly involves a combination of multiple GRU and linear layers, with the time complexity of this module related to the time steps of each GRU unit, expressed as . Finally, in the bias correction stage, the data originates from the causal inference. The main task of this stage is to evaluate and adjust probability values, with a time complexity of . Ultimately, the total complexity of the entire model is:
| (34) |
In analyzing the time consumption of models, we observe that models with higher time costs often employ complex network structures of up to 3 to 5 layers, especially in the application of GNNs. In contrast, our design graph network construction method requires fewer layers, thereby significantly reducing the time overhead. Moreover, the bias correction mechanism we propose utilizes a method based on statistical principles and rules, which greatly alleviates the computational burden.
6.3 Ablation Study
To assess the contribution and importance of specific innovative modules to the model’s performance, we develop several model variants by removing key modules for testing.
| Model | MIMIC-III | MIMIC-IV | ||||||||
| Jaccard | DDI | F1 | PRAUC | Avg.#Med | Jaccard | DDI | F1 | PRAUC | Avg.#Med | |
| DGMed A | 0.5492 | 0.0706 | 0.6992 | 0.7902 | 22.3194 | 0.4874 | 0.0673 | 0.6382 | 0.7318 | 14.8917 |
| DGMed B | 0.5336 | 0.0712 | 0.6875 | 0.7781 | 21.4640 | 0.4836 | 0.0649 | 0.6346 | 0.7244 | 14.8244 |
| DGMed A+B | 0.5357 | 0.0672 | 0.6888 | 0.7815 | 22.1939 | 0.4798 | 0.0622 | 0.6307 | 0.7209 | 14.7726 |
| DGMed | 0.5526 | 0.0684 | 0.7033 | 0.7955 | 22.4693 | 0.4912 | 0.0635 | 0.6419 | 0.7324 | 14.8019 |
DGMed A: In this model variant, we remove the feature alignment module. Consequently, this variant does not utilize entity relationships and molecular representations generated based on causal inference for feature alignment. Instead, it adopts a method similar to those in previous studies, which involves constructing and randomly initializing embedding tables for drugs and diseases separately.
DGMed B: We eliminate the bias correction module. In this version, although the features of medications and diseases are aligned at the molecular level, some recommendation errors still exist due to the embedding-based method. In this ablation version, the integration of representations learned at the molecular level with relationships at the entity level is not considered, and its recommendations are solely based on molecular representations.
DGMed A+B: We simultaneously remove both the feature alignment and bias correction modules, as these two modules are independent and can be ablated together. This ablation model does not utilize external molecular knowledge to link the relationships between medications and diseases, nor does it use causal relationships to adjust recommendation results. It solely relies on the co-occurrence relationships between medications and diseases within the dataset for making recommendations, essentially employing a traditional recommendation system approach for medication recommendation.
As shown in Table 4, ablation study results confirmed our expectations. DGMed A demonstrates that feature alignment, by matching medication and disease representations, effectively addresses entity heterogeneity issues in medication recommendations, crucial for enhancing system safety and accuracy. DGMed B indicates that the bias correction module significantly enhances the accuracy of the results. This module is capable of integrating embeddings learned from external knowledge at the molecular level with causally related information learned from extensive data at the entity level in medication recommendations. Evaluating the recommended medications from multiple dimensions ultimately improves accuracy. DGMed A+B shows that while there is a safety improvement, there is a noticeable decline in accuracy. This phenomenon indirectly reflects that in the field of medication recommendation, safety and accuracy often have a mutually restrictive relationship, and the optimal results are usually a balance between the two. Furthermore, the analysis indicates a significant synergistic effect between the feature alignment module and the bias correction module, and their combined use can further enhance the performance of model.
In summary, the modules we propose are highly rational and significantly improve the model’s performance.
6.4 Parameter Sensitivity
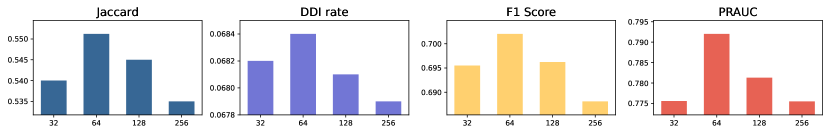
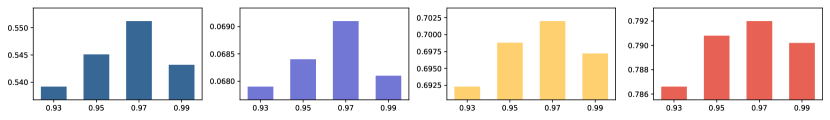
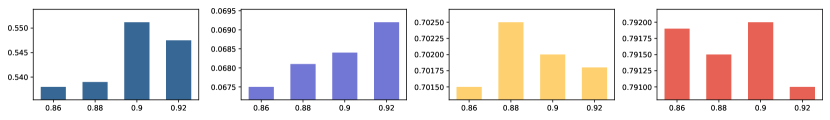
To explore the impact of specific parameters on model performance, we conduct a series of experiments on the MIMIC-III dataset focusing on five key parameters of the model. These experiments aimed to investigate the effect of different parameter combinations on the recommendation performance and to deeply analyze the reasons behind these effects. The results are presented in Figure 6, where the horizontal axis represents different values of the same parameter, and the vertical axis shows the performance differences caused by different parameter values under a specific evaluation metric.
First, this study adopts the same dimension settings for the embeddings of entities such as molecules, medications, diseases, and procedures, specifically dim=32, 64, 128, 256. Figure 6(a) displays the performance of the model under different embedding dimensions. When the embedding dimension is set to 64, the model’s accuracy significantly surpasses other dimensional settings, while its safety performance is nearly identical to that at the dimension of 128. As mentioned earlier, with the increase in embedding dimension, the model’s time cost rises at a square level. Therefore, after considering accuracy, safety, and time cost comprehensively, we select 64 as the optimal embedding dimension.
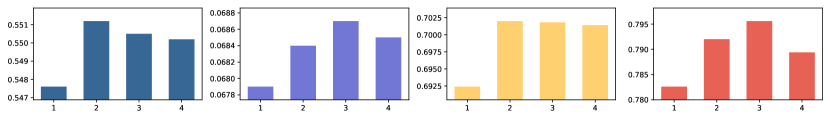
Secondly, the paper focuses on two core parameters when constructing the graph network: the number of RGCN layers and the number of node categories. The impact of the RGCN layers is illustrated in Figure 6(b), showing that the model performs extremely poorly in accuracy when the number of layers is 1. While the accuracy performance does not differ much between 2, 3, and 4 layers, lower numbers of layers bring better safety. This is because an increase in layers can lead to overfitting, causing the model to overly pursue accuracy in combinations while neglecting medication safety, potentially leading to a slightly higher DDI index. Additionally, an increase in layers significantly raises the time cost. Hence, after comprehensive consideration, we chose 2 layers as the best setting.
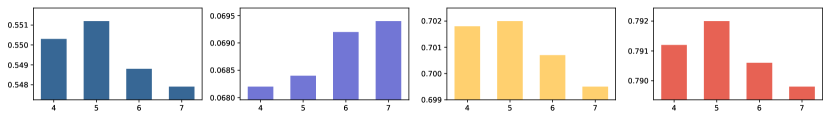
The results regarding the number of node categories are shown in Figure 6(c). Finer division leads to fewer categories, and many different relationships are classified into the same category, making it difficult to express differences between them. On the other hand, if there are too few categories, each category might lack enough samples, hindering the ability of the model to be adequately trained and capture a general representation at that level. Therefore, a sample number of 5 was chosen.
Regarding the setting of Upper and Lower thresholds, it is crucial for the function of the probability adjustment module. Figures 6(e) and 6(d) demonstrate that when the causal effect of a medication on a specific disease/procedure is below 0.90, such medication can be considered to have a low association with the disease, implying that the data correlation between the medication and disease is not directly caused by their causal relationship but may be due to co-occurrence phenomena caused by other entities slightly related to them. Conversely, when the causal effect is above 0.97, we regard it as having a direct correlation.
6.5 Case Study
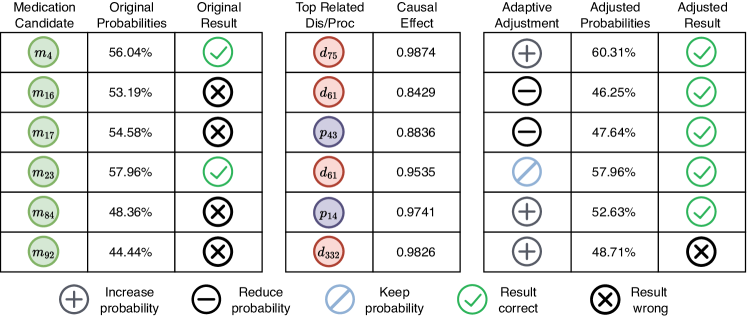
To further elucidate the operating principles of the model, we randomly select a sample from the test set of the MIMIC-III database and conduct a case study on this specific sample within the bias correction module. To make the explanation clearer, we chose a relatively simple medical record and extract a portion of the medications that are adjusted by this module for detailed illustration.
The model calculates the causal effects of all candidate medications on the patient’s current diseases/procedures, identifying those medications with relatively higher causal effects as having a more direct association with the patient’s condition for this visit. Therefore, it increases their recommendation probability to encourage their recommendation. Conversely, for those medications with relatively lower causal effects, the model considers them as not recommended for this visit or not directly related to the disease, thereby reducing their recommendation probability and discouraging their recommendation.
As shown in Figure 7, and receive higher recommendation probabilities. ’s recommendation probability increases further due to its high causal effect with . Meanwhile, , having a moderate causal effect, is not reassessed for recommendation, so the recommendation outcome for medications like and , which can already be correctly recommended, does not change due to probability adjustment. and , though recommended by the embedding-based foundational model, are correctly adjusted to lower recommendation probabilities since causal inference does not show any direct relevance to any specific diseases or procedures. In fact, and , frequently appearing in prescriptions, often show falsely high correlations with various diseases and procedures in the data, leading to their recommendation due to similar embeddings, which our probability adjustment algorithm corrects. and are medications with originally low recommendation probabilities, with being an extremely rare case of insufficient data relevance to the patient’s current disease/procedure, resulting in significant embedding differences and very low recommendation probability. Even after probability adjustment, it is not recommended, leaving this error uncorrected. However, ’s adjusted probability just exceeds the 50% output threshold, compensating for the shortcomings of the embedding-based model.
In summary, the adjusted results show a significant improvement in accuracy, which demonstrates the effectiveness of our proposed bias correction method.
7 Conclusion
This paper presents our developed medication recommendation system, named DGMed. By applying causal inference, DGMed achieves feature alignment between medications and diseases at the molecular level, effectively addressing the heterogeneity between the recommended items and data sources. Furthermore, DGMed combines methods at the molecular and entity levels, proposing a bias correction approach, thereby significantly enhancing the model’s effectiveness. We conduct a series of rigorous experiments on publicly available clinical datasets, and the results fully demonstrate our method’s superior performance in terms of accuracy, safety, and efficiency.
Although our research achieve significant progress in the field of medication recommendation, we encounter several limitations, guiding directions for future investigation. At present, our medication recommendation system possesses greater theoretical and scientific value. Within the actual medical system, clinicians frequently necessitate an AI-based review system rather than a straightforward prescribing system, yet, existing research lacks a developed review system. Consequently, we intend to delve into this insufficiently explored domain, building upon DGMed to commence research into medication review systems. Our goal is to enhance the adaptability and responsiveness of our research to the intricate demands of real-world scenarios.
Declaration of Competing Interest
The authors declare that they have no known competing financial interests or personal relationships that could have appeared to influence the work reported in this paper.
Acknowledgments
Funding
This work was supported by the Innovation Capability Improvement Plan Project of Hebei Province (No. 22567637H), the S&T Program of Hebei(No. 236Z0302G), and HeBei Natural Science Foundation under Grant (No.G2021203010 & No.F2021203038).
References
- An et al. [2021] An, Y., Zhang, L., You, M., Tian, X., Jin, B., Wei, X., 2021. Mesin: Multilevel selective and interactive network for medication recommendation. Knowledge-Based Systems 233, 107534.
- Bougiatiotis et al. [2020] Bougiatiotis, K., Aisopos, F., Nentidis, A., Krithara, A., Paliouras, G., 2020. Drug-drug interaction prediction on a biomedical literature knowledge graph, in: Artificial Intelligence in Medicine: 18th International Conference on Artificial Intelligence in Medicine, AIME 2020, Minneapolis, MN, USA, August 25–28, 2020, Proceedings 18, Springer. pp. 122–132.
- Chen et al. [2021a] Chen, C., Geng, H., Yang, N., Yan, J., Xue, D., Yu, J., Yang, X., 2021a. Learning self-modulating attention in continuous time space with applications to sequential recommendation, in: International Conference on Machine Learning, PMLR. pp. 1606–1616.
- Chen et al. [2023] Chen, Q., Li, X., Geng, K., Wang, M., 2023. Context-aware safe medication recommendations with molecular graph and ddi graph embedding, in: Proceedings of the AAAI Conference on Artificial Intelligence, pp. 7053–7060.
- Chen and Wong [2020] Chen, T., Wong, R.C.W., 2020. Handling information loss of graph neural networks for session-based recommendation, in: Proceedings of the 26th ACM SIGKDD International Conference on Knowledge Discovery & Data Mining, pp. 1172–1180.
- Chen et al. [2021b] Chen, Y., Ma, T., Yang, X., Wang, J., Song, B., Zeng, X., 2021b. MUFFIN: multi-scale feature fusion for drug-drug interaction prediction. Bioinformatics 37, 2651–2658.
- Chiang et al. [2020] Chiang, W.H., Shen, L., Li, L., Ning, X., 2020. Drug-drug interaction prediction based on co-medication patterns and graph matching. International Journal of Computational Biology and Drug Design 13, 36–57.
- Choi et al. [2016] Choi, E., Bahadori, M.T., Sun, J., Kulas, J., Schuetz, A., Stewart, W., 2016. Retain: An interpretable predictive model for healthcare using reverse time attention mechanism. Advances in Neural Information Processing Systems 29.
- Dauji and Bhargava [2016] Dauji, S., Bhargava, K., 2016. Estimation of concrete characteristic strength from limited data by bootstrap. Journal of Asian Concrete Federation 2, 81–94.
- Gao et al. [2022a] Gao, C., Zheng, Y., Wang, W., Feng, F., He, X., Li, Y., 2022a. Causal inference in recommender systems: A survey and future directions. arXiv preprint arXiv:2208.12397 .
- Gao et al. [2022b] Gao, Y., Liu, J., Xu, Z., Zhang, J., Li, K., Ji, R., Shen, C., 2022b. Pyramidclip: Hierarchical feature alignment for vision-language model pretraining. Advances in neural information processing systems 35, 35959–35970.
- Hasan et al. [2023] Hasan, U., Hossain, E., Gani, M.O., 2023. A survey on causal discovery methods for temporal and non-temporal data. arXiv preprint arXiv:2303.15027 .
- Hoffman et al. [2014] Hoffman, K.B., Dimbil, M., Erdman, C.B., Tatonetti, N.P., Overstreet, B.M., 2014. The weber effect and the united states food and drug administration’s adverse event reporting system (faers): analysis of sixty-two drugs approved from 2006 to 2010. Drug safety 37, 283–294.
- Hu et al. [2022] Hu, H., Chen, Y., Xu, J., Borse, S., Cai, H., Porikli, F., Wang, X., 2022. Learning implicit feature alignment function for semantic segmentation, in: European Conference on Computer Vision, Springer. pp. 487–505.
- Huang et al. [2021] Huang, Z., Wei, Y., Wang, X., Liu, W., Huang, T.S., Shi, H., 2021. Alignseg: Feature-aligned segmentation networks. IEEE Transactions on Pattern Analysis and Machine Intelligence 44, 550–557.
- Jin et al. [2018] Jin, B., Yang, H., Sun, L., Liu, C., Qu, Y., Tong, J., 2018. A treatment engine by predicting next-period prescriptions, in: Proceedings of the 24th ACM SIGKDD International Conference on Knowledge Discovery & Data Mining, pp. 1608–1616.
- Johnson et al. [2023] Johnson, A.E., Bulgarelli, L., Shen, L., Gayles, A., Shammout, A., Horng, S., Pollard, T.J., Hao, S., Moody, B., Gow, B., et al., 2023. Mimic-iv, a freely accessible electronic health record dataset. Scientific data 10, 1.
- Johnson et al. [2016] Johnson, A.E., Pollard, T.J., Shen, L., Lehman, L.w.H., Feng, M., Ghassemi, M., Moody, B., Szolovits, P., Anthony Celi, L., Mark, R.G., 2016. Mimic-iii, a freely accessible critical care database. Scientific data 3, 1–9.
- Le et al. [2018a] Le, H., Tran, T., Venkatesh, S., 2018a. Dual memory neural computer for asynchronous two-view sequential learning, in: Proceedings of the 24th ACM SIGKDD International Conference on Knowledge Discovery & Data Mining, pp. 1637–1645.
- Le et al. [2018b] Le, H., Tran, T., Venkatesh, S., 2018b. Dual memory neural computer for asynchronous two-view sequential learning, in: Proceedings of the 24th ACM SIGKDD International Conference on Knowledge Discovery & Data Mining, pp. 1637–1645.
- Li et al. [2023] Li, X., Liang, S., Hou, Y., Ma, T., 2023. Stratmed: Relevance stratification between biomedical entities for sparsity on medication recommendation. Knowledge-Based Systems , 111239.
- Lin et al. [2020] Lin, X., Quan, Z., Wang, Z.J., Ma, T., Zeng, X., 2020. Kgnn: Knowledge graph neural network for drug-drug interaction prediction., in: IJCAI, pp. 2739–2745.
- Ma et al. [2019] Ma, C., Kang, P., Liu, X., 2019. Hierarchical gating networks for sequential recommendation, in: Proceedings of the 25th ACM SIGKDD International Conference on Knowledge Discovery & Data Mining, pp. 825–833.
- Ma et al. [2023] Ma, T., Lin, X., Song, B., Yu, P.S., Zeng, X., 2023. Kg-mtl: Knowledge graph enhanced multi-task learning for molecular interaction. IEEE Transactions on Knowledge and Data Engineering 35, 7068–7081. doi:10.1109/TKDE.2022.3188154.
- Nandy et al. [2018] Nandy, P., Hauser, A., Maathuis, M.H., 2018. Understanding consistency in hybrid causal structure learning. Ann. Stat .
- Pei et al. [2022] Pei, G., Shen, F., Yao, Y., Xie, G.S., Tang, Z., Tang, J., 2022. Hierarchical feature alignment network for unsupervised video object segmentation, in: European Conference on Computer Vision, Springer. pp. 596–613.
- Picheny et al. [2010] Picheny, V., Kim, N.H., Haftka, R.T., 2010. Application of bootstrap method in conservative estimation of reliability with limited samples. Structural and Multidisciplinary Optimization 41, 205–217.
- Quadrana et al. [2017] Quadrana, M., Karatzoglou, A., Hidasi, B., Cremonesi, P., 2017. Personalizing session-based recommendations with hierarchical recurrent neural networks, in: Proceedings of the Eleventh ACM Conference on Recommender Systems, pp. 130–137.
- Read et al. [2011] Read, J., Pfahringer, B., Holmes, G., Frank, E., 2011. Classifier chains for multi-label classification. Machine learning 85, 333–359.
- Shang et al. [2019] Shang, J., Xiao, C., Ma, T., Li, H., Sun, J., 2019. Gamenet: Graph augmented memory networks for recommending medication combination, in: Proceedings of the AAAI Conference on Artificial Intelligence, pp. 1126–1133.
- Si et al. [2022] Si, Z., Han, X., Zhang, X., Xu, J., Yin, Y., Song, Y., Wen, J.R., 2022. A model-agnostic causal learning framework for recommendation using search data, in: Proceedings of the ACM Web Conference 2022, pp. 224–233.
- Wang et al. [2017] Wang, M., Liu, M., Liu, J., Wang, S., Long, G., Qian, B., 2017. Safe medicine recommendation via medical knowledge graph embedding. arxiv. Information Retrieval .
- Wang et al. [2022a] Wang, Q., Liu, Y., Xiong, Z., Yuan, Y., 2022a. Hybrid feature aligned network for salient object detection in optical remote sensing imagery. IEEE Transactions on Geoscience and Remote Sensing 60, 1–15.
- Wang et al. [2022b] Wang, W., Feng, F., Nie, L., Chua, T.S., 2022b. User-controllable recommendation against filter bubbles, in: Proceedings of the 45th International ACM SIGIR Conference on Research and Development in Information Retrieval, pp. 1251–1261.
- Wang et al. [2022c] Wang, W., Lin, X., Feng, F., He, X., Lin, M., Chua, T.S., 2022c. Causal representation learning for out-of-distribution recommendation, in: Proceedings of the ACM Web Conference 2022, pp. 3562–3571.
- Wang et al. [2023] Wang, Z., Chen, X., Zhou, R., Dai, Q., Dong, Z., Wen, J.R., 2023. Sequential recommendation with user causal behavior discovery, in: 2023 IEEE 39th International Conference on Data Engineering (ICDE), IEEE. pp. 28–40.
- Wang et al. [2022d] Wang, Z., Liang, Y., Liu, Z., 2022d. Ffbdnet: Feature fusion and bipartite decision networks for recommending medication combination, in: Joint European Conference on Machine Learning and Knowledge Discovery in Databases, Springer. pp. 419–436.
- Wang et al. [2022e] Wang, Z., Shen, S., Wang, Z., Chen, B., Chen, X., Wen, J.R., 2022e. Unbiased sequential recommendation with latent confounders, in: Proceedings of the ACM Web Conference 2022, pp. 2195–2204.
- Wei et al. [2021] Wei, T., Feng, F., Chen, J., Wu, Z., Yi, J., He, X., 2021. Model-agnostic counterfactual reasoning for eliminating popularity bias in recommender system, in: Proceedings of the 27th ACM SIGKDD Conference on Knowledge Discovery & Data Mining, pp. 1791–1800.
- Wu et al. [2019] Wu, Q., Gao, Y., Gao, X., Weng, P., Chen, G., 2019. Dual sequential prediction models linking sequential recommendation and information dissemination, in: Proceedings of the 25th ACM SIGKDD International Conference on Knowledge Discovery & Data Mining, pp. 447–457.
- Wu et al. [2022] Wu, R., Qiu, Z., Jiang, J., Qi, G., Wu, X., 2022. Conditional generation net for medication recommendation, in: Proceedings of the ACM Web Conference 2022, pp. 935–945.
- Xiao and Wang [2022] Xiao, T., Wang, S., 2022. Towards unbiased and robust causal ranking for recommender systems, in: Proceedings of the Fifteenth ACM International Conference on Web Search and Data Mining, pp. 1158–1167.
- Xu et al. [2023] Xu, J., Tong, X., Huang, S.L., 2023. Personalized federated learning with feature alignment and classifier collaboration. arXiv preprint arXiv:2306.11867 .
- Yang et al. [2021a] Yang, C., Xiao, C., Glass, L., Sun, J., 2021a. Change matters: Medication change prediction with recurrent residual networks, in: Proceedings of the Thirtieth International Joint Conference on Artificial Intelligence 2021, pp. 3728–3734.
- Yang et al. [2021b] Yang, C., Xiao, C., Ma, F., Glass, L., Sun, J., 2021b. Safedrug: Dual molecular graph encoders for safe drug recommendations, in: Proceedings of the Thirtieth International Joint Conference on Artificial Intelligence, IJCAI 2021, pp. 3735–3741.
- Yang et al. [2023] Yang, N., Zeng, K., Wu, Q., Yan, J., 2023. Molerec: Combinatorial drug recommendation with substructure-aware molecular representation learning, in: Proceedings of the ACM Web Conference 2023, pp. 4075–4085.
- Zhan et al. [2022] Zhan, F., Yu, Y., Wu, R., Zhang, J., Cui, K., Xiao, A., Lu, S., Miao, C., 2022. Bi-level feature alignment for versatile image translation and manipulation, in: European Conference on Computer Vision, Springer. pp. 224–241.
- Zhang et al. [2021] Zhang, X., Jia, H., Su, H., Wang, W., Xu, J., Wen, J.R., 2021. Counterfactual reward modification for streaming recommendation with delayed feedback, in: Proceedings of the 44th International ACM SIGIR Conference on Research and Development in Information Retrieval, pp. 41–50.
- Zhang et al. [2017] Zhang, Y., Chen, R., Tang, J., Stewart, W.F., Sun, J., 2017. Leap: learning to prescribe effective and safe treatment combinations for multimorbidity, in: Proceedings of the 23rd ACM SIGKDD International Conference on Knowledge Discovery and Data Mining, pp. 1315–1324.
- Zheng et al. [2021a] Zheng, Y., Gao, C., Li, X., He, X., Li, Y., Jin, D., 2021a. Disentangling user interest and conformity for recommendation with causal embedding, in: Proceedings of the Web Conference 2021, pp. 2980–2991.
- Zheng et al. [2021b] Zheng, Z., Wang, C., Xu, T., Shen, D., Qin, P., Huai, B., Liu, T., Chen, E., 2021b. Drug package recommendation via interaction-aware graph induction, in: Proceedings of the Web Conference 2021, pp. 1284–1295.
- Zheng et al. [2021c] Zheng, Z., Wang, C., Xu, T., Shen, D., Qin, P., Huai, B., Liu, T., Chen, E., 2021c. Drug package recommendation via interaction-aware graph induction, in: Proceedings of the Web Conference 2021, pp. 1284–1295.
- Zheng et al. [2023] Zheng, Z., Wang, C., Xu, T., Shen, D., Qin, P., Zhao, X., Huai, B., Wu, X., Chen, E., 2023. Interaction-aware drug package recommendation via policy gradient. ACM Transactions on Information Systems 41, 1–32.