Observational Evidence for Hot Wind Impact on pc-scale in Low-luminosity Active Galactic Nucleus
Abstract
Supermassive black holes in galaxies spend majority of their lifetime in the low-luminosity regime, powered by hot accretion flow. Strong winds launched from the hot accretion flow have the potential to play an important role in active galactic nuclei (AGN) feedback. Direct observational evidence for these hot winds with temperature around 10 keV, has been obtained through the detection of highly ionized iron emission lines with Doppler shifts in two prototypical low-luminosity AGNs, namely M81* and NGC 7213. In this work, we further identify blueshifted H-like O/Ne emission lines in the soft X-ray spectra of these two sources. These lines are interpreted to be associated with additional outflowing components possessing velocity around several km/s and lower temperature ( keV). Blue-shifted velocity and the X-ray intensity of these additional outflowing components are hard to be explained by previously detected hot wind freely propagating to larger radii. Through detailed numerical simulations, we find the newly detected blue-shifted emission lines would come from circumnuclear gas shock-heated by the hot wind instead. Hot wind can provide larger ram pressure force on the clumpy circumnuclear gas than the gravitational force from central black hole, effectively impeding the black hole accretion of gas. Our results provide strong evidences for the energy and momentum feedback by the hot AGN wind.
1 Introduction
Actively accreting supermassive black holes (SMBHs) located at the center of galaxies can considerably influence the evolution of their host galaxies through radiation or different kinds of outflows (e.g., Kormendy & Ho, 2013). Accretion and corresponding feedback can be classified into hot and cold modes, depending on whether the mass accretion rate of the SMBHs is below or above of (Yuan & Narayan, 2014). The majority of local galaxies host low-luminosity active galactic nuclei (LLAGNs), resulting in hot (kinetic) mode accretion and feedback within these galaxies.
Numerical simulations of hot accretion flows have predicted the existence of energetic outflows in the form of uncollimated hot winds with a large opening angle (Yuan et al., 2012a, b; Narayan et al., 2012; Yuan et al., 2015; Yang et al., 2021). Furthermore, simulations have shown that, unless the black hole spin is extremely high, the kinetic energy and momentum carried by the hot wind will be comparable, if not larger than that carried by jet (Yuan et al., 2015; Yang et al., 2021). This result, combined with the fact that the opening angle of wind is much larger than that of jet, suggests that hot winds serve as an essential component of kinetic mode feedback, in addition to the widely considered relativistic jets. The importance of the hot winds and radiation in the hot feedback mode has been investigated by numerical simulations of AGN feedback in an isolated elliptical galaxy (Yoon et al., 2019). Adopting MACER model (Yuan et al., 2018), where radiation and wind of AGN have been carefully incorporated based on the state-pf-the-art physics of black hole accretion in both the hot (radio) and cold (quasar) modes, they found AGN activity and black hole mass would become significantly higher if hot mode feedback is turned off. And the suppression effect of hot mode feedback is dominated by wind rather than radiation.
Direct observational evidence for the existence of hot winds has been reported in two LLAGNs, namely M81* and NGC 7213, through Doppler shift of highly ionized Fe emission lines from observations conducted by Chandra High Energy Transmission Gratings (HETG) by Shi et al. (2021, 2022) (hereafter \al@2021NatAs…5..928S,2022ApJ…926..209S; \al@2021NatAs…5..928S,2022ApJ…926..209S). M81* has an Eddington ratio of is (Yu et al., 2011; Nemmen et al., 2014), well below the threshold for LLAGN () (Yuan & Narayan, 2014). Symmetrically red- and blue-shifted Fe XXVI Ly emission line with consistent velocity to the rest frame energy have been detected, indicating the presence of a 16-keV bipolar outflow with line-of-sight velocity of km/s. The Eddington ratio of NGC 7213 is (Starling et al., 2005; Emmanoulopoulos et al., 2012). Highly ionized iron lines, including Fe XXV K and Fe XXVI Ly lines, have been detected (Bianchi et al., 2003; Starling et al., 2005; Emmanoulopoulos et al., 2013) and appear to have a blueshifted velocity of km/s (Bianchi et al., 2008; Shi et al., 2022). These blueshifted emission lines are interpreted by a 16-keV hot wind with a velocity of 1100 km/s from the hot accretion flows (S22).
The kinetic luminosity carried by hot winds accounts for 10% - 15% of the AGN bolometric luminosity in M81* and NGC 7213. However the spatial extent of the hot winds influence remains uncertain. In both M81* and NGC 7213, static hot gas with -keV, potentially associated with hot circumnuclear medium, is spatially confined to the central pc (\al@2021NatAs…5..928S,2022ApJ…926..209S; \al@2021NatAs…5..928S,2022ApJ…926..209S), implying that such hot winds may have the capability to affect the evolution of circumnuclear medium. The presence of multiphase outflows at several pc-scale is hinted by multiwavelength observations in these two sources. Biconical warm ionized gas outflow features with a line-of-sight velocity of km/s and total mass outflow rate of have been detected within 120 - 250 pc of M81* (Li et al., 2022). The mass outflow rate is similar to that of M81* pc-scale hot wind (). In the case of NGC 7213, two potential molecular outflows within 500 pc of the central SMBH have been detected (Salvestrini et al., 2020). The connection between these larger-scale outflows and pc-scale hot winds requires further investigation.
The large-scale dynamics of wind after launching from accretion flow has been studied by Cui et al. (2020) and Cui & Yuan (2020) (see also \al@2021NatAs…5..928S,2022ApJ…926..209S; \al@2021NatAs…5..928S,2022ApJ…926..209S, ). These studies predict that, without considering the interaction of the wind with interstellar medium (ISM), the wind temperature should gradually decrease from K to K at , while the wind velocity remains almost unchanged or slightly increases, depending on the strength and configuration of magnetic field. As a result, we would expect to observe blueshifted thermal emission lines of highly ionized O and Ne from K plasma as the winds propagate to outer regions. Observations with high spatial and spectral resolution in the soft X-ray regime are necessary to explore the impact of hot winds on host galaxies, which is the aim of this work.
This paper is organized as follows. In Section 2, we briefly describe the reduction process of X-ray observations involved in this study. We analyze the high-resolution X-ray spectra of M81 and NGC 7213, focusing on the detection of prominent emission lines in soft X-ray bands, and discuss potential contamination in Section 3. In Section 4 we associate the identified blue-shifted emission lines with bulk motion plasma. We address the challenges faced by free-expanding wind model in describing this outflowing plasma. And we conclude the observed spectral features can be better explained by winds interact with circumnuclear warm ionized medium through numerical simulations. We summarize our results in Section 5. The errors of derived parameters listed in this work are at 90% confidence level unless otherwise stated.
2 Data Reduction
The XMM-Newton Reflection Grating Spectrometer (RGS) can achieve a full-width half-minimum (FWHM) spectral resolution of km/s for the 1st-order over 0.5-2 keV soft X-ray bands, which meets the requirements for detecting putative hot winds with several . M81* has been observed by XMM-Newton with RGS on 2001 April 23th for 132.7 ks (ObsID: 0111800101). There is a total RGS 182.1 ks exposure of NGC 7213 on 2001 May 28 and 2009 Nov 11 (ObsID: 0111810101 and 0605800301).
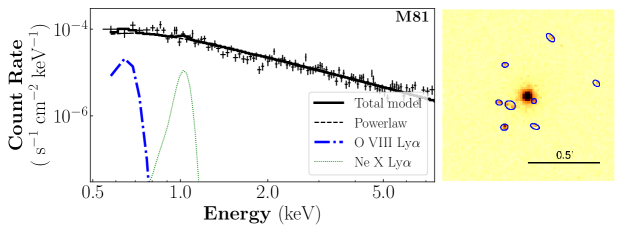
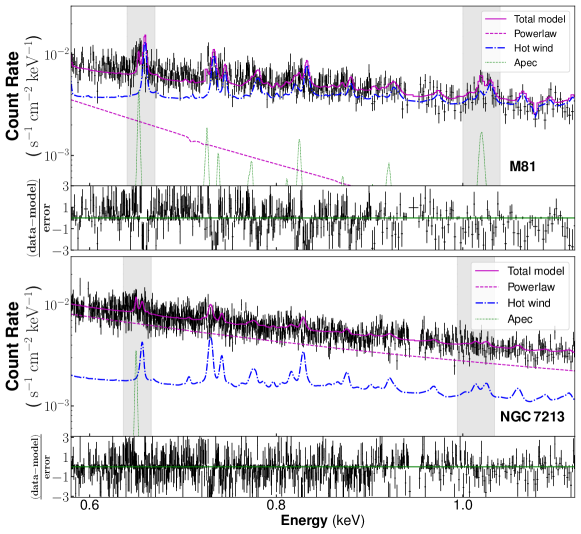
The RGS data are reduced with the XMM-Newton Science Analysis System (SAS)111http://www.cosmos.esa.int/web/XMM-Newton/sas v20.0.0. We follow the standard pipeline rgsproc to clean and reprocess the observations. After removing bad time interval with flaring particle background, we obtain a clean exposure time of 87.0 ks for M81* and 159.2 ks for NGC 7213. To optimize the signal-to-noise ratio, we test different widths of source extraction regions along the cross-dispersion direction to include 60% - 95% of line spread function (LSF). The background spectra are extracted from regions outside 98% of LSF. Ultimately, a source extraction region including 90% of LSF () is chosen. We combine the 1-order spectra from the two RGS spectrometer units (Fig. 1). Spectra are regrouped to ensure that each energy bin contains at least one count.
3 Spectral Analysis
3.1 Baseline Continuum Modeling
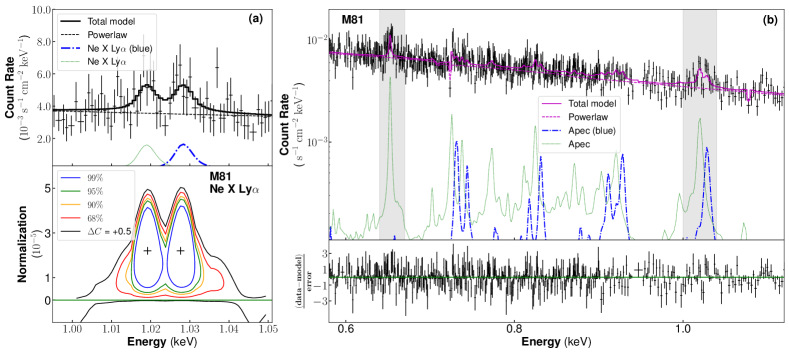
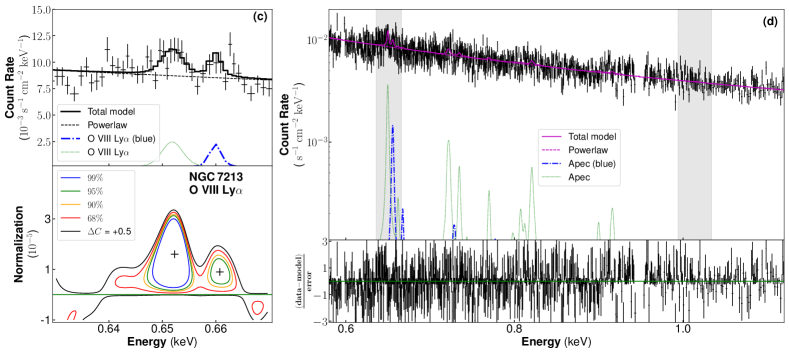
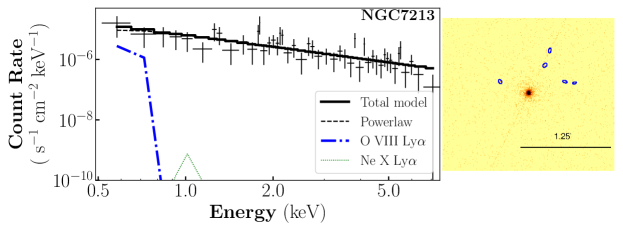
Spectra for the two sources are analyzed with Xspec v12.12.1 and Cash statistics (-stat) is adopted to evaluate the goodness of fit. Galactic foreground absorption is always included in the following fitting procedure. The absorption column density is fixed at for M81* and for NGC 7213222Values of galactic absorption column density are obtained from https://heasarc.gsfc.nasa.gov/cgi-bin/Tools/w3nh/w3nh.pl.. To fit the continuum of stacked spectrum for each source, a simple power-law model is initially adopted. Figure 1 shows the fitting results of the baseline continuum models and Table 1 lists the derived parameters, which will be used for line diagnostics in the following sections.
| Source | model | -stat | |||||||||
|---|---|---|---|---|---|---|---|---|---|---|---|
| (1) | (2) | (3) | (4) | (5) | (6) | (7) | (8) | (9) | (10) | (11) | (12) |
| M81 | PL (order 1) | - | - | - | - | - | - | - | 1904/1827 | ||
| PL+AP0 | 2.19 | - | - | 1 | - | 1818/1825 | |||||
| PL+AP0+APb | 2.19 | 1807/1821 | |||||||||
| NGC 7213 | PL (order 1) | - | - | - | - | - | - | - | 2152/1834 | ||
| PL+AP0 | 1.88 | - | - | - | - | - | 2109/1833 | ||||
| PL+AP0+APb | 1.88 | 0.27 | 1 | 1 | 2101/1831 |
Note. — (1) Source name. (2) Model combinations of the spectral fitting. ’PL’ stands for power-law and ’AP’ represents the apec model. Subscript ’0’ and ’b’ denote the static and outflowing components. (3) Power-law photon index. (4) Normalization of the power-law, in units of at 1 keV. (5) & (7) Plasma temperature of static and blue-shifted gas components. (6) & (11) Normalization of the apec components, in units of . (8) Blue-shifted velocity in units of km/s. (9) - (10) Abundance of Ne and O relative to solar abundance. (12) Goodness of fit in C-stat and degree of freedom.
For M81, the best-fit photon index with -stat=1901 for 1827 degree of freedom (d.o.f), which is softer than the photon index derived with Chandra HETG and NuSTAR spectra in 1-79 keV band in our previous work (S21), probably indicate the existence of additional thermal gas components with temperature less than 1 keV. This component would contribute to soft band and makes the power-law component steeper.
For NGC 7213, the best-fit photon index is with -stat=2152 for 1834 d.o.f.. The photon index is also a little softer compared with the joint fit results from Chandra HETG and NuSTAR FPMA/FPMB(S22). We also check the spectral variability between two RGS epochs of NGC 7213 spectra. The best-fit photon index is marginally consistent cross epochs( and respectively). While photon flux declines 45% over the 8-year interval, which is in agreement with the descending trend described by Yan & Xie (2018). Emission line residues can be clearly seen in both the co-added and individual epoch spectra.
3.2 Line diagnostic
We perform a blind line search for the RGS spectrum of each source to identify prominent emission lines in soft X-ray band. Systematic redshift has been corrected. Detailed description of blind line search method can be found in Tombesi et al. (2010) and S21. We adopt the Monte Carlo Markov Chain script embedded in Xspec to check and constrain the 90% error range of the line centroids. Identification and information of recognized lines are summarized in Table 2 with the help of ATOMDB333http://atomdb.org/. Map of confidence level map for detected prominent emission lines are shown in Figure 1.
In the soft X-ray band spectrum of M81, we detect strong O VIII Ly emission line at keV, which is slightly resolved with . Emission line centered at keV with 3- upper limit line width of < is assigned to the forbidden line of He-like O VII K triplet. Corresponding resonant and inter-combination counterparts can be marginally detected. In the vicinity of the rest-frame energy of Ne X Ly line (1.022 keV), two distinct unresolved emission lines are detected with at least 3- confidence level. One of the lines centered at keV and is consistent with the rest-frame H-like Ne X line. The other line, lying at keV, exhibits blue-shifted velocity of with respect to rest-frame Ne X Ly centroid. This blue-shifted Ne X Ly line is also hinted in the blind line search result of co-added Chandra HEG spectrum(S21), centered at keV with confidence level of 98.3%. The line flux is consistent with 3-sigma upper limit in MEG spectrum, but several times smaller than that in RGS.
In NGC 7213, we two marginally resolved emission lines centered on keV and keV, which could be associated with the forbidden and resonance component He-like O VII K line respectively. Emission lines around keV and keV are assigned to Fe XVII K lines. Ne IX resonance line is detected at keV. There is no obvious residue around the rest-frame energy of Ne X Ly line. We detect keV O VIII Ly line with a line width of km/s. Besides, an additional emission line has been detected at 98.4% confidence level km/s blue-shifted with respect to the rest-frame energy of O VIII Ly line.
3.3 Spectral modeling
Detected emission lines can be produced by optically thin hot gas in the vicinity of the central AGN. Lines with Doppler shifts imply gas with bulk motion. We adopt a thermal plasma model apec (denoted as ‘AP0’) corrected for systematic redshift to describe the static gas component and an additional apec model (denoted as ‘APb’) with Doppler shift free to vary accounting for the outflowing hot plasma. Table 1 records the best-fit parameters of the gas components. Contamination from off-nucleus point sources has been discussed in Appendix A as well as Fig. A1, and would not cause significant changes to the best-fit values.
The best fit temperature of static gas component in NGC 7213 is keV, with a total 0.5-2 keV luminosity of erg/s. Inclusion of a blue-shifted thermal component with best-fit temperature and velocity of km/s would bring an improvement of 8.5 for extra two degree of freedom to the goodness of fit, with 0.5-8 keV luminosity of .
For M81*, the case is a little complicated. The temperature of the almost static circumnuclear hot gas around M81 is keV with erg/s. This component manifests marginal red-shift with 3- upper limit of km/s. Adding another blue-shifted apec component with bulk motion velocity of km/s will bring an improvement of 11 for 4 d.o.f in C-stat. The temperature of this blue-shifted component is keV and its 0.5-8 keV luminosity is estimated to be erg/s. To achieve this fit, Ne abundance should be super-solar () in both static and the fast moving gas, and O abundance would be sub-solar () in the blue-shifted gas relative to solar abundance taken from taken from Asplund et al. (2009). This is dominated by the enhancement in Ne X Ly and suppression in O VIII Ly lines, probably due to the self-absorption of certain bound-bound transition in hot winds, which has been discussed in detail in Sec. 4.1 and Appendix B.
| Source | Line | Significance | F | ||||
|---|---|---|---|---|---|---|---|
| (1) | (2) | (3) | (4) | (5) | (6) | (7) | (8) |
| M81 | O VII K (f) | 0.5611 | 0.5619 | 93.61% | <8 | ||
| O VIII Ly | 0.6536 | 0.6541 | >99.99% | ||||
| Ne X Ly | 1.0218 | 1.0192 | 99.99% | 0 | |||
| Ne X Ly (blue) | 1.0218 | 1.0276 | 99.99% | 0 | |||
| NGC 7213 | O VII K (f) | 0.5611 | 0.5629 | 99.91% | |||
| O VII K (r) | 0.5740 | 0.5736 | 98.14% | <4 | |||
| O VIII Ly | 0.6536 | 0.6520 | >99.99% | ||||
| O VIII Ly (blue) | 0.6536 | 0.6607 | 98.40% | <5 | |||
| Fe XVII K (2-1/3-1) | 0.7263 | 0.7278 | 97.31% | ||||
| Fe XVII K (5-1) | 0.7389 | 0.7404 | 99.32% | <20 | |||
| Ne IX K (r) | 0.9220 | 0.9174 | 99.38% | <4 |
Note. — (1) Source name. (2) - (3) Identified line transition labels and line centroid in laboratory frame in units of keV. (4) Most probable line centroid derived from blind line search with systematic redshift corrected, in units of keV. (5) Confidence level of line detection. (6) Line centroid determined by Gaussian model fitting, in units of keV. (7) Line width in units of eV. (8) Line flux in units of .
4 Discussion
From the above spectral analysis, several H-like and He-like emission lines consistent with rest-frame line centroids are detected with at least 95% confidence level in soft X-ray bands of M81* and NGC 7213, associated with a static thermal gas component. While an additional outflowing plasma component is traced by blue-shifted Ne X Ly in M81* and O VIII Ly lines in NGC 7213. In this section we discuss several possible origins of these components.
4.1 Free-expanding wind
The outflowing plasma with lower temperature of keV can be associated with wind expanding to larger radii and experiencing a decrease in temperature.
To roughly estimate the strongest emitting location of wind components detected in S21, S22 and this work, a theoretical investigation of radial temperature and density profile should be established. In the previous work of S21 and S22, customized magneto-hydrodynamic simulations have been conducted for M81* (NGC 7213) to study the propagation of hot winds launched from hot accretion flow without considering the interaction with ISM. In the simulations, central black hole mass is set to be (). The inner boundary of the simulation domain is set to the truncation at radius 3000 (2000) , which is the outer boundary of the hot accretion flow, consistent with that derived from Fe I K line and reflection fraction of X-ray spectra. The inner boundary condition of temperature, wind velocity and plasma are extrapolated from small-sacle GRMHD simulation of hot accretion flows focusing on the winds (Yang et al., 2021). The radial grids of simulations spread a large dynamical range up to and the latitudinal grids extend from 10∘ to 50∘ to avoid influence from jet and inflow. Only the toroidal magnetic field is taken into account since poloidal field can be negligible at large radii. The emissivity-weighted radial profiles of density and temperature of the simulated wind for the two sources can be fitted by:
| (1) |
| (2) |
| (3) |
| (4) |
Combining the derived average wind temperature with the theoretically predicted temperature profile above (Eq.3 - 4), we can determine the location of wind producing certain emission lines. The best fit temperature of the two hot wind components in NGC 7213 are keV from HETG and keV from RGS, corresponding to (0.04 pc) and (1.4 pc) away from central black hole respectively. For M81*, the wind components detected in HETG hard X-ray bands locates around (0.04 pc). The RGS spectrum of M81* shows a prominent blue-shifted Ne X Ly line, while the blue-shifted O VIII Ly line is marginal. The line luminosity ratio between prominent blue-shifted Ne X Ly ( erg/s) and postulated blue-shifted O VIII Ly (< erg/s with 3 upper limit) is found to be smaller than that collisional ionization equilibrium plasma could ever reach. By adopting a sub-solar abundance of O and super-solar abundance of Ne, the temperature of the outflowing component can be constrained to keV, corresponding to the wind location of (0.3 pc).
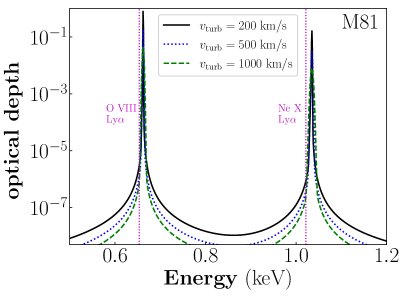
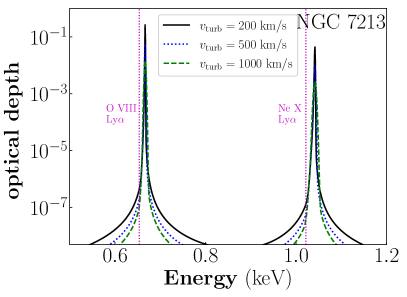
In the soft X-ray regime, self-absorption of hot wind could not be neglected. Given the gas temperature, density and radial velocity of hot wind from simulations, following the method described in Appendix B, we illustrate the total optical depth of hot wind self-absorption (both bound-bound and bound-free) over 0.6 - 1.1 keV band in Figure B1. For M81*, the optical depth peaks at for O VIII line and for Ne X line, assuming the gas turbulent velocity is 200 km/s. For NGC 7213, the peak optical depth of H-like O and Ne lines are and . Hot wind itself would be almost optically thick for O VIII Ly line in M81*. After calibrating for self-absorption, predicted 3- upper limit of ratio between O VIII and Ne X Ly is , corresponding to wind temperature keV, also located within (0.3 pc), consistent with the location determined above.
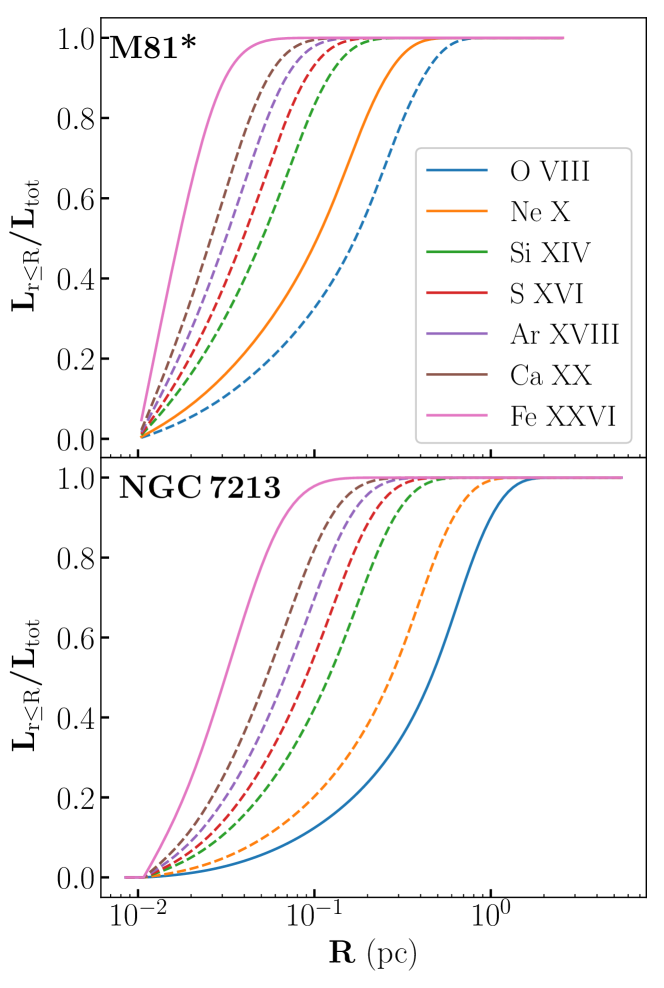
Luminosity of H-like Ne produced by putative free-expanding hot wind is predicted to be erg/s in M81* and erg/s for O VIII Ly in NGC 7213. Compared with the observed luminosity ( erg/s for M81* and erg/s for NGC 7213, extra enhancement is required in M81*. As the temperature of the outflowing hot wind continuously decreases, we would expect to detect blue-shifted characteristic emission lines from highly ionized Si, S, Ar, Ca , etc., produced by wind with intermediate temperature between Fe-emitting and Ne/O-emitting regions. Only upper limits of these lines can be estimated from observed spectra, although they are still consistent with the prediction from simulations shown in Table B1. Figure 2 shows the growth curve of different emission lines predicted by the hot wind simulations.
In the scenario of free-expanding wind, wind velocity is expected to remain almost constant or slightly increase with distance (Cui et al., 2020; Cui & Yuan, 2020). However, there are discrepancies in gas velocity between the outflowing plasma detected in hard and soft X-ray bands, as shown in Table 3. Specifically, for M81* gas velocity drops from km/s to km/s, while for NGC 7213 it increases from km/s to km/s. Moreover, the simulated spectral model for free-expanding hot wind derived in S21 and S22, which well fit the HEG spectra over 5-8 keV band, fail to adequately describe the observed spectra in soft X-ray range. This could be because the number density of the observed outflowing components do not follow the radial profile predicted by adiabatic expansion wind, as shown in Appendix C and Figure C1. This indicates that free expansion of hot winds alone cannot simultaneously explain the emission lines detected in hard and soft X-ray bands.
| Source | ||||
|---|---|---|---|---|
| (1) | (2) | (3) | (4) | (5) |
| M81 | ||||
| NGC 7213 | ||||
Note. — (1) Source name. For each source, parameters given in the top (bottom) row are deduced from HETG(RGS) observations. (2) Velocity of the wind in units of . (3) Wind location determined by comparing observed average plasma temperature with (extrapolated) temperature radial profile from hot wind simulations, in units of pc. (4) Dynamical timescales of winds reaching in units of yr. (5) Estimated number density of the wind at in units of derived from line diagnostics and spectral modeling for M81 and NGC 7213, assuming the wind opening angle is and density decays with .
4.2 Shocked circumnuclear medium
A more advanced consideration is that, as hot wind propagates outward it may encounter circumnuclear medium before its temperature dropping to the point where emission lines of Si XIV, S XV, etc. can be produced ( pc from the growth curve Figure 2). When the supersonic hot wind interacts with the circumnuclear medium, it will be shocked, compressed and heated to , assuming a strong shock limit. Radiative cooling should be efficient in the shocked medium since it has been compressed to higher density. Its temperature will then decrease to an appropriate range ( K) to generate highly ionized O VIII and Ne X lines. Velocity of such shocked medium would be different from the freely propagating hot wind. This scenario could explain the absence of emission lines between highly ionized Fe and O, Ne as well as the observed discrepancies in properties between the hotter and cooler blueshifted gas components.
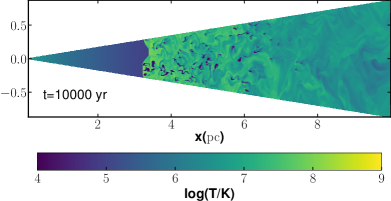
We perform hydrodynamical simulations to examine this scenario for M81* and NGC 7213. First, we simply consider setting the circumnuclear medium in homogeneously and spherically distribution around the central black hole. Using publicly available code pluto (version 4.4; Mignone et al., 2007), we adopt a two-dimensional, static spherical grid. The grid is logarithmically distributed in direction and uniformly distributed in direction with cells in the domain . Hot winds are injected from the inner boundary, temperature of which are calculated from Eq. 3 - 4. Density of the hot winds in NGC 7213 also follows the derived profile in Eq. 2 but is increased to 4 times of that in Eq. 1 for M81*. The intrinsic emissivity-weighted average radial velocity of hot winds from S21 and S22 is adopted, which is for M81* and for NGC 7213. Outflow condition is set for the outer radial boundary and periodic boundary condition is adopted in the -direction. We include radiative cooling using cooling function for solar abundance plasma, according to the lookup table presented by Ploeckinger & Schaye (2020) based on photoionization code Cloudy (Ferland et al., 2017). Gravity and magnetic field are ignored for simplicity.
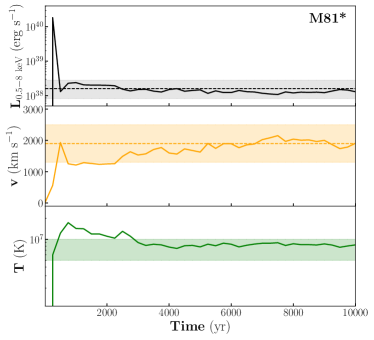
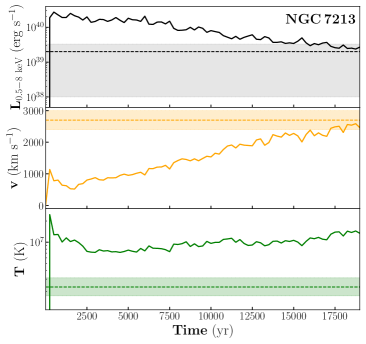
The K circumnuclear medium is assumed to be uniformly distributed with density for M81* and for NGC 7213 whose accretion rate is 10 times higher. The injected hot winds begin to encounter with the medium at 0.1 pc away from black hole and are allowed to evolve for , long enough for the shocked medium to cool through radiation. Time evolution of the simulated X-ray emissivity-weighted average radial velocity and temperature of the shocked medium are shown in Figure 3. The total X-ray luminosity of the shocked medium has been calculated and scaled from the 2D simulation to 3-dimension scenario assuming axis symmetry with solid angle for the blue-shifted half sphere alone. The initial setups of the simulations are summed up in Table D1.
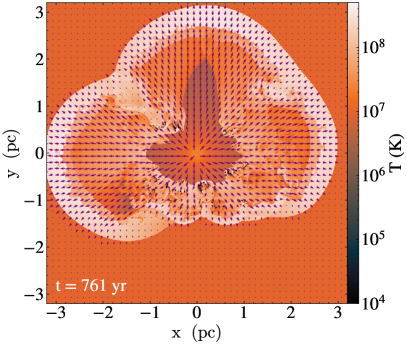
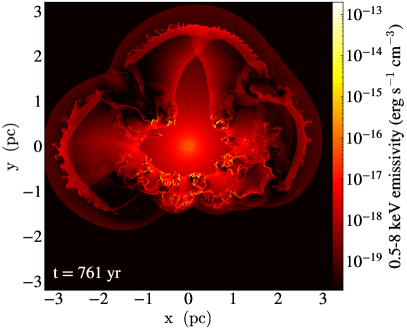
For M81*, by setting of warm ionized medium within central 1 pc, such post-shocked medium could cool down to an average temperature K and reaches average velocity of km/s. The estimated 0.5-8 keV X-ray luminosity of the shocked medium is erg/s, scaled from the 10-deg slice to spherical distribution. This is consistent with the blue-shifted component derived from observed spectra ( erg/s), as shown in Figure 3. And strong X-ray emitting regions approximately coincide with K medium, as shown in Figure 4. Assuming the Ne is twice as solar abundance, the estimated blue-shifted Ne X Ly from shocked medium is erg/s, consistent with the observed value. The cooling timescale of the shocked medium is yrs and is smaller than the dynamical timescale ( yr) for hot wind reaching 10 pc.
Similarly for NGC 7213, by setting of warm ionized gas placed within 1 pc, the shocked medium could reach km/s with 0.5-8 keV luminosity of within yrs (Figure 3). Simulated temperature of the shocked medium seems several times higher than the best-fit blueshifted gas temperature in NGC 7213. The observed temperature is constrained mainly through the detection of single blueshifted O VIII line and upper limits of Ne and other highly ionized lines, thus may invoke large uncertainties. Overall, the blue-shifted emission lines detected in soft X-ray bands could be the footprints of interaction between hot winds and circumnuclear warm ionized gas.
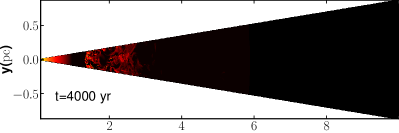
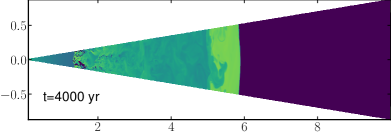
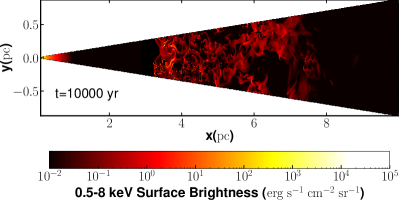
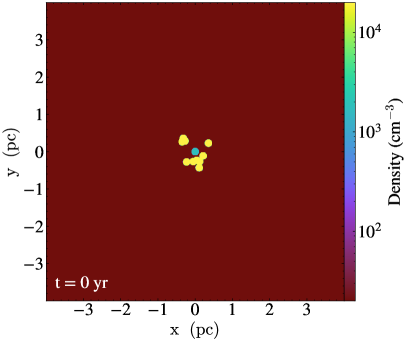
An alternative and more realistic approach to modeling the surrounding medium within the pc-scale is to consider a clumpy morphology instead of homogeneous and continuous distribution. Clumpy clouds can achieve a larger covering factor with less amount of gas. In this case, we replace the continuously distributed gas with various numbers of randomly distributed clumpy clouds, each with a radius of 0.1 pc and a temperature of 1000 K. This simulation has been performed in a 2-dimensional box with Cartesian coordinate using FLASH v4.6 code (Fryxell et al., 2000). Hot winds are injected at the inner spherical boundary around black hole at the box center. Temperature and density of the injected wind exactly follow the results from previous simulations in Eq. (1) - (4). Detailed simulation setups are described in Appendix D. At yr and after the hot winds passing through all the clumps, emission from shocked clumpy clouds dominates the 0.5-8 keV X-ray luminosity. The simulation results are consistent with the observed gas temperature and velocity as shown in the T- phase plot in Fig. D1 and Fig. D2 as well. By introducing and of warm ionized gas within pc-scale for M81* and NGC 7213, the shocked clumpy clouds can achieve comparable X-ray luminosity with observations in soft X-ray bands.
Multi-wavelength observations indicate the existence of sufficient warm ionized circumnuclear medium within pc-scale for M81* and NGC 7213, lending support to the above hot wind interaction scenario. For M81*, Devereux (2019) explains the complex kinematic structure of broad H emission line profile with a dynamically unstable, infalling photoionized H+ gas with - density and large covering factor that is bounded to the inner 0.9 pc. Mass of this pc-scale warm ionized gas is estimated to be . Characteristic forbidden and semi-forbidden emission lines presented in the UV spectrum imply the existence of shock, either by jet proposed by Devereux (2019), or by hot winds as we suggest. A double-peaked broad H component has been spotted in the optical spectra of NGC 7213 nucleus (<110 pc) taken from Gemini Multi-Object Spectrograph. Flux of this broad component varies up to 30% within 4 months and up to 10% within 28 days, probably indicating that the gas component is located within from the central engine (Schnorr-Müller et al., 2014; Schimoia et al., 2017). From the average integrated luminosity of this broad H component (), considering , the mass of the circumnuclear warm ionized gas is estimated to be assuming the average density within 10 pc is , roughly consistent with that required in our shocked medium scenario. Here is the effective emissivity for case B recombination (Osterbrock & Ferland, 2006). In the simulations, we initially assign the amount of circumnuclear medium and the outer boundary has been set to outflowing condition. While in real case, the origin of the circumnuclear medium could be external, like infalling gas clouds that cool down in-situ due to thermal instability(Barai et al., 2012) or stellar wind of nuclear star clusters. These surrounding medium may chaotically but continuously keep falling in and interact with hot wind at pc scale.
The continuously injected hot winds provide both energy and momentum feedback on the circumnuclear gas. In the energy feedback aspect, hot winds act as a heating source by shock heating the gas in the central pc-scale. Shocked medium can maintain temperature of K. In the momentum feedback aspect, the wind can kinetically impede the infalling of interstellar medium, as suggested in Fig.3 and Fig.4. To quantitatively examine the importance of momentum feedback by hot wind, we estimate the ram pressure force that hot winds would exert on a cloud and compare it with the gravitational force of the cloud from the black hole. The radius of cloud is assumed to be 0.1 pc and its distance to the black hole () is assumed to be 1 pc. Wind density at the cloud front is determined from density profile of free-expanding wind for simplification. Number density of the cloud is chosen to be , consistent with the H observation. The ram pressure force that the hot winds provide on each single cloudlet is found to be N, large enough to compete with the gravitational force, which is N. The ratio of the ram pressure force the hot wind exert on the hot phase of the circumnuclear gas and the gravitational force would be larger. This estimation suggests that hot wind would be able to hinder the gas accretion onto the central black hole and keep the central AGN dim. Such a role of hot wind in AGN feedback is fully consistent with the detailed numerical simulation result obtained by Yoon et al. (2019).
5 Summary
In this paper, we have analyzed XMM-Newton RGS high-resolution spectra of two LLAGNs with previously detected -keV hot wind launched by hot accretion flows, M81* and NGC 7213. The aim of the present paper is to focuse on the propagation of hot winds and their interaction between hot winds and circumnuclear ISM. Our main results are as follows:
-
1.
We detect blueshifted Ne X Ly (O VIII Ly) emission line in M81* (NGC 7213) from the 1-order RGS spectra in 0.5-2 keV band, which correspond to outflowing plasma components with temperature of 0.44 keV (0.2 keV) and velocity () km/s.
-
2.
Given that blue-shifted emission lines produced by temperature larger than 10 keV have been detected and identified as wind launched from hot accretion flow in these two sources, we first associate the newly detected emission lines in this paper with hot wind freely propagating to larger radii. However, we find this scenario fails to explain the detected velocity of the outflow and the intensity of the emission lines. It is also hard to explain the absence of some characteristic emission lines for intermediate temperature between Fe and O, Ne.
-
3.
Considering the presence of circumnuclear gas around the AGN, we have performed numerical simulations by considering the interaction between the hot wind and the clumpy circumnuclear gas. We find that the temperature, velocity, and density of circumnuclear gas shock-heated by the hot wind around pc-scale can well explain the newly observed blue-shifted emission lines.
-
4.
The above result provides strong evidence for hot wind heating the circumnuclear gas. In addition to this energy feedback, we have also evaluated the momentum feedback effect by estimating the ram pressure force the hot wind exerts on the circumnuclear clumpy clouds at pc-scale. It is comparable or larger than the gravitational force due to central black hole, thus the wind can impede the accretion of gas. The energy together with the momentum feedback imposed by the hot wind keeps the AGN in a low-luminosity state. This result is consistent with numerical simulations (Yoon et al., 2019).
Appendix A Off-nucleus contamination
Unlike transmission gratings, RGS cannot disentangle the spatial information in the dispersion direction. Both off-nucleus sources like X-ray binaries or distant AGNs and spatial extension of unresolved diffuse emission could potentially bring apparent blue-shifted emission lines to the extracted spectrum. Spatial offset (in unit of arcmin) in the dispersion direction would result in (in unit of , m is the order of spectrum) offset in wavelength for certain emission line 444https://xmm-tools.cosmos.esa.int/external/xmm_user_support/documentation/uhb/rgsspecres.html.
Off-nucleus point sources can be clearly seen in the stacked 0-order image of Chandra HETG observations for the 2 sources. The wavelength offset of detected blue-shifted emission lines corresponds to potential contamination sources within ′(1 kpc for M81* and 6.6 kpc for NGC 7213 in projection). Spectra of point sources within this region around central AGN are identified, extracted and coadded together. In M81*, luminosity of Ne X Ly line from the off-nucleus sources is estimated to be erg/s, about an order of magnitude smaller than the observed blue-shifted Ne Ly emission line erg/s. In NGC 7213, only a 3- upper limit of O VIII Ly luminosity erg/s is obtained from contamination spectrum, which is still several times smaller than the observed blue-shifted O VIII luminosity erg/s. Therefore, the off-nucleus point sources could not account for the detected blue-shifted lines in RGS spectra.
Standard RGS response matrix is built for point sources. We convolve our models with rgsxsrc script embedded in Xspec to test the spatial broadening effect of diffuse emission on the spectral modeling. Images of 0.5-2 keV band with off-nucleus point sources masked are generated from Chandra observations as the required input angular structure function. We do not find significant changes between best-fit values with those in Table 1 and Table 2.
Appendix B Absorption of the wind
Hot wind self-absorption should be consist of bound-free continuum absorption and absorption due to certain bound-bound transition. Optical depth caused by bound-free transition for ion I of certain element X can be calculated by , where is the abundance of element X and is the ion fraction under certain gas temperature T. Gas number density is represented by and is the photon energy E dependent photoelectric absorption cross section. is depth of the gas. We sum over all ion spices and over all grids of a specific sight line to estimate total bound-free optical depth. We find that total optical depth does not vary significantly with sight lines, so inclination angle of 15∘ is chosen. Energy dependent optical depth caused by transition between level and of ion I are expressed by , where and are charge and mass of electron. is the oscillator strength of the transition. The line profile described by Voigt function is a function of Doppler broadening velocity, energy deviation from line centroid and natural broadening damping factor . Doppler broadening velocity is a combination of thermal broadening and turbulent motion (Rybicki & Lightman, 1979). Atomic data like photoelectric absorption cross section and temperature dependent ion fraction are taken from ATOMDB3.
| Source | Line | |||
|---|---|---|---|---|
| (1) | (2) | (3) | (4) | (5) |
| M81* | O VIII Ly | <5.4 | - | 3.0 |
| Ne X Ly | <3.0 | 1.0 | ||
| Si XIV Ly | - | <1.5 | 1.1 | |
| S XVI Ly | - | <2.1 | 0.8 | |
| Ar XVIII Ly | - | <1.7 | 0.3 | |
| Ca XX Ly | - | <2.2 | 0.2 | |
| NGC 7213 | O VIII Ly | - | ||
| Ne X Ly | < | < | ||
| Si XIV Ly | - | < | ||
| S XVI Ly | - | < | ||
| Ar XVIII Ly | - | < | ||
| Ca XX Ly | - | < |
Note. — (1) Source name. (2) Line labels of characteristic transition lines generated in hot winds. (3) - (4) Observed line luminosity in units of . For lines with no prominent detection, we give 3- upper limits where blue-shifts of line centers are fixed at km/s for M81* and for NGC 7213). (5) Predicted line luminosity from hot wind simulations in units of .
Appendix C Simulated hot wind spectra in soft X-ray band
We follow the method described in S21 to generate synthetic spectral models over 0.5-2 keV bands based on customized wind numerical simulation. For simplification, self-absorption is ignored and collisional ionization equilibrium is assumed. Intensity of optically thin thermal emission emitted by hot wind is proportional to square of wind number density, which is treated as scale-free in numerical simulation. So the spectral model is normalized comparing to the observed spectra to determine the real wind density. At first, we adopt the same normalization that best match 5-8 keV spectra, but it fail to adequately match the soft X-ray bands. We find that, to achieve a legitimate description of both continuum and O VIII Ly / Ne X Ly line intensity in 0.5-2 keV, the normalization of hard-band free-expanding hot wind spectral models must be scaled up by a factor of 7 for M81* and scaled down by a factor of for NGC 7213. The comparison has been illustrated in Figure C1. The results imply that free expanding of hot wind alone cannot simultaneously describe detected outflowing components in soft and hard X-ray bands.
Appendix D Shocked clumpy circumnuclear medium
We did 2-D hydrodynamical simulations describing the interaction between hot winds and clumpy warm circumnuclear medium constructed based on FLASH v4.6 code (Fryxell et al., 2000). Radiative cooling has been included. The applied cooling function has been calculated assuming collisional and photoionization equilibrium confined to - K same as described in Ji et al. (2019). And the ’exact’ cooling algorithm (Townsend, 2009) has been implemented to preserve the accuracy of calculations and avoid very short cooling time limiting the simulation time-step.
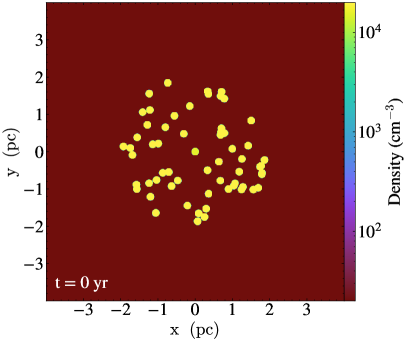
The simulations operate in a 4 pc4 pc box with a resolution 40964096 in the x and y-axis direction. Hot winds are injected at the inner boundary sphere with radius of 0.1 pc around the central point and freely expand and encounter with clumpy cool clouds distributed in the circumnuclear area. The injected wind properties are taken from previous spectral analysis in (\al@2021NatAs…5..928S, 2022ApJ…926..209S; \al@2021NatAs…5..928S, 2022ApJ…926..209S) and also described in Sec. 4. Following the radial profile of wind density and temperature Eq. (1) - Eq. (4) and assuming the winds are freely expanding from the truncated radius to the inner boundary 0.1 pc, for M81*, the injected wind velocity is set to km/s, with temperature of and density of . For NGC 7213 whose accretion rate is almost 30 times higher, wind velocity is set to be km/s with temperature of and density of . Detailed simulation initial setups can be referred to Table D1. With these setups, the total mass outflow rate of injected hot winds at 0.1 pc in the two cases are 0.002 and 0.07 , consistent with that derived from X-ray observations. And the outer boundaries of simulation boxes are set to outflow conditions. Spherical clumpy warm ionized clouds are randomly generated and distributed within a given radius as a mimic of the clumpy gas environment. To simplify the models, each clumpy cloud has a radius of 0.1 pc with density and temperature . These dense warm ionized clumps are buried in diffuse background gas with density to ensure balance in pressure.
We have tested to implement clumps with variant area-filling factor in our 2-D simulation, that is, to generate different numbers of clouds within different ranges around the central black hole. By placing 10 clouds within 0.5 pc around M81* () and 60 clouds within 2 pc around NGC 7213 (), after the shock front passing through, the emissivity-weighted temperature and radial velocity of the shocked medium are consistent with the observed value, as shown in the T- phase plot in Fig. D1 and Fig. D2. The density distribution of initial setups, the emissivity-weighted temperature distribution together with the velocity field and the 0.5-8 keV X-ray emissivity map of the shocked medium are also illustrated in Fig. D1 and Fig. D2. The 0.5-8 keV X-ray emissivity are calculated assuming thermal emission of gas in collisional ionization equilibrium based on ATOMDB. The 2-dimension area-filling factor of these circumnuclear clumps can be converted to volume filling factor in 3-dimension. And the total mass of the required warm ionized gas can then be determined as and respectively for the two sources. The corresponding total 0.5-8 keV X-ray luminosity from the shocked medium would be and , calculated from the emissivity map and normalized according to volume filling factor, larger enough to account for the radiation from the blue-shifted plasma components detected in RGS spectra. Clumpy medium can achieve large covering factor and similar X-ray intensity with smaller volume filling factor, which reduces the required amount of cool gas. We assign and of each computing grid are recorded to trace the fraction of the clumpy cool clouds and hot wind components.
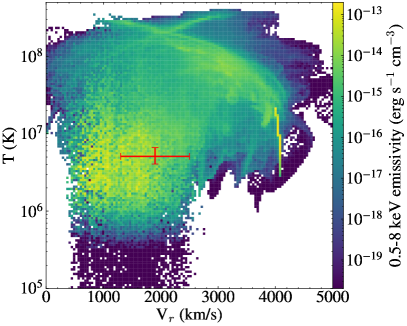
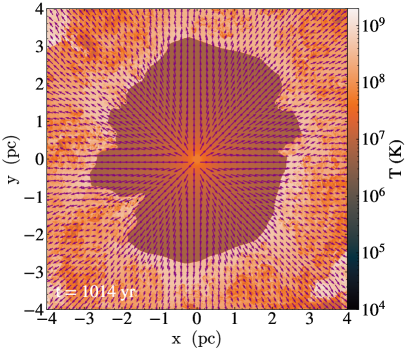
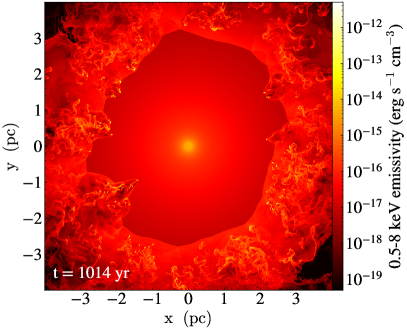
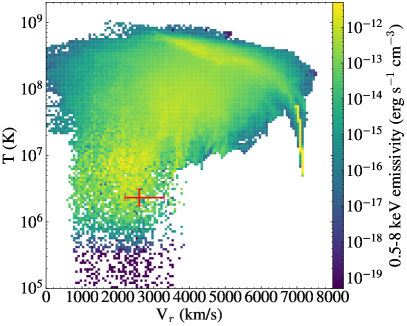
From the simulation snapshot t=761 yr of M81* in Fig. D1, those brightest yellow dot-like structures in the emissivity map with the strongest X-ray emission locate roughly at the windward side of those clumpy clouds and coincide with the dark dots manifesting gas temperature between K and K. This can be more clearly addressed in the T- phase plot. There are two aggregated bright structures and a narrow stripe with prominent X-ray emission in the phase plot. After checking the wind fraction, the bright narrow stripe-like structure with almost constant radial velocity and decreasing temperature traces the freely expanding hot winds before encountering any circumnuclear clumpy clouds. The brightest part at the left bottom exhibits large thus represents shocked medium. It covers the parametric space where the observed blue-shifted gas from soft X-ray spectra resides. The estimated emissivity-weighted average radial gas velocity in the simulation snapshot is . The clumpy nature of circumnuclear medium may also enhance the anisotropy of velocity in different directions of the large opening angle winds. Apart from the brightest structure, the discernible diffuse filamentary structure on the top right has large and corresponds to shocked wind. Gas in the artifact outer shock shells between hot winds and manually set background gas shown in the X-ray emissivity map also resides in this part. Nevertheless, the shocked clumpy circumnuclear medium dominates the predicted X-ray emission. The case is similar for the snapshot t=1014 yr of NGC 7213. Relics of shocked clumpy clouds survive the compression and destruction by passing hot wind, cool down and maintain temperature of K, exhibiting the strongest X-ray emission represented by the bright yellow dots in X-ray emissivity map. The best-fit temperature and velocity of observed blue-shifted gas also coincide with the structure with prominent X-ray emissivity dominated by shocked medium at left-bottom in the T- phase plot.
| Source | code | ||||||||||
|---|---|---|---|---|---|---|---|---|---|---|---|
| (1) | (2) | (3) | (4) | (5) | (6) | (7) | (8) | (9) | (10) | (11) | (12) |
| M81* | PLUTO | 1 | 2800 | 0.1 | 1 | - | |||||
| FLASH | 0.25 | 4000 | 0.1 | 0.5 | 10 | 90 | |||||
| NGC 7213 | PLUTO | 1 | 7000 | 0.1 | 1 | - | |||||
| FLASH | 0.058 | 7000 | 0.1 | 2 | 60 | 1350 |
Note. — (1) Source name. (2) The adopted simulation code. (3) Volume filling factor of circumnuclear medium. for uniformly distributed scenario. For clumpy cloud scenario, it is derived from area filling factor . (4) - (6) Temperature (in units of K), density (in units of ) and velocity of hot winds injected at 0.1 pc away from the central SMBH. (7) - (8) Temperature (in units of K) and density (in units of ) of the circumnuclear medium. (9) - (10) The inner and outer boundary of circumnuclear medium in units of pc. For clumpy cloud scenario, warm ionized gas clouds are randomly distributed between the two radius. (11) Number of warm ionized gas clouds. (12) Total mass of the circumnuclear medium set in the simulations, in units of .
References
- Arnaud (1996) Arnaud, K. A. 1996, in Astronomical Society of the Pacific Conference Series, Vol. 101, Astronomical Data Analysis Software and Systems V, ed. G. H. Jacoby & J. Barnes, 17
- Asplund et al. (2009) Asplund, M., Grevesse, N., Sauval, A. J., & Scott, P. 2009, ARA&A, 47, 481, doi: 10.1146/annurev.astro.46.060407.145222
- Astropy Collaboration et al. (2013) Astropy Collaboration, Robitaille, T. P., Tollerud, E. J., et al. 2013, A&A, 558, A33, doi: 10.1051/0004-6361/201322068
- Astropy Collaboration et al. (2018) Astropy Collaboration, Price-Whelan, A. M., Sipőcz, B. M., et al. 2018, AJ, 156, 123, doi: 10.3847/1538-3881/aabc4f
- Barai et al. (2012) Barai, P., Proga, D., & Nagamine, K. 2012, MNRAS, 424, 728, doi: 10.1111/j.1365-2966.2012.21260.x
- Bianchi et al. (2008) Bianchi, S., La Franca, F., Matt, G., et al. 2008, MNRAS, 389, L52, doi: 10.1111/j.1745-3933.2008.00521.x
- Bianchi et al. (2003) Bianchi, S., Matt, G., Balestra, I., & Perola, G. C. 2003, A&A, 407, L21, doi: 10.1051/0004-6361:20031054
- Cui & Yuan (2020) Cui, C., & Yuan, F. 2020, ApJ, 890, 81, doi: 10.3847/1538-4357/ab6e6f
- Cui et al. (2020) Cui, C., Yuan, F., & Li, B. 2020, ApJ, 890, 80, doi: 10.3847/1538-4357/ab6e6e
- Devereux (2019) Devereux, N. 2019, MNRAS, 488, 1199, doi: 10.1093/mnras/stz1761
- Emmanoulopoulos et al. (2012) Emmanoulopoulos, D., Papadakis, I. E., McHardy, I. M., et al. 2012, MNRAS, 424, 1327, doi: 10.1111/j.1365-2966.2012.21316.x
- Emmanoulopoulos et al. (2013) Emmanoulopoulos, D., Papadakis, I. E., Nicastro, F., & McHardy, I. M. 2013, MNRAS, 429, 3439, doi: 10.1093/mnras/sts610
- Ferland et al. (2017) Ferland, G. J., Chatzikos, M., Guzmán, F., et al. 2017, Rev. Mexicana Astron. Astrofis., 53, 385, doi: 10.48550/arXiv.1705.10877
- Fruscione et al. (2006) Fruscione, A., McDowell, J. C., Allen, G. E., et al. 2006, in Society of Photo-Optical Instrumentation Engineers (SPIE) Conference Series, Vol. 6270, Society of Photo-Optical Instrumentation Engineers (SPIE) Conference Series, ed. D. R. Silva & R. E. Doxsey, 62701V, doi: 10.1117/12.671760
- Fryxell et al. (2000) Fryxell, B., Olson, K., Ricker, P., et al. 2000, ApJS, 131, 273, doi: 10.1086/317361
- Gabriel et al. (2004) Gabriel, C., Denby, M., Fyfe, D. J., et al. 2004, in Astronomical Society of the Pacific Conference Series, Vol. 314, Astronomical Data Analysis Software and Systems (ADASS) XIII, ed. F. Ochsenbein, M. G. Allen, & D. Egret, 759
- Ji et al. (2019) Ji, S., Oh, S. P., & Masterson, P. 2019, MNRAS, 487, 737, doi: 10.1093/mnras/stz1248
- Kormendy & Ho (2013) Kormendy, J., & Ho, L. C. 2013, ARA&A, 51, 511, doi: 10.1146/annurev-astro-082708-101811
- Li et al. (2022) Li, Z., Li, Z., García-Benito, R., & Feng, S. 2022, ApJ, 928, 111, doi: 10.3847/1538-4357/ac56d9
- Mignone et al. (2007) Mignone, A., Bodo, G., Massaglia, S., et al. 2007, ApJS, 170, 228, doi: 10.1086/513316
- Narayan et al. (2012) Narayan, R., SÄ dowski, A., Penna, R. F., & Kulkarni, A. K. 2012, MNRAS, 426, 3241, doi: 10.1111/j.1365-2966.2012.22002.x
- Nemmen et al. (2014) Nemmen, R. S., Storchi-Bergmann, T., & Eracleous, M. 2014, MNRAS, 438, 2804, doi: 10.1093/mnras/stt2388
- Osterbrock & Ferland (2006) Osterbrock, D. E., & Ferland, G. J. 2006, Astrophysics of gaseous nebulae and active galactic nuclei
- Ploeckinger & Schaye (2020) Ploeckinger, S., & Schaye, J. 2020, MNRAS, 497, 4857, doi: 10.1093/mnras/staa2172
- Rybicki & Lightman (1979) Rybicki, G. B., & Lightman, A. P. 1979, Radiative processes in astrophysics
- Salvestrini et al. (2020) Salvestrini, F., Gruppioni, C., Pozzi, F., et al. 2020, A&A, 641, A151, doi: 10.1051/0004-6361/202037660
- Schimoia et al. (2017) Schimoia, J. S., Storchi-Bergmann, T., Winge, C., Nemmen, R. S., & Eracleous, M. 2017, MNRAS, 472, 2170, doi: 10.1093/mnras/stx2107
- Schnorr-Müller et al. (2014) Schnorr-Müller, A., Storchi-Bergmann, T., Nagar, N. M., & Ferrari, F. 2014, MNRAS, 438, 3322, doi: 10.1093/mnras/stt2440
- Shi et al. (2021) Shi, F., Li, Z., Yuan, F., & Zhu, B. 2021, Nature Astronomy, 5, 928, doi: 10.1038/s41550-021-01394-0
- Shi et al. (2022) Shi, F., Zhu, B., Li, Z., & Yuan, F. 2022, ApJ, 926, 209, doi: 10.3847/1538-4357/ac4789
- Starling et al. (2005) Starling, R. L. C., Page, M. J., Branduardi-Raymont, G., et al. 2005, MNRAS, 356, 727, doi: 10.1111/j.1365-2966.2004.08493.x
- Tombesi et al. (2010) Tombesi, F., Cappi, M., Reeves, J. N., et al. 2010, A&A, 521, A57, doi: 10.1051/0004-6361/200913440
- Townsend (2009) Townsend, R. H. D. 2009, ApJS, 181, 391, doi: 10.1088/0067-0049/181/2/391
- Yan & Xie (2018) Yan, Z., & Xie, F.-G. 2018, MNRAS, 475, 1190, doi: 10.1093/mnras/stx3259
- Yang et al. (2021) Yang, H., Yuan, F., Yuan, Y.-F., & White, C. J. 2021, ApJ, 914, 131, doi: 10.3847/1538-4357/abfe63
- Yoon et al. (2019) Yoon, D., Yuan, F., Ostriker, J. P., Ciotti, L., & Zhu, B. 2019, ApJ, 885, 16, doi: 10.3847/1538-4357/ab45e8
- Yu et al. (2011) Yu, Z., Yuan, F., & Ho, L. C. 2011, ApJ, 726, 87, doi: 10.1088/0004-637X/726/2/87
- Yuan et al. (2012a) Yuan, F., Bu, D., & Wu, M. 2012a, ApJ, 761, 130, doi: 10.1088/0004-637X/761/2/130
- Yuan et al. (2015) Yuan, F., Gan, Z., Narayan, R., et al. 2015, ApJ, 804, 101, doi: 10.1088/0004-637X/804/2/101
- Yuan & Narayan (2014) Yuan, F., & Narayan, R. 2014, ARA&A, 52, 529, doi: 10.1146/annurev-astro-082812-141003
- Yuan et al. (2012b) Yuan, F., Wu, M., & Bu, D. 2012b, ApJ, 761, 129, doi: 10.1088/0004-637X/761/2/129
- Yuan et al. (2018) Yuan, F., Yoon, D., Li, Y.-P., et al. 2018, ApJ, 857, 121, doi: 10.3847/1538-4357/aab8f8