Gravitational wave constraints on planetary-mass primordial black holes
using LIGO O3a data
Abstract
Gravitational waves from sub-solar mass inspiraling compact objects would provide smoking-gun evidence for primordial black holes (PBHs). We perform the first search for inspiraling planetary-mass PBHs, both in equal-mass or asymmetric mass ratio binaries, using data from the first half of the LIGO-Virgo-KAGRA third observing run. We do not find any significant candidates, but determine the maximum luminosity distance reachable with our search to be of kpc, and corresponding model-independent upper limits on the merger rate densities to be kpc-3yr-1 for systems with chirp masses , respectively. Furthermore, we interpret these rate densities as arising from PBH binaries, and thereby constrain the fraction of dark matter that these objects could compose. For equal-mass PBH binaries, we find [1, 0.04] for , respectively. For asymmetric mass-ratio binaries, where and , we constrain the mass function for , assuming and . Our results constitute the first gravitational-wave constraints on planetary-mass PBHs in both equal-mass and highly asymmetric mass-ratio systems, provide a computationally efficient alternative to matched filtering in this mass regime, and complement microlensing experiments to probe the existence of these objects. The data necessary to produce the upper limit plots has also been released on Zenodo Miller (2024).
I Introduction
The detection of low-spinning black holes by LIGO, Virgo and KAGRA Aasi et al. (2015); Acernese et al. (2014); Abbott et al. (2016a, b, c, 2017a, 2017b, 2017c, 2019a, 2020a, 2020b, 2020c, 2020d, 2020e) has revived the interest in primordial black holes (PBHs) as dark-matter (DM) candidates Bird et al. (2016); Clesse and García-Bellido (2017); Sasaki et al. (2016). Depending on when and how PBHs formed in the early universe Carr et al. (2021); Byrnes et al. (2018); Jedamzik (2020, 2021); De Luca et al. (2021); Escrivà et al. (2022), they could take virtually any mass between , and could comprise a fraction Sasaki et al. (2016); Ali-Haimoud et al. (2017); Hall et al. (2020); De Luca et al. (2020) or all of DM Bird et al. (2016); Clesse and García-Bellido (2017, 2018); Carr et al. (2021); Jedamzik (2020, 2021); Boehm et al. (2021); De Luca et al. (2021). Such a wide range of possible masses and theories necessitates a variety of probes of PBHs at different masses, one of which is through gravitational-wave (GW) emission.
The true origin of the stellar-mass and heavier black holes detected so far, however, remains elusive, but could be of primordial origin Clesse and García-Bellido (2017); Clesse and Garcia-Bellido (2022). Due to the ambiguity between astrophysical and primordial formation mechanisms to describe LIGO, Virgo and KAGRA observations of black holes above a solar mass, it is worthwhile to investigate the possibility of detecting GWs from inspiraling compact objects below a solar mass searches, whose origin almost certainly would be primordial Bagui et al. (2023); Yamamoto et al. (2023).
Despite a feature in the PBH mass function that appears at Niemeyer and Jedamzik (1998); Jedamzik (1997); Byrnes et al. (2018); Carr et al. (2021), independently of the PBH formation mechanism, much interest so far has focused on sub-solar mass PBHs only in the range of , with the exception of a non-lineary GW memory search that weakly constrained PBHs at . This is partially because higher-mass sources would emit stronger GWs relative to those at lower masses, but also because they are still computationally feasible to search for with conventional matched-filtering methods Abbott et al. (2018, 2019b); Nitz and Wang (2021a); Horowitz et al. (2020); Nitz and Wang (2021b); Abbott et al. (2022a, 2023). While these searches have yielded no significant GW events111One search, however, does claim to have seen a sub-solar mass candidate Phukon et al. (2021); Prunier et al. (2023), though with low significance., they have placed stringent upper limits on , the fraction of DM that PBHs could compose, at the level of a few percent.
In fact, inspiraling planetary-mass PBHs binaries could lead to detectable GW signals if they formed within our galaxy, motivating the development of methods to search for them Miller et al. (2021a); Andrés-Carcasona et al. (2023); Alestas et al. (2024). Furthermore, the existence of such planetary-mass PBHs, well-motivated observationally by the recent detections of star and quasar microlensing events Niikura et al. (2019); Hawkins (2020); Bhatiani et al. (2019), has suggested that PBHs or compact objects with masses between and could compose up to of all DM. Current constraints in this mass region come from microlensing experiments, in particular HSC Croon et al. (2020), OGLE Niikura et al. (2019), and EROS Tisserand et al. (2007) and range from to . However, microlensing limits could be evaded if PBHs form in clusters García-Bellido and Clesse (2018); Calcino et al. (2018); Belotsky et al. (2019); Carr et al. (2021, 2021); Trashorras et al. (2021); De Luca et al. (2020), thus motivating the need to probe the same PBH masses with different techniques.
In this work, we perform the first-ever search for GWs from planetary-mass PBH binaries, and place the first GW constraints on the fraction of DM that planetary-mass PBHs could compose. Because our search is primarily sensitive to the chirp mass of the inspiraling system, we present constraints considering both equal-mass and asymmetric-mass ratio PBH binaries, the latter of which may form more often.
II Signal model
GW emission arises from the inspiral of two compact objects that eventually merge. When these two objects are sufficiently far from the innermost stable circular orbit, the GW emission can be approximated as arising from two point masses orbiting around their center of mass. Equating orbital energy loss with GW power, we obtain an expression for the rate of change of the GW frequency over time (the spin-up) Maggiore (2008):
| (1) |
where is the chirp mass of the system, is the GW frequency, is the speed of light, and is Newton’s gravitational constant.
Integrating Eq. 1, we obtain the frequency evolution:
| (2) |
where is a reference time for the GW frequency and is the time at .
The amplitude evolution of the signal over time is Maggiore (2008):
| (3) |
where is the distance to the source.
While we only consider the signal at leading order in the Post-Newtonian approximation (PN) Maggiore (2008), i.e. 0PN, because we observe the inspiral far from merger, our results are valid up to 3.5PN for equal-mass systems in this parameter space. However, higher-order PN terms depend strongly on the symmetric mass ratio Alestas et al. (2024); thus, here we are sensitive to systems with mass ratios , assuming a primary component mass .
III Search
III.1 Method
We use the Generalized frequency-Hough, a “power-law track finder”, to search for inspiraling planetary-mass PBH binaries. This method maps points in the time/frequency plane of the detector to lines in the frequency/chirp mass plane of the source Miller et al. (2018, 2021b). In order to apply the Generalized frequency-Hough, we linearize Eq. 2 by changing variables and , which results in the equation of a line: Miller et al. (2018).
The frequency/chirp mass plane is essentially a two-dimensional histogram called the “Hough Map”, where the number count in each bin indicates the significance that a signal with a particular is present in the time/frequency map.
We run the Generalized frequency-Hough on a time/frequency “peakmap” of duration , constructed by dividing the strain time-series into chunks of length , fast Fourier transforming each one (keeping the phase within each ), thresholding the power in each frequency bin, and selecting local maxima above this threshold. ranges from one hour to a week, and ranges from 2 to 29 seconds. The power at each time/frequency point that survives these checks is called a “peak”, and we label each peak simply with a “1”. Our method, therefore, acts on a collection of 1s in the time/frequency plane. Summing only 1s, not power, has been shown to be more robust against non-Gaussian noise disturbances Astone et al. (2005, 2014), since powerful noise lines will be given weights of “1” at each time they appear, reducing background contamination.
III.2 Data used and parameter space covered
We analyze LIGO data from the first half of the O3 observing run, O3a, which began on 1 April 2019 1500 UTC and ended on 1 October 2019 1500 UTC. Extensive data quality studies and calibration were performed Sun et al. (2020); Acernese et al. (2018); Abbott et al. (2021); Davis et al. (2021), and time-domain spectral artifacts were removed Vajente et al. (2020).
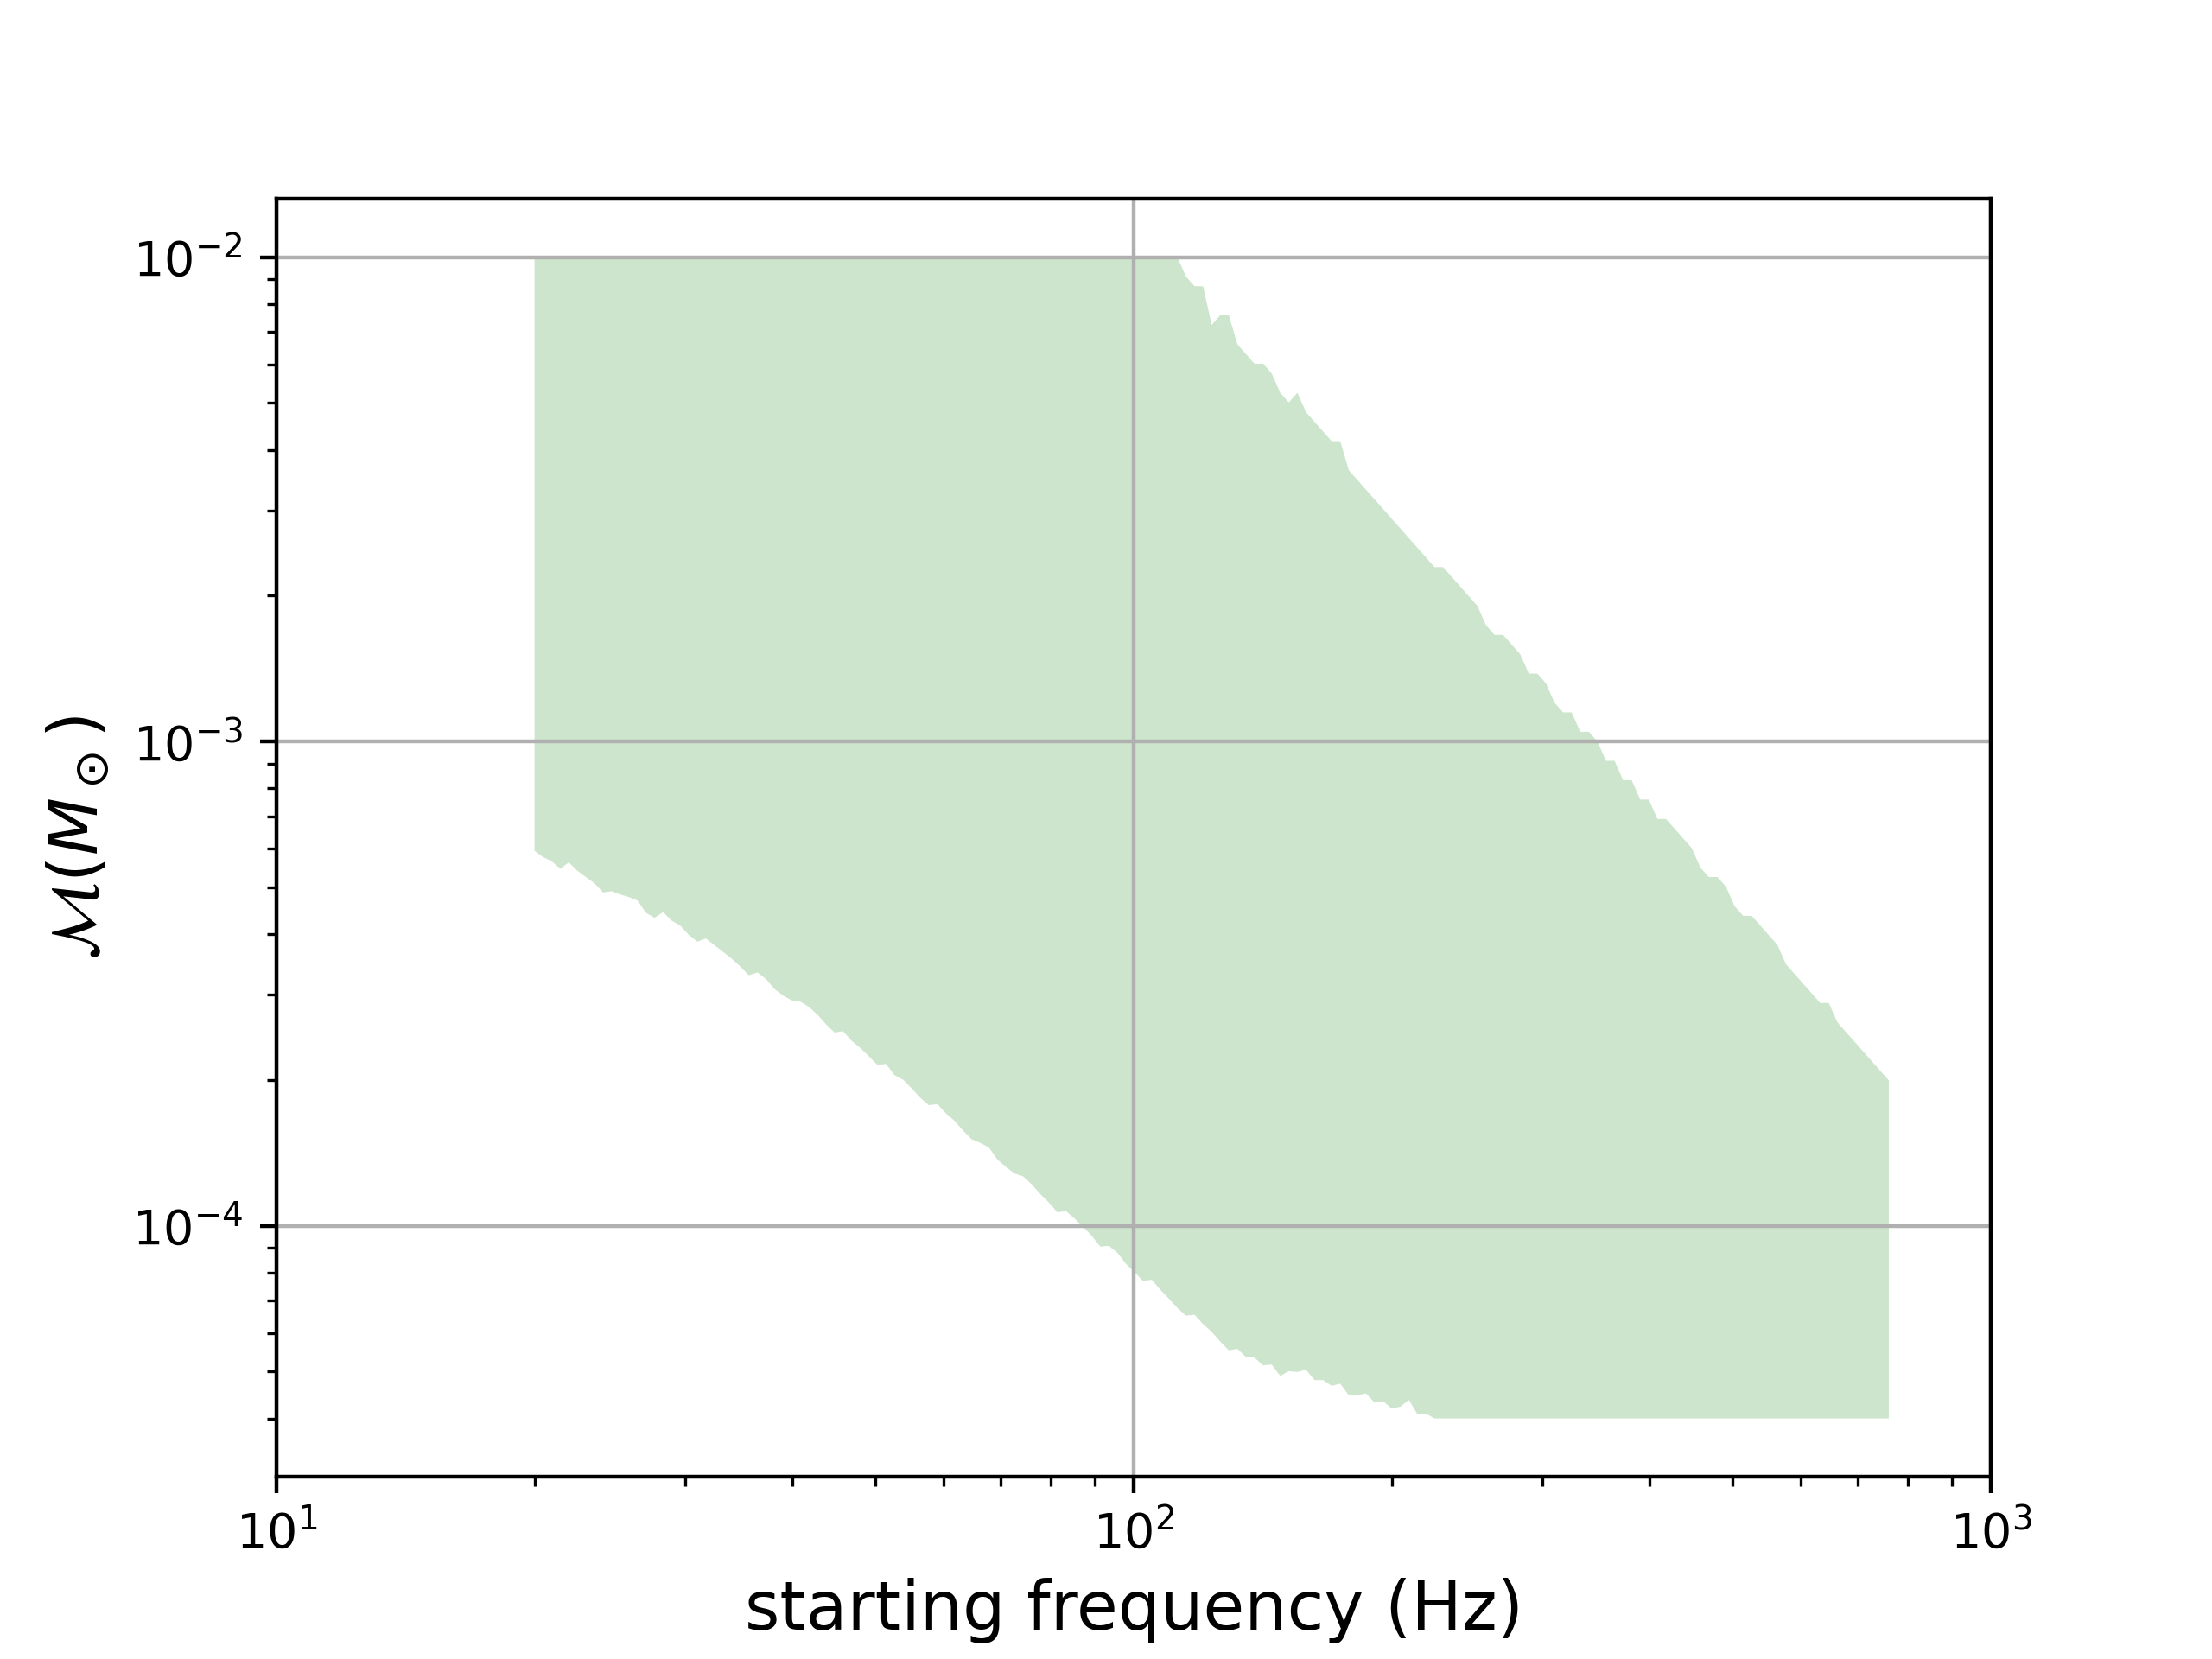
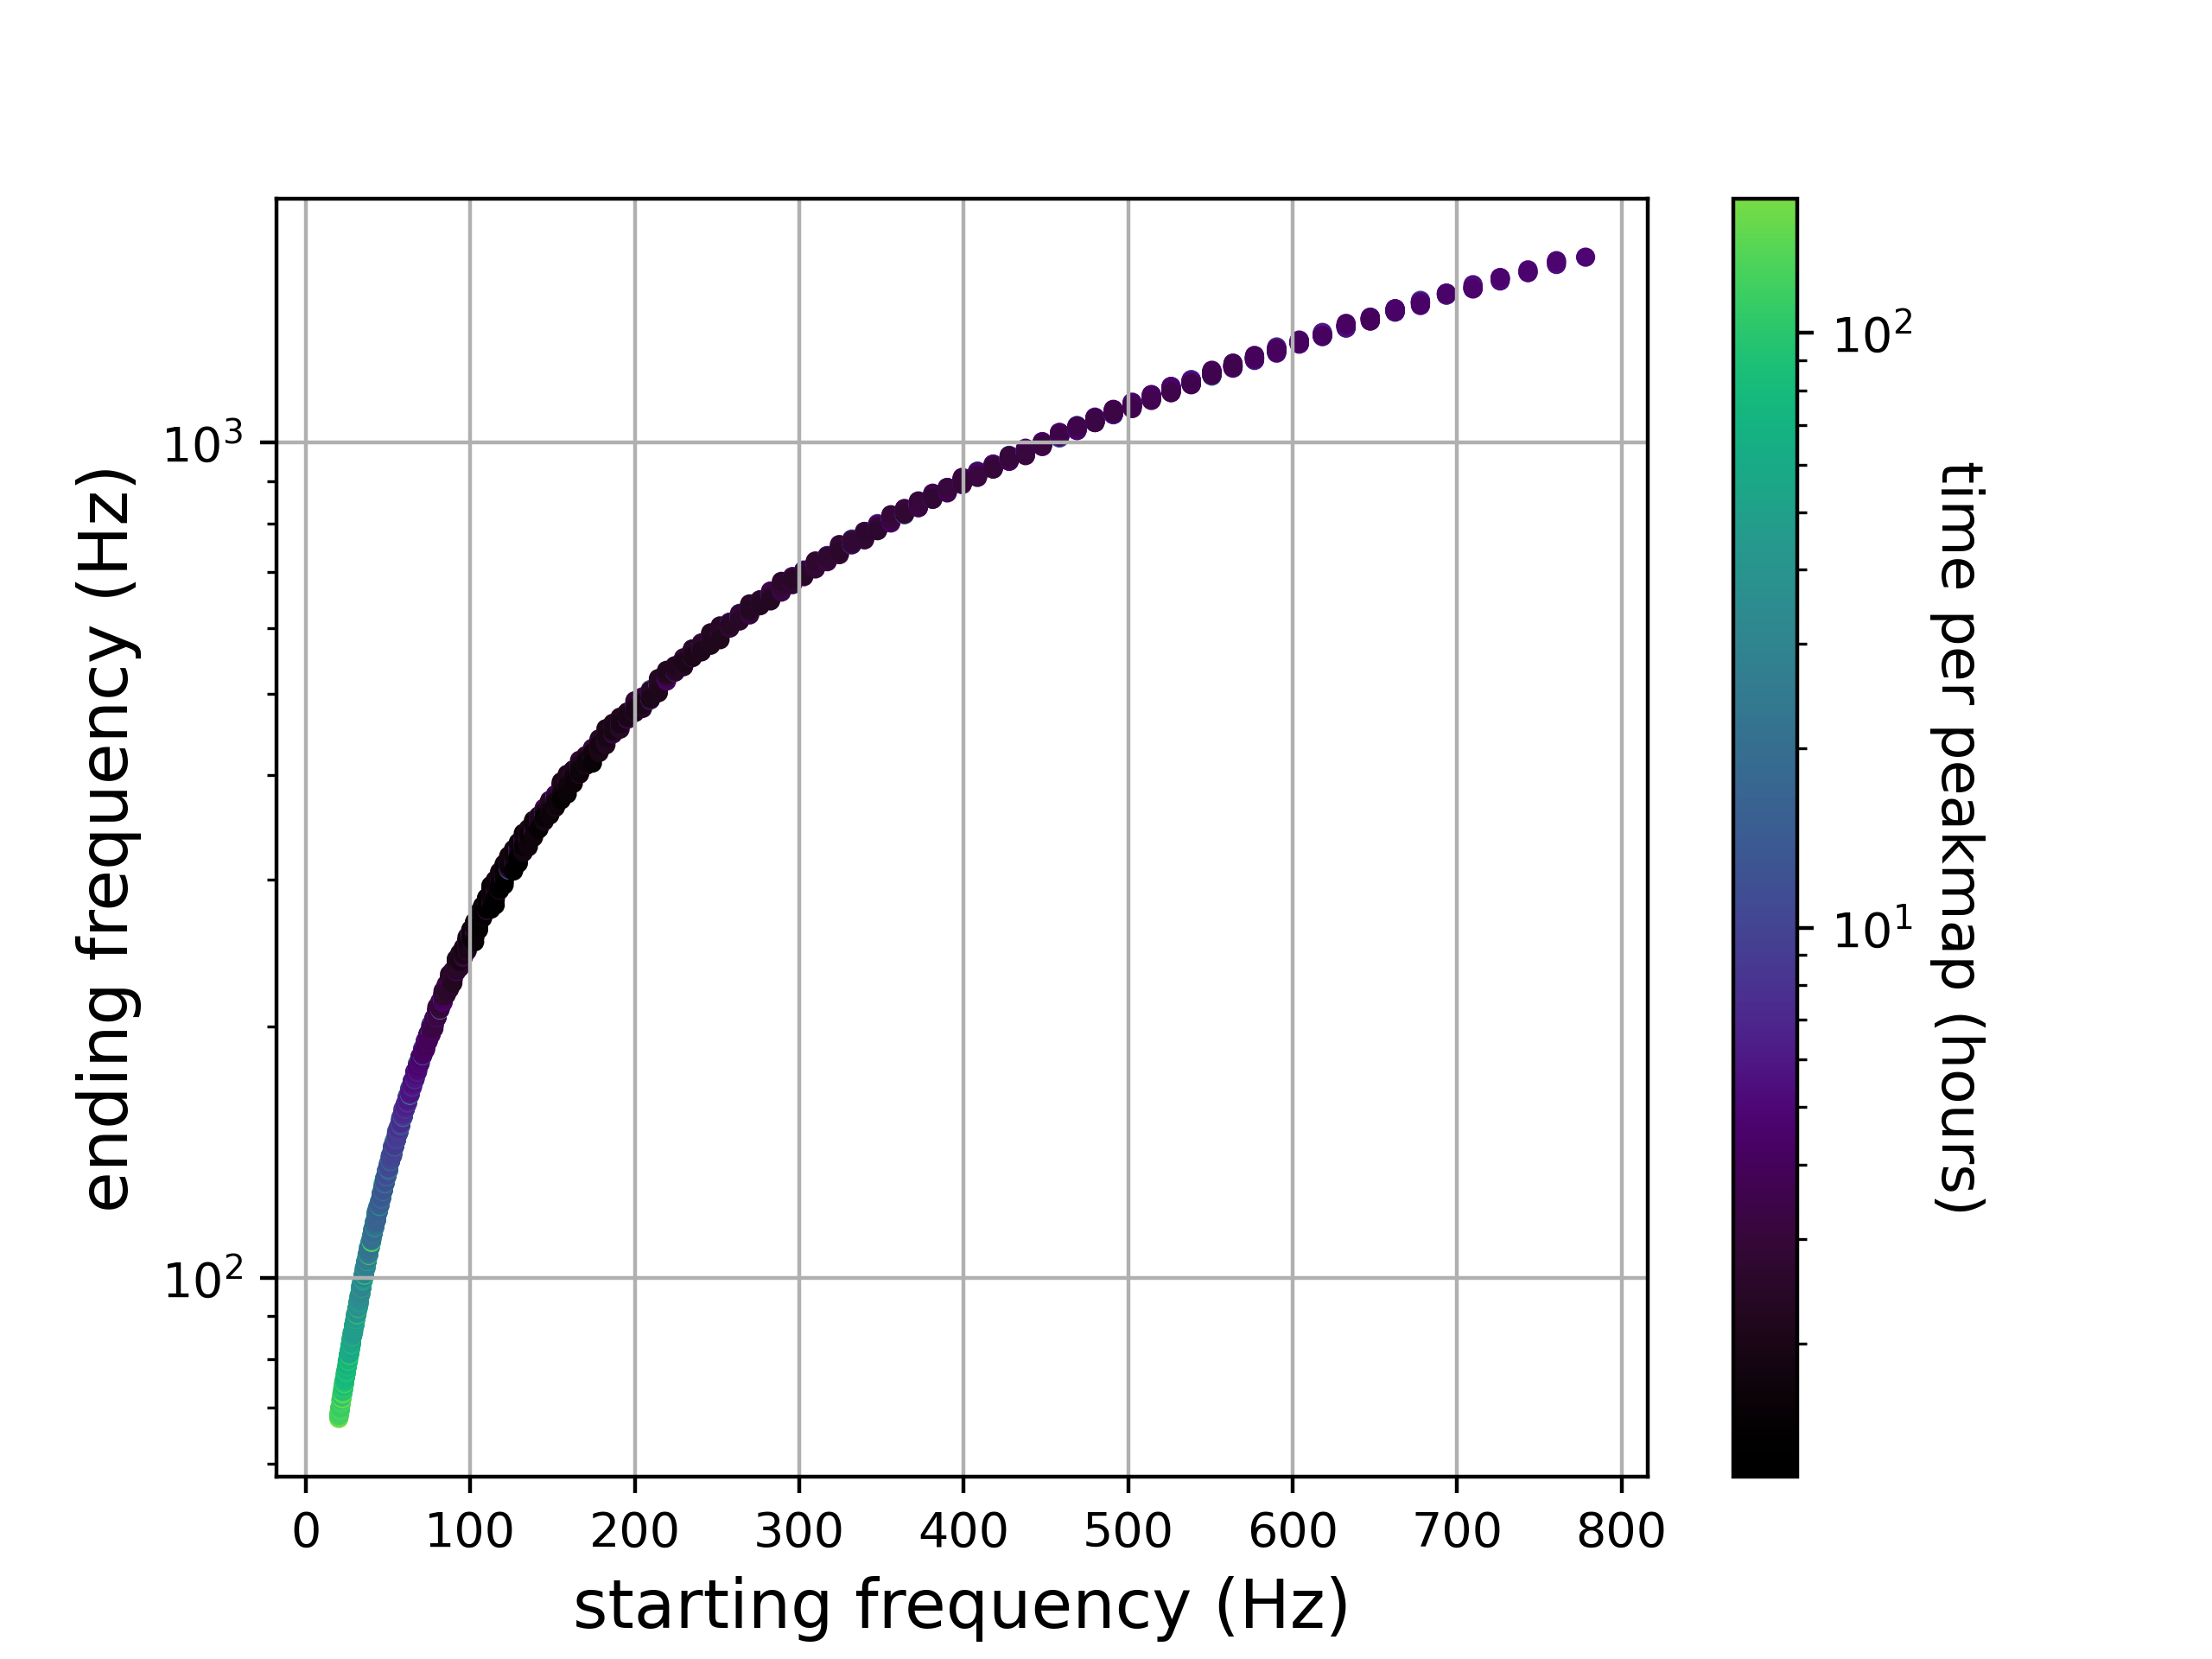
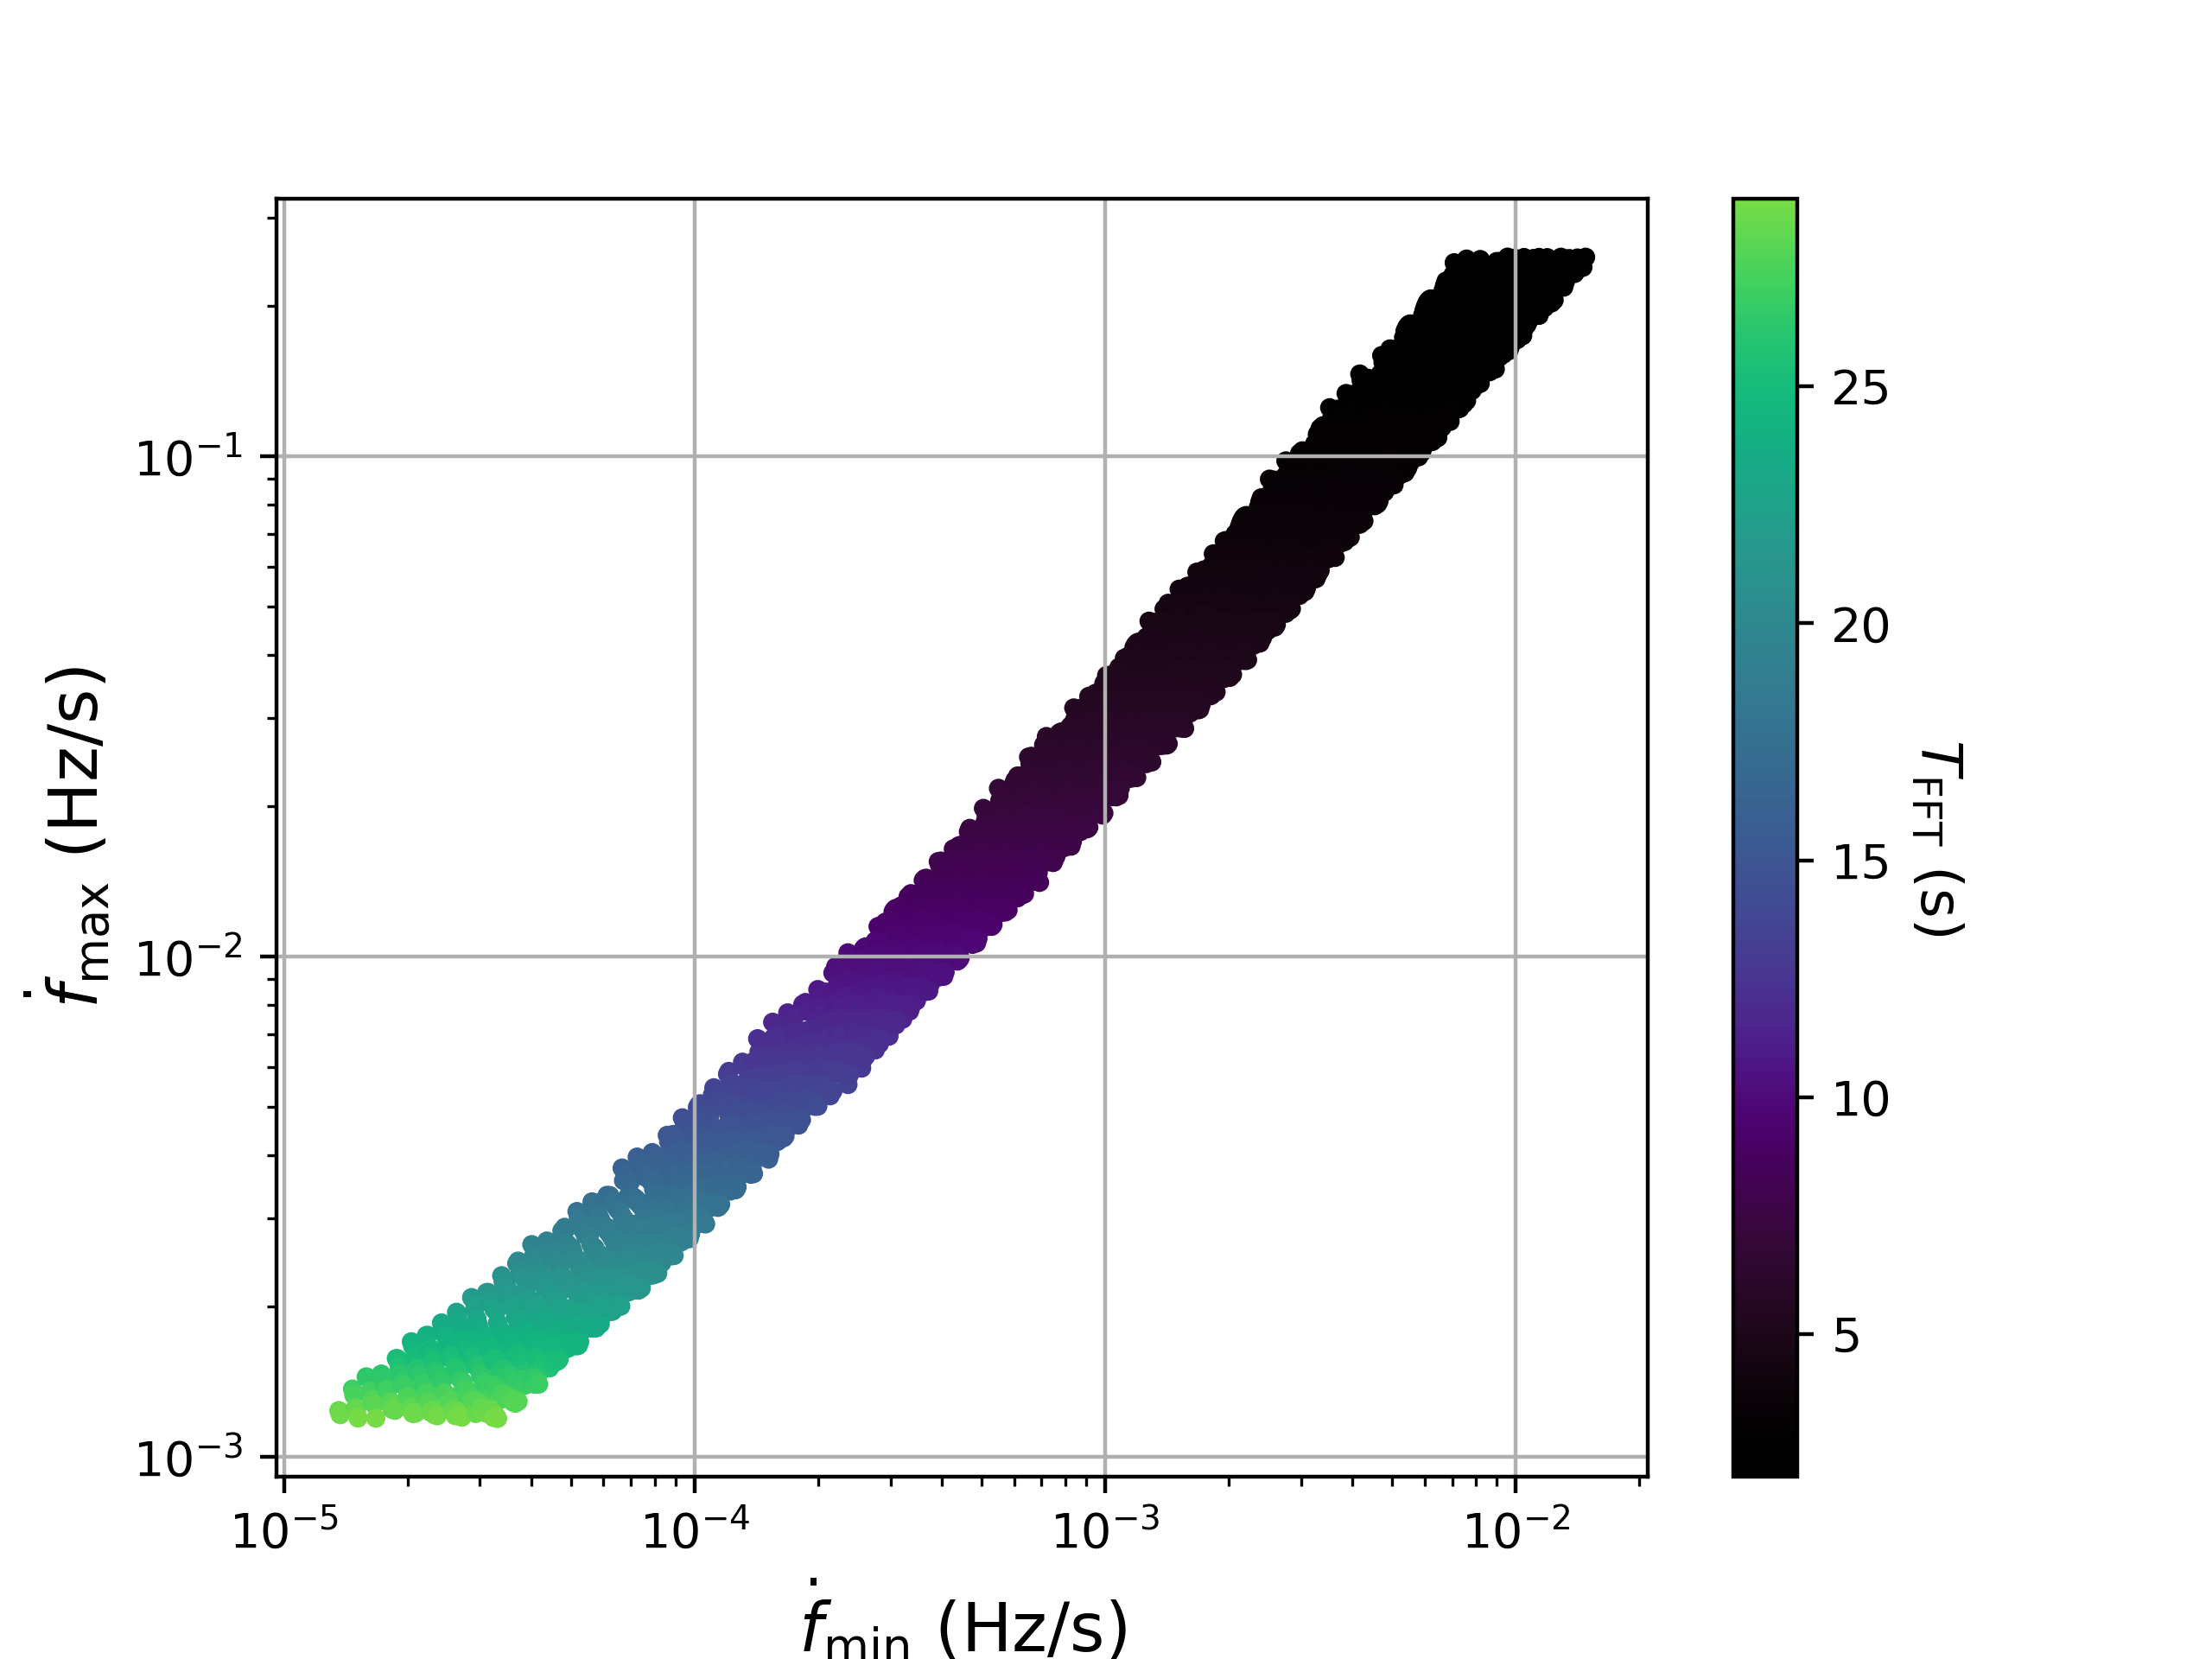
We cover a broad parameter space compared to other sub-solar mass matched-filtering searches, due to the relative computational efficiency of our method. In Fig. 1(a), we show the range of chirp masses to which we are sensitive, as a function of the starting frequency of the analysis, while in Fig. 1, we show as a function of starting and ending frequency of each band we analyze. We cover a chirp mass range of over two orders in magnitude depending on the frequency, with specific and selected to maximize sensitivity, folding in the frequency-dependent detector power spectral density – see App. A for details.
We are able to search the whole parameter space given in Fig. 1 with configurations, where each configuration corresponds to creating one peakmap over that configuration’s and running the Generalized frequency-Hough on it, over the entire observing run – see App. A for details. So, the number of peakmaps per configuration is .
The computing cost of this search is quite low compared to matched filtering Miller et al. (2024). Starting with the short fast Fourier Transform databases Astone et al. (2005), we create peakmaps with different over different , run the Generalized frequency-Hough, select significant candidates from each detector’s data, and perform coincidences using 1935 CPUs, which took approximately days.
III.3 Candidates and follow-up
We run the search on data from LLO and LHO separately, select the top 0.1% candidates in each of the Hough maps in various “blocks” of frequency/chirp mass, as to avoid being blinded by disturbances Miller et al. (2018), and perform coincidences between the candidates returned from each detector’s data. A “coincidence” occurs if the Pythagorean distance between the returned and ( and ) of candidates from each detector are less than 3 bins apart Miller et al. (2018) at the same reference time . At this point, we have a little over 10 million coincident candidates, denoted , irrespective of their significance, which is addressed in the following steps.
Our detection statistic is the critical ratio (CR), calculated for each candidate in each detector :
| (4) |
where is the number count of each candidate in the Hough map, and and are the mean and standard deviation, respectively, of the number counts in each “block” in which we have selected the most significant candidates.
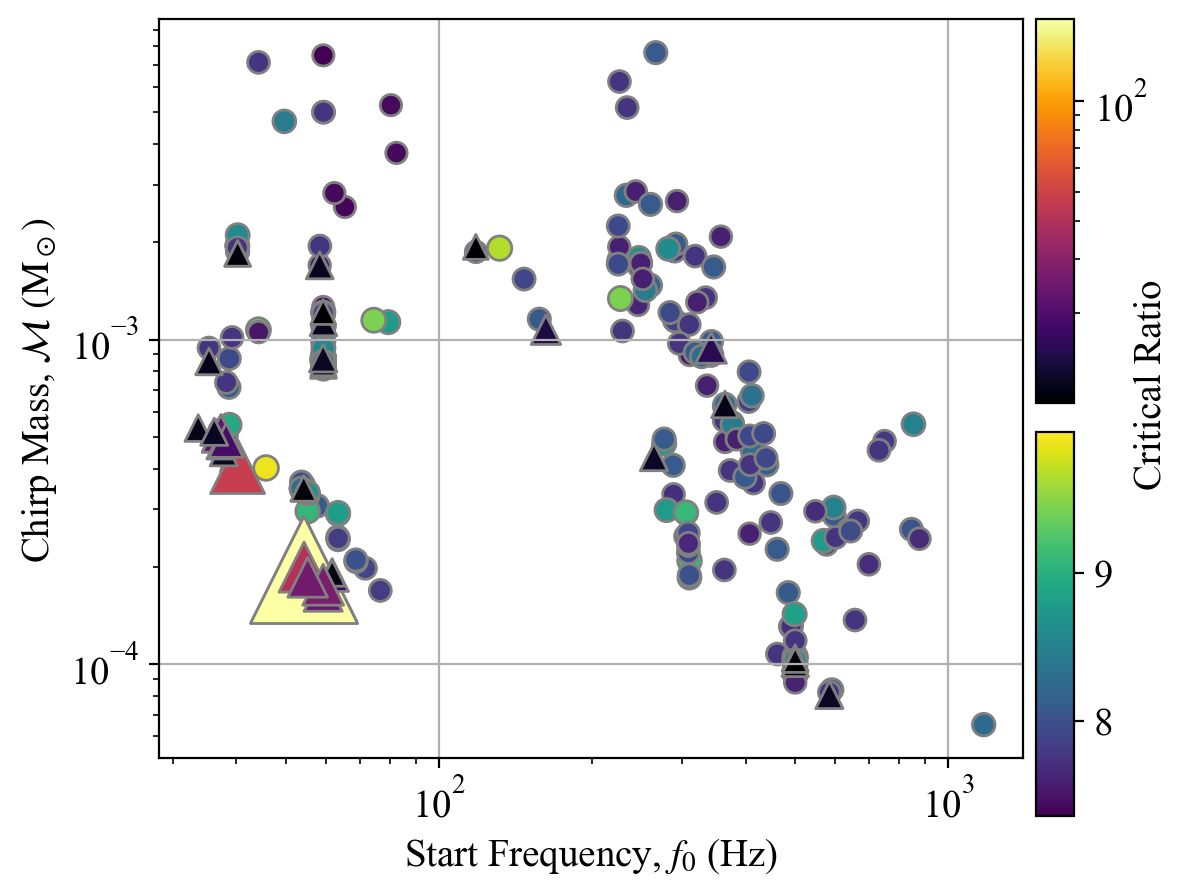
Candidates that are above a certain threshold CR are retained. The threshold CR is defined for each configuration by fixing the false-alarm probability to n pure Gaussian noise, which, accounting for the trials factor, amounts to the actual false-alarm probability of The threshold CR varies as a function of each configuration, and ranges from 7.26 to 7.67. After this procedure, 7457 candidates are left. Furthermore, we veto any candidates within a frequency bin of a known noise line Sun et al. (2020), which leaves us with 334 surviving candidates. We show in Fig. 2 the chirp masses and initial frequencies of these candidates, with their average critical ratios colored, which correspond to average matched-filter signal-to-noise ratio of .
We now perform a follow-up of these interesting candidates by using the recovered and from each candidate to demodulate the original time-series data , so that the signal would appear monochromatic if a perfect correction is done, i.e. , where . This procedure is called heterodyning Dupuis and Woan (2005); Miller et al. (2018); Abbott et al. (2019c); Piccinni et al. (2019); Abbott et al. (2020f, 2022b).
Due to uncertainties in the signal parameters, however, we grid around and of each parameter, and then perform the heterodyning. Furthermore, these uncertainties grow with , so we perform the follow-up iteratively, increasing by a factor of 2 in each pass in order to ensure that a true signal does not get accidentally rejected Miller et al. (2018). After each pass, we create another time/frequency peakmap and perform the original frequency-Hough transform, which maps points in the time/frequency plane of the detector to lines in the frequency/spin-up plane of the source Astone et al. (2014). This accounts for some residual spin-up or spin-down in the signal due to some mismatch in the true signal parameters and the ones used for the heterodyning. If the new is smaller than the old , we veto the candidate. In our follow-up procedure, all 334 candidates were vetoed after a single heterodyne.
IV Upper limits
IV.1 Constraints on rate density
We compute upper limits from this search using a hybrid theoretical/data-driven approach that has been verified through injections (see App. B). The sensitivity of the Generalized frequency-Hough search towards inspiraling binary systems has already been computed in Miller et al. (2021a) in terms of the maximum (luminosity) distance reach at a particular confidence level :
| (5) | |||||
Here, is the probability of selecting a peak above the equalized-power threshold in the peakmap if the data contain only noise, = 2 , , and is the combined noise power spectral density estimated from LHO and LLO in O3a. The sum over indicates the sum over the theoretical frequency track for the chirp mass with starting frequency , where all frequencies are weighted by the noise power spectral density.
Even though each configuration was constructed to be sensitive to a particular and (see App. A), we can actually probe a wide range of chirp masses and starting frequencies in each Hough map. Within a given Hough map () for a particular configuration (), all coincident candidates selected with a chirp mass and starting frequency are assigned a critical ratio (). Using the Feldman-Cousins approach to set upper limits, which ensures perfect coverage at a given confidence level, is mapped to an “inferred” positive-definite based on the upper value of Tab. 10 in Feldman and Cousins (1998) at 95% confidence. As shown in App. B, this approach produces consistent limits compared to those obtained by injecting simulated signals Miller et al. (2018, 2021b); Abbott et al. (2022c). Because is found for LHO and LLO separately, we conservatively use the maximum of the two in Eq. 5 after applying the Feldman-Cousins approach.
Thus, we compute a distance reach for all 10 million candidates returned from the first step of the search. We then select chirp masses that cover the searched parameter space at which we will set upper limits, and, at each , in each configuration, take the median of the distance reaches over all frequencies and Hough maps (i.e. over ): . Essentially, our procedure corresponds to the median sensitivity of our search over time.
We then have one distance reach per configuration per . Some configurations will be more sensitive than others to certain chirp masses; therefore, we take the maximum distance for each chirp mass as the distance upper limit, i.e. .
With the distance reach as a function of chirp mass, we can compute the spacetime volume of nearby sub-solar mass binaries Miller et al. (2022); Alestas et al. (2024)
| (6) |
where 126 days (adjusted for the detector duty cycle of 70%). From that, the rate density at 95% confidence is Biswas et al. (2009)
| (7) |
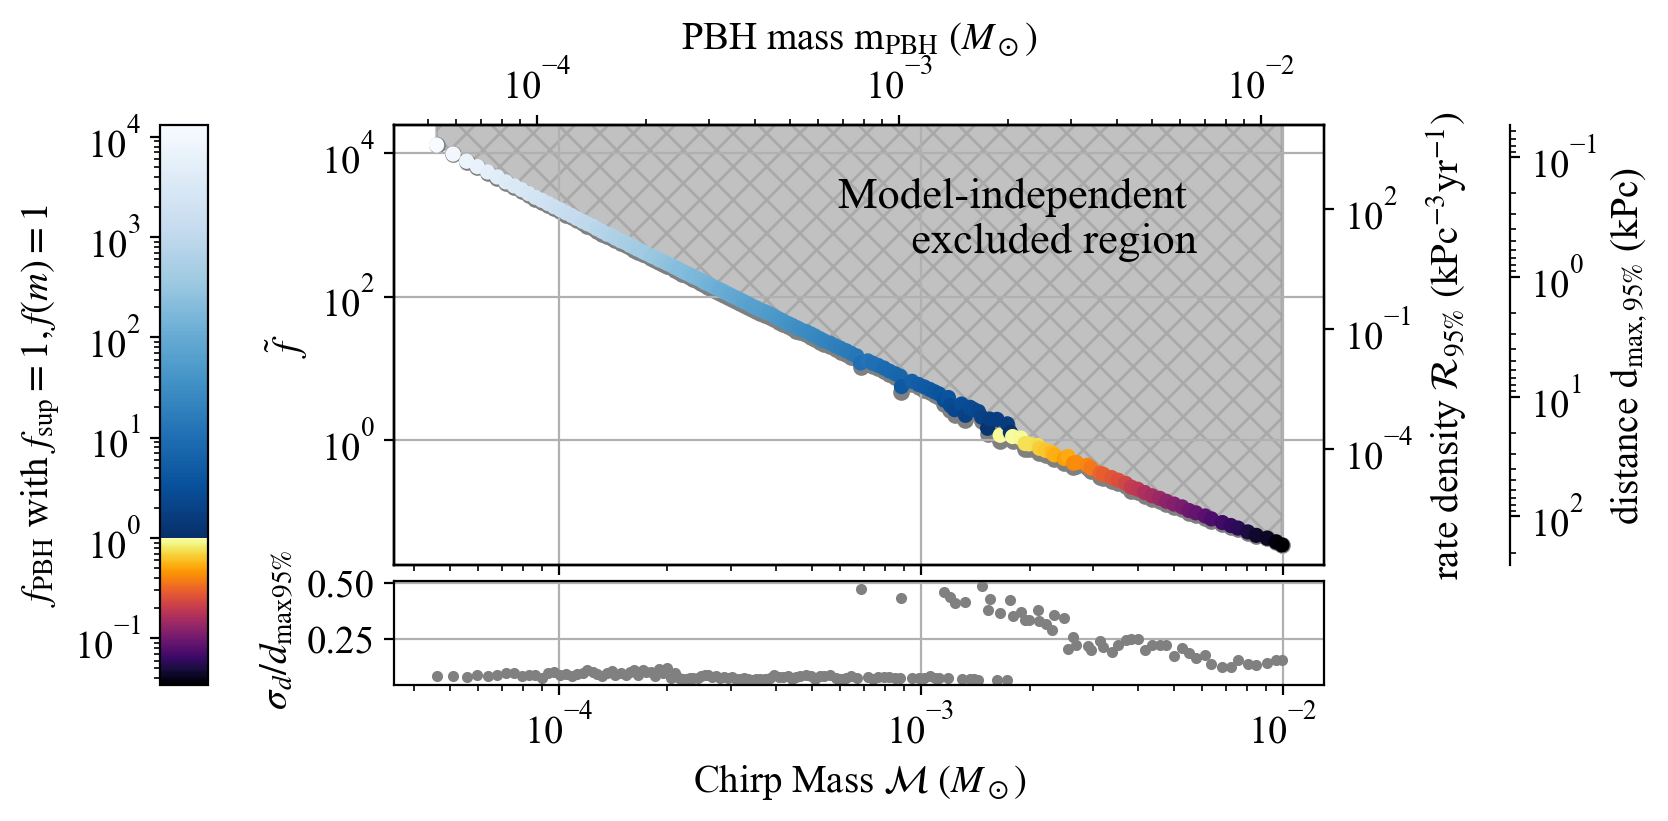
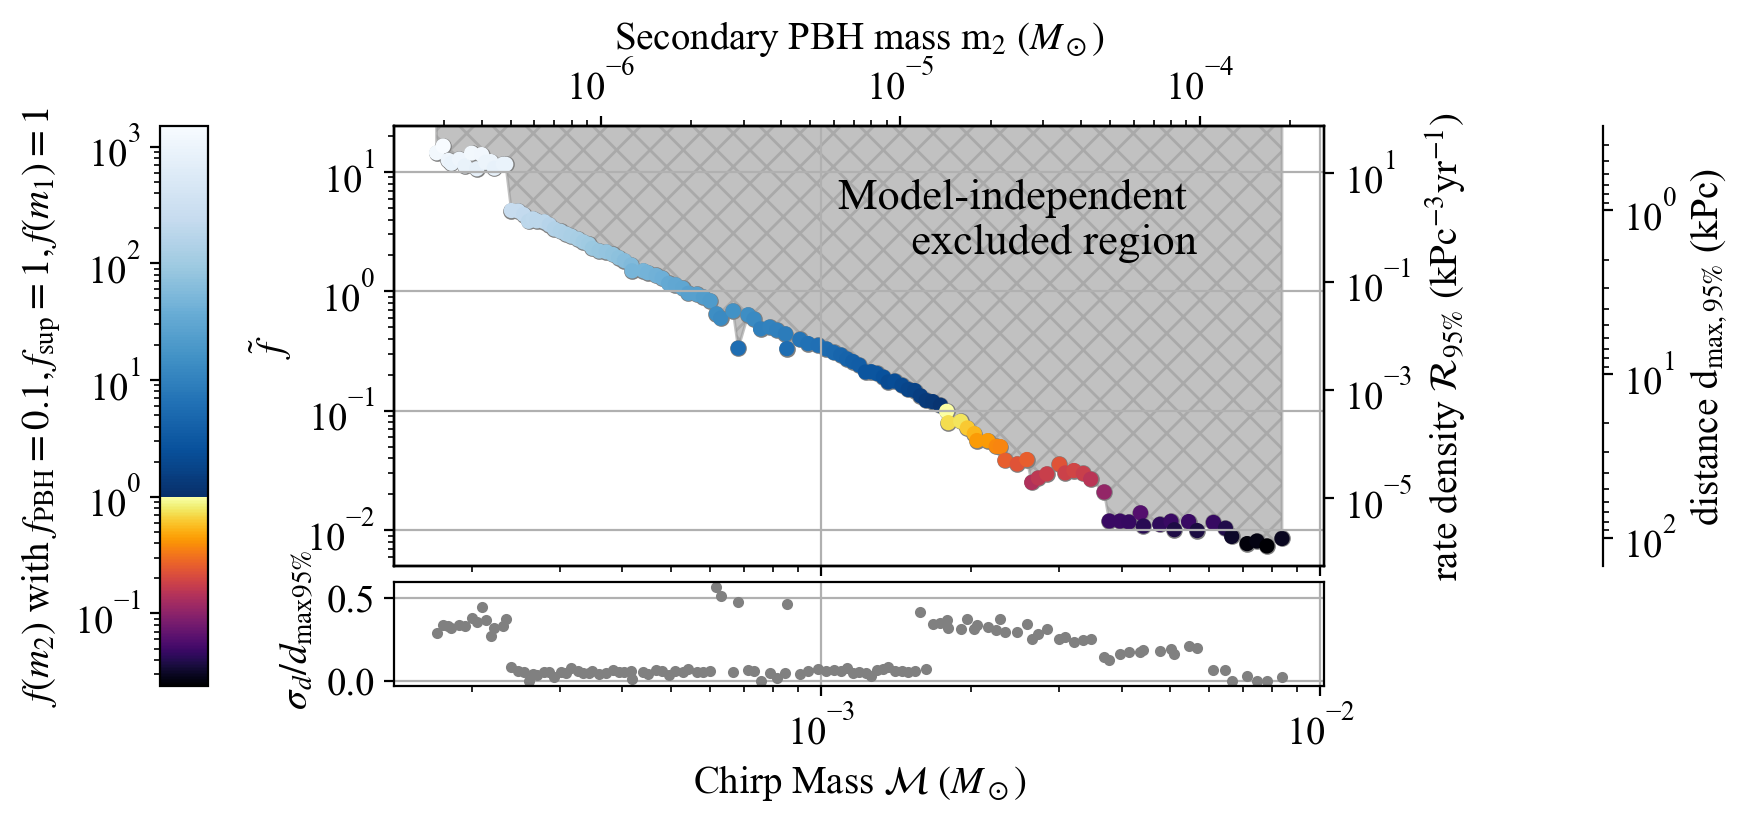
The upper limits on distance reach and rate densities are shown in Fig. 3 and Fig. 4 for the equal-mass and asymmetric mass-ratio cases, respectively. Note that these figures look different because we only place limits when we can ensure that the 0PN waveform does not differ by more than one frequency bin from the 3.5PN waveform during (see App. A). Thus, with our method, asymmetric mass ratio systems are harder to constrain than equal-mass ones, since the mass ratio enters at 1PN and thus causes larger deviations from the 0PN waveform than those induced in the equal-mass case.
IV.2 Constraints on primordial black holes
To specialize our results to PBHs, we use the analytical formulas from Raidal et al. (2019); Hütsi et al. (2021) for the cosmological merger rates that assume a purely Poissonian PBH spatial separation at formation, given by:
| (8) | |||||
which correspond to the rate per unit of logarithmic mass of the two binary black hole components and . is the fraction of DM that PBHs could compose, and is the mass distribution function of PBHs normalized to one (). We include , which accounts for rate suppression due to the gravitational influence of early forming PBH clusters, nearby PBHs and matter inhomogeneities Raidal et al. (2019). As in Miller et al. (2021a), we calculate the expected merging rates locally by assuming a constant local DM density of Weber and de Boer (2010) consistent with the galactic DM profile. In this way, we obtain Miller et al. (2021b).
For , a typical choice is Hütsi et al. (2021); Clesse and Garcia-Bellido (2022); Raidal et al. (2019). However, this value depends on how wide the mass function is, how high the mass ratio and eccentricity of the binary are, and whether external tidal fields affect binary evolution Eroshenko (2018); Cholis et al. (2016). We therefore provide limits on an effective parameter , defined to be model-agnostic:
| (9) |
First, we constrain equal-mass PBH merger rate densities and denote this mass , for which
| (10) |
Upper limits on are shown in Fig. 3, which are the first to probe . We also provide constraints on assuming a monochromatic mass function and no rate suppression, which is below 1 for .
Because our search is primarily sensitive to the chirp mass of the binary, we can also place constraints on systems with highly asymmetric mass ratios, assuming negligible eccentricity, for which formation rates are larger by several orders of magnitude. Since PBHs are well-motivated by observations of merging black holes in the stellar-mass range, we consider systems with , as motivated by the QCD transition Byrnes et al. (2018); Carr et al. (2021); Clesse and Garcia-Bellido (2022), and GW190425/GW190814 Clesse and Garcia-Bellido (2022), in a binary with a much lighter PBH of mass . We therefore consider the merging rate density in the limit :
| (11) | |||||
and constrain as a function of in Fig. 4
To place a constraint on , we assume that the mass function is dominated by , i.e. , which would be expected for broad mass functions affected by the QCD transition, implying . If we assume a model in which and , we can translate these limits to constrain , which are also shown in Fig. 4. We see exclusions () when .
V Conclusions
We have presented here results from the first-ever search for GWs from inspiraling planetary-mass PBH binaries. Our results indicate that, depending on the chirp mass of the system, that we could be sensitive to binary PBHs that formed between [0.1,100] kpc away from us. Furthermore, we show that equal-mass PBH binaries with could compose under 10% of DM, assuming no rate suppression and monochromatic mass functions. For asymmetric mass ratio systems, we can constrain to be less than if and , assuming . Note that, based on App. B, our procedure of producing upper limits is conservative compared to those obtained with injections; therefore, if we had more computing power, our constraints would improve.
However, our results neglect eccentricity of the binary, which could induce changes in the waveform, meaning that our method would need to be modified to handle this effect. Or, it may be that model-agnostic methods could be used to find these systems Alestas et al. (2024). Furthermore, our limits on and should be reevaluated if non-Poissonian clustering, e.g. from primordial non-Gaussianity in the initial curvature distribution, occurs. Our work motivates future searches of planetary- and asteroid-mass PBH binaries, and our results will continue to improve when future data becomes available.
Appendix A Search configurations
The searched parameter space is a set of “configurations” of chirp masses and start frequencies. For this work, we restrict the parameter space to configurations for which we anticipate the distance reach to be at least kpc (using Eq. 5 with a nominal sensitivity and a CR of 5); and for which the Doppler modulation to the motion of the earth with respect to the source is confined to one frequency bin for the observing run. We then reject configurations that have more than 90% overlap with another configuration. This selection process results in configurations covering a broad range of , shown in Fig. 1(a). Let us denote these by (, ) where i ranges from 1 to .
For each configuration, there is an optimum and , determined through multiple considerations:
-
a)
The chirp’s frequency modulation, described by Eq. 1 must be confined to half a frequency bin in each FFT, i.e.
(12) -
b)
To ensure that we are indeed sensitive to signals up to 3.5PN, we also require that the difference between the true GW frequency and the GW frequency up to 3.5PN is smaller than the frequency bin of the Fourier transform, i.e.
(13) where is given by Eq. 5.258 in Maggiore (2008).
-
c)
The spin-up increases with time as seen in Eq. 1, decreasing the corresponding allowed (Eq. 12). Since the sensitivity of a search increases with signal amplitude, observation time and Miller et al. (2021a), and inversely with the noise power spectral density, there should exist optimal peakmap duration and that maximize the sensitivity. Fig. 1 shows the optimal frequency bands to search and their corresponding , for given in Fig. 5.
For each configuration, a and is decided, resulting in peakmaps, where is the duration of the analysed observing run (126 days days in this case). A Hough map is then created from each peakmap. The 129 configurations in which we performed the search are given as a .txt file in Zenodo Miller (2024).
Appendix B Upper limits with injections
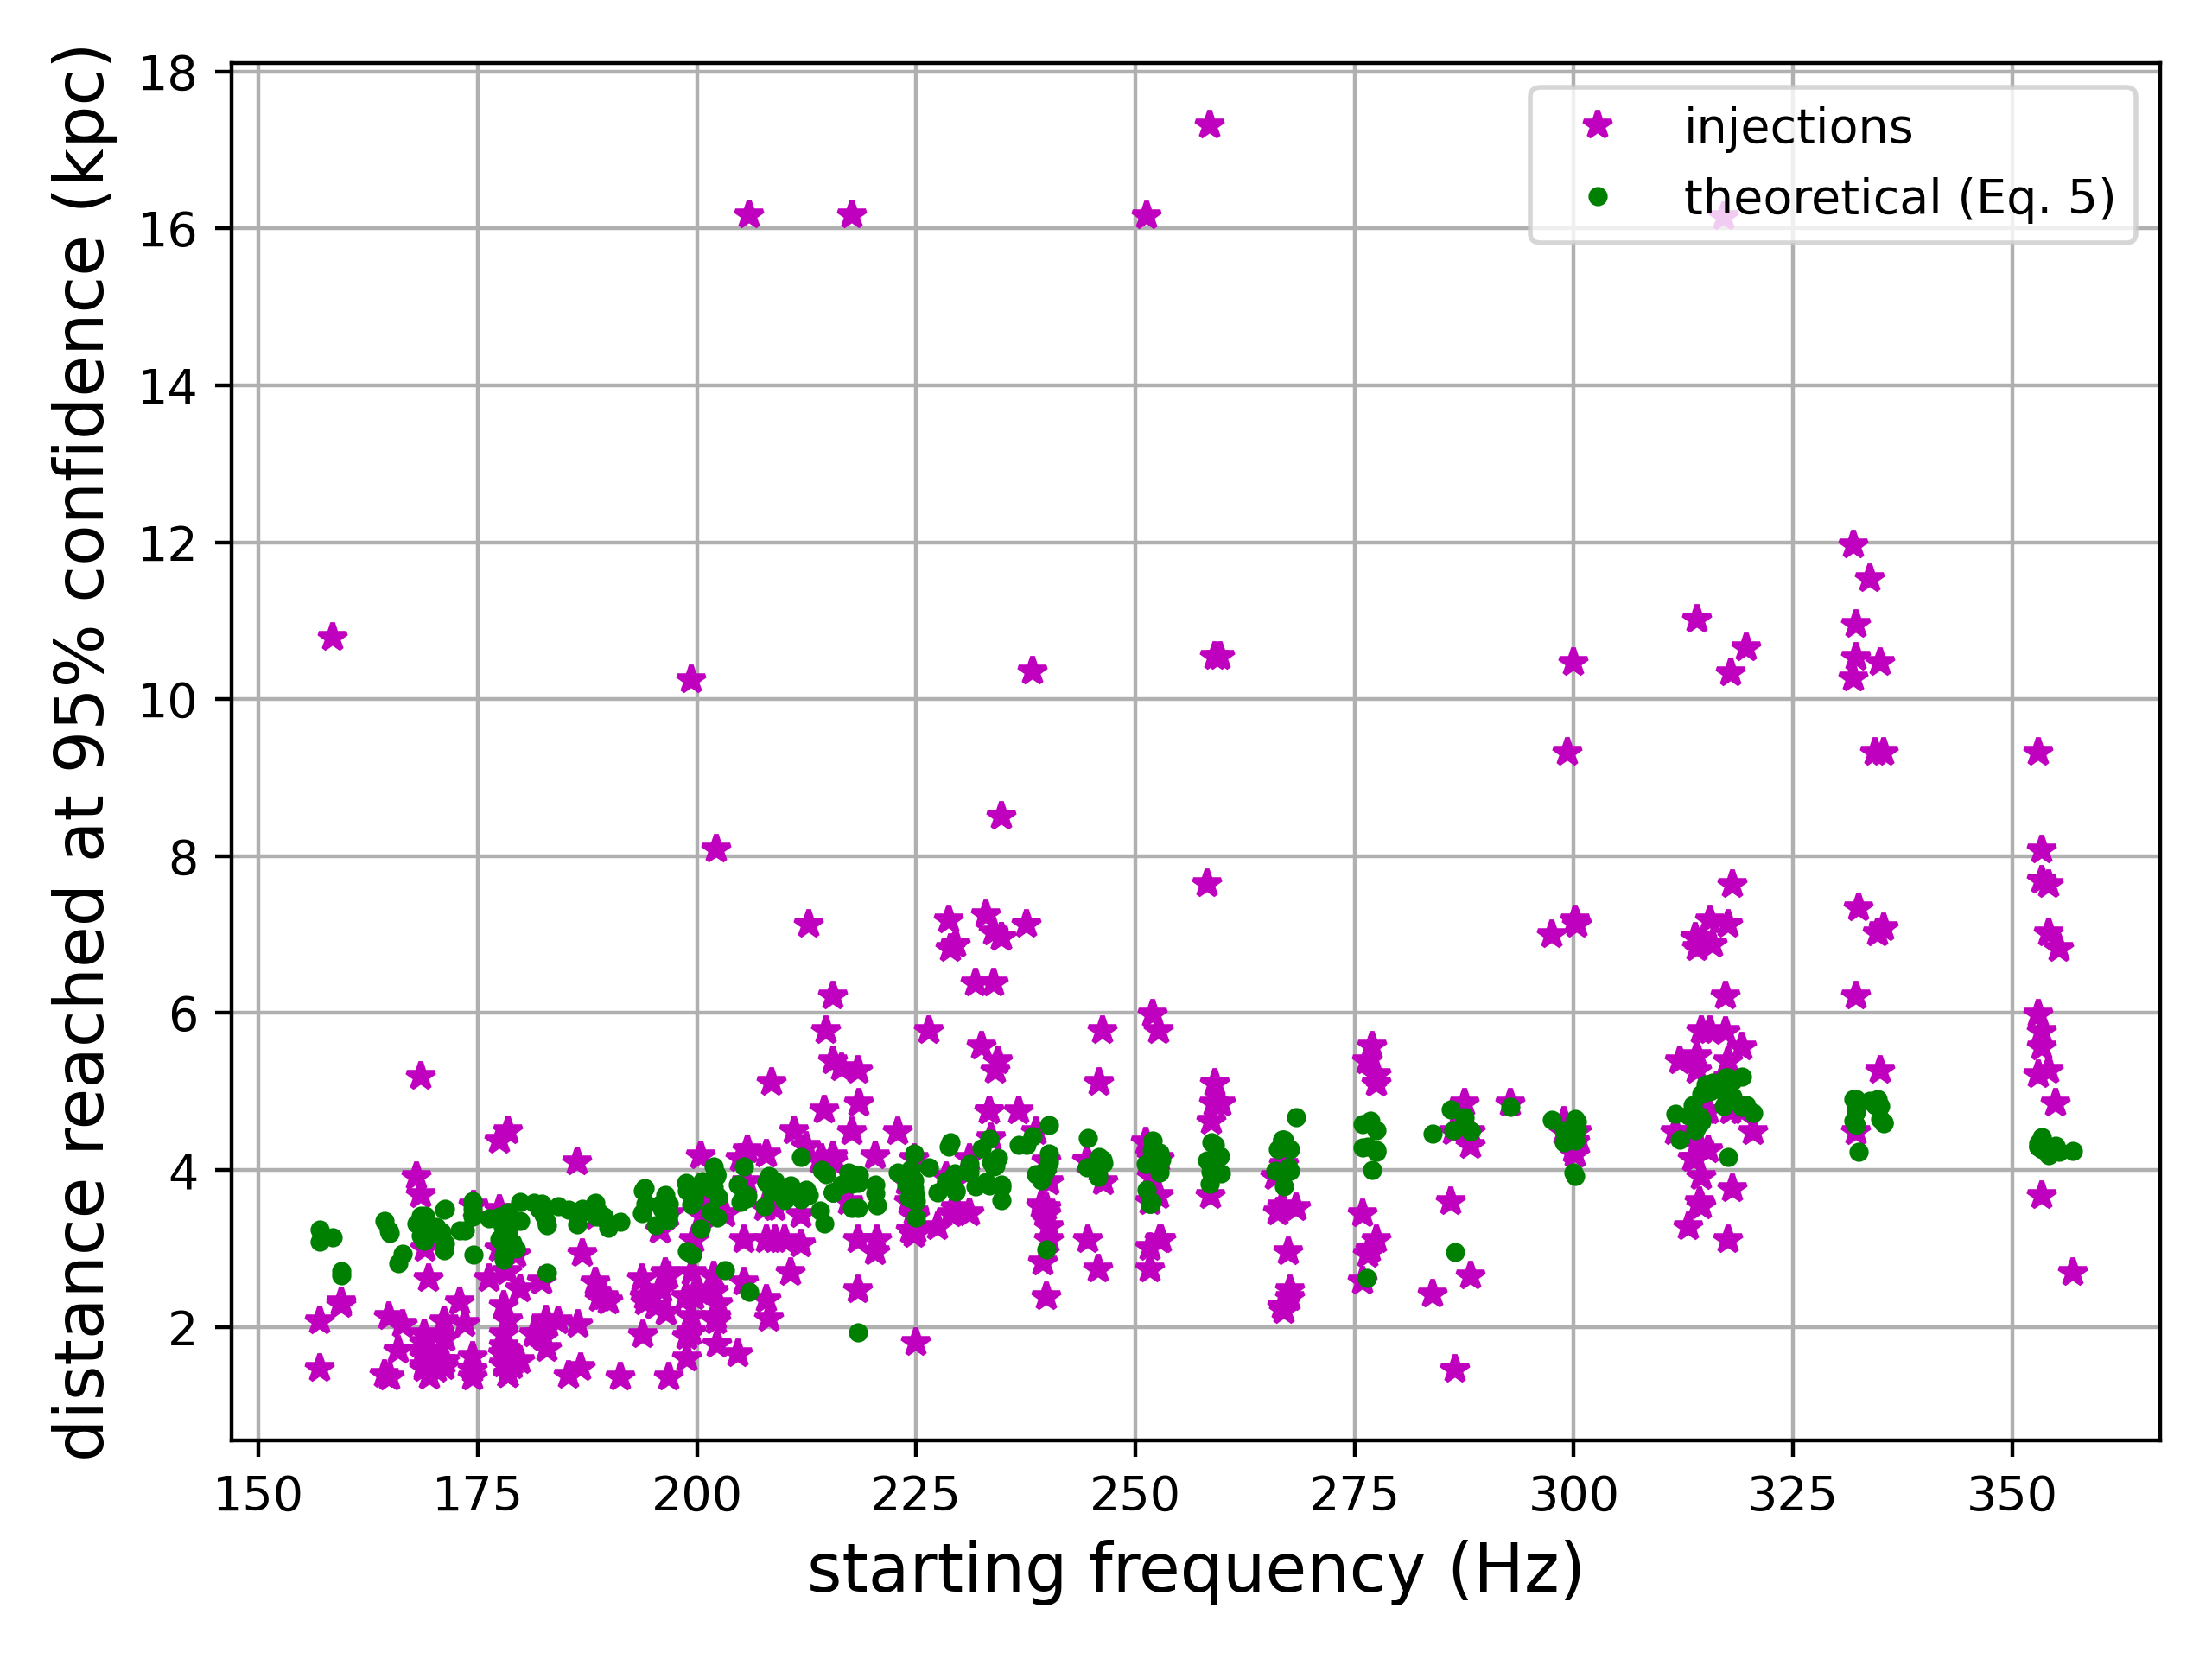
In our discussion of upper limits, we claim that our constraints represent 95% confidence that a source could have been observed a certain distance away from us. In order to verify this, we perform injections based on the candidate parameters found in a certain configuration, at a chirp mass of , across the six months of O3a data. For each candidate that we recover in the real search in this configuration and for a range of distances centered around the one derived in our analytic upper limit procedure, we perform 50 injections in LHO data. We require that we recover the candidate within 3 bins of the injection, and that the CR of the injection is greater than the CR of the candidate returned in the search. We find generally good agreement: after accounting for the non-science data and duty cycle () of the detector, and the fact LHO is about a factor of less sensitive in strain with respect to LLO Abbott et al. (2021), we find a median of kpc with standard deviation of kpc from injections, and a median of kpc with standard deviation of kpc from our upper limit procedure. In Fig. 6, we show, candidate by candidate, the distance reach at 95% confidence obtained theoretically through our procedure and with injections.
Acknowledgments
This material is based upon work supported by NSF’s LIGO Laboratory which is a major facility fully funded by the National Science Foundation
We would like to thank the Rome Virgo group for the tools necessary to perform these studies, such as the development of the original frequency-Hough transform and the development of the short FFT databases. Additionally we would like to thank Luca Rei for managing data transfers.
This research has made use of data, software and/or web tools obtained from the Gravitational Wave Open Science Center (https://www.gw-openscience.org/ ), a service of LIGO Laboratory, the LIGO Scientific Collaboration and the Virgo Collaboration. LIGO Laboratory and Advanced LIGO are funded by the United States National Science Foundation (NSF) as well as the Science and Technology Facilities Council (STFC) of the United Kingdom, the Max-Planck-Society (MPS), and the State of Niedersachsen/Germany for support of the construction of Advanced LIGO and construction and operation of the GEO600 detector. Additional support for Advanced LIGO was provided by the Australian Research Council. Virgo is funded, through the European Gravitational Observatory (EGO), by the French Centre National de Recherche Scientifique (CNRS), the Italian Istituto Nazionale della Fisica Nucleare (INFN) and the Dutch Nikhef, with contributions by institutions from Belgium, Germany, Greece, Hungary, Ireland, Japan, Monaco, Poland, Portugal, Spain.
We also wish to acknowledge the support of the INFN-CNAF computing center for its help with the storage and transfer of the data used in this paper.
We would like to thank all of the essential workers who put their health at risk during the COVID-19 pandemic, without whom we would not have been able to complete this work.
F.D.L. is supported by a FRIA (Fonds pour la formation à la Recherche dans l’Industrie et dans l’Agriculture) Grant of the Belgian Fund for Research, F.R.S.-FNRS (Fonds de la Recherche Scientifique-FNRS).
This work is partially supported by ICSC – Centro Nazionale di Ricerca in High Performance Computing, Big Data and Quantum Computing, funded by European Union – NextGenerationEU.
References
- Miller (2024) A. L. Miller, “Data release for Gravitational wave constraints on planetary-mass primordial black holes using LIGO O3a data,” (2024).
- Aasi et al. (2015) J. Aasi, B. Abbott, R. Abbott, T. Abbott, M. Abernathy, K. Ackley, C. Adams, T. Adams, P. Addesso, R. Adhikari, et al., Classical and quantum gravity 32, 074001 (2015).
- Acernese et al. (2014) F. Acernese, M. Agathos, K. Agatsuma, D. Aisa, N. Allemandou, A. Allocca, J. Amarni, P. Astone, G. Balestri, G. Ballardin, et al., Classical and Quantum Gravity 32, 024001 (2014).
- Abbott et al. (2016a) B. Abbott et al. (LIGO Scientific Collaboration, Virgo), Phys. Rev. Lett. 116, 061102 (2016a), arXiv:1602.03837 [gr-qc] .
- Abbott et al. (2016b) B. Abbott et al. (LIGO Scientific Collaboration, Virgo), Phys. Rev. X 6, 041015 (2016b), [Erratum: Phys.Rev.X 8, 039903 (2018)], arXiv:1606.04856 [gr-qc] .
- Abbott et al. (2016c) B. P. Abbott et al. (LIGO Scientific Collaboration, Virgo), Phys. Rev. Lett. 116, 241103 (2016c), arXiv:1606.04855 [gr-qc] .
- Abbott et al. (2017a) B. P. Abbott et al. (LIGO Scientific Collaboration, Virgo), Phys. Rev. Lett. 118, 221101 (2017a), [Erratum: Phys.Rev.Lett. 121, 129901 (2018)], arXiv:1706.01812 [gr-qc] .
- Abbott et al. (2017b) B. P. Abbott et al. (LVC), Phys. Rev. Lett. 119, 141101 (2017b), arXiv:1709.09660 [gr-qc] .
- Abbott et al. (2017c) B. P. Abbott et al. (LIGO Scientific Collaboration, Virgo), Astrophys. J. 851, L35 (2017c), arXiv:1711.05578 [astro-ph.HE] .
- Abbott et al. (2019a) B. P. Abbott et al. (LIGO Scientific Collaboration, Virgo), Phys. Rev. X9, 031040 (2019a), arXiv:1811.12907 [astro-ph.HE] .
- Abbott et al. (2020a) R. Abbott et al. (LIGO Scientific Collaboration, Virgo), Phys. Rev. D 102, 043015 (2020a), arXiv:2004.08342 [astro-ph.HE] .
- Abbott et al. (2020b) B. Abbott et al. (LIGO Scientific Collaboration, Virgo), Astrophys. J. Lett. 892, L3 (2020b), arXiv:2001.01761 [astro-ph.HE] .
- Abbott et al. (2020c) R. Abbott et al. (LIGO Scientific Collaboration, Virgo), Astrophys. J. 896, L44 (2020c), arXiv:2006.12611 [astro-ph.HE] .
- Abbott et al. (2020d) R. Abbott et al. (LIGO Scientific Collaboration, Virgo), Phys. Rev. Lett. 125, 101102 (2020d), arXiv:2009.01075 [gr-qc] .
- Abbott et al. (2020e) R. Abbott et al. (LIGO Scientific Collaboration, Virgo), Astrophys. J. 900, L13 (2020e), arXiv:2009.01190 [astro-ph.HE] .
- Bird et al. (2016) S. Bird, I. Cholis, J. B. Muñoz, Y. Ali-Haïmoud, M. Kamionkowski, E. D. Kovetz, A. Raccanelli, and A. G. Riess, Phys. Rev. Lett. 116, 201301 (2016).
- Clesse and García-Bellido (2017) S. Clesse and J. García-Bellido, Phys. Dark Universe 15, 142 (2017).
- Sasaki et al. (2016) M. Sasaki, T. Suyama, T. Tanaka, and S. Yokoyama, Phys. Rev. Lett. 117, 061101 (2016), [erratum: Phys. Rev. Lett.121,no.5,059901(2018)], arXiv:1603.08338 [astro-ph.CO] .
- Carr et al. (2021) B. Carr, S. Clesse, J. García-Bellido, and F. Kühnel, Phys. Dark Univ. 31, 100755 (2021), arXiv:1906.08217 [astro-ph.CO] .
- Byrnes et al. (2018) C. T. Byrnes, M. Hindmarsh, S. Young, and M. R. S. Hawkins, JCAP 08, 041 (2018), arXiv:1801.06138 [astro-ph.CO] .
- Jedamzik (2020) K. Jedamzik, JCAP 09, 022 (2020), arXiv:2006.11172 [astro-ph.CO] .
- Jedamzik (2021) K. Jedamzik, Phys. Rev. Lett. 126, 051302 (2021), arXiv:2007.03565 [astro-ph.CO] .
- De Luca et al. (2021) V. De Luca, G. Franciolini, and A. Riotto, Phys. Rev. Lett. 126, 041303 (2021), arXiv:2009.08268 [astro-ph.CO] .
- Escrivà et al. (2022) A. Escrivà, F. Kuhnel, and Y. Tada, (2022), arXiv:2211.05767 [astro-ph.CO] .
- Ali-Haimoud et al. (2017) Y. Ali-Haimoud, E. D. Kovetz, and M. Kamionkowski, Phys. Rev. D 96, 123523 (2017), arXiv:1709.06576 [astro-ph.CO] .
- Hall et al. (2020) A. Hall, A. D. Gow, and C. T. Byrnes, Phys. Rev. D 102, 123524 (2020), arXiv:2008.13704 [astro-ph.CO] .
- De Luca et al. (2020) V. De Luca, V. Desjacques, G. Franciolini, and A. Riotto, JCAP 11, 028 (2020), arXiv:2009.04731 [astro-ph.CO] .
- Clesse and García-Bellido (2018) S. Clesse and J. García-Bellido, Physics of the Dark Universe 22, 137 (2018).
- Boehm et al. (2021) C. Boehm, A. Kobakhidze, C. A. J. O’hare, Z. S. C. Picker, and M. Sakellariadou, JCAP 03, 078 (2021), arXiv:2008.10743 [astro-ph.CO] .
- Clesse and Garcia-Bellido (2022) S. Clesse and J. Garcia-Bellido, Phys. Dark Univ. 38, 101111 (2022), arXiv:2007.06481 [astro-ph.CO] .
- Bagui et al. (2023) E. Bagui et al. (LISA Cosmology Working Group), (2023), arXiv:2310.19857 [astro-ph.CO] .
- Yamamoto et al. (2023) T. S. Yamamoto, R. Inui, Y. Tada, and S. Yokoyama, (2023), arXiv:2401.00044 [gr-qc] .
- Niemeyer and Jedamzik (1998) J. C. Niemeyer and K. Jedamzik, Phys. Rev. Lett. 80, 5481 (1998), arXiv:astro-ph/9709072 .
- Jedamzik (1997) K. Jedamzik, Phys. Rev. D55, R5871 (1997).
- Abbott et al. (2018) B. P. Abbott et al. (LIGO Scientific Collaboration, Virgo), Phys. Rev. Lett. 121, 231103 (2018), arXiv:1808.04771 [astro-ph.CO] .
- Abbott et al. (2019b) B. Abbott, R. Abbott, T. Abbott, S. Abraham, F. Acernese, K. Ackley, C. Adams, R. Adhikari, V. Adya, C. Affeldt, et al., Physical review letters 123, 161102 (2019b).
- Nitz and Wang (2021a) A. H. Nitz and Y.-F. Wang, Phys. Rev. Lett. 126, 021103 (2021a), arXiv:2007.03583 [astro-ph.HE] .
- Horowitz et al. (2020) C. Horowitz, M. Papa, and S. Reddy, Physics Letters B 800, 135072 (2020).
- Nitz and Wang (2021b) A. H. Nitz and Y.-F. Wang, Phys. Rev. Lett. 127, 151101 (2021b), arXiv:2106.08979 [astro-ph.HE] .
- Abbott et al. (2022a) R. Abbott et al. (LIGO Scientific Collaboration, Virgo, KAGRA), Phys. Rev. Lett. 129, 061104 (2022a), arXiv:2109.12197 [astro-ph.CO] .
- Abbott et al. (2023) R. Abbott et al. (LIGO Scientific, VIRGO, KAGRA), Mon. Not. Roy. Astron. Soc. 524, 5984 (2023), [Erratum: Mon.Not.Roy.Astron.Soc. 526, 6234 (2023)], arXiv:2212.01477 [astro-ph.HE] .
- Phukon et al. (2021) K. S. Phukon, G. Baltus, S. Caudill, S. Clesse, A. Depasse, M. Fays, H. Fong, S. J. Kapadia, R. Magee, and A. J. Tanasijczuk, (2021), arXiv:2105.11449 [astro-ph.CO] .
- Prunier et al. (2023) M. Prunier, G. Morrás, J. F. N. n. Siles, S. Clesse, J. García-Bellido, and E. Ruiz Morales, (2023), arXiv:2311.16085 [gr-qc] .
- Miller et al. (2021a) A. L. Miller et al., Phys. Rev. D 103, 103002 (2021a), arXiv:2010.01925 [astro-ph.IM] .
- Andrés-Carcasona et al. (2023) M. Andrés-Carcasona, O. J. Piccinni, M. Martínez, and L.-M. Mir, PoS EPS-HEP2023, 067 (2023).
- Alestas et al. (2024) G. Alestas, G. Morras, T. S. Yamamoto, J. Garcia-Bellido, S. Kuroyanagi, and S. Nesseris, (2024), arXiv:2401.02314 [astro-ph.CO] .
- Niikura et al. (2019) H. Niikura, M. Takada, S. Yokoyama, T. Sumi, and S. Masaki, Phys. Rev. D99, 083503 (2019), arXiv:1901.07120 [astro-ph.CO] .
- Hawkins (2020) M. R. S. Hawkins, Astron. Astrophys. 633, A107 (2020), arXiv:2001.07633 [astro-ph.GA] .
- Bhatiani et al. (2019) S. Bhatiani, X. Dai, and E. Guerras, The Astrophysical Journal 885, 77 (2019).
- Croon et al. (2020) D. Croon, D. McKeen, N. Raj, and Z. Wang, Phys. Rev. D 102, 083021 (2020), arXiv:2007.12697 [astro-ph.CO] .
- Tisserand et al. (2007) P. Tisserand et al. (EROS-2), Astron. Astrophys. 469, 387 (2007), arXiv:astro-ph/0607207 .
- García-Bellido and Clesse (2018) J. García-Bellido and S. Clesse, Phys. Dark Univ. 19, 144 (2018), arXiv:1710.04694 [astro-ph.CO] .
- Calcino et al. (2018) J. Calcino, J. Garcia-Bellido, and T. M. Davis, Mon. Not. Roy. Astron. Soc. 479, 2889 (2018), arXiv:1803.09205 [astro-ph.CO] .
- Belotsky et al. (2019) K. M. Belotsky, V. I. Dokuchaev, Y. N. Eroshenko, E. A. Esipova, M. Y. Khlopov, L. A. Khromykh, A. A. Kirillov, V. V. Nikulin, S. G. Rubin, and I. V. Svadkovsky, Eur. Phys. J. C 79, 246 (2019), arXiv:1807.06590 [astro-ph.CO] .
- Trashorras et al. (2021) M. Trashorras, J. García-Bellido, and S. Nesseris, Universe 7, 18 (2021), arXiv:2006.15018 [astro-ph.CO] .
- Maggiore (2008) M. Maggiore, Gravitational Waves: Volume 1: Theory and Experiments, Vol. 1 (Oxford University Press, 2008).
- Miller et al. (2018) A. Miller et al., Phys. Rev. D 98, 102004 (2018), arXiv:1810.09784 [astro-ph.IM] .
- Miller et al. (2021b) A. L. Miller, S. Clesse, F. De Lillo, G. Bruno, A. Depasse, and A. Tanasijczuk, Phys. Dark Univ. 32, 100836 (2021b), arXiv:2012.12983 [astro-ph.HE] .
- Astone et al. (2005) P. Astone, S. Frasca, and C. Palomba, Class. Quant. Grav. 22, S1197 (2005).
- Astone et al. (2014) P. Astone, A. Colla, S. D’Antonio, S. Frasca, and C. Palomba, Physical Review D 90, 042002 (2014).
- Sun et al. (2020) L. Sun et al., Class. Quant. Grav. 37, 225008 (2020), arXiv:2005.02531 [astro-ph.IM] .
- Acernese et al. (2018) F. Acernese et al. (Virgo), Class. Quant. Grav. 35, 205004 (2018), arXiv:1807.03275 [gr-qc] .
- Abbott et al. (2021) R. Abbott et al. (LIGO Scientific Collaboration, Virgo), Phys. Rev. X 11, 021053 (2021), arXiv:2010.14527 [gr-qc] .
- Davis et al. (2021) D. Davis et al. (LIGO), Class. Quant. Grav. 38, 135014 (2021), arXiv:2101.11673 [astro-ph.IM] .
- Vajente et al. (2020) G. Vajente, Y. Huang, M. Isi, J. C. Driggers, J. S. Kissel, M. J. Szczepanczyk, and S. Vitale, Phys. Rev. D 101, 042003 (2020), arXiv:1911.09083 [gr-qc] .
- Miller et al. (2024) A. L. Miller, N. Singh, and C. Palomba, Phys. Rev. D 109, 043021 (2024), arXiv:2309.15808 [astro-ph.IM] .
- Dupuis and Woan (2005) R. J. Dupuis and G. Woan, Phys. Rev. D 72, 102002 (2005), arXiv:gr-qc/0508096 .
- Abbott et al. (2019c) B. P. Abbott et al. (LIGO Scientific Collaboration, Virgo), Astrophys. J. 875, 160 (2019c), arXiv:1810.02581 [gr-qc] .
- Piccinni et al. (2019) O. J. Piccinni, P. Astone, S. D’Antonio, S. Frasca, G. Intini, P. Leaci, S. Mastrogiovanni, A. Miller, C. Palomba, and A. Singhal, Class. Quant. Grav. 36, 015008 (2019), arXiv:1811.04730 [gr-qc] .
- Abbott et al. (2020f) R. Abbott et al. (LIGO Scientific Collaboration, Virgo), Astrophys. J. Lett. 902, L21 (2020f), arXiv:2007.14251 [astro-ph.HE] .
- Abbott et al. (2022b) R. Abbott et al. (LIGO Scientific Collaboration, VIRGO, KAGRA), Astrophys. J. 935, 1 (2022b), arXiv:2111.13106 [astro-ph.HE] .
- Feldman and Cousins (1998) G. J. Feldman and R. D. Cousins, Phys. Rev. D 57, 3873 (1998), arXiv:physics/9711021 .
- Abbott et al. (2022c) R. Abbott et al. (LIGO Scientific Collaboration, Virgo, KAGRA), Phys. Rev. D 106, 102008 (2022c), arXiv:2201.00697 [gr-qc] .
- Miller et al. (2022) A. L. Miller, N. Aggarwal, S. Clesse, and F. De Lillo, Phys. Rev. D 105, 062008 (2022), arXiv:2110.06188 [gr-qc] .
- Biswas et al. (2009) R. Biswas, P. R. Brady, J. D. E. Creighton, and S. Fairhurst, Class. Quant. Grav. 26, 175009 (2009), [Erratum: Class.Quant.Grav. 30, 079502 (2013)], arXiv:0710.0465 [gr-qc] .
- Raidal et al. (2019) M. Raidal, C. Spethmann, V. Vaskonen, and H. Veermäe, Journal of Cosmology and Astroparticle Physics 2019, 018 (2019).
- Hütsi et al. (2021) G. Hütsi, M. Raidal, V. Vaskonen, and H. Veermäe, JCAP 03, 068 (2021), arXiv:2012.02786 [astro-ph.CO] .
- Weber and de Boer (2010) M. Weber and W. de Boer, Astron. Astrophys. 509, A25 (2010), arXiv:0910.4272 [astro-ph.CO] .
- Eroshenko (2018) Y. N. Eroshenko, J. Phys. Conf. Ser. 1051, 012010 (2018), arXiv:1604.04932 [astro-ph.CO] .
- Cholis et al. (2016) I. Cholis, E. D. Kovetz, Y. Ali-Haïmoud, S. Bird, M. Kamionkowski, J. B. Muñoz, and A. Raccanelli, Phys. Rev. D 94, 084013 (2016), arXiv:1606.07437 [astro-ph.HE] .