11email: acrespo@cab.inta-csic.es 22institutetext: Department of Astronomy, Stockholm University, Oscar Klein Centre, AlbaNova University Centre, 106 91 Stockholm, Sweden 33institutetext: Max-Planck-Institut für Astronomie, Königstuhl 17, 69117 Heidelberg, Germany 44institutetext: I.Physikalisches Institut der Universität zu Köln, Zülpicher Str. 77, 50937 Köln, Germany 55institutetext: Centro de Astrobiología (CAB), CSIC-INTA, Camino Viejo del Castillo s/n, 28692 Villanueva de la Cañada, Madrid, Spain 66institutetext: Telespazio UK for the European Space Agency, ESAC, Camino Bajo del Castillo s/n, 28692 Villanueva de la Cañada, Spain 77institutetext: Cosmic Dawn Center, DTU Space, Technical University of Denmark, Elektrovej 327, 2800 Kgs. Lyngby, Denmark 88institutetext: Cosmic Dawn Centre, Copenhagen, Denmark 99institutetext: Department of Physics and Astronomy, University College London, Gower Place, London WC1E 6BT, UK 1010institutetext: UK Astronomy Technology Centre, Royal Observatory Edinburgh, Blackford Hill, Edinburgh EH9 3HJ, UK 1111institutetext: Kapteyn Astronomical Institute, University of Groningen, P.O. Box 800, 9700 AV Groningen, The Netherlands 1212institutetext: European Space Agency, Space Telescope Science Institute, Baltimore, Maryland, USA 1313institutetext: DARK, Niels Bohr Institute, University of Copenhagen, Jagtvej 128, 2200 Copenhagen, Denmark 1414institutetext: School of Physics & Astronomy, Space Research Centre, Space Park Leicester, University of Leicester, 92 Corporation Road, Leicester, LE4 5SP, UK 1515institutetext: Leiden Observatory, Leiden University, PO Box 9513, 2300 RA Leiden, The Netherlands 1616institutetext: Université Paris-Saclay, Université Paris Cité, CEA, CNRS, AIM, F-91191 Gif-sur-Yvette, France
JWST/MIRI unveils the stellar component of the GN20 dusty galaxy overdensity at =4.05
Dusty star-forming galaxies (DSFGs) at ¿ 2 have been commonly observed in overdense regions, where the merging processes and large halo masses induce rapid gas accretion, triggering star-formation rates (SFRs) up to 1000 yr-1. Despite the importance of these DSFGs for understanding the star-formation in the early Universe, their stellar distributions traced by the near-IR emission were spatially unresolved until the arrival of the JWST. In this work we present, for the first time, a spatially-resolved morphological analysis of the rest-frame near-IR ( 1.1 3.5 m) emission in DSFGs traced with the JWST/MIRI F560W, F770W, F1280W and F1800W filters. In particular, we study the mature stellar component for the three DSFGs and a Lyman-break galaxy (LBG) present in an overdensity at = 4.05. Moreover, we use these rest-frame near-IR images along with ultraviolet (UV) and (sub)-mm ancillary photometric data to model their spectral energy distributions (SEDs) and extract their main physical properties (e.g., , SFR, ). The sub-arcsec resolution images from the JWST have revealed that the light distributions in these galaxies present a wide range of morphologies, from disc-like to compact and clump-dominated structures. Two DSFGs and the LBG are classified as late-type galaxies (LTGs) according to non-parametric morphological indices, while the remaining DSFG is an early-type galaxy (ETG). These near-IR structures contrast with their UV emission, which is diffuse and, in GN20 and GN20.2b, off-centered by 4 kpc. This result suggests that the star-formation occurs across the entire galaxy, while the UV light traces only those regions where the otherwise high internal extinction decreases significantly. The SED fitting analysis yields large SFRs ( 300 2500 yr-1), large stellar masses (log(/ )=10.3011.25) and high integrated extinction values (=0.81.5 mag) for our galaxies. In particular, we observe that GN20 dominates the total SFR with a value 2500 yr-1 while GN20.2b has the highest stellar mass ( 2 1011 ). The two DSFGs classified as LTGs (GN20 and GN20.2a) have high specific SFR (sSFR ¿ 30 Gyr-1) placing them above the star-forming main sequence (SFMS) at z 4 by 0.5 dex, while the ETG (i.e., GN20.2b) is compatible with the high-mass end of the main sequence. When comparing with other DSFGs in overdensities at 2 7, we observe that our objects present similar SFRs, depletion times and projected separations. Nevertheless, the effective radii computed for our DSFGs ( 2 4 kpc) are up to two times larger than those of isolated galaxies observed in CEERS and ALMA-HUDF at similar redshifts. We interpret this difference as an effect of rapid growth induced by the dense environment.
Key Words.:
Infrared: galaxies - Galaxies: high-redshift - Galaxies: starburst - Galaxies: individual: GN20, GN20.2a, GN20.2b, BD290791 Introduction
Dusty star-forming galaxies (DSFGs) are massive, compact and extremely infrared-bright galaxies which are characterised by their intense starburst episodes, with star-formation rates (SFR) larger than 200 yr-1 due to their large gas and dust reservoirs (see Casey et al. 2014, for a review). These starburst galaxies, previously classified as sub-millimetre galaxies (SMGs) due to their strong emission at these wavelengths (Smail et al., 1997; Barger et al., 1998; Hughes et al., 1998; Borys et al., 2003), are key to understand the star-formation history (SFH) across the Universe (see Madau & Dickinson, 2014, for a review) as they dominate the cosmic star-formation at 4 (Pérez-González et al., 2005; Zavala et al., 2021). Additionally, these DSFGs are also important to understand the galaxy evolution, since they are thought to be the progenitors of massive quiescent galaxies at z 2 (Valentino et al., 2020). Although DSFGs have a redshift distribution that peaks at 2 3 (Chapman et al., 2005), a significant number of DSFGs have been found at 4 (Walter et al., 2012; Riechers et al., 2013; Strandet et al., 2017; Zavala et al., 2021, 2023). At these redshifts, DSFGs can be widely observed as part of overdensities and proto-clusters (Daddi et al., 2009; Riechers et al., 2010; Oteo et al., 2018; Pavesi et al., 2018). The presence of DSFGs in overdense regions is thought to be the reason for their extreme SFR and short depletion times, as the higher merger probability and larger halo mass would favour the gas accretion, triggering the star formation. In fact, the connection between DSFGs and galaxy overdensities has been shown to be more abundant in the early Universe (Smolčić et al., 2017; Lewis et al., 2018; Arribas et al., 2023; Hashimoto et al., 2023). Studying in detail the physical mechanisms driving the DSFGs in overdensities will provide valuable information on the halo properties and processes (e.g., gas-cooling, dark matter mass, gas accretion, gravitational interactions), which is key to understand the galaxy formation and evolution at the early stages of the Universe.
To date, most of the spatially-resolved analyses carried out in DSFGs at 4 have been focused on their UV and (sub)-mm emission, tracing their very young stellar population and molecular and dust distributions (Carilli et al., 2010; Hodge et al., 2015; Pavesi et al., 2018; Gómez-Guijarro et al., 2019; Hodge et al., 2019). However, the available IR instruments did not allow to spatially resolve these objects, leaving the structure of the host galaxy, traced by mature stellar populations, unknown. The arrival of JWST (Gardner et al., 2023) has changed this scenario, bringing the opportunity of observing the rest-frame optical and near-IR emission of these galaxies with unprecedented sensitivity and angular resolution (Álvarez-Márquez et al., 2023; Colina et al., 2023; Zavala et al., 2023). Particularly, the rest-frame near-IR light captured by the JWST at 45 is emitted by red giants and supergiants stars created 100 Myr ago, tracing a mature stellar population. In addition, IR wavelengths are less affected by dust extinction than the optical and UV, which makes the mid-IR filters of MIRI (Rieke et al., 2015; Wright et al., 2015, 2023) become the optimal option to investigate the true stellar structure in these DSFGs.
In this work, we make use of the great capabilities of the JWST MIRI instrument to analyse the stellar component of 4 spectroscopically-confirmed galaxies (3 of them identified as DSFGs) in an overdensity at 4. This overdensity was first discovered by Daddi et al. (2009), as a serendipitous detection of CO(4-3) emission with the Plateau de Bure Interferometer (PdBI). In that work, the authors confirmed two SMGs at = 4.05 (i.e., GN20 and GN20.2a) and found another tentative object (i.e., GN20.2b) at the same redshift. The authors also discovered a Lyman break galaxy (LBG), named BD29079, at this redshift with Keck spectroscopic data. All these galaxies are within 20 of each other, which at = 4.05 corresponds to a projected separation of 140 kpc. The IR-to-radio spectral energy distribution (SED) analysis of these SMGs revealed very high IR luminosities ( 1 1013 ), whereas their CO kinematics yields dynamical masses larger than 1010 . Using PdBI continuum data along with ancillary multiwavelength (UV-to-radio) photometry, Tan et al. (2013) and Tan et al. (2014) derived that the SMGs in the overdensity are quite massive ((/ ) 10 11) and present large SFRs ( 500 2000 yr-1), classifying them as starburst galaxies. The high resolution of the CO(2-1) emission maps obtained from the VLA allowed Hodge et al. (2013) to find significant offsets ( 0.5 1) between the CO emission and their rest-frame UV counterparts, which suggest either the existence of projected near galaxies emitting this UV light or the presence of a large dust attenuation in the nuclear region of these galaxies. Aside from these 4 spectroscopically-confirmed objects at this redshift, Daddi et al. (2009) found another 10 B-dropout galaxies with photometric redshifts 4 within 25 of GN20. None of these objects show CO(2-1) emission (Hodge et al., 2013) and, to this date, they have not been confirmed spectroscopically. Therefore, in this work we only focus on the 3 DSFGs and the LBG with spectroscopic redshift = 4.05.
The JWST/MIRI filters used in this work, from F560W to F1800W, trace the rest near-infrared emission ( 1.1 3.5 m), filling the gap between the rest-frame UV and the (sub)-mm data and allowing us to observe the stellar structure of these galaxies at sub-arcsec resolution ( 0.25). The paper is organised as follows. Section 2 presents the JWST and HST data used in this work. The morphological analysis based on the rest-frame near-IR emission and the SED fitting carried out in this work is introduced in Sect. 3. In Section 4, we characterise the morphological structure of our sample and present the physical properties derived from the SED fitting. These results are then compared with isolated galaxies at 4 and with a sample of SMGs at 5. The main conclusions and results are summarised in Section 5.
2 Observation and data processing
2.1 JWST/MIRIM data and calibration
The JWST images of the GN20 field were obtained on November 23-24, 2022 using the MIRI imager (MIRIM, Bouchet et al., 2015) in the F560W, F770W, F1280W and F1800W filters as part of the MIRI European Consortium Guaranteed Time (program ID 1264, PI: Colina, L.). The observations were taken using the FASTR1 read-out mode for total integration time of 1498 seconds in a five-dither medium-size cycling pattern for the F560W, F770W and F1280W filters. We obtained the F1800W image as a simultaneous MIRI observation during the acquisition of background-dedicated MRS data (see Bik et al. (2023) for details). Therefore, it presents different observational setup than the rest of the MIRI data with an integration time of 1911 seconds and the 2-point dither pattern with the FASTR1 read-out mode.
All these MIRIM images have been calibrated using the JWST pipeline (v1.12.0) with the context 1140 of the Calibration Reference Data System (CRDS). This CRDS includes the new photometric calibrations considering the temporal evolution and new aperture corrections taking into account the point-spread function (PSF) cruciform. In addition to the general procedure, additional steps have been applied to correct for stripping and background gradients (see details in Álvarez-Márquez et al. 2023). After dithering, the final MIRI images have a scale of 0.06 per pixel. The spatial resolutions of these images are, according to the JWST documentation111https://jwst-docs.stsci.edu/jwst-mid-infrared-instrument/miri-performance/miri-point-spread-functions, FWHM = 0.207, 0.269, 0.420 and 0.591 for the F560W, F770W, F1280W and F1800W filters, respectively.
2.2 HST ancillary data
In addition to the MIRI data, we retrieved ancillary HST images to trace the rest-frame UV counterparts of the objects in our sample. These images are downloaded from the Rainbow Cosmological Surveys Database through its web interface Rainbow Navigator (Barro et al., 2011). Specifically, we downloaded the ACS/WFC F435W, F606W, F770W, F814W and F850LP images, and the WFC3IR F105W, F140W, F125W and F160W images from the CANDELS/SHARDS catalogue presented in Barro et al. (2019). The spatial resolution of these images varies between FWHM 0.10.2 whereas their 5 depth is 27 mag (see Table 2 from Barro et al. 2019 for further details).
2.3 JWST-HST astrometry
Before analysing the data, we set the HST and MIRI images in the same coordinate system. We have used the available GAIA DR3 (Gaia Collaboration et al., 2022) stars within the FoV (usually 3 or 4 of them) to align the images, yielding a typical uncertainty smaller than 40 mas in the final absolute positioning. The typical angular resolutions of the far infrared and sub-millimetre photometric data (e.g., IRAC, Herschel, VLA) used in the SED fitting (see Sect. 3.2) are FWHM 1.5 (Liu et al., 2019), more than 25 times larger than the uncertainties derived from the astrometry alignment. Therefore, we can safely assume that all these photometric values correspond to our galaxies.
3 Analysis
3.1 Surface brightness modelling and non-parametric morphology
To analyse the morphological structure of the DSFGs and the LBG we have performed parametric fits on the F560W and F770W brightness distributions as they have the highest spatial resolution and signal-to-noise (S/N, see Fig. 1). For this modelling we used the Lenstronomy code (Birrer & Amara, 2018), which allows us to perform an MCMC analysis to compute the associated uncertainties of the derived parameters. During the fitting procedure, we considered the empirical PSFs presented in Libralato et al. (2023) as they are a good representation, at better S/N, of the field stars.
The different morphologies shown by our galaxies, ranging from disky to clump-dominated objects (see Fig. 1), demand us to consider different procedures to fit their surface brightness distributions. For GN20 we followed the approach presented in Colina et al. (2023): we considered an extended emission, modelled with a Sérsic profile, and a point-source nucleus. As GN20.2a presents a very similar brightness distribution, we assumed the same approach for this galaxy. GN20.2b, on the other hand, shows a very compact structure. Therefore, we assumed a single Sérsic profile to describe its brightness distribution. A visual inspection of the F560W image of BD29079 shows how this object is composed of 3 bright clumps. Therefore, we consider three point-like sources to model the near-IR emission of this galaxy. In addition, in Sect. 4.1 we discuss whether these clumps are better described as point-like sources or can be fitted with Sérsic profiles.
Along with the brightness distribution modelling, we have also applied the Lucy-Richardson deconvolution algorithm (Lucy, 1974) to the F560W images using its empirical PSF and 10 000 iterations. The basic idea of this approach is to enhance structures that are blended by the PSF wings of brighter sources in the related FoV. After the iterative process, we convolved the resulting delta-maps with a 3-pixel Gaussian kernel filter, as described in detail in Peißker et al. (2022). With the dampened impact of the PSF wings, these convolved maps allow us to observe the intrinsic morphology of the galaxies, revealing sub-structures that are smaller than the MIRI spatial resolution.
In addition, we have also measured non-parametric indices for the near-IR images using the python package Statmorph (Rodriguez-Gomez et al., 2019). We used this code to obtain widely-used statistical values such as the concentration (), asymmetry (), Gini coefficient () and the . These statistical indices have been historically used to classify galaxies by their morphology and to discriminate whether they are under gravitational interaction or not (Bershady et al., 2000; Lotz et al., 2004; Conselice, 2014). To quantify the uncertainties associated with these indices, we performed a Monte Carlo simulation with 500 iterations, adding random noise to the original MIRI images with equal to the root mean square (rms) of their background. During the procedure we masked the additional objects and diffuse emission present within the FoV to guarantee a homogeneous background. Final values and their uncertainties are calculated as the mean and standard deviation of the Monte Carlo simulation results. In Section 4.2, we present these indices and compare our results with the values obtained for the CEERS sample within 0.8 9 (Kartaltepe et al., 2023; Yao et al., 2023) and a sample of SMGs at 5 (Gillman et al., 2023).
3.2 Photometry and SED fitting
Along with the morphological analysis, we have performed an SED fitting for all the galaxies in the sample. For this analysis, we extracted the photometry from the HST and MIRI images, covering the UV and near-IR rest-frame wavelengths from 0.1 m up to 3.6 m. In addition, we also use ancillary photometric data available in the far-IR and (sub)-mm wavelengths, covering up to 650 m rest-frame (Liu et al., 2018).
The targets analysed in this work show a wide range of morphologies in the near-IR while in most of the objects the rest-UV emission is very faint or does not correlate spatially with the rest near-IR (see Fig. 1). Therefore we extracted the photometry considering circular or elliptical apertures, centered on the F560W emission peak, large enough to fully cover both the UV and near-IR emission traced by the HST and MIRI filters, respectively. The typical sizes of these apertures are 0.9 1.7 of radius or semi-major axis ( 6 12 kpc at these redshifts). Before extracting the fluxes, we performed a PSF match to make all the images have the spatial resolution of MIRI/F1280W, which has the largest FWHM within our sample (FWHM = 0.42″) except for F1800W, where the detection of these galaxies is at a lower S/N (see Table 1).
During the photometry extraction, we considered GN20.2b, which shows a very concentrated brightness distribution, as a point-like source and we apply aperture corrections using the empirical PSFs presented in Libralato et al. (2023). This correction is 15% for the circular aperture assumed (r = 1.4). The standard deviation and level of the local background around our targets are determined for each image using annular apertures (1.6″¡ ¡ 3.2″) centered on these objects, masking all the additional objects present in the FoV. We used these standard deviation values to estimate the associated uncertainty of the photometric measurements. These uncertainties were then re-scaled to take into account the correlated noise induced when drizzling the MIRI individual observations by multiplying them by a factor 2.24 (see Östlin+ in prep. for further details). For those filters that do not present significant emission, we adopted 3-sigma upper limits. Table 1 presents the flux values measured from the HST and MIRI images along with the ancillary photometric points considered in the SED fitting.
We use CIGALE (Burgarella et al., 2005; Noll et al., 2009; Boquien et al., 2019) to perform the SED fitting. This is a Python-based modular code that allows us to create the SED model by defining separate modules for the different parameters (e.g. attenuation curves, dust emission, etc). In this work, we assumed a star-formation history (SFH) with a constant star-formation with ages between 1 and 20 Myr and a more mature stellar population created in an instantaneous burst of an age between 100 Myr and 1 Gyr. For simplicity, we will refer to these stellar populations as “young” and “mature” in the rest of the paper. We used the stellar population models from Bruzual & Charlot (2003) with solar metallicity and a Chabrier initial mass function (IMF, Chabrier, 2003). We included nebular emission with solar metallicity, an electron density of 100 cm-3 and an ionisation parameter = . Attenuation is assumed to follow the modified attenuation curve from Calzetti et al. (2000) presented by Noll et al. (2009) with the colour excess of the nebular lines and the slope from the power law values ranging between E(VB) = [0.0, 2.1] and = [0.4, 0.6], respectively. We force the UV bump at 2175 Å to be zero since we do not have spectral resolution to constrain it. The infrared emission was modelled using the Draine et al. (2014) dust models with PAH mass fraction and minimum radiation field values ranging between = [0.47, 2.5] and = [10, 50], respectively. The values of the power-law slope is set to = 2.0 while the fraction of illumination is allow to vary between = [0, 0.02].
| Filter | units | GN20 | GN20.2a | GN20.2b | BD29079 |
|---|---|---|---|---|---|
| 4.0553 0.0002† | 4.0508 0.0013† | 4.0563 0.0003† | 4.058†† | ||
| ACS/F435W | Jy | ¡0.092 | ¡0.086 | ¡0.081 | ¡0.061 |
| ACS/F606W | Jy | 0.348 0.027 | 0.290 0.025 | 0.152 0.023 | 0.306 0.017 |
| ACS/F775W | Jy | 0.710 0.041 | 0.657 0.039 | 0.308 0.036 | 0.875 0.027 |
| ACS/F814W | Jy | 0.758 0.050 | 0.573 0.047 | 0.225 0.043 | 1.047 0.035 |
| ACS/F850LP | Jy | 0.822 0.038 | 0.628 0.037 | 0.281 0.034 | 1.159 0.025 |
| WFC3/F105W | Jy | 0.905 0.062 | 0.608 0.060 | 0.360 0.054 | 1.202 0.040 |
| WFC3/F125W | Jy | 1.060 0.083 | 0.531 0.082 | 0.456 0.073 | 1.373 0.040 |
| WFC3/F140W | Jy | 1.21 0.11 | - | 0.455 0.094 | 1.333 0.067 |
| WFC3/F160W | Jy | 1.148 0.083 | 0.760 0.076 | 0.603 0.068 | 1.470 0.039 |
| MIRIM/F560W | Jy | 10.76 0.23 | 3.32 0.23 | 8.17 0.25 | 2.47 0.15 |
| MIRIM/F770W | Jy | 17.85 0.30 | 6.07 0.28 | 12.54 0.32 | 2.86 0.18 |
| MIRIM/F1280W | Jy | 23.48 0.73 | 9.01 0.72 | 10.97 0.79 | 6.97 0.47 |
| MIRIM/F1800W | Jy | 35.8 3.6 | 13.9 3.4 | 14.3 3.7 | 16.2 2.4 |
| IRAC/3.6m | Jy | 5.949 0.090 | 2.48 0.10 | 4.50 0.12 | 4.29 0.04 |
| IRAC/4.5m | Jy | 8.249 0.077 | 2.637 0.085 | 6.42 0.09 | 3.08 0.07 |
| IRAC/5.7m | Jy | 14.29 0.69 | 4.09 0.76 | 9.03 0.84 | 3.35 0.50 |
| IRAC/7.8m | Jy | 22.57 0.55 | 6.80 0.60 | 13.37 0.70 | 4.69 0.52 |
| MIPS/24m | Jy | 65.5 3.5 | 30.2 5.6 | 12.0 4.3 | 47.3 5.4 |
| PACS/100m | mJy | 0.70 0.42 | 0.12 0.44 | 0.61 0.46 | 0.54 0.33 |
| PACS/160m | mJy | 5.5 1.0 | 1.2 1.4 | 2.3 1.4 | 1.72 0.65 |
| SPIRE/250m | mJy | 18.6 2.7 | - | - | ¡5.4 |
| SPIRE/350m | mJy | 41.3 5.2 | - | - | - |
| SPIRE/500m | mJy | 39.7 6.1 | - | - | ¡6.6 |
| SCUBA/850m | mJy | 20.3 2.1 | 9.9 2.3 | 9.9 2.0 | - |
| PdBI/1.2mm | mJy | 8.47 0.79 | 3.83 0.48 | 3.25 0.52 | - |
| PdBI/2.2mm | mJy | 0.95 0.14 | 0.52 0.23 | ¡0.80 | - |
| PdBI/3.3mm | mJy | 0.229 0.036 | 0.177 0.071 | 0.114 0.035 | - |
4 Results and discussion
4.1 Near-IR structure and comparison with UV morphology
| Galaxy | PA | ||||
|---|---|---|---|---|---|
| (kpc) | (deg) | (deg) | |||
| GN20 | 3.51 0.03 | 0.33 0.02 | 0.80 0.01 | 88 2 | 38 2 |
| GN20.2a | 2.13 0.06 | 0.84 0.10 | 0.25 0.01 | 24 1 | 81 2 |
| GN20.2b | 1.30 0.05 | 4.51 0.25 | 0.72 0.03 | 6 2 | 44 2 |
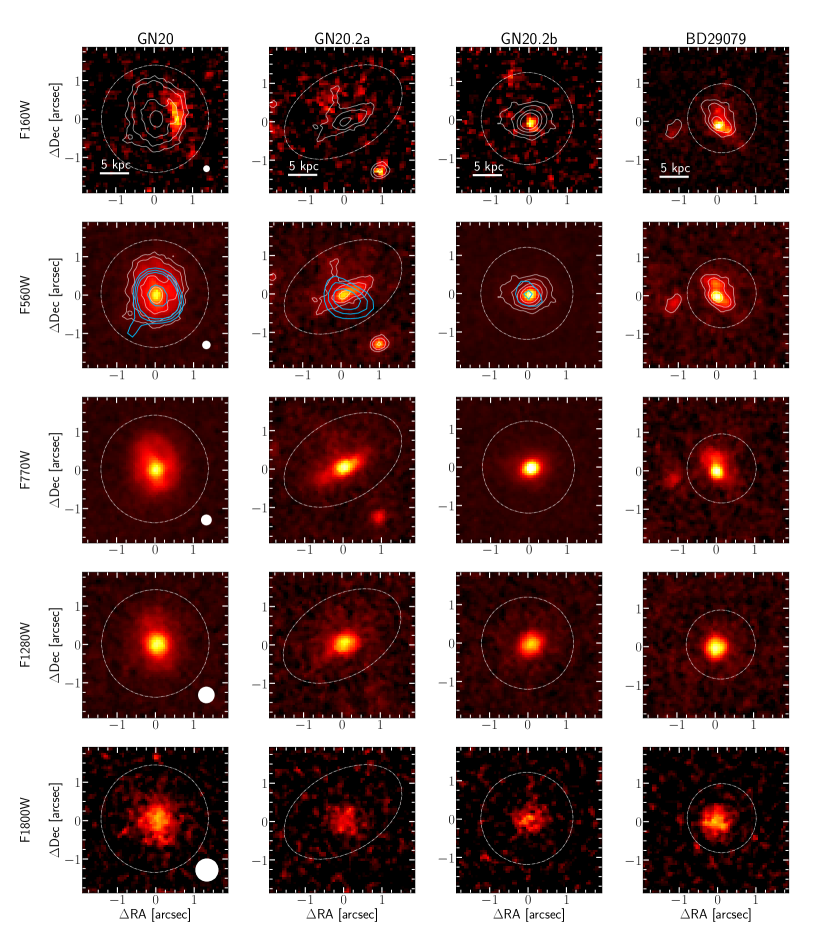
In Figure 1 we present the HST and MIRI images for the target galaxies. At a first view, it is clear that there are differences between the rest-frame UV and near-IR emission in the DSFGs while the LBG presents a similar morphology. The MIRI images of the DSFGs reveal, in general, extended centrally peaked brightness distributions that contrast with the compact and, in the case of GN20 and GN20.2a, off-centered UV emission by 4 kpc.
The F1800W filter displays, in general, brightness distributions that are more diffuse and less centrally peaked than the bluer filters. This emission, which is larger than the PSF size of this filter (see Fig. 1), suggests that the morphology at rest-frame 3.5 m is different from the rest of the near-IR. At this redshift, the F1800W filter contains the PAH 3.3 m emission, which is typically strong in these star-forming objects (Kim et al., 2012; Yamada et al., 2013), as can be seen in the SED models from Sect. 4.3. Unlike the rest-frame UV emission traced by HST, the PAH emission, linked to the reemission of UV-photons produced by young stars, is extended and visible at the centre of these objects. This indicates that the galaxies are forming stars homogeneously throughout their extent and supports the scenario where the HST is only tracing the UV emission that leaks out from the highly obscured central regions in the DSFGs. This scenario is also supported by the presence of molecular gas emission, traced by the PdBI CO(6–5) data presented by Carilli et al. (2010) and Hodge et al. (2013), centered on the near-IR peak of the DSFGs (see Fig. 1). This CO emission indicates the existence of cold molecular gas, which fuels the star-formation, available in the central regions of these galaxies, supporting the idea that there are much more star-formation than we are able to see in the rest-frame UV.
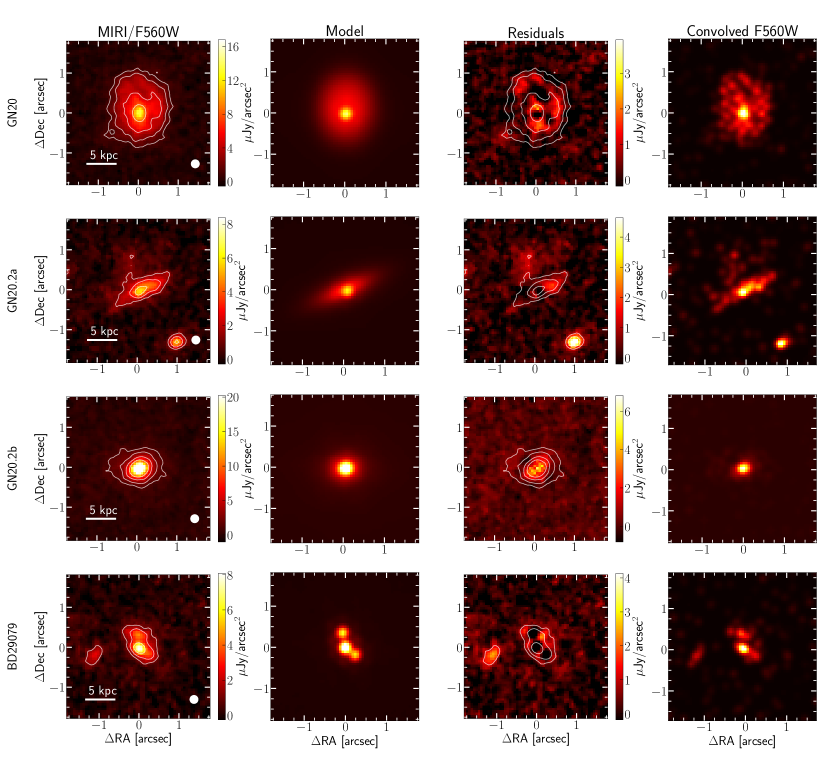
From the morphological modelling presented in Sect. 3.1, we obtain that, as in Colina et al. (2023), the MIRI/F560W image of GN20 can be represented by a compact nucleus (point-like) and an extended stellar envelope described with a Sérsic profile with = 0.33 0.02, = 3.51 0.03 kpc and a high axial ratio of = 0.80 0.01. This implies that if GN20 is a disc-like galaxy, assuming = 0.2, it has an inclination = 38 2°, in agreement with the value derived from its CO(2-1) emission (i.e. = 30 15°, Hodge et al. 2012). We also find an offset between the centroid of the extended stellar emission and the nucleus of 1 kpc (see Fig. 2), in agreement with Colina et al. (2023). This offset is similar to those observed in local galaxies in clusters (Lauer, 1988), predicted to be the result of tidal interactions (Aguilar & White, 1986), suggesting that GN20 could have been part of a gravitational interaction. We obtain an aperture-corrected flux of 0.87 0.32 Jy for the point-like source whereas the flux for the extended component is 8.94 0.32 Jy within the aperture used on the photometry extraction ( = 1.4). These values are measured in the Lenstronomy model to avoid contamination between the different components and represent 8% and 83% of the total flux, respectively, being consistent with the values found by Colina et al. (2023). The residuals from the modelling, although representing only a few percent of the original flux (i.e., 9%), show a patchy pattern, being higher at the outskirts of the extended stellar envelope. One of these bright residual regions (West blob) spatially coincides with the UV emission shown in the HST/F160W image (see Fig. 1). This agreement suggests spatial variations in the physical properties of the stellar envelope (e.g., extinction), which allows the UV light to escape in the West part of the galaxy. A similar scenario has been found in HDF850.1, a DSFG embedded in an overdensity at 5, where its UV and H photons leak out of the very obscured centre (Herard-Demanche et al., 2023; Sun et al., 2024).
The presence of a bright excess in the nuclear region of GN20.2a and its light asymmetry along the semi-major axis cause that this galaxy cannot be modelled with a single Sérsic profile. We therefore also considered, as for GN20, the presence of a point-source component during the brightness distribution modelling. We obtain that, after masking some diffuse emission present at the North-East of the object that is not confirmed to be part of GN20.2a, the extended emission from the galaxy can be modelled as a very elongated ( = 0.25 0.01) Sérsic profile with = 0.84 0.10 and = 2.13 0.06 kpc. The axial ratio of the galaxy implies, assuming that GN20.2a is a disc-like galaxy with = 0.2, an inclination of = 81 2°. Contrary to GN20, we do not find any offset between the Sérsic and the point-like components, suggesting that this source is likely linked to the nucleus of the galaxy. The fluxes of the extended and point sources are 1.98 0.23 Jy and 0.29 0.23 Jy (after aperture correction), respectively, which represent 60% and 9% of the total flux. In this galaxy, the residuals represent about 31% of original flux, which can be understood as due to the diffuse emission in the NE of the galaxy visible in HST/F160W and MIRI/F560W (see Fig. 1) and to light excess along the NW semi-major axis. In fact, this asymmetry along the major axis, depicted by the contours in Figure 2, can be also observed in the residual map. Possible origins of this asymmetry could be an irregular dust distribution or/and the presence of very bright blobs located somewhere in the NW semi-major axis, intensified by the high inclination of the galaxy. The Lucy-Richardson convolved MIRI image (rightmost panel in Fig. 2) supports this last scenario, showing some bright blobs along the NW semi-major axis. Unlike the previous object, GN20.2a does not present any bright HST/F160W counterpart (see Fig. 1) while showing some diffuse emission at 3 kpc to the NE of the galaxy, spatially coincident with the extended emission seen in MIRI/F560W. Further photometric analysis of this emission is needed to determine if it is really part of GN20.2a.
GN20.2b shows some clear differences in the morphology with respect to the other two DSFGs. It presents a compact brightness distribution that can be modelled by a single Sérsic profile with = 4.51 0.25, = 1.30 0.05 kpc and = 0.72 0.03. We have tested, for completeness, the possibility of the presence of a point-source along with the Sérsic profile. However, we discarded this approach as it yields larger residuals and a higher Bayesian Information Criterion (BIC) index. The residuals of the single Sérsic profile display an elongated (to the NW) structure, although it might be created by two close intense blobs. These residuals are aligned with the slightly elongated inner contours from the original F560W image (see Fig. 2), which disagree with the external orientation depicted with the outermost contours (PA 0°). This difference in the orientation of the inner regions may indicate the presence of an internal sub-structure, such as an inner disc. Another possible scenario is that GN20.2b is an object in a merging stage very close to the post-coalescence, in which the gravitational interaction could have created this difference between the inner and outer isophotes. Further observations of this target at a better spatial resolution and larger exposure time are needed to shed light to its peculiar morphology. The rest-frame UV image of this galaxy (see Fig. 1) presents a compact intense emission in the very central region of the galaxy, which is spatially coincident with the near-IR brightness peak. This result contrasts with the other 2 DSFGs, where we do not find any emission in the nuclear regions, suggesting that this object is less extinguished in its nucleus and/or it has a different nuclear type that enhances its UV emission.
The visual inspection of the Lyman-break galaxy (i.e., BD29079) reveals that the stellar component of this object is composed of three bright clumps very close to each other (i.e., 4 kpc). Due to its complex sub-structure, we decided to use a different approach to model its morphology. We fit its brightness distribution considering 3 independent point-sources, allowing them to vary their intensity. We obtain that, under this approach, the central, north and southeast clumps present fluxes of 1.26 0.15 Jy, 0.71 0.15 Jy and 0.52 0.15 Jy, respectively. The residual map from this model, shown in Fig. 2, displays a brightness excess around the central and north blobs. This suggests that these blobs might be more extended than the PSF or, at least, very close to the resolution limit. Therefore, we tried to model these three blobs simultaneously with Sérsic profiles, fixing their centres based on the point-source results. However, the and BIC values of this new approach are worse than those obtained from the 3 point-source model. We attribute this result to the fact that, although these regions are probably partially-resolved, their separation ( 1.5 FWHM) makes it difficult to correctly model them as independent Sérsic profiles. Therefore, we assume the 3 point-source model as the best approach for our data. When we compare the F560W with the UV image we observe that, unlike the DSFGs, this galaxy shows a very similar structure in HST/F160W (see Fig. 1) with a central bright clump and some diffuse emission spatially coincident with the near-IR clumps. This match between the rest-frame UV and near-IR structure might be produced by an intense UV emission coming from massive young stars, typical in these objects (see Giavalisco, 2002, for a review), along with a lower amount of dust that would favour that this object is less extinguished in its nuclear regions.
We repeated the same procedure with the MIRI/F770W images (i.e., H-band rest-frame) for all the galaxies. In general, we find a good agreement (with differences 15%) in the effective radii and Sérsic indices to those obtained from the F560W images (i.e., J-band). This result is expected since the near-IR emission traces a similar mature stellar population ruled by cool supergiant stars with some contribution of the asymptotic and red giant branches (i.e., AGB and RGB; Mouhcine & Lançon 2002; Valenti et al. 2004; Maraston 2005). In addition, this agreement also implies that possible uncertainties in the PSF-shape determination and spatial resolution difference are not decisive in our morphological modelling.
The typical sizes of our DSFGs (i.e., 1.3 3.5 kpc) are 2 times larger than what is expected from the size-decreasing trend observed by Gillman et al. (2023) for SMGs at 1 4 using JWST rest-frame near-IR images. In fact, our objects are comparable in size with the SMGs at 1 (i.e., 2 kpc). Regarding the Sérsic index and axial-ratios, our sample shows a wide range of values ( 0.34.5, 0.3 0.8), compatible with the typical results obtained for SMG at 2 (Gillman et al., 2023). According to the results drawn from CEERS NIRCam imaging for a general sample of galaxies (Kartaltepe et al., 2023), at 4 the typical size for disc-like, spheroidal and irregular galaxies ranges between 0.5 1.5 kpc. Our results show therefore that GN20 and GN20.2a are up to 3 times larger than the general isolated galaxies at their redshift, whereas GN20.2b presents a similar size.
In summary, whereas the DSFGs from the overdensity show Sérsic indices and axial-ratios compatible with the typical values observed in similar galaxies at their redshift, our targets are larger in effective radii, especially GN20. This can be explained as a rapid growth in size due to their membership in the overdensity. In Sect. 4.4 we will discuss how these galaxies compare in mass and SFR with the general population at 4.
4.2 Non-parametric morphological indices
| Galaxy | |||||
|---|---|---|---|---|---|
| GN20 | 2.250.01 | 0.090.03 | 0.020.01 | 0.390.01 | -1.510.02 |
| GN20.2a | 3.070.07 | 0.040.06 | -0.040.08 | 0.480.02 | -1.640.03 |
| GN20.2b | 3.250.03 | 0.030.02 | -0.000.01 | 0.580.01 | -1.860.02 |
| BD29079 | 2.600.12 | 0.140.03 | 0.030.03 | 0.450.02 | -1.380.03 |
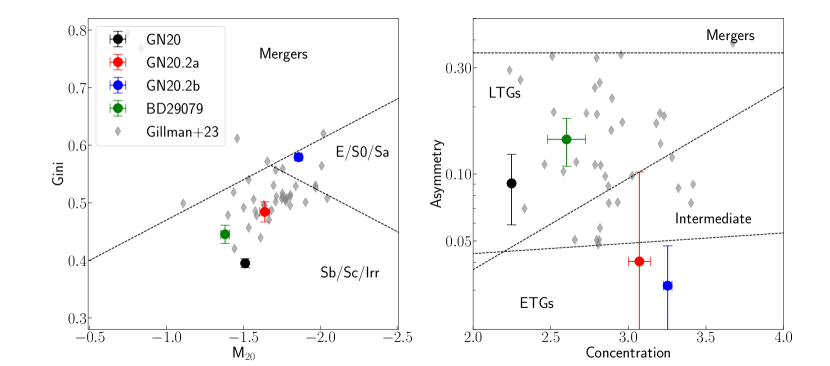
As introduced in Section 3.1, we used Statmorph to derive non-parametric image statistics for the MIRI filters with the best spatial resolution (i.e., F560W and F770W). This code allows us to compute the Concentration (), Asymmetry ( and Smoothness/Clumpiness () parameters (i.e., indices) along with the Gini () and values (Bershady et al., 2000; Conselice, 2003; Abraham et al., 2003; Lotz et al., 2004). Basically, higher values for the , and indices indicate more concentrated, more asymmetric and clumpier surface brightness profiles, respectively. The Gini coefficient represents the pixel distribution of the galaxy brightness, where = 0 indicates a homogeneous light distribution among all the pixels while = 1 represents the extreme case in which all the light is concentrated in a single pixel. The parameter is defined as the normalised 2nd-order moment of the brightest 20% of the pixels, regardless of whether they are in the central region or not, and thus a high concentration of light will result in very negative values. Table 3 presents the non-parametric indices for the MIRI/F560W images for all the sample.
These non-parametric indices have been commonly used to define the morphological classification, distinguishing between mergers, disc-like and elliptical galaxies (e.g. Bershady et al., 2000; Conselice, 2003; Lotz et al., 2008). Left panel of Fig. 3 shows the Gini- plane where the dashed lines mark the boundaries between early- (ETGs), late-type galaxies (LTGs) and mergers as defined by Lotz et al. (2008). Although all the objects in the sample present similar values, the lower Gini values for GN20, GN20.2a and BD29079, indicating less concentrated brightness distributions, classify them as late-type galaxies, whereas GN20.2b falls into the early-type galaxy region. This agrees with the visual inspection and the parametric modelling performed in Sect. 4.1, that show GN20.2b as a compact symmetrical object with high Sérsic index (i.e., bulge-like) whereas GN20 and GN20.2a present an extended disc-like emission with the presence of some brightness asymmetries. When looking at the Concentration-Asymmetry plane (right panel, Fig. 3) we obtain similar results. While GN20 and BD29079 are in the LTGs region, GN20.2b is classified as an early-type galaxy. Finally GN20.2a is identified as an ETG, though the uncertainty in the asymmetry makes it compatible with an LTG or an intermediate object. None of the galaxies are classified as merging objects in either panel. For the LBG BD29079, which displays a very clumpy structure in both rest-frame UV and near-IR wavelengths, we obtain a relatively high asymmetric value ( = 0.14 0.03), but a low clumpiness index (i.e., = 0.03 0.03). This could be an effect of the spatial resolution, which would smooth the internal sub-structure and flatten the brightness profile, as it has been also observed for a larger sample of SMGs at 5 (Gillman et al., 2023). In fact, in Yao et al. (2023) the authors found that, for a sample of 1300 galaxies drawn from the CEERS field at 3, larger PSF FWHMs tend to decrease the clumpiness and increase the Gini and indices.
We have also computed these non-parametric indices based on the F770W images, whereas the F1280W and F1800W cutouts were discarded for this analysis due to their lower S/N and worse spatial resolution (FWHM 0.42). For the F770W images, we obtain very similar results to those from F560W, with typical differences 10% and, in most of the targets, compatible within the uncertainties. These small differences do not modify the conclusions derived from the non-parametric analysis.
Obtaining that, based on non-parametric parameters, most of our galaxies at 4 are classified as LTGs, is compatible with the result found for a sample of more than 40 SMGs at 5 (Gillman et al., 2023). A similar result was also found for a sample of 1000 galaxies from the CEERS sample at lower redshifts ( 3, Yao et al. 2023). Complementary, in Kartaltepe et al. (2023) the authors analyse the non-parametric indices for 800 galaxies in the CEERS field at 3 9. The galaxies from that work happen to be predominantly disc-like, especially up to 5, where they represent 40% of the total sample. In this context, it is not surprising that the 3 out of the 4 galaxies in the overdensity at 4 studied in this work are classified as LTGs.
4.3 SED fitting results
| Galaxy | tot | SFR | sSFR | Ageyoung | |||
|---|---|---|---|---|---|---|---|
| (1010 ) | (109 ) | ( yr-1) | (Gyr-1) | (Myr) | (mag) | ||
| GN20 | 8.64.3 | 45.05.2 | 2551148 | 29.514.7 | 18.03.0 | 0.290.03 | 1.500.01 |
| GN20.2a | 2.21.4 | 13.42.3 | 1034130 | 47.431.9 | 14.32.8 | 0.400.05 | 1.220.05 |
| GN20.2b | 17.93.9 | 8.43.4 | 757226 | 4.21.6 | 8.55.3 | 0.190.07 | 1.480.09 |
| BD29079 | 2.40.7 | 3.10.7 | 31175 | 13.05.0 | 2.41.9 | -0.360.12 | 0.710.08 |
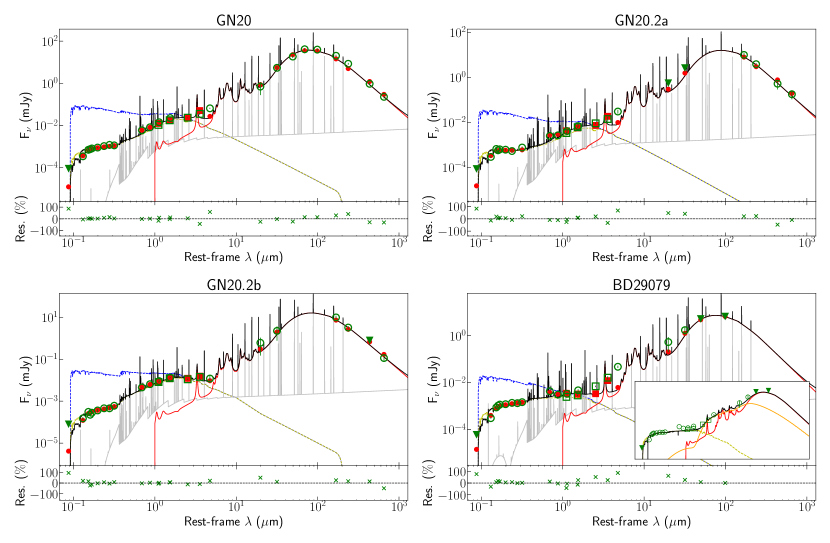
The spectral energy distributions of the galaxies in our sample have been previously studied based on existing UV to FIR rest-frame photometric points (Tan et al., 2013, 2014). With the new MIRI observations we cover the near-IR range up to 3.5 m, helping us to better constrain the mass and age of a possible mature stellar population, found previously in DSFGs (Ma et al., 2015). As introduced in Sect. 3.2, we use CIGALE to fit the rest-frame UV-to-mm SEDs for the objects in our sample. Fig. 4 shows the best-fit SEDs obtained while Table 4 summarises the physical parameters derived from the Bayesian analysis carried out in this work (see Sect. 3.2).
For GN20 we found that the young (i.e., 20 Myr) stellar component represents 52 % of the total stellar mass of the galaxy ( (9 4) 1010 ). This dominance of the young population can be understand due to the large star-formation rate derived for this object (i.e., 2550 yr-1). The global extinction, in the V-band, of this object ( 1.5 mag) is expected to be even larger in the nuclear region, where we do not observe rest-frame UV emission. This value is smaller than the extinctions derived by Bik et al. (2023) based on the difference between the SFRIR and SFRPaα and assuming either a Cardelli extinction law (i.e., = 17.2 mag; Cardelli et al. 1989) or the star+gas mixed model (i.e., = 44 mag) presented in Calabrò et al. (2018). The large difference between our SED-fitting and the one derived based on Pa might be understood as the presence of a stellar population older than 10 Myr that still forms stars and contributes to the total SFR but that cannot be traced by the Pa emission. Another potential origin of this difference is the possibility that GN20 contains a buried AGN, as proposed by Riechers et al. (2013), that would enhance the total SFR but is not traced by Pa.
The SED-fitting revealed that GN20.2a is the least massive DSFG in the sample, with 10.34, producing stars at a rate of 1000 yr-1. In this object, the young stellar population represents a larger fraction of the total mass ( 59 %) than in GN20. GN20.2b is the galaxy among the DSFGs with the lowest SFR (i.e., 750 yr-1). This massive galaxy ( = (1.8 0.4) 1011 ) presents a young burst ( 9 Myr), as expected from the bright central UV source visible in the HST (see Fig. 1). This burst is creating a young stellar population that represents only 5 % of the total mass, while the bulk of the stellar mass of this galaxy is dominated by a more mature stellar population. The SED model shows (see Fig. 4) that this galaxy presents the larger 4000Å break in the sample, in line with its ETG classification during the morphology analysis (see Sect. 4.1). The dominance of the mature stellar population in the stellar mass budget along with the young age of the burst seems to suggest that this galaxy is experiencing a ”rejuvenation” process, as observed in some LBGs and LAEs at similar redshifts (Angthopo et al., 2019; Rosani et al., 2020; Iani et al., 2023).
For the Lyman-Break galaxy BD29079 we find that it presents a total stellar mass ( 2.4 1010 ) similar to GN20.2a, while the very young ( 2.5 Myr) population represents 15% of the total stellar mass budget. The presence of this very young population along with the low extinction ( =0.71 mag) of this galaxy justify the strong emission observed in the rest-frame UV (see Fig. 1). Figure 4 shows that there are some residuals in the mid-IR due to the presence of a power-law type behaviour that is not captured by the CIGALE model for this galaxy. This feature is linked to the presence of some warm dust component, usually produced by an AGN. Therefore, for this galaxy, we tested the possibility of modelling the AGN contribution using the Fritz et al. (2006) models available in CIGALE following the prescriptions presented in Ciesla et al. (2015). This new SED model, displayed in the inset in Fig. 4, improves the value and reduces the residuals in the mid-IR. Under this approach, the AGN would contribute up to a 20% to the total .
Considering a modified Calzetti extinction law (see Noll et al. 2009) during the SED fitting allows us to study the possible variation in the dust attenuation curve for these galaxies. We obtain that the DSFGs present positive values of the power-law slope ( 0.2 0.4) indicating an extinction law shallower than Calzetti’s, while the analysis on the LBG yields to a steeper curve ( = 0.36 0.12). This agrees with the statistical analysis performed in 10 000 LBGs at z 3 presented by Álvarez-Márquez et al. (2019), where dust attenuation laws steeper than Calzetti’s are found to be favoured in LBGs with log(/ ) ¡ 10.3. The positive values derived for the DSFGs are consistent with the general trend in which shallower attenuation curves are found in more massive, dust-obscured star-forming galaxies (Salim et al., 2018; Salim & Narayanan, 2020).
In general, our results derived from the rest-frame UV to millimetre SED fitting (e.g., , SFR) are in good agreement with the values obtained in previous studies. In Tan et al. (2014), the authors performed an SED analysis with MAGPHYS, based on UV to far-IR photometry, for the 4 galaxies in the overdensity. They derived total stellar masses equal to 1.1 1011, 3.8 1010 and 1.1 1011 for GN20, GN20.2a and GN20.2b respectively, with a typical error of 0.2 dex. While compatible within the 1 uncertainties, their stellar masses are slightly larger, except for GN20.2b for which we obtain a stellar mass 1.5 times larger (see Table 4). The stellar mass derived via SED for the LBG is also in good agreement with that obtained by Tan et al. (2013) (i.e., (2.5 0.5) 1010 ). Regarding the SFRs, our results for the DSFGs agree with the values derived by Tan et al. (2014) with typical differences 20%, while our typical uncertainty on the SFR is 10%. For BD29079 we also obtain an SFR value compatible within the 1 uncertainties with previous estimations presented by Tan et al. (2013). This general agreement in both the stellar mass and SFR makes that our sSFR displays similar values, ranging between 4 50 Gyr-1.
When comparing with previous estimations of the dynamical mass for GN20, we observe that our stellar mass is a factor of 26 smaller than the dynamical masses derived by Tan et al. (2014) and Hodge et al. (2012) (i.e., (1.8 5.4) 1011 ), based on its gas+stellar mass and its CO kinematics, respectively. This difference is even larger in the case of GN20.2a, where the stellar mass derived in this work is a factor 10 smaller than the presented in Tan et al. (2014) (i.e., (1.9 0.9) 1011 ). According to Tan et al. 2014, both objects present gas mass fraction values ¿ 0.65, which implies gas masses ¿2 1011 , in agreement with the value derived by Hodge et al. (2012) for GN20 (i.e., (1.3 0.4) 1011 (/0.8) ). These large stellar and gas masses leave little room for the contribution of dark matter to the dynamical mass. In fact, the large uncertainties associated with some of these and measurements make the baryonic matter compatible with being larger than the dynamical mass. Further determinations of the dynamical mass of these targets based on their kinematics are needed to confirm the low dark matter masses of these galaxies.
4.4 Comparison with isolated SFGs and similar overdensities
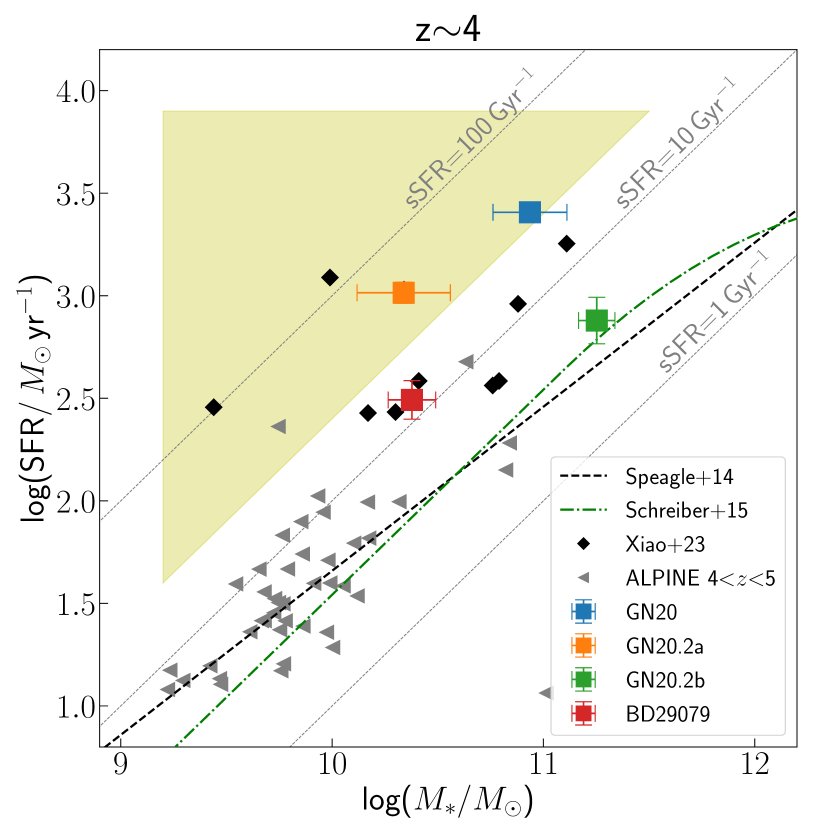
The morphological and SED-fitting analyses performed in this work have revealed that, despite showing a wide range of morphologies, all the objects from our sample are, in general, extended and massive star-forming galaxies. When plotted on the SFR plane (Fig. 5), GN20, GN20.2a and BD29079 lie above the star-forming main sequence (SFMS) at 4 (Speagle et al., 2014; Schreiber et al., 2015) by more than the intrinsic scatter of the MS (i.e., 0.3 dex, Whitaker et al. 2012), while GN20.2b is compatible with being in high-mass end of the main sequence. This is consistent with the morphological results, that revealed that GN20.2b is the only object in the sample classified as ETG, presenting the highest Sérsic index and the smallest effective radius. This difference in the sSFR (up to a factor of 10) suggests that these galaxies are in different evolutionary stages. While GN20b is at an advanced stage (i.e. lower sSFR, larger mass and more compact structure), GN20 and GN20.2a are in a earlier stage, forming stars at a larger rate. Although GN20, GN20.2a and BD29079 are above the SFMS, only the two DSFGs present sSFR compatible with the ”Starburst region” defined in Caputi et al. (2017) (i.e., log(sSFR/yr-1) ¿ 7.6). When comparing with other galaxies at similar redshift we observe that, in general, our sample is almost 1 dex more massive than the [CII] emitters from ALPINE at similar redshift (Faisst et al., 2020) while it is more similar to the optically-faint galaxies (OFGs) at 4 drawn from the GOODS-ALMA sample (Xiao et al., 2023).
As introduced above, previous CO-based analyses have calculated the gas mass of these galaxies (Carilli et al., 2011; Hodge et al., 2013; Tan et al., 2013, 2014). These masses range, depending on the assumed, between (12) 1011 , (0.62) 1011 and (28) 1010 for GN20, GN20.2a and GN20.2b, respectively. These gas masses imply a gas mass fraction (i.e., = / 13) for GN20 and GN20.2a, whereas in GN20.2b the stellar mass dominates (i.e., 0.10.4). The fact that GN20 and GN20.2a are more gas-rich supports the scenario in which GN20.2b is in a more advanced stage of galaxy evolution. Based on the SED-derived SFR, we obtain very short depletion times ( = /SFR 30100 Myr) for the three DSFGs. This is consistent with the depletion times found in other DSFGs, both isolated and in overdense regions, at different redshifts (Béthermin et al., 2015; Aravena et al., 2016; Gururajan et al., 2022).
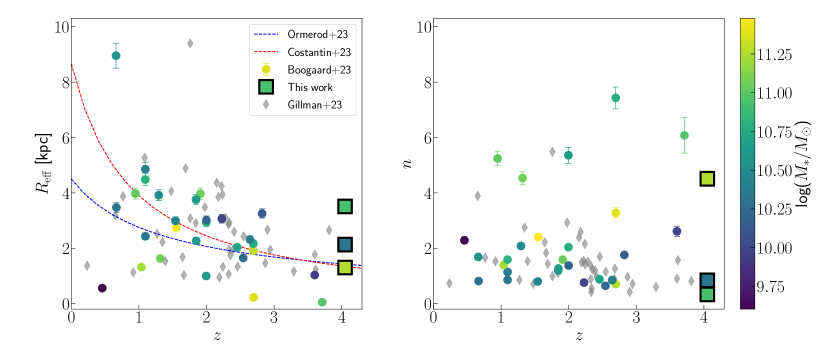
Since the launch of the JWST, several studies have used the spatial resolution and sensitivity of its cameras to analyse the size evolution up to 8 for different samples of observed (e.g., CEERS, Gómez-Guijarro et al. 2023; Ormerod et al. 2023; Ward et al. 2023; ALMA-HUDF, Boogaard et al. 2023) and simulated galaxies (Costantin et al., 2023). These works have found that, at higher redshifts, galaxies tend to be more compact, regardless of their stellar mass or the wavelength range studied. Figure 6 (left panel) displays the size-evolution of ALMA-selected sources from the Hubble Ultra Deep Field (HUDF) observed with MIRI/F560W (Boogaard et al., 2023). It is clear that the DSFGs from our sample, at 4.05, show effective radii up to two times larger than the expected value. In fact, their sizes are compatible with CEERS galaxies at 1 3 (Ormerod et al., 2023). Regarding the Sérsic index, our results are within the range of values shown in the ALMA-selected sample ( 0.4 6), that do not show any evolution with redshift. However, we do not observe any clear trend with the stellar mass. The fact that, in general, our DSFGs display larger sizes than field galaxies at similar redshift can be understood as a rapid growth due to their presence in an overdense region. Galaxies in proto-clusters have been found to evolve rapidly, with SFR/Mhalo larger than field galaxies (Bai et al., 2009; Webb et al., 2013; Popesso et al., 2015). This enhanced SFR, linked to a larger and faster gas infall, accelerates the gas consumption of these galaxies anticipating their quiescent state. In fact, larger fractions of quenching galaxies have been found at high-mass and high-density environments (Liu et al., 2021). In this context, GN20 and GN20.2a can be interpreted as starbursting LTGs that are rapidly growing in mass and size while GN20.2b, which resembles a more evolved ETG, is undergoing a ”rejuvenization” process likely linked to a recent accretion of gas that would have triggered the star-formation again.
When comparing with other DSFGs in overdensities discovered at 3, we observe that our galaxies present similar physical properties. The SFRs obtained for our sample (i.e., 3002400 yr-1) are in good agreement with the values derived for the most IR-luminous DSFGs in the overdensity at 4.57 named Distant Red Core (i.e., 6002900 yr-1, Oteo et al. 2018). Our SFR are also consistent with the values derived for various DSFGs in overdensities at 2 7 (i.e., 200 2000 yr-1, Walter et al. 2012; Pavesi et al. 2018; Gómez-Guijarro et al. 2019; Álvarez-Márquez et al. 2023). In addition, the typical distances between the members of these overdensities are similar, being usually distributed over an area of a few 100 kpc 100 kpc. However, other overdensities at high- display very different scenarios, where the galaxies are either more concentrated as in A2744-z7p9OD (i.e., r 6 kpc, Hashimoto et al. 2023) or covering larger areas as in PCl J1001+0220 (i.e., r 2 Mpc, Oteo et al. 2018). Another observed scenario of these overdensities is one in which only the central object is a DSFG with SFR 100 200 yr-1, while the rest of the objects are creating stars at a lower rate. This is the case of the = 4.3 group analysed in Caputi et al. (2021), where the central object is an ultra-luminous infrared galaxy surrounded by low-mass (7 log(/ ) 10) starburst galaxies, with sSFR 20 Gyr-1. New discoveries of similar overdensities at 3 are still needed to allow us to carry out more exhaustive studies of the physical properties of their galaxies.
5 Summary
This paper presents the first sub-arcsec analysis focusing the structure and physical properties of the three DSFGs and the LBG identified in the overdensity around the SMG GN20 at 4.05, based on their rest-frame infrared emission ( 1.1 3.5 m). Concretely, JWST MIRI imaging in several filters, from F560W to F1800W, have been used to resolve, for the first time, their mature stellar population. The high angular resolution ( 0.25) of the bluer filters (i.e., F560W and F770W) allows us to model their spatially-resolved stellar brightness distributions and study their non-parametric morphological indices. Finally, a rest-frame far-UV to millimetre SED-fitting analysis is carried out to derive the main physical properties of the sample (e.g., SFR, , sSFR, ). The main results are:
-
•
The MIRI images have revealed that our galaxies show a wide range of morphologies in the rest-frame near-IR, from disc+bulge to clump-dominated structures. This near-IR structure contrasts with the rest-frame UV emission for the DSFGs, that appears as diffuse and, in GN20 and GN20.2a, off-centered by 4 kpc with respect to their near-IR counterparts. This offset is understood as a consequence of the extremely heavy obscuration in the nuclear regions of these galaxies. Nevertheless, the LBG galaxy (i.e., BD29079) displays a similar structure in the rest-frame UV and near-IR.
-
•
From the parametric modelling of the stellar brightness distribution observed in MIRI/F560W (rest-frame 1.1 m), we obtain that GN20 and GN20.2a present disc-like structures recalling spiral galaxies while GN20.2b shows a very compact light profile with a Sérsic index = 4.5, consistent with an early-type galaxy. In addition, the 3 DSFGs present irregular sub-structure in their residual maps. These features, consistent with the structures revealed by the Lucy-Richardson deconvolution, are likely linked to the presence of dust lanes and off-nuclear clumps.
-
•
According to the Gini and criteria, GN20, GN20.2a and BD29079 are compatible with being late-type galaxies (LTGs) while GN20.2b is an early-type (ETG), consistent with the parametric morphological analysis. The predominance of LTGs is in agreement with the morphological classification of SMGs (Gillman et al., 2023) and the general population of galaxies from CEERS (Kartaltepe et al., 2023) at z¡5.
-
•
The analysis of the spectral energy distribution of the galaxies in our sample, reveals that all are massive (log(/ )=10.30 11.25), with high SFR ( 300 2500 yr-1) and present high internal extinction ( = 0.8 1.5 mag). We observe that the extended disky GN20 is dominating the total star-formation of the overdensity with SFR 2500 yr-1, while the compact early-type GN20.2b dominates the stellar mass ( 1.8 1011 ). Finally, we found that although BD29079 (LBG) is as massive as GN20.2a, it is forming new stars at the lowest rate among the sample ( 300 yr-1).
-
•
The galaxies classified as LTG (GN20, GN20.2a and BD29079) are all above the main sequence of star-forming galaxies at z 4 by 0.5 dex, while GN20.2b, classified as ETG, is compatible with the high-mass end of the main sequence. When comparing with larger samples of galaxies at this redshift, our galaxies are very similar to the ALMA-selected dusty optically-faint galaxies from Xiao et al. (2023) and well above the [CII] emitters from the ALPINE sample on the SFR plane.
-
•
The derived for our DSFGs are up to two times larger (i.e., 1.5 4 kpc) than expected at their redshift, according to recent JWST studies based on CEERS and ALMA-HUDF galaxies. These large values can be understood as result of a rapid growth in mass and size as a consequence of being located in an overdensity. Under this scenario, GN20.2b (with the highest stellar mass, lowest gas mass and lowest sSFR) seems to be in a more advanced stage of this evolution than GN20 and GN20.2a.
-
•
When comparing with other DSFGs in overdensities at 2 7, our targets display similar SFRs ( 300 2000 yr-1), depletion times ( 100 Myr) and projected separations ( 1 200 kpc) values. These results support the scenario in which galaxy overdensities play a key role in triggering the extreme DSFGs in the early Universe.
The JWST/MIRI images (F560W, F770W, F1280W and F1800W filters) for the three DSFGs and the LBG analysed in this work provide new insights into the mature stellar distribution of these objects at 4. As we present along this paper, these galaxies present large SFRs and stellar masses while showing wide range of structures in the near-IR, different from the rest-frame UV for the DSFGs. Further observations of their optical counterparts are still needed to fill the gap between the UV and near-IR emission, which would help understand the intrinsic structure and physical processes occurring in these objects.
Acknowledgements.
A.C.G., J.A-M., L.C. and A.L. acknowledge support by grant PIB2021-127718NB-100, P.G.P-G. by grant PGC2018-093499-B-I00. A.A-H. acknowledges support from grant PID2021-124665NB-I00 from the Spanish Ministry of Science and Innovation/State Agency of Research MCIN/AEI/10.13039/501100011033 and by “ERDF A way of making Europe”. L.B. and F.W. acknowledge support from the ERC Advanced Grant 740246 (Cosmic_Gas). A.B. & G.Ö. acknowledge support from the Swedish National Space Administration (SNSA). O.I. acknowledges the funding of the French Agence Nationale de la Recherche for the project iMAGE (grant ANR-22-CE31-0007), J.H. and D.L. were supported by a VILLUM FONDEN Investigator grant (project number 16599). This work was also supported by a research grant (VIL54489) from VILLUM FONDEN. K.I.C. acknowledges funding from the Netherlands Research School for Astronomy (NOVA) and from the Dutch Research Council (NWO) through the award of the Vici Grant VI.C.212.036. J.P.P. and T.T. acknowledge financial support from the UK Science and Technology Facilities Council, and the UK Space Agency. T.P.R. would like to acknowledge support from the ERC under advanced grant 743029 (EASY). The Cosmic Dawn Center (DAWN) is funded by the Danish National Research Foundation under grant No. 140. The authors thank Jacqueline Hodge for providing the CO data of GN20. The work presented is the effort of the entire MIRI team and the enthusiasm within the MIRI partnership is a significant factor in its success. MIRI draws on the scientific and technical expertise of the following organisations: Ames Research Center, USA; Airbus Defence and Space, UK; CEA-Irfu, Saclay, France; Centre Spatial de Liége, Belgium; Consejo Superior de Investigaciones Científicas, Spain; Carl Zeiss Optronics, Germany; Chalmers University of Technology, Sweden; Danish Space Research Institute, Denmark; Dublin Institute for Advanced Studies, Ireland; European Space Agency, Netherlands; ETCA, Belgium; ETH Zurich, Switzerland; Goddard Space Flight Center, USA; Institute d’Astrophysique Spatiale, France; Instituto Nacional de Técnica Aeroespacial, Spain; Institute for Astronomy, Edinburgh, UK; Jet Propulsion Laboratory, USA; Laboratoire d’Astrophysique de Marseille (LAM), France; Leiden University, Netherlands; Lockheed Advanced Technology Center (USA); NOVA Opt-IR group at Dwingeloo, Netherlands; Northrop Grumman, USA; Max-Planck Institut für Astronomie (MPIA), Heidelberg, Germany; Laboratoire d’Etudes Spatiales et d’Instrumentation en Astrophysique (LESIA), France; Paul Scherrer Institut, Switzerland; Raytheon Vision Systems, USA; RUAG Aerospace, Switzerland; Rutherford Appleton Laboratory (RAL Space), UK; Space Telescope Science Institute, USA; Toegepast- Natuurwetenschappelijk Onderzoek (TNO-TPD), Netherlands; UK Astronomy Technology Centre, UK; University College London, UK; University of Amsterdam, Netherlands; University of Arizona, USA; University of Cardiff, UK; University of Cologne, Germany; University of Ghent; University of Groningen, Netherlands; University of Leicester, UK; University of Leuven, Belgium; University of Stockholm, Sweden; Utah State University, USA. A portion of this work was carried out at the Jet Propulsion Laboratory, California Institute of Technology, under a contract with the National Aeronautics and Space Administration. We would like to thank the following National and International Funding Agencies for their support of the MIRI development: NASA; ESA; Belgian Science Policy Office; Centre Nationale D’Etudes Spatiales (CNES); Danish National Space Centre; Deutsches Zentrum fur Luft-und Raumfahrt (DLR); Enterprise Ireland; Ministerio De Economía y Competitividad; Netherlands Research School for Astronomy (NOVA); Netherlands Organisation for Scientific Research (NWO); Science and Technology Facilities Council; Swiss Space Office; Swedish National Space Board; UK Space Agency. This work is based on observations made with the NASA/ESA/CSA James Webb Space Telescope. The data were obtained from the Mikulski Archive for Space Telescopes at the Space Telescope Science Institute, which is operated by the Association of Universities for Research in Astronomy, Inc., under NASA contract NAS 5-03127 for JWST; and from the European JWST archive (eJWST) operated by the ESDC. This research made use of Photutils, an Astropy package for detection and photometry of astronomical sources (Bradley et al., 2022).References
- Abraham et al. (2003) Abraham, R. G., van den Bergh, S., & Nair, P. 2003, ApJ, 588, 218
- Aguilar & White (1986) Aguilar, L. A. & White, S. D. M. 1986, ApJ, 307, 97
- Álvarez-Márquez et al. (2019) Álvarez-Márquez, J., Burgarella, D., Buat, V., Ilbert, O., & Pérez-González, P. G. 2019, A&A, 630, A153
- Álvarez-Márquez et al. (2023) Álvarez-Márquez, J., Crespo Gómez, A., Colina, L., et al. 2023, A&A, 671, A105
- Angthopo et al. (2019) Angthopo, J., Ferreras, I., & Silk, J. 2019, MNRAS, 488, L99
- Aravena et al. (2016) Aravena, M., Spilker, J. S., Bethermin, M., et al. 2016, MNRAS, 457, 4406
- Arribas et al. (2023) Arribas, S., Perna, M., Rodríguez Del Pino, B., et al. 2023, arXiv e-prints, arXiv:2312.00899
- Bai et al. (2009) Bai, L., Rieke, G. H., Rieke, M. J., Christlein, D., & Zabludoff, A. I. 2009, ApJ, 693, 1840
- Barger et al. (1998) Barger, A. J., Cowie, L. L., Sanders, D. B., et al. 1998, Nature, 394, 248
- Barro et al. (2019) Barro, G., Pérez-González, P. G., Cava, A., et al. 2019, ApJS, 243, 22
- Barro et al. (2011) Barro, G., Pérez-González, P. G., Gallego, J., et al. 2011, ApJS, 193, 13
- Bershady et al. (2000) Bershady, M. A., Jangren, A., & Conselice, C. J. 2000, AJ, 119, 2645
- Béthermin et al. (2015) Béthermin, M., Daddi, E., Magdis, G., et al. 2015, A&A, 573, A113
- Bik et al. (2023) Bik, A., Álvarez-Márquez, J., Colina, L., et al. 2023, arXiv e-prints, arXiv:2312.03074
- Birrer & Amara (2018) Birrer, S. & Amara, A. 2018, Physics of the Dark Universe, 22, 189
- Boogaard et al. (2023) Boogaard, L. A., Gillman, S., Melinder, J., et al. 2023, arXiv e-prints, arXiv:2308.16895
- Boquien et al. (2019) Boquien, M., Burgarella, D., Roehlly, Y., et al. 2019, A&A, 622, A103
- Borys et al. (2003) Borys, C., Chapman, S., Halpern, M., & Scott, D. 2003, MNRAS, 344, 385
- Bouchet et al. (2015) Bouchet, P., García-Marín, M., Lagage, P. O., et al. 2015, PASP, 127, 612
- Bradley et al. (2022) Bradley, L., Sipőcz, B., Robitaille, T., et al. 2022, astropy/photutils: 1.5.0
- Bruzual & Charlot (2003) Bruzual, G. & Charlot, S. 2003, MNRAS, 344, 1000
- Burgarella et al. (2005) Burgarella, D., Buat, V., & Iglesias-Páramo, J. 2005, MNRAS, 360, 1413
- Calabrò et al. (2018) Calabrò, A., Daddi, E., Cassata, P., et al. 2018, ApJ, 862, L22
- Calzetti et al. (2000) Calzetti, D., Armus, L., Bohlin, R. C., et al. 2000, ApJ, 533, 682
- Caputi et al. (2021) Caputi, K. I., Caminha, G. B., Fujimoto, S., et al. 2021, ApJ, 908, 146
- Caputi et al. (2017) Caputi, K. I., Deshmukh, S., Ashby, M. L. N., et al. 2017, ApJ, 849, 45
- Cardelli et al. (1989) Cardelli, J. A., Clayton, G. C., & Mathis, J. S. 1989, ApJ, 345, 245
- Carilli et al. (2010) Carilli, C. L., Daddi, E., Riechers, D., et al. 2010, ApJ, 714, 1407
- Carilli et al. (2011) Carilli, C. L., Hodge, J., Walter, F., et al. 2011, ApJ, 739, L33
- Casey et al. (2014) Casey, C. M., Narayanan, D., & Cooray, A. 2014, Phys. Rep, 541, 45
- Chabrier (2003) Chabrier, G. 2003, PASP, 115, 763
- Chapman et al. (2005) Chapman, S. C., Blain, A. W., Smail, I., & Ivison, R. J. 2005, ApJ, 622, 772
- Ciesla et al. (2015) Ciesla, L., Charmandaris, V., Georgakakis, A., et al. 2015, A&A, 576, A10
- Colina et al. (2023) Colina, L., Crespo Gómez, A., Álvarez-Márquez, J., et al. 2023, A&A, 673, L6
- Conselice (2003) Conselice, C. J. 2003, ApJS, 147, 1
- Conselice (2014) Conselice, C. J. 2014, ARA&A, 52, 291
- Costantin et al. (2023) Costantin, L., Pérez-González, P. G., Vega-Ferrero, J., et al. 2023, ApJ, 946, 71
- Daddi et al. (2009) Daddi, E., Dannerbauer, H., Stern, D., et al. 2009, ApJ, 694, 1517
- Draine et al. (2014) Draine, B. T., Aniano, G., Krause, O., et al. 2014, ApJ, 780, 172
- Faisst et al. (2020) Faisst, A. L., Schaerer, D., Lemaux, B. C., et al. 2020, ApJS, 247, 61
- Fritz et al. (2006) Fritz, J., Franceschini, A., & Hatziminaoglou, E. 2006, MNRAS, 366, 767
- Gaia Collaboration et al. (2022) Gaia Collaboration, Vallenari, A., Brown, A. G. A., et al. 2022, arXiv e-prints, arXiv:2208.00211
- Gardner et al. (2023) Gardner, J. P., Mather, J. C., Abbott, R., et al. 2023, PASP, 135, 068001
- Giavalisco (2002) Giavalisco, M. 2002, ARA&A, 40, 579
- Gillman et al. (2023) Gillman, S., Gullberg, B., Brammer, G., et al. 2023, A&A, 676, A26
- Gómez-Guijarro et al. (2023) Gómez-Guijarro, C., Magnelli, B., Elbaz, D., et al. 2023, A&A, 677, A34
- Gómez-Guijarro et al. (2019) Gómez-Guijarro, C., Riechers, D. A., Pavesi, R., et al. 2019, ApJ, 872, 117
- Gururajan et al. (2022) Gururajan, G., Béthermin, M., Theulé, P., et al. 2022, A&A, 663, A22
- Hashimoto et al. (2023) Hashimoto, T., Álvarez-Márquez, J., Fudamoto, Y., et al. 2023, ApJ, 955, L2
- Herard-Demanche et al. (2023) Herard-Demanche, T., Bouwens, R. J., Oesch, P. A., et al. 2023, arXiv e-prints, arXiv:2309.04525
- Hodge et al. (2013) Hodge, J. A., Carilli, C. L., Walter, F., Daddi, E., & Riechers, D. 2013, ApJ, 776, 22
- Hodge et al. (2012) Hodge, J. A., Carilli, C. L., Walter, F., et al. 2012, ApJ, 760, 11
- Hodge et al. (2015) Hodge, J. A., Riechers, D., Decarli, R., et al. 2015, ApJ, 798, L18
- Hodge et al. (2019) Hodge, J. A., Smail, I., Walter, F., et al. 2019, ApJ, 876, 130
- Hughes et al. (1998) Hughes, D. H., Serjeant, S., Dunlop, J., et al. 1998, Nature, 394, 241
- Iani et al. (2023) Iani, E., Caputi, K. I., Rinaldi, P., et al. 2023, arXiv e-prints, arXiv:2309.08515
- Kartaltepe et al. (2023) Kartaltepe, J. S., Rose, C., Vanderhoof, B. N., et al. 2023, ApJ, 946, L15
- Kim et al. (2012) Kim, J. H., Im, M., Lee, H. M., et al. 2012, ApJ, 760, 120
- Lauer (1988) Lauer, T. R. 1988, ApJ, 325, 49
- Lewis et al. (2018) Lewis, A. J. R., Ivison, R. J., Best, P. N., et al. 2018, ApJ, 862, 96
- Libralato et al. (2023) Libralato, M., Argyriou, I., Dicken, D., et al. 2023, arXiv e-prints, arXiv:2311.12145
- Liu et al. (2018) Liu, D., Daddi, E., Dickinson, M., et al. 2018, ApJ, 853, 172
- Liu et al. (2019) Liu, D., Schinnerer, E., Groves, B., et al. 2019, ApJ, 887, 235
- Liu et al. (2021) Liu, S., Gu, Y., Yuan, Q., et al. 2021, ApJ, 923, 46
- Lotz et al. (2008) Lotz, J. M., Davis, M., Faber, S. M., et al. 2008, ApJ, 672, 177
- Lotz et al. (2004) Lotz, J. M., Primack, J., & Madau, P. 2004, AJ, 128, 163
- Lucy (1974) Lucy, L. B. 1974, AJ, 79, 745
- Ma et al. (2015) Ma, J., Gonzalez, A. H., Spilker, J. S., et al. 2015, ApJ, 812, 88
- Madau & Dickinson (2014) Madau, P. & Dickinson, M. 2014, ARA&A, 52, 415
- Maraston (2005) Maraston, C. 2005, MNRAS, 362, 799
- Mouhcine & Lançon (2002) Mouhcine, M. & Lançon, A. 2002, A&A, 393, 149
- Noll et al. (2009) Noll, S., Burgarella, D., Giovannoli, E., et al. 2009, A&A, 507, 1793
- Ormerod et al. (2023) Ormerod, K., Conselice, C. J., Adams, N. J., et al. 2023, MNRAS[arXiv:2309.04377]
- Oteo et al. (2018) Oteo, I., Ivison, R. J., Dunne, L., et al. 2018, ApJ, 856, 72
- Pavesi et al. (2018) Pavesi, R., Riechers, D. A., Sharon, C. E., et al. 2018, ApJ, 861, 43
- Peißker et al. (2022) Peißker, F., Eckart, A., Zajaček, M., & Britzen, S. 2022, ApJ, 933, 49
- Pérez-González et al. (2005) Pérez-González, P. G., Rieke, G. H., Egami, E., et al. 2005, ApJ, 630, 82
- Planck Collaboration et al. (2020) Planck Collaboration, Aghanim, N., Akrami, Y., et al. 2020, A&A, 641, A6
- Popesso et al. (2015) Popesso, P., Biviano, A., Finoguenov, A., et al. 2015, A&A, 579, A132
- Riechers et al. (2013) Riechers, D. A., Bradford, C. M., Clements, D. L., et al. 2013, Nature, 496, 329
- Riechers et al. (2010) Riechers, D. A., Capak, P. L., Carilli, C. L., et al. 2010, ApJ, 720, L131
- Rieke et al. (2015) Rieke, G. H., Wright, G. S., Böker, T., et al. 2015, PASP, 127, 584
- Rodriguez-Gomez et al. (2019) Rodriguez-Gomez, V., Snyder, G. F., Lotz, J. M., et al. 2019, MNRAS, 483, 4140
- Rosani et al. (2020) Rosani, G., Caminha, G. B., Caputi, K. I., & Deshmukh, S. 2020, A&A, 633, A159
- Salim et al. (2018) Salim, S., Boquien, M., & Lee, J. C. 2018, ApJ, 859, 11
- Salim & Narayanan (2020) Salim, S. & Narayanan, D. 2020, ARA&A, 58, 529
- Schreiber et al. (2015) Schreiber, C., Pannella, M., Elbaz, D., et al. 2015, A&A, 575, A74
- Smail et al. (1997) Smail, I., Ivison, R. J., & Blain, A. W. 1997, ApJ, 490, L5
- Smolčić et al. (2017) Smolčić, V., Miettinen, O., Tomičić, N., et al. 2017, A&A, 597, A4
- Speagle et al. (2014) Speagle, J. S., Steinhardt, C. L., Capak, P. L., & Silverman, J. D. 2014, ApJS, 214, 15
- Strandet et al. (2017) Strandet, M. L., Weiss, A., De Breuck, C., et al. 2017, ApJ, 842, L15
- Sun et al. (2024) Sun, F., Helton, J. M., Egami, E., et al. 2024, ApJ, 961, 69
- Tan et al. (2014) Tan, Q., Daddi, E., Magdis, G., et al. 2014, A&A, 569, A98
- Tan et al. (2013) Tan, Q., Daddi, E., Sargent, M., et al. 2013, ApJ, 776, L24
- Valenti et al. (2004) Valenti, E., Ferraro, F. R., & Origlia, L. 2004, MNRAS, 351, 1204
- Valentino et al. (2020) Valentino, F., Tanaka, M., Davidzon, I., et al. 2020, ApJ, 889, 93
- Walter et al. (2012) Walter, F., Decarli, R., Carilli, C., et al. 2012, Nature, 486, 233
- Ward et al. (2023) Ward, E. M., de la Vega, A., Mobasher, B., et al. 2023, arXiv e-prints, arXiv:2311.02162
- Webb et al. (2013) Webb, T. M. A., O’Donnell, D., Yee, H. K. C., et al. 2013, AJ, 146, 84
- Whitaker et al. (2012) Whitaker, K. E., van Dokkum, P. G., Brammer, G., & Franx, M. 2012, ApJ, 754, L29
- Wright et al. (2023) Wright, G. S., Rieke, G. H., Glasse, A., et al. 2023, PASP, 135, 048003
- Wright et al. (2015) Wright, G. S., Wright, D., Goodson, G. B., et al. 2015, PASP, 127, 595
- Xiao et al. (2023) Xiao, M. Y., Elbaz, D., Gómez-Guijarro, C., et al. 2023, A&A, 672, A18
- Yamada et al. (2013) Yamada, R., Oyabu, S., Kaneda, H., et al. 2013, PASJ, 65, 103
- Yao et al. (2023) Yao, Y., Song, J., Kong, X., et al. 2023, arXiv e-prints, arXiv:2307.13975
- Zavala et al. (2023) Zavala, J. A., Buat, V., Casey, C. M., et al. 2023, ApJ, 943, L9
- Zavala et al. (2021) Zavala, J. A., Casey, C. M., Manning, S. M., et al. 2021, ApJ, 909, 165