Online disinformation in the 2020 U.S. Election: swing vs. safe states
Abstract
For U.S. presidential elections, most states use the so-called winner-take-all system, in which the state’s presidential electors are awarded to the winning political party in the state after a popular vote phase, regardless of the actual margin of victory. Therefore, election campaigns are especially intense in states where there is no clear direction on which party will be the winning party. These states are often referred to as swing states. To measure the impact of such an election law on the campaigns, we analyze the Twitter activity surrounding the 2020 US preelection debate, with a particular focus on the spread of disinformation. We find that about 88% of the online traffic was associated with swing states. In addition, the sharing of links to unreliable news sources is significantly more prevalent in tweets associated with swing states: in this case, untrustworthy tweets are predominantly generated by automated accounts. Furthermore, we observe that the debate is mostly led by two main communities, one with a predominantly Republican affiliation and the other with accounts of different political orientations. Most of the disinformation comes from the former.
keywords:
Research
[id=n1]Equal contributor
1 Introduction
The proliferation of online disinformation has emerged as a pressing concern, akin to a modern-day plague. As major events unfold, be they elections, public health crises, or geopolitical shifts, disinformation often takes center stage, sowing confusion and distrust among the public111https://www.un.org/en/countering-disinformation All urls were last accessed on January 26, 2024., with potentially resounding offline consequences. To give a glaring example, on 3 September 2021, Jacob Anthony Angeli Chansley was sentenced to 41 months in prison for obstruction of justice. Chansley, also known by various nicknames such as “QAnon Shaman”, participated with other far-right activists in the attack on the United States Capitol on January 6, with the intention of disrupting the certification of election results. He was convinced by online disinformation campaigns about fraud against former President Donald Trump in the election222https://en.wikipedia.org/wiki/Jacob_Chansley. and a known conspiracy theorist tollefson2021trump . This egregious news episode is just the tip of the iceberg of a series of consequences that the proliferation of disinformation online has on society around election time. A nationwide survey in the U.S. after the 2018 midterm elections found that trust in the electoral system dropped significantly after Republican supporters spread unsubstantiated rumors of fraud online, driving voters away from politics, despite fact-checking efforts to disprove such rumors Berlinski2023 .
Numerous scholars have delved into the U.S. 2016 and 2020 presidential elections, seeking to gauge the extent to which digital disinformation influenced Trump’s victory/defeat, yet a definitive answer remains elusive. For example, the study by Georgacopoulos et al. Georgacopoulos2020how reveals that in the three months leading up to the 2016 election, fake news supporting Trump was shared on Facebook nearly four times more than the eight million fake news items supporting Clinton.
Examining more than 170 million tweets exchanged on Twitter in the five months leading up to the same election, Bovet and Makse Bovet2019influence found that trustworthy news stories overwhelmingly came from journalistic sources and verified Twitter accounts. In contrast, conspiracy theories, fake news, and highly partisan news largely originated from unofficial Twitter clients, posted by unknown users who often disappeared from the platform, or through automated accounts commonly referred to as social bots. Shao et al. shao2018anatomy also highlighted the role of Twitter bots, showing how these bots were primarily responsible for the early spread of disinformation by engaging influential accounts through mentions and replies.
The evolutionary adaptation of bots, characterized by their increasing ability to evade detection techniques, is well documented Ferrara2016rise ; Cresci2017paradigm . Luceri et al. luceri2019evolution , for example, found that from the 2016 presidential election to the 2018 midterm elections, political discussion bots evolved to the point where they became increasingly indistinguishable from humans. Analyzing the manipulation of online narratives around the 2020 U.S. election, Ferrara et al. Ferrara2020characterizing found that a relatively small number of automated accounts managed to generate traffic spikes in election discourse comparable in scale to human users, who significantly outnumbered them.
Our study focuses on the Twitter debate during the week leading up to November 4, 2020. Like previous research, we examine the flow of disinformation and the infiltration of bots into this discourse. However, our work uniquely focuses on two specific aspects of the U.S. presidential election: the presence of swing and safe states and the winner-take-all system. Recent literature comparing online political debates across countries highlights how different electoral systems lead to different structural properties within online social networks Bright2018 ; Urman2020 ; VanVliet2021 ; Praet2021 .
The term ‘swing’ refers to states where a landslide victory for either Republicans or Democrats is uncertain, owing to the lack of a clear voting orientation. In contrast, a state is deemed ‘safe’ when the electoral races are not competitive and are unlikely to be closely contested. Competitiveness is determined by several factors, including the political composition of the state and its counties, the prevailing local and national political climate, and insights from interviews with campaign experts333https://www.cookpolitical.com/ratings/presidential-race-ratings. Therefore, it is important to note that the status of swing and safe states is not fixed. Major swing states may become reliably safe Republican or Democratic states over time, while traditionally solid red or blue states may move into the swing state category. Changing demographics and political realignments within specific regions or demographic groups often drive these shifts444https://www.maynoothuniversity.ie/research/spotlight-research/10-swing-states-will-decide-us-presidential-election.
With the exception of Maine and Nebraska, all U.S. states utilize the winner-take-all voting method. Each state has a varying number of presidential electors, determined in part by its population. Following a popular vote, each state allocates its presidential electors based on the candidate with the most votes, due to the winner-take-all system. A major criticism of this system is that it incentivizes presidential candidates to focus their campaigns on a select few swing states, as they hold the key to victory555https://www.jstor.org/stable/j.ctt1npxbp. In particular, certain battleground states, such as Florida, traditionally a swing state with a substantial population and a large allocation of presidential electors666https://edition.cnn.com/election/2020/results/state/florida, have been subjected to more intense electoral campaigns. Transferring this critique to the realm of Twitter, our paper poses and answers a central question: Could it be that the Twitter discourse leading up to the 2020 U.S. presidential election mirrors the electoral system, specifically the distinction between swing and safe states?
Specifically referring to disinformation flows,
-
•
Is there a difference in the frequency of tweets containing links to dubious or unreliable news when they are associated with swing states or safe states during the 2020 pre-election season? Is this difference in frequency also related to the political orientation of the account?
-
•
Does the prevalence of automated accounts in online pre-election political debates differ depending on whether the discussion focuses on swing states or safe states? If so, is the difference also related to the political orientation of the account?
To perform the analysis, we collected Twitter data using keyword searches, specifically pairing candidate and state names. We then processed the data and the users who created and shared it as follows. First, we extracted links to news stories in the tweets and associated those stories with a level of trustworthiness. Second, we classified the users as bots or not. Third, we extracted the main discursive communities and their political orientation, which we used to (i) filter out irrelevant data from the entire dataset, specifically users who were not interested in the political narrative, and (ii) gain insight into the specific political leanings of the accounts.
1.1 Contributions
Our main contributions are:
-
•
We provide a fine-grained characterization of the Twitter traffic about the 2020 U.S. presidential election, in the week leading up to Election Day, adopting a multidisciplinary approach including complex network analysis, to identify non-trivial communities of users and their political leanings, artificial intelligence (to classify users as bots or not), and human-based annotation (to classify news sources as trustworthy or not).
-
•
To the best of our knowledge, this is the first paper that investigates the links between the U.S. presidential electoral system and the online debate about the election, focusing on automated accounts, the diffusion of low-credible news, and employing a sophisticated network-based approach to identify the specific political leanings of the users participating in the debate.
-
•
We provide compelling evidence of a correlation between the actual electoral mechanism, which tends to prioritize intense campaigning in swing states, and the online electoral debate. Indeed, we observe that a significant portion of the 2020 election-related online traffic revolves around tweets focused on swing states. Furthermore, the discourse surrounding swing states exhibits a higher concentration of links leading to untrustworthy news sites. Importantly, most of the disinformation content associated with swing states (and Republican supporters) originates from automated accounts, indicating their significant role in spreading such content.
1.2 Results
The experiments conducted in this work led us to the following results:
-
•
Tweets associated with swing states account for about 88% of the whole traffic. As a rough measure, the population of the swing states in the dataset represents 66% of the population of the states in our dataset. In this sense, the swing states have received more attention than would have been expected based solely on the number of electoral votes they represent.
-
•
Two main user communities emerge from the data: a homogeneous one, consisting of Republican supporters (hereafter referred to as Rep), and a mixed one, comprising journalists as well as both Republican and Democratic supporters (hereafter referred to as Rep-Dem-Journ).
-
•
More than 90% of links to news from untrustworthy publishers are concentrated in the Rep community. Each of these links is shared an average of 57 times, a significantly higher number than the average number of shares in the Rep-Dem-Journ community (7).
-
•
The percentage of tweets with URLs pointing to news from untrustworthy publishers is consistently higher for swing states in all communities.
-
•
Tweets associated with safe states have a higher concentration of URLs pointing to news with trustworthy publishers. Tweets associated with swing states have a higher concentration of URLs pointing to news with untrustworthy publishers.
-
•
Of the total number of tweets associated with swing states and containing untrustworthy URLs, 74% of these are posted or retweeted by accounts classified as bots.
1.3 Originality
This work is neither the first nor the last to address the impact of real-world events on virtual ones, and vice versa. A brief review on the relationships between electoral politics and social media will be presented later in this article. Work of Howard et al. in howard2018social examines tweets from authors who left some evidence of their physical location in the period leading up to the 2016 U.S. presidential election. The analysis reveals a high concentration of polarized news in tweets associated to swing states with a significant number of presidential electors.
In addition to differences in years (2016 versus 2020) and differences in data collection methods (hashtags versus general keywords), our study differs from the work of Howard et al. howard2018social in some important ways. First, our analysis includes an evaluation of automated accounts, and the classification of news sources is based on the annotations of expert journalists.
However, the primary distinction of our study lies in the rigorous filtering process applied to our dataset. This process employs advanced statistical methods specifically tailored for the analysis of complex networks, making them well suited for the study of interactions within social networks. For a complete understanding of these methodologies, the reader is referred to Sections 2 and 3.1. Using this filtering process allows us to gain insight into the political affiliations of users participating in these discussions (i.e., which political party users tend to be more closely associated with).
1.4 Change in Twitter property and the advent of Twitter/X
In late October 2022, Twitter, Inc., the American social media company, underwent a significant transformation when it became the property of Elon Musk777https://www.nytimes.com/2022/10/27/technology/elon-musk-twitter-deal-complete.html. This transition ushered in a series of radical changes and reforms that embraced both managerial and technical aspects.
One pivotal development of note for the scientific community was the discontinuation of Twitter’s free API tier by February 2023, to be replaced with a ‘basic paid tier’888https://twitter.com/XDevelopers/status/1621026986784337922. For researchers and developers, this change meant that Twitter content was no longer available for research purposes without subscribing to a significantly different paid plan. It also presented a challenge in terms of rehydrating the datasets currently in use. Despite the fact that our dataset was collected during a period of free access (from October 27 to November 3, 2020), the policy appears to be unchanged at the time of revising this manuscript 999https://developer.twitter.com/en/developer-terms/policy#4-e. Thus, we acknowledge the potential obstacles to the reproducibility of the experiments presented here.
However, we maintain that our methodology remains highly adaptable to other online social networks. It relies on two core principles: (i) the analysis of account activity related to the sharing of news source URLs, and (ii) the identification of discursive communities. Although extending the former to alternative social platforms is straightforward, the latter may present some challenges. In our case, we used the activity of verified users, a prominent group of content creators on Twitter Becatti2019d . Even if not all social platforms offer such certification, when analyzing other platforms we can still focus on other categories of users that play a central role in shaping public discourse, such as influential users as defined in previous studies Gonzalez2013 .
2 Related Work
Electoral politics and social media
The basic question in our article is whether the U.S. presidential election system, whose peculiarities make physical campaigning more vibrant in so-called swing states, mimics this aspect in online campaigning. From this perspective, we found it interesting to examine several works that have studied the relationship between electoral politics and the use of social media.
In particular, one paper used opinion mining techniques to examine in real-time the correspondence between exit poll results and the opinions of Twitter users in the week leading up to the 2020 U.S. election belcastro2022voter . In fact, it was possible to predict the president-elect in 10 of the 11 states considered to be swing states in 2020, even exceeding the percentages of the most recent physical exit polls. In this case, we could say that there was more than a campaign mimicry, there was a match precisely in the prediction of the winner.
Similarly, a series of articles focused on the influence that exposure to Facebook and Instagram feeds had on the voting decisions of U.S. citizens during the 2020 presidential election campaign101010Social Media and the 2020 election: https://www.princeton.edu/news/2023/07/28/social-media-polarization-and-2020-election-insights-spias-andrew-guess-and.
In a first paper guess2023feed , nearly 45k users from the two platforms were recruited. One control group retained feed visualization settings dictated by the platforms’ algorithms, while the others had their settings altered, allowing users to see the most recent feeds. Despite these changes, being fed content based on history rather than interests reportedly had no effect on the users’ political attitudes and off-platform behaviors.
A second paper was interested in the effects of viewing news shares on Facebook, again during the U.S. 2020 election period Guess2023resharing . The removal of re-shares significantly reduced the amount of political news, including content from untrusted sources. Despite this, there were no changes in political polarization or individual-level political attitudes in the subgroup that did not see shared content. From these studies, it appears, as above, that online users were little influenced by the content proposed by the platform and generated by other users, i.e. their voting intention was not surprisingly changed.
Many works on the relationship between electoral politics and social media focus on Europe, and in particular the European Parliament elections. The number of studies is probably due to the different facets that this particular election has in Europe, from the number of elected officials from each country, the presence of numerous local parties, and the doubt that campaigns are driven more by individual member state interests than by all as a community. In fact, according to experts, the European Parliament elections are experienced by European citizens as 27 different election campaigns, one for each member state111111Make or break for the EU? Europeans vote in June with far right on the rise: https://www.theguardian.com/world/2024/jan/03/make-or-break-for-the-eu-europeans-vote-in-june-with-far-right-on-the-rise.
One of the study’s findings is similar to ours: the more citizens the candidate is expected to represent, the more activity the candidate has on the social network. Thus, when the physical campaign becomes heavy and complex to manage, the campaign activity is changed online. However, the social activity of the Member of the European Parliament -or MEP- candidates is limited to the election period, indicating that social networks are not used to cement a relationship with the electorate, but rather for the sole purpose of garnering votes. Some studies justify the use of social networks by candidates as a means of broadcasting only on the grounds that interaction with users leads to insults and harassment. This was the result of an analysis in Theocharis2016workman , which found that the content of tweets directed at MEP candidates was often rude and harassing.
A continuation of the study in Daniel2016electoral is the one in Daniel2020reaching , where the authors looked at outgoing members of the European Parliament who, after the 2014 elections, ran again as candidates in the same elections in 2019. The purpose of the work was to see whether the different candidates focused their online campaigns more on themselves or on the party they represented. One finding that emerged, compared to running a physical campaign, was that the relatively low-cost nature of social media allowed some politicians to simultaneously campaign as individuals and as party animals in a way that analog campaigning could not.
Social campaigns for the 2019 European Parliament have been widely studied in the literature. The article collection in habler2021 analyzes how political parties in 12 member states used Facebook in the lead-up to elections. Again, the overall message is that social media was used to persuade the public to vote for the candidate, rather than using the platform to interact and mobilize voters.
This is also the conclusion of other work that has examined the relationship between social campaigning and electoral politics in the run-up to national elections in Europe. One example is the study in bright2020campaigning , in which two electoral events in Britain, in 2015 and 2017, are considered. What comes out is that, once again, the tendency of candidates to use the social medium is to broadcast the program and make propaganda, and not to interact with the electorate, even with the idea of maintaining solid contact after the election.
Disinformation flows in U.S. presidential elections
In the introduction, we already cited some analyses on detecting online disinformation flows in the periods leading up to the 2016 and 2020 U.S. presidential elections Georgacopoulos2020how ; Bovet2019influence ; shao2018anatomy ; Ferrara2020characterizing . We can also cite faris2017partisanship , where the authors analyzed both mainstream and social media coverage of the 2016 U.S. presidential election. Their analysis revealed the asymmetric nature of the media landscape, with Twitter displaying a more partisan tendency. Donald Trump’s campaign primarily emphasized immigration, whereas Hillary Clinton’s coverage tended to emphasize various scandals. Right-wing media tended to favor pro-Trump outlets, while left-wing media focused on traditional objective journalism.
As mentioned at the beginning of the article, Howard et al. in howard2018social conducted a study centered on analyzing tweets related to swing and safe states during the pre-election period of the 2016 U.S. presidential election. Their findings revealed a significant concentration of polarized news in tweets associated with swing states with a significant number of presidential electors. This work serves as a valuable precursor to our current study. It is important to note, however, that the election we examine differs from the one in their study. In addition, our research focuses on the behavior of social bots, and most importantly, we have refined our dataset by employing a process based on complex network analysis to filter out noise.
Statistical methods for the analysis of online social networks
The recent literature regarding online social networks has progressively implemented more techniques based on network science, with the aim of distinguishing non-trivial signals of social interactions from random noise.
In particular, the implementation of entropy-based null-models (see the review by Cimini et al Cimini2018a ) has opened up a variety of applications, providing a general and unbiased benchmark for the analysis of complex networks. The main idea is to create a maximally random benchmark (i.e., maximising the Shannon entropy associated with the system under analysis) that preserves some (topological) property of the original system. In this sense, with the aim of detecting non-trivial behaviours, maximum-entropy null-models represent a tool that, at the same time, is general and tailored on the observed network.
Here, we provide the sketch of the definition of the entropy-based null models for complex network analysis and all references for further information.
The aim of the entropy-based null-models is to define a benchmark for the analysis of a real network that is maximally random, but for a set of topological constraints observed on . Thus, we define an ensemble of graphs , i.e., the set of all possible graph configurations, from the empty graph to the fully connected one, all having the same number of nodes as in the real network. Then, we can assign a probability to every representative of the ensemble by maximising the relative Shannon entropy, i.e.,
under the constraint that the average over the ensemble of the vector is exactly the value observed in the real network , i.e., . The result of this procedure returns in an Exponential Random Graph, i.e. , where are the Lagrangian multipliers associated to the constrained maximisation Jaynes1957 ; park2004statistical . The maximisation of the likelihood, i.e., the probability of observing the real system, is then implemented to find the numerical values of Garlaschelli2008 ; Squartini2011a .
Recently, a fast and efficient Python module able to solve many of the entropy-based null-models present in the literature was released and is available at https://pypi.org/project/NEMtropy/.
The importance of using a properly defined unbiased benchmark for the analysis of the spread of online disinformation was stressed in a recent work by De Clerck et al. de2022maximum : the authors show how different entropy-based null-models can highlight different features of the various disinformation campaigns. In this paper, we will consider the entropy-based null-model known as Bipartite Configuration Model (BiCM Cimini2018a ; Saracco2015 ) as a benchmark to maintain only verified Twitter accounts that have statistically significant interactions with unverified ones. In Section 3.1 we describe the use of this model as a component of our filtering procedure.
3 Methods
3.1 Bipartite Configuration Model, Validated Projection and Community Detection
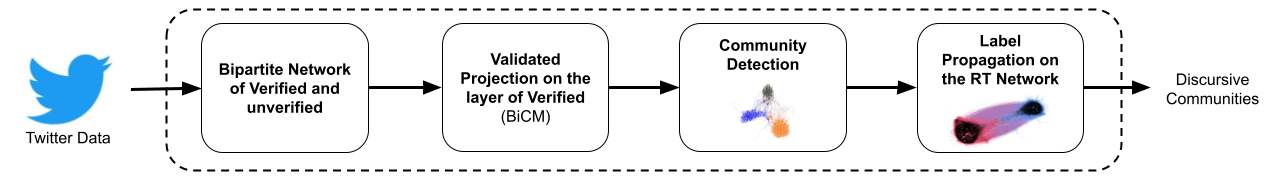
Here, we describe how we filter accounts in our dataset using the validation procedure known in the literature as Bipartite Configuration Model BiCM Cimini2018a ; Saracco2015 . As anticipated, our aim is to bring out political communities, leveraging the knowledge of the political affiliation of verified users. The procedure that starts from raw Twitter data to obtain the discursive communities is depicted in Figure 1.
The first observation is that most of the online debate is led by verified users, i.e., accounts whose owners are certified by the platform itself Becatti2019d ; Caldarelli2021 ; caldarelli2020role . It is possible, therefore, to leverage this information to obtain proper communities of ‘similar’ verified users: the intuition is that verified users with similar opinions in an online debate should have the same audience of ‘standard’ users.
Therefore we represent the retweet interactions between verified and unverified users as a bipartite network, i.e., networks in which nodes are divided in two sets, and -called layers- and connections are allowed only between layers; verified and unverified users are then represented by the two layers.
We then project the bipartite network on the layer of verified users. Nevertheless, the projection only does not tell us so much: In fact, the common retweeters of two verified users could be many due to popularity of the latter or because the retweeters are retweeting many verified users. We, therefore, need a benchmark that is maximally random and able to discount the effect of these two ingredients, which, in terms of the bipartite network defined above, are translated into the degree sequence of both layers. The entropy-based null-model for bipartite network discounting the information of the degree sequence is known as Bipartite Configuration Model (BiCM, Saracco2015 ).
Using the BiCM as a benchmark, it is possible to validate the projection of the bipartite network on one of its layers: the co-occurrences observed in the real system are compared with the related BiCM distributions and, if they are statistically significant, they are validated Saracco2017 . Therefore, the result of the validation procedure is a monopartite undirected unweighted network of verified users, in which two nodes are connected if the number of common retweeters is statistically significant, i.e., it cannot be explained simply by the bipartite degree sequence.
We subsequently run the Louvain community detection algorithm Blondel2008 on the validated network of verified users to obtain the main communities. Each of these communities was manually labeled based on the characteristics of the verified users inside.
Then, to include also unverified users, the so-obtained labels are propagated on the retweet network using the Raghavanan et al. algorithm Raghavan2007b , in order to provide all users a community label. Several works, like Becatti2019d ; caldarelli2020role ; radicioni2021networked ; DeClerck2022a ; de2022maximum show that the procedure above is particularly effective in capturing the structure of Twitter online debate. The communities identified using this procedure are termed discursive communities. These communities comprise both verified and non-verified users who actively contribute to the development of a shared discourse. A pivotal aspect of our characterization process begins with the verified users within these communities. This approach allows us to effectively ascertain whether a discursive community possesses a political nature and adheres to a specific orientation.
3.2 Article’s reliability measure through NewsGuard
In this study, our evaluation of untrustworthy content takes a distinct approach by centering the attention on the source of the content, the publisher, rather than focusing solely on individual stories. We categorize each source based on its credibility and transparency, a process that relies on the assessment conducted by NewsGuard121212https://www.newsguardtech.com/. This assessment involves expert journalists annotating online news sources.
This source-centric approach is grounded in the belief that the intent and practices of the publisher play pivotal roles in determining the trustworthiness of news lazer2018science . Furthermore, examining every single article individually is impractical, which makes this approach highly favored as it facilitates large-scale studies Caldarelli2021 ; shao2018spread .
For evaluating the credibility level, the Newsguard metrics consider, e.g., whether the news source regularly publishes false news, does not distinguish between facts and opinions, does not correct a wrongly reported news. For transparency, instead, the toolkit takes into account, e.g., whether owners, founders or authors of the news source are publicly known, and whether advertisements are easily recognizable 131313Details on the procedure for the evaluation are available at: https://www.newsguardtech.com/ratings/rating-process-criteria/.
| label | description |
|---|---|
| T | Trustworthy news domain |
| N | untrustworthy news domain |
| P | Platform (e.g., reddit.com, twitter.com) |
| S | Satire |
| UNC | unclassified |
Table 1 shows the tags that NewgsGuard associates with each news domain. Since we are interested in quantifying the reputation of news domains publishing during the period of interest, we do not consider sources corresponding to platforms (tag P). We will also not consider satirical news (tag S). The tags T and N in Table 1 are used only for news sites, be they newspapers, magazines, TV or radio channels, and stand for trustworthy and non-trustworthy, respectively. We clarify that for us, a domain corresponds to the so-called ‘second-level domain’141414https://en.wikipedia.org/wiki/Domain\_name, i.e. the name directly to the left of .com, .net and all other top-level domains. For example, nytimes.com and latimes.com are considered domains in this manuscript.
3.3 Bot detection
The accounts in our dataset were examined using the bot detector Botometer, one of the most well-known bot detection tools in the literature Varol2017 ; FerraraArming2019 ; DBLP:conf/cikm/Sayyadiharikandeh20 ; yang2020scalable . The tool is based on a supervised machine learning approach using Random Forest classifiers Breiman2001 . We rely on Botometer v4, the new version of the bot detector, which has been shown to perform well for detecting both single-acting bots and coordinated campaigns DBLP:conf/cikm/Sayyadiharikandeh20 ; yang2020scalable . In particular, we have adopted Botomoter v4 premium in the lite version BotometerLite151515https://cnets.indiana.edu/blog/2020/09/01/botometer-v4/, which does not interface with Twitter, but simply takes the tweet, retrieves the author, and does the necessary follow-up analysis. This light version only needs the information in the user profile to perform bot detection, so it can also process historical data published by accounts that are no longer active. Each request to BotometerLite can process a maximum of 100 users, with a limit of 200 requests per day, resulting in a maximum of 20k account checks per day. The immediate output of Botometer is the bot score , which ranges over {0, …1}, but does not represent the probability that the considered account is a bot. The value needs to be compared with other scores within a group of accounts to come up with a plausible ranking.
4 Results
4.1 Dataset
Using the Streaming Twitter API, we collected around 5.3M tweets in the week immediately preceding the elections (27 October-3 November 2020). To guide the data collection, we chose keywords combining the name of four swing and four safe states (see Table 3) with the candidates (i.e., Trump and Biden).
| Keywords |
|---|
| arizona biden |
| arizona trump |
| florida biden |
| florida trump |
| michigan biden |
| michigan trump |
| pennsylvania biden |
| pennsylvania trump |
| new jersey biden |
| new jersey trump |
| indiana biden |
| indiana trump |
| washington biden |
| washington trump |
| louisiana biden |
| louisiana trump |
The states were selected based on measures and indications provided in reports by experienced political analysts in the months leading up to the 2020 elections161616https://www.cookpolitical.com/analysis/national/national-politics/latest-cook-political-report-electoral-college-map. We chose a balanced list of states, four safe states and four swing states. For the safe states, we chose two pairs that were balanced in terms of political leanings and presidential electors. We took Washington and New Jersey from the solid Democratic states and Indiana and Louisiana from the solid Republican states. This results in 26 electoral votes for the Democratic candidate and 19 for the Republican. For the selection of the swing states, we took the three most important states from the point of view of presidential electors: Florida (29 votes), Pennsylvania (20 votes), and Michigan (16 votes); we also added Arizona (11 votes) because it has been of particular interest in the election debates171717https://fivethirtyeight.com/features/how-arizona-became-a-swing-state/,181818https://www.washingtonpost.com/politics/2022/09/16/senate-control-midterm-elections-2022/. We should further clarify that our choice was not driven by any “formal” definition based on statistics relative to the results of previous elections, but by the indications of political analysts (especially those in \footreffoot:cookpolitical). For example, Arizona gave its electoral votes to the Republicans in the 2000, 2004, 2008, 2012, and 2016 elections. However, the consensus among political analysts, based on various polls, was that Arizona was no longer a safe state for Republicans. In fact, Arizona gave its electoral vote to Biden in 2020. With that in mind, we considered Arizona a swing state, even though the historical data would have placed it in the safe set.
The data was further processed to (i) identify user communities with a vested interest in the political narrative through our filtering process, (ii) classify link domains using NewsGuard, and (iii) map each tweet to its corresponding state type (i.e., swing or safe) using a content-based approach.
The procedure for filtering the data set is described in Section 3.1. From here on, we will refer to the product of the filtering procedure as the ‘validated dataset’ (to distinguish it from the original dataset). For both the verified and unverified accounts that pass the filtering procedure, we also collect the bot scores via BotometerLite.
For URL classification, we rely on NewsGuard191919https://www.newsguardtech.com/, which provides a set of {domain_name, tag} pairs (tags are in Table 1). It was therefore necessary to translate all the short-form URLs contained in the text of the tweets, so that we could have the domain names in clear.
We use a content-based approach to establish the association between each tweet and the state type (i.e., swing or safe). In practice, we first check each tweet - or retweet - for the presence of at least one state name from the selected list (e.g., Arizona, Florida, etc.). We then exclude any tweets that contain more than one state name (approximately 1.5 million tweets contain more than one state name). Consequently, each tweet in the resulting dataset contains only one state name, which can be swing or safe. Although it is true that posts discussing the states under analysis have been lost, we prefer such a conservative approach to eliminate possible noise from our data set. Furthermore, we only consider English tweets (non-English tweets number about 422,000). The resulting dataset contains about 3.3 million tweets and about 398,000 URLs (see Table 3).
Finally, we conclude this subsection by noting that our analysis aims to investigate whether the debate about swing states is meaningfully different from the debate about safe states. Therefore, we are not interested in checking the origin of the tweets, i.e. whether or not their authors are located in the states under analysis. In fact, even users outside the US can contribute to the debate and/or the level of disinformation in it.
| State | No. Tweets | No. URL |
|---|---|---|
| Arizona | 224046 | 34637 |
| Florida | 744006 | 85373 |
| Michigan | 734600 | 87529 |
| Pennsylvania | 1209083 | 145067 |
| New Jersey | 38007 | 8114 |
| Indiana | 17185 | 988 |
| Washington | 342104 | 36254 |
| Louisiana | 6886 | 633 |
| Total | 3315917 | 398595 |
4.2 Detection of discursive communities
| Community | No. Users | No. Tweets | Tweets Safe | Tweets Swing | No. URL | Left | Right |
|---|---|---|---|---|---|---|---|
| Rep | 269019 | 2083158 | 12.35 | 87.65 | 241488 | 0.59 | 49.74 |
| Rep-Dem-Journ | 213679 | 919949 | 10.39 | 89.61 | 92412 | 16.18 | 1.86 |
| Journ-1 | 197 | 1174 | 4.86 | 95.14 | 485 | 3.30 | 0.82 |
| Journ-2 | 53 | 404 | 10.64 | 89.36 | 74 | 22.97 | 2.70 |
| Others | 218880 | 311232 | 16.44 | 83.56 | 64136 | 6.62 | 14.60 |
| Dataset | 701828 | 3315917 | 12.19 | 87.81 | 398595 | 5.18 | 32.92 |
We execute the procedure outlined in Section 3.1 to identify discursive communities, which are groups of Twitter accounts that actively contribute to the development of a shared discourse by retweeting among themselves; results are summarised in Table 4.
The giant component of the retweet network includes more than accounts, while nearly accounts belong to smaller clusters: the latter are not going to be analysed in the following since they are not relevant for the entire debate.
To characterize the community structure of the giant component, we conduct a manual analysis a posteriori of the various communities, leveraging the presence of verified accounts (as discussed in Section 3.1) i.e., authentic public interest accounts like politicians, journalists or VIPs.
To assign labels to the list of verified users within each community, we gave priority to users with higher node degrees, indicating a greater number of connections. The largest community within the giant component primarily consists of Republican supporters and comprises approximately users. Some examples of users within this community include ‘@TrumpWarRoom’, ‘@TeamTrump’, and ‘@TrumpStudents’. This community will be referred to as Rep henceforth.
The second most populated community, with around accounts, is a mixed one encompassing Republicans, Democrats, as well as various journals and journalists with diverse political orientations. Accordingly, it will be labeled as Rep-Dem-Journ.
Accounts in the Rep and Rep-Dem-Journ communities are responsible for over 90% of the tweets in our dataset (see Table 4). While other communities do exist within the giant component, their size is practically negligible compared to the ones described above or they lack a clear political orientation. Therefore, they will not be considered in the subsequent analysis.
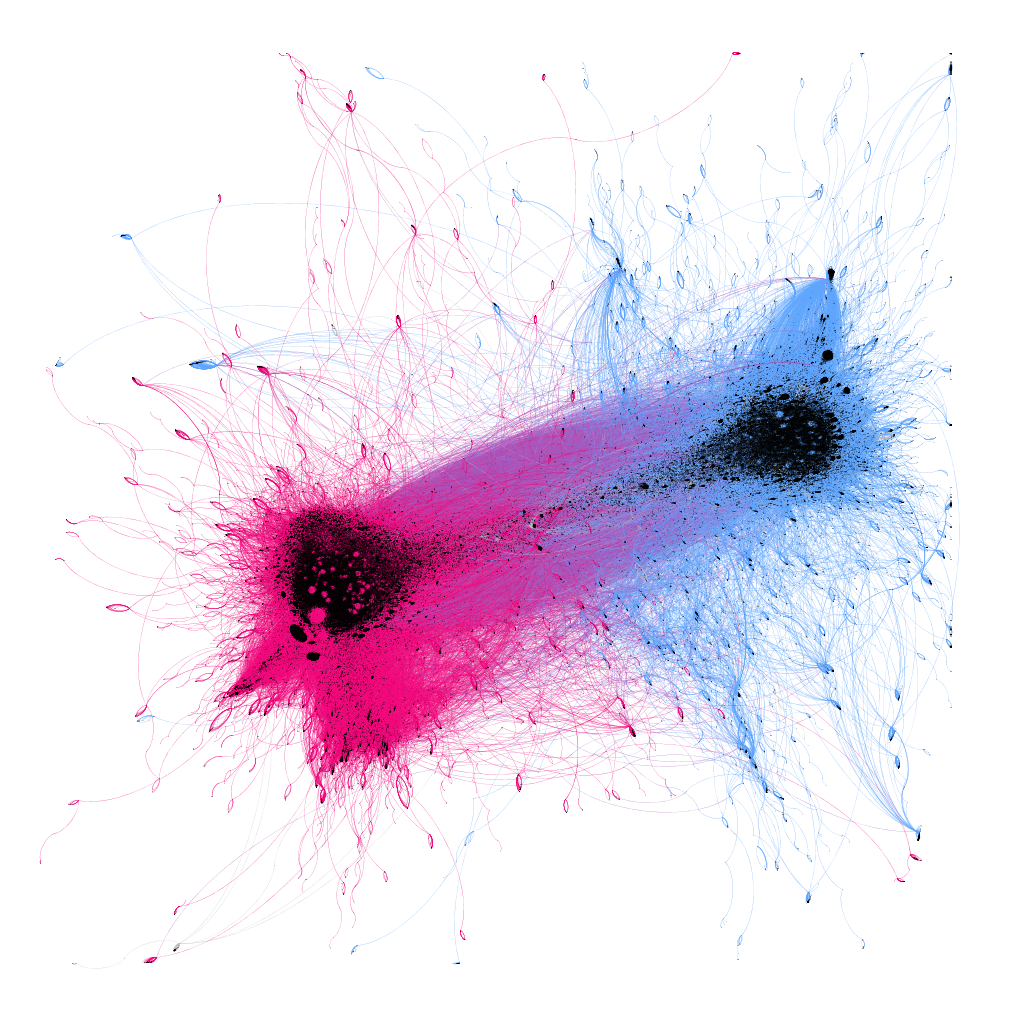
In particular, our analysis will focus only on the result of the entropy-based filtering procedure, i.e. the users belonging to the Rep and Rep-Dem-Journ communities. Figure 2 shows these two main communities, which emerge after running the label propagation algorithm in Raghavan2007b to the retweet network.
The result of the analysis of news domains in the tweets of major communities is a good indication of their correct labeling. The Left and Right columns in Table 4 represent the percentage of sources identified by NewsGuard as left-wing and right-wing oriented, respectively. Within the Rep community, almost 50% of the shared URLs come from right-leaning sources. In the Rep-Dem-Journ community, the prevalence of left-leaning sources is significantly lower, approximately 16.2%. This measure can probably be explained by observing the mixed composition of the Rep-Dem-Journ community.
We also conducted a manual analysis of a sample of users from the emerging communities to verify the correct composition of the latter. Specifically, we randomly selected a subset of 99 unverified accounts and created a balanced sample representative of emerging discursive communities, including Rep, Rep-Dem-Journ, and those users assigned to other communities or without any community association. We then manually annotated the Twitter users within the sample, taking into account (i) the content of the messages they write or retweet, (ii) the political orientation of the news publishers they share (using the NewsGuard labels), and (iii) the political orientation of well-known Twitter users they retweet.
When comparing the manual annotations with our labeling procedure, 89 out of 99 users showed consistent labels. However, 10 users who were not assigned to any community by our filtering procedure showed inconsistencies in the labels. A content analysis of these 10 users reveals an association with Republican and Democratic political visions (6 and 4 users, respectively). It is important to emphasize that these minor discrepancies do not affect our analysis, which focuses on users belonging to the main communities, i.e., Rep-Dem-Journ and Rep.
4.3 Reputation of news domains
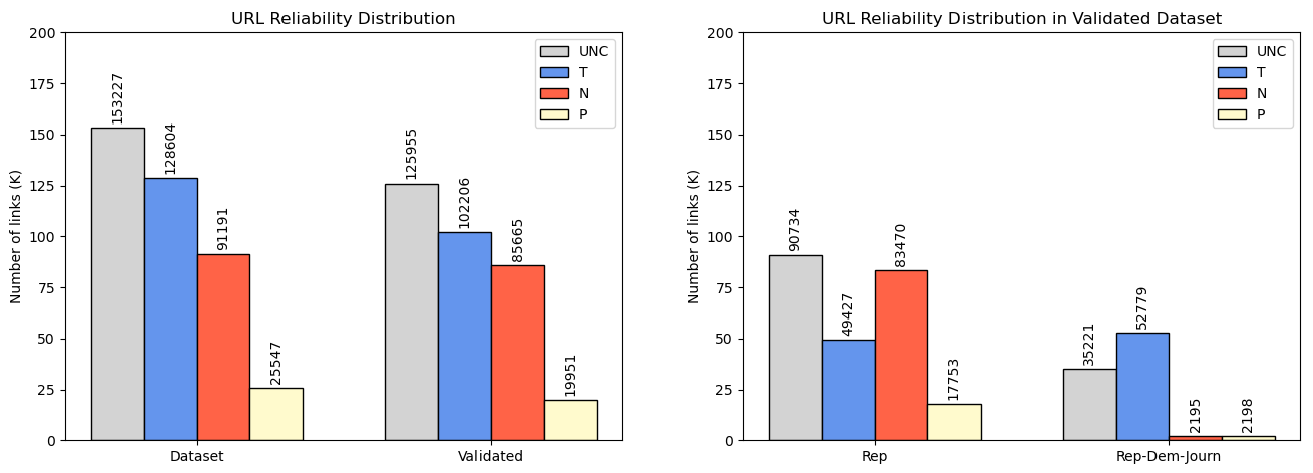
Figure 3 (left) shows the distribution of URLs found in tweets in the full and validated datasets, respectively. The URLs have been tagged according to the NewsGuard labels. The validation procedure discards of the tweets with URLs from the full dataset, which is about 64k tweets. Thus, most of the links are distributed within the political communities that emerge from the data.
Figure 3 (right) shows that, with respect to the entire dataset, the 93% of untrustworthy links (N) are shared within the two main political communities. In particular, about 91% of the total is shared within the Rep community. Furthermore, the news sources tagged as N by NewsGuard are mostly right-leaning (i.e., Slightly Left , Far Left , Slightly Right , Far Right ).
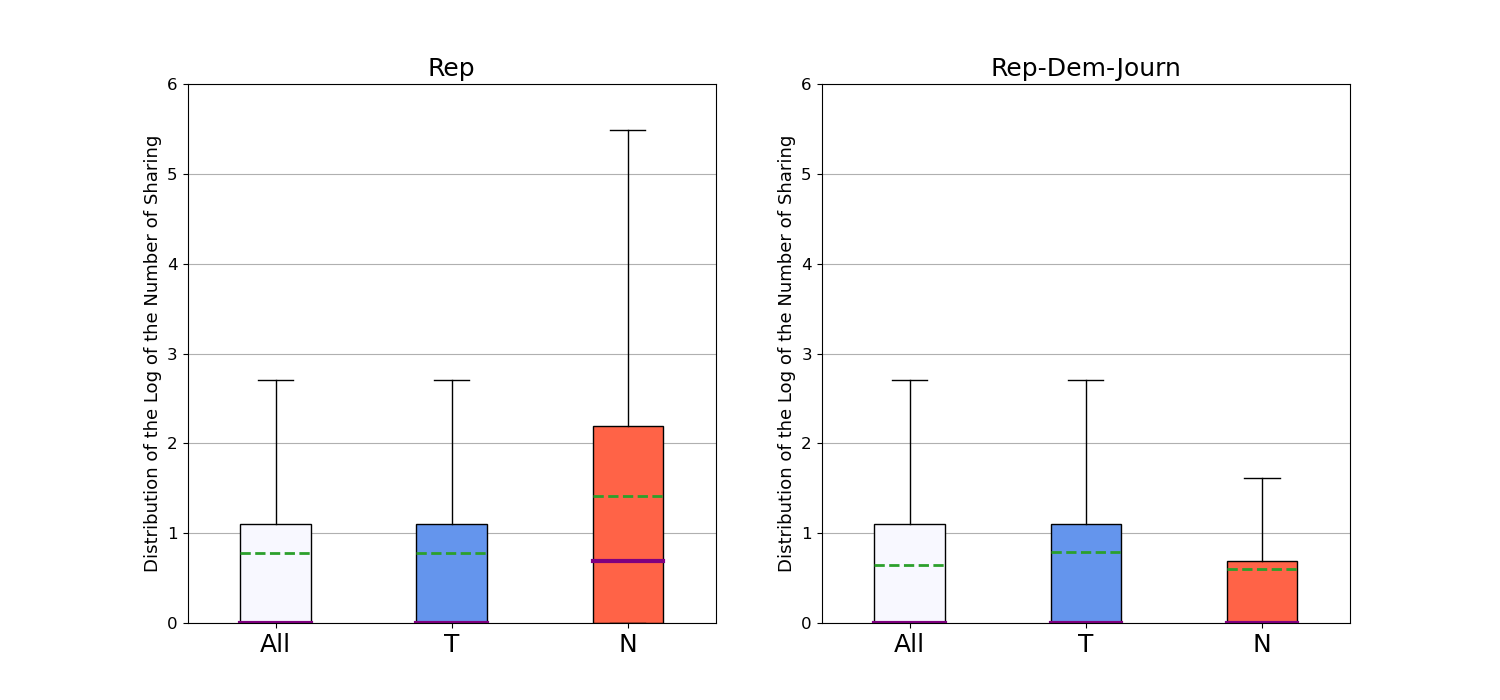
Figure 4 shows the virality of the links, that is, how many times the links in our dataset have been shared. We can see that in Rep, links of type N are shared many more times than other types of links. Specifically, in Rep, an N link is shared on average 57 times, while in Rep-Dem-Journ it is shared 7 times. These results suggest that untrustworthy links find fertile ground among Republican supporters.
4.4 Reputation of news domains in tweets associated to swing and safe states
| States | No. Users | No. Tweets | No. URL | T | N |
| Validated | |||||
| Swing | 451840 | 2649642 | 299210 | 28.30 | 26.06 |
| Safe | 170644 | 352863 | 34586 | 50.66 | 22.25 |
| Rep | |||||
| Swing | 251615 | 1825320 | 218565 | 18.66 | 34.72 |
| Safe | 112556 | 257236 | 22819 | 37.92 | 33.25 |
| Rep-Dem-Journ | |||||
| Swing | 200225 | 824322 | 80645 | 54.45 | 2.59 |
| Safe | 58088 | 95627 | 11767 | 75.37 | 0.91 |
Here, we analyze the flow of disinformation in tweets associated with swing or safe states and per discursive community. We recall that a tweet is associated with a state if the name of the state is present in the tweet text. By construction, each tweet in our dataset contains only one state name.
Table 5 gives statistics on the number of accounts, tweets, and URLs related to the kind of state associated with the tweets and to the two main political communities. We see that the vast majority of traffic is associated with tweets about swing states (about 88% of the total, see row Validated, column No. Tweets). When looking at links pointing to untrustworthy news sites (N), the concentration for swing states - 26.06%. - is higher than for safe states - 22.25%. The concentration of trustworthy links (T) is higher for safe states - 50.66% vs 28.30% for swing states.
To statistically validate the frequencies of N and T links in tweets associated with swing and safe states, we performed the chi-square Pearson1900 statistical test. The comparison between the frequency distribution of T and N links in such tweets and the frequency distribution of T and N links in the validated dataset is significantly different: the obtained p-value for the test is below the order of .
At the community level, in agreement with the results in Section 4.3, we observe a higher concentration of links N in the Rep community; however, we do not observe substantial differences in terms of percentage of links N between swing and safe states for both Rep and Rep-Dem-Journ (Table 5, rightmost column). For both communities, the highest concentration of trustworthy links (T) is in tweets associated with safe states (column T).
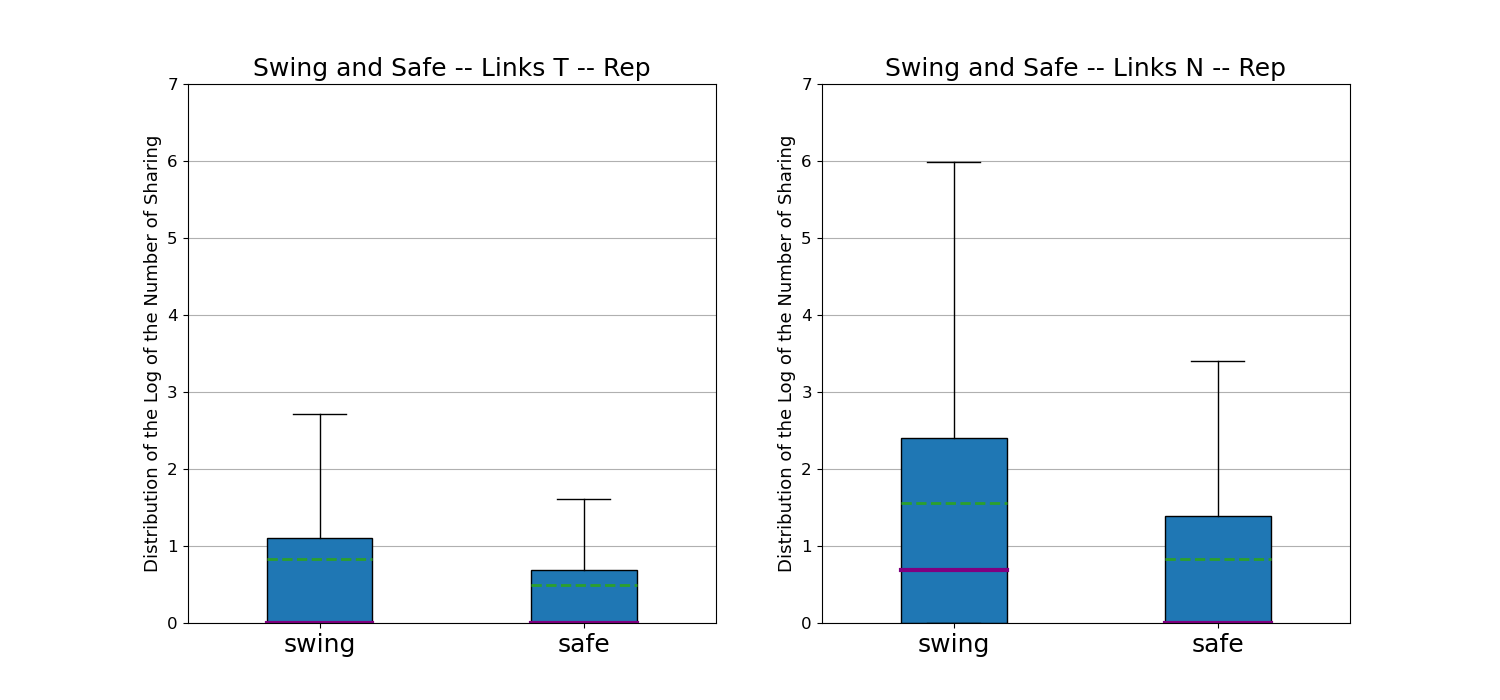
Figure 5 shows that in Rep, untrustworthy links (N) are shared many more times on average in the debate associated with swing states. Specifically, the average number of shares is 66 times for swing and 22 times for safe. For trustworthy links (T), a similar but not as pronounced behavior is observed.
4.5 Social bots
In this section, we explore the relationship between disinformation flow and the characteristics of accounts in our dataset. We determine the bot scores of the accounts using BotomerLite, Section 3.3. The bot score provides a measure of the extent to which an account exhibits bot-like characteristics, on a scale of 0 to 1. The closer the score is to 1, the more likely it is that the account is a bot.
We perform two different analyses. The first analysis aims to determine whether the bots in our dataset exhibit a discernible political orientation. Specifically, we seek to determine whether accounts within the Rep community tend to exhibit more automated behavior than those in the Rep-Dem-Journ community. In our second analysis, we aim to examine two critical aspects: 1. the correlation between the type of accounts and their propensity to generate untrustworthy traffic; and 2. exploring potential correlations between automated accounts and traffic associated with swing states.
For the first analysis, we compare the bot score distributions in Rep and Rep-Dem-Journ using the Mann-Whitney U mann1947 and Kolmogorov-Smirnov smirnov1939test statistical tests. Both tests are used to determine whether two distributions are different, and if so, in what way. The bot score distributions were created by keeping the bot score of the account that posted each tweet.
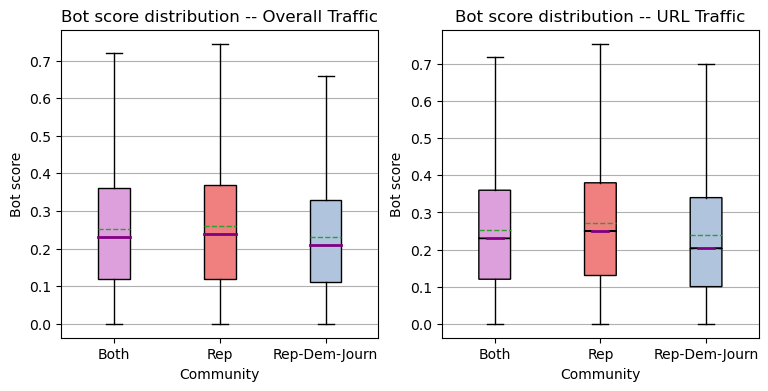
Figure 6 shows the distributions of bot scores with respect to total traffic (left) and traffic containing only URLs (right). Since the distributions associated with the two communities have relatively close means (for the total traffic: Rep and Rep-Dem-Journ ; for URL traffic: Rep and Rep-Dem-Journ ), we perform the Kolmogorov-Smirnov and Mann-Whitney U statistical tests to assess whether the distributions are statistically different.
The Kolmogorov-Smirnov (KS) test measures the distance between two empirical distributions as the maximum difference in their cumulative distributions. The p-values of the Kolmogorov-Smirnov tests (as shown in Table 6) indicate that the distributions of bot scores in the two communities are significantly different from that of the entire dataset (p-values are less than ). The Mann-Whitney U (MWU) test evaluates the difference in location between the distributions. Our results, as shown in Table 7, confirm that the distributions are significantly different (again, all p-values are less than ). Furthermore, the values of the bot scores in the Rep community are higher than those of the entire dataset, and significantly exceed the scores measured in the Rep-Dem-Journ community. These results suggest that tweets in the two communities are generated by users with different characteristics in terms of bot scores (Figure 6).
| distA | distB | KS test (distA,distB) | p-valueKS |
|---|---|---|---|
| Validated | Rep | 0.021 | |
| Validated | Rep-Dem-Journ | 0.047 | |
| Rep-Dem-Journ | Rep | 0.068 |
| distA | distB | MWU test (distA,distB) | MWU test (distB,distA) | p-valueMWU |
|---|---|---|---|---|
| Validated | Rep | 0.486 | 0.514 | |
| Validated | Rep-Dem-Journ | 0.532 | 0.468 | |
| Rep-Dem-Journ | Rep | 0.453 | 0.547 |
The second analysis aims to detect untrustworthy tweets posted by bot accounts, and the potential correlation between bots and swing-related tweets. To identify which accounts are bots, we take the conservative approach used in Ferrara2020characterizing : we classify as bots those accounts ‘that fall at the upper end of the bot score distribution’. This approach has the dual benefit of preventing misclassification of accounts with borderline scores, while focusing on accounts with clear bot characteristics. In practice, we tag each account in the validated dataset using BotometerLite, sort them from lowest to highest bot score, and isolate those with bot scores in the first and last deciles. In the first decile we have real accounts, while in the last decile we have bot accounts. Specifically, the first decile contains accounts with bot scores in the range [0, 0.04], and the last decile contains accounts with bot scores in the range [0.45, 1]. We collect tweets from both real accounts and bots to investigate the source of untrustworthy traffic. We acknowledge that we exclude many accounts from our validated dataset by not including those with bot scores in the range [0.04, 0.45]. Nevertheless, this approach provides us with more reliable guarantees to minimize false positive and false negative predictions.
Table 8 shows statistics for classified accounts. Of the total number of classified accounts, 47.19% are bots. Considering only the Rep community, this percentage increases to 54.93%, while in the Rep-Dem-Journ community it decreases to 37.35%. In terms of posting activity, bots appear to be more active than real accounts, being about twice as active in both posting tweets and sharing tweets with URLs. Of the total traffic generated by classified accounts, bots contribute 64.19% of the traffic, reaching 68.07% in the Rep community and dropping to 53.94% in the Rep-Dem-Journ community.
| Label | No. Users | No. Tweets | No. URL |
|---|---|---|---|
| Validated dataset | |||
| human | 57797 | 228378 | 25422 |
| bot | 51648 | 409449 | 53017 |
| Rep | |||
| human | 27624 | 147772 | 16156 |
| bot | 33663 | 315065 | 41383 |
| Rep-Dem-Journ | |||
| human | 30173 | 80606 | 9266 |
| bot | 17985 | 94384 | 11634 |
4.5.1 Disinformation, bots, discursive communities, and swing states
Here we focus on the role of bots in spreading links to low-trustworthy/non-trustworthy news stories. Table 9 shows the percentages of (i) all, (ii) trustworthy (T), and (iii) non-trustworthy (N) URLs shared by users classified as bots or real. The table also takes into account their membership in a discursive community (Rep or Rep-Dem-Journ) and a state category (swing or safe).
Focusing on the Swing & Safe column in Table 9, we see that about 73% of the untrustworthy (N) traffic is generated by bots, regardless of the community, while bots are responsible for about of tweets with trustworthy URLs. If we focus only on the traffic generated in Rep, the bots spread 73. 84% of the N and 69.11% of the T links. Focusing only on untrustworthy links, of the 91% of the total in swing states, more than 74% are posted or retweeted by bots. Furthermore, while untrustworthy links associated with safe states are only a small part of the total (8.47%), the vast majority of this traffic comes from bot accounts (68.75%).
| Swing & Safe | Swing | Safe | ||||||||||
| Community | No. URL | swing | safe | bot | human | bot | human | bot | human | |||
| All Links | ||||||||||||
| Validated dataset | 78439 | 89.92 | 10.08 | 67.59 | 32.41 | 67.87 | 32.13 | 65.06 | 34.94 | |||
| Rep | 57539 | 90.78 | 9.22 | 71.92 | 28.08 | 72.26 | 27.74 | 68.63 | 31.37 | |||
| Rep-Dem-Journ | 20900 | 87.54 | 12.46 | 55.67 | 44.33 | 55.36 | 44.64 | 57.77 | 42.23 | |||
| Trustworthy Links (T) | ||||||||||||
| Validated dataset | 23036 | 83.07 | 16.93 | 62.90 | 37.10 | 62.69 | 37.31 | 63.96 | 36.04 | |||
| Rep | 11812 | 83.46 | 16.54 | 69.11 | 30.89 | 68.84 | 31.16 | 70.47 | 29.53 | |||
| Rep-Dem-Journ | 11224 | 82.65 | 17.35 | 56.37 | 43.63 | 56.15 | 43.85 | 57.42 | 42.58 | |||
| Non-trustworthy Links (N) | ||||||||||||
| Validated dataset | 20627 | 91.53 | 8.47 | 73.69 | 26.31 | 74.15 | 25.85 | 68.75 | 31.25 | |||
| Rep | 20147 | 91.42 | 8.58 | 73.84 | 26.16 | 74.33 | 25.67 | 68.59 | 31.41 | |||
| Rep-Dem-Journ | 480 | 96.25 | 3.75 | 67.50 | 32.50 | 66.88 | 33.12 | 83.33 | 16.67 | |||
5 Discussion
The study of disinformation within online social networks during election campaigns has yielded a wealth of contributions, exemplified by works such as Becatti et al. Becatti2019d , Bovet and Makse Bovet2019influence , Budak et al. budak2019happened , Ferrara et al. Ferrara2020characterizing , Georgacopoulos et al. Georgacopoulos2020how , Luceri et al. luceri2019evolution , and Mattei et al. mattei2022bowtie , to name a few. However, the spread of untrustworthy content has rarely been linked to the specifics of a particular electoral system; most existing disinformation studies tend to focus on individual countries. Yet emerging evidence suggests that the electoral process plays a role in shaping the dynamics of online discourse. Limited findings to date Bright2018 ; Urman2020 ; VanVliet2021 ; Praet2021 ; howard2018social suggest that there are differences in how online accounts organize themselves in discussions, either promoting divisive or cohesive structures, depending on whether a country uses majoritarian, proportional, or plurality voting systems.
In our current research, while still focusing on a single country, we direct our attention to two specific aspects: (i) a feature of its presidential electoral system-the presence of swing and safe states-and (ii) whether and to what extent this feature is reflected in the spread of online disinformation.
To elaborate further, each U.S. state is allocated a certain number of presidential electors, and after the statewide popular vote, the faction that receives the highest number of votes claims all of the electors, regardless of the margin of victory. Safe states are those where election outcomes can be easily predicted, while swing states represent fiercely contested battlegrounds that are crucial to securing the presidential election.
With this context in mind, our analysis focuses on the 2020 U.S. presidential election. We focus specifically on the Twitter discourse surrounding eight states, four of which are categorized as safe states (New Jersey, Indiana, Washington, and Louisiana) and the remaining four as swing states (Arizona, Florida, Michigan, and Pennsylvania). We then selected tweets that contained the names of the presidential candidates (either Biden or Trump) and the names of one of the selected states in their text.
Our first result is that 88% tweets in our dataset is related to swing states. This underlines the importance of swing states (as opposed to safe) in the political discussion.
Secondly, from Table 5 we observe that the frequency of untrustworthy URLs shared in the political debate of swing states (26.06) is greater than the analogous of safe states (22.25%). Symmetrically, the frequency of trustworthy URLs is higher in safe states (50.66%) than swing ones (28.30%). In this sense, not only the debate, but also the spread of disinformation is more intense in swing states due to their importance for the election outcome. To summarize, both the total flow of news and the frequency of untrustworthy URLs are higher in swing states.
Thirdly, we investigate the exposure to disinformation of the two main emergent discursive communities: a great community of Republican supporters (the Rep community) and a mixed one, including both Democrats and Republicans, as well as various journalists (the Rep-Dem-Journ community). Remarkably, the Rep community hosts 91% of the total URLs pointing to untrustworthy news sources. In addition, each untrustworthy URL in the Rep community is shared, on average, more than any other type of URL.
Finally, we investigate the contribution of automated accounts in the spreading of disinformation. Let the reader consider Table 9: bots appear to be more active than genuine accounts in posting tweets, both in swing and in safe states, with comparable percentages, i.e. 67% vs. 65%, respectively in swing and safe states. Regarding the untrustworthy links shared in swing states, more than 74% are posted or retweeted by bots.
Our analyses were conducted through a careful filtering process applied to the original dataset. We used techniques rooted in Information Theory and Statistical Mechanics principles related to complex networks, as discussed in Section 3.1, to elucidate political communities. In particular, we focused on the bipartite network representing retweet interactions between verified and unverified users.
To validate the projection of the bipartite network onto the verified user layer, we employed the BiCM (Bipartite Configuration Model) as a benchmark. This involved establishing links between verified users if the number of shared unverified retweeters was statistically significant. We then ran a community detection algorithm on the resulting network of verified users. To extend these communities to unverified Twitter users, we leveraged our knowledge of verified users and implemented a label propagation procedure. Our validation approach ensures that we account for interactions that cannot be attributed solely to user degree sequences, which distinguishes our work from similar studies such as that of Howard et al. howard2018social , who analyzed disinformation flows in swing and safe states during the 2016 election but did not employ entropy-based null models.
In sum, our hypothesis that the spread of disinformation is more pronounced in swing states finds robust support in the data. Due to their pivotal role in determining election outcomes, swing states not only attract a higher volume of tweets, but also bear a greater percentage of the brunt of disinformation campaigns compared to safe states. This disparity in the impact of disinformation, coupled with the increased flow of messages, leads to a particularly worrisome spike in disinformation messages.
Limitations and future work
While our findings provide compelling insights, it is important to acknowledge certain limitations that invite further investigation. First, our research was limited to a select number of U.S. swing and safe states, providing a specific snapshot of the broader electoral landscape. In addition, our analysis was limited to the 2020 U.S. presidential election. Expanding our study to include comparative analyses with the 2012 and 2016 elections could either validate our conclusions or contextualize them in the context of the 2020 contest.
We also focus on a subset of swing and safe states, rather than all of them. Our choice was a compromise between a number of practical limitations. First, we needed a dataset of manageable size, so we limited our analyses to a subset of swing states, focusing on the four largest. Second, we needed an appropriate benchmark, i.e., a sample of safe states against which to compare our measurements. Such a choice was more complicated because the number of safe Republican states tends to be much larger than the number of safe Democratic states, but they tend to be less populous and thus represent a smaller number of electoral votes. In this sense, a good compromise was to choose four safe states, i.e. the same number of swing states, equally divided between Democrats and Republicans, with almost the same number of electoral votes. In addition, it is important to note that even if the states we chose to study happen to exhibit a flow of misinformation that is significantly different from that of other solid states, we still have evidence of an increased focus by misinformation producers on states that are more likely to influence the final outcome of the national election.
Furthermore, our data collection methodology relied on keyword-based approaches that inherently lack a precise understanding of the exact content of the collected tweets. Although the presence of both state and candidate names in the tweets implies a connection to the election and the state, the specific content remains unknown until examined.
Extending our study to other plurality voting systems with similarities to the U.S., such as the United Kingdom, would provide valuable insights into the presence of analogous disinformation diffusion dynamics within swing constituencies. In addition, examining the presence of disinformation at the geographic level within different electoral systems, including proportional systems (e.g., Germany and Spain), majoritarian systems (e.g., France), or mixed systems (e.g., Italy, South Korea, and Japan), would further enrich our understanding of this phenomenon.
Finally, we argue that our research contributes to a more detailed examination of the relationship between electoral systems, online discourse, and the spread of online disinformation.
Declarations
Availability of data and materials
The dataset supporting the conclusions of this article is available in the dataverse repository, https://doi.org/10.7910/DVN/ANBPTC. The data about the reliability of the various news sources comes from NewGguard, but restrictions to their availability apply since they were used under a NewsGuard license and they are not publicly available. These data could be however available upon reasonable request and with permission of Newsguard.
Competing interests
The authors declare that they have no competing interests.
Funding
This work is partially supported by project SERICS (PE00000014) under the MUR National Recovery and Resilience Plan funded by the European Union - #NextGenerationEU, by the Integrated Activity Project TOFFEe (TOols for Fighting FakEs) https://toffee.imtlucca.it/ and by the IIT-CNR funded Project re-DESIRE (DissEmination of ScIentific REsults 2.0).
Author’s contributions
The authors declare equal contribution.
Acknowledgements
The authors thank the reviewers for their valuable suggestions.
References
- (1) Tollefson, J.: How trump turned conspiracy theory research upside down. Nature 590, 192–193 (2021)
- (2) Berlinski, N., Doyle, M., Guess, A.M., Levy, G., Lyons, B., Montgomery, J.M., Nyhan, B., Reifler, J.: The effects of unsubstantiated claims of voter fraud on confidence in elections. Journal of Experimental Political Science 10(1), 34–49 (2023). doi:10.1017/XPS.2021.18
- (3) Georgacopoulos, C., Mores, G.: How fake news affected the 2016 presidential election. faculty.lsu.edu – White Paper (2020)
- (4) Bovet, A., Makse, H.: Influence of fake news in Twitter during the 2016 us presidential election. Nature Communications 10(7) (2019)
- (5) Shao, C., Hui, P.-M., Wang, L., Jiang, X., Flammini, A., Menczer, F., Ciampaglia, G.L.: Anatomy of an online misinformation network. Plos one 13(4), 0196087 (2018)
- (6) Ferrara, E., Varol, O., Davis, C., Menczer, F., Flammini, A.: The rise of social bots. Commun. ACM 59(7), 96–104 (2016)
- (7) Cresci, S., Di Pietro, R., Petrocchi, M., Spognardi, A., Tesconi, M.: The paradigm-shift of social spambots: Evidence, theories, and tools for the arms race. In: Proceedings of the 26th International Conference on World Wide Web Companion (WWW’17), pp. 963–972 (2017). ACM
- (8) Luceri, L., Deb, A., Giordano, S., Ferrara, E.: Evolution of bot and human behavior during elections. First Monday (2019)
- (9) Ferrara, E., Chang, H., Chen, E., Muric, G., Patel, J.: Characterizing social media manipulation in the 2020 us presidential election. First Monday (2020)
- (10) Bright, J.: Explaining the Emergence of Political Fragmentation on Social Media: The Role of Ideology and Extremism. Journal of Computer-Mediated Communication 23(1), 17–33 (2018). doi:10.1093/jcmc/zmx002. https://academic.oup.com/jcmc/article-pdf/23/1/17/23822774/zmx002.pdf
- (11) Urman, A.: Context matters: political polarization on twitter from a comparative perspective. Media, Culture & Society 42(6), 857–879 (2020). doi:10.1177/0163443719876541. https://doi.org/10.1177/0163443719876541
- (12) Van Vliet, L., Törnberg, P., Uitermark, J.: Political systems and political networks: The structure of parliamentarians’ retweet networks in 19 countries. International Journal of Communication 15, 2156–2176 (2021)
- (13) Praet, S., Martens, D., Van Aelst, P.: Patterns of democracy? social network analysis of parliamentary Twitter networks in 12 countries. Online Social Networks and Media 24 (2021). doi:10.1016/j.osnem.2021.100154
- (14) Howard, P.N., Kollanyi, B., Bradshaw, S., Neudert, L.-M.: Social media, news and political information during the us election: Was polarizing content concentrated in swing states? Technical report, Data Memo 2017.8. Oxford, UK: Project on Computational Propaganda (2017)
- (15) Becatti, C., Caldarelli, G., Lambiotte, R., Saracco, F.: Extracting significant signal of news consumption from social networks: the case of twitter in italian political elections. Palgrave Communications 5, 1–16 (2019). doi:10.1057/s41599-019-0300-3
- (16) González-Bailón, S., Borge-Holthoefer, J., Moreno, Y.: Broadcasters and hidden influentials in online protest diffusion. American Behavioral Scientist (2013). doi:10.1177/0002764213479371
- (17) Belcastro, L., Branda, F., Cantini, R., Marozzo, F., Talia, D., Trunfio, P.: Analyzing voter behavior on social media during the 2020 us presidential election campaign. Soc Netw Anal Min. 12(1) (2022). doi:10.1007/s13278-022-00913-9
- (18) Guess, A.M., et al.: How do social media feed algorithms affect attitudes and behavior in an election campaign? Science 381(6656), 398–404 (2023). doi:10.1126/science.abp9364
- (19) Guess, A.M., et al.: Reshares on social media amplify political news but do not detectably affect beliefs or opinions. Science 381(6656), 404–408 (2023). doi:10.1126/science.add8424
- (20) Theocharis, Y., Barberá, P., Fazekas, Z., Popa, S.A., Parnet, O.: A Bad Workman Blames His Tweets: The Consequences of Citizens’ Uncivil Twitter Use When Interacting With Party Candidates. Journal of Communication 66(6), 1007–1031 (2016). doi:10.1111/jcom.12259
- (21) Obholzer, L., Daniel, W.T.: An online electoral connection? how electoral systems condition representatives’ social media use. European Union Politics 17(3), 387–407 (2016). doi:10.1177/1465116516630149
- (22) Daniel, W.T., Obholzer, L.: Reaching out to the voter? campaigning on twitter during the 2019 european elections. Research & Politics 7(2), 2053168020917256 (2020). doi:10.1177/2053168020917256
- (23) Haßler, J., Magin, M., Russmann, U., Fenoll, V.: Campaigning on Facebook in the 2019 European Parliament Election. Palgrave Macmillan Cham, ??? (2021). doi:10.1007/978-3-030-73851-8
- (24) Bright, J., Hale, S., Ganesh, B., Bulovsky, A., Margetts, H., & Howard, P.: Does campaigning on social media make a difference? evidence from candidate use of twitter during the 2015 and 2017 u.k. elections. Communication Research (2020). doi:10.1177/0093650219872394
- (25) Faris, R., Roberts, H., Etling, B., Bourassa, N., Zuckerman, E., Benkler, Y.: Partisanship, propaganda, and disinformation: Online media and the 2016 us presidential election. Berkman Klein Center Research Publication 6 (2017)
- (26) Cimini, G., Squartini, T., Saracco, F., Garlaschelli, D., Gabrielli, A., Caldarelli, G.: The statistical physics of real-world networks. Nature Reviews Physics 1, 58–71 (2018). doi:10.1038/s42254-018-0002-6
- (27) Jaynes, E.T.: Information Theory and Statistical Mechanics. Physical Review 106(4), 620–630 (1957)
- (28) Park, J., Newman, M.E.J.: Statistical mechanics of networks. Phys. Rev. E 70(6), 66117 (2004). doi:10.1103/PhysRevE.70.066117
- (29) Garlaschelli, D., Loffredo, M.I.: Maximum likelihood: Extracting unbiased information from complex networks. Physical Review E 78, 1–5 (2008). doi:10.1103/PhysRevE.78.015101
- (30) Squartini, T., Garlaschelli, D.: Analytical maximum-likelihood method to detect patterns in real networks. New Journal of Physics 13, 083001 (2011). doi:10.1088/1367-2630/13/8/083001
- (31) De Clerck, B., Rocha, L.E., Van Utterbeeck, F.: Maximum entropy networks for large scale social network node analysis. Applied Network Science 7(1), 68 (2022)
- (32) Saracco, F., Di Clemente, R., Gabrielli, A., Squartini, T.: Randomizing bipartite networks: the case of the World Trade Web. Sci. Rep. 5(1), 10595 (2015). doi:10.1038/srep10595
- (33) Caldarelli, G., Nicola, R.D., Petrocchi, M., Pratelli, M., Saracco, F.: Flow of online misinformation during the peak of the covid-19 pandemic in italy. EPJ Data Science 2021 10:1 10, 1–23 (2021). doi:10.1140/EPJDS/S13688-021-00289-4
- (34) Caldarelli, G., De Nicola, R., Del Vigna, F., Petrocchi, M., Saracco, F.: The role of bot squads in the political propaganda on twitter. Communications Physics 3(1), 1–15 (2020)
- (35) Saracco, F., Straka, M.J., Di Clemente, R., Gabrielli, A., Caldarelli, G., Squartini, T.: Inferring monopartite projections of bipartite networks: An entropy-based approach. New J. Phys. (2017). doi:10.1088/1367-2630/aa6b38. 1607.02481
- (36) Blondel, V.D., Guillaume, J.-L., Lambiotte, R., Lefebvre, E.: Fast unfolding of communities in large networks. J. Stat. Mech. Theory Exp. 10008(10), 6 (2008). doi:10.1088/1742-5468/2008/10/P10008
- (37) Raghavan, U.N., Albert, R., Kumara, S.: Near linear time algorithm to detect community structures in large-scale networks. Phys. Rev. E - Stat. Nonlinear, Soft Matter Phys. (2007). doi:10.1103/PhysRevE.76.036106
- (38) Radicioni, T., Squartini, T., Pavan, E., Saracco, F.: Networked partisanship and framing: a socio-semantic network analysis of the italian debate on migration. PloS one 16(8), 0256705 (2021)
- (39) Clerck, B.D., Utterbeeck, F.V., Petit, J., Lauwens, B., Mees, W., Rocha, L.E.C.: Maximum entropy networks applied on twitter disinformation datasets. Studies in Computational Intelligence 1016, 132–143 (2022). doi:10.1007/978-3-030-93413-2_12/COVER
- (40) Lazer, D.M., Baum, M.A., Benkler, Y., Berinsky, A.J., Greenhill, K.M., Menczer, F., Metzger, M.J., Nyhan, B., Pennycook, G., Rothschild, D., et al.: The science of fake news. Science 359(6380), 1094–1096 (2018)
- (41) Shao, C., Ciampaglia, G.L., Varol, O., Yang, K.-C., Flammini, A., Menczer, F.: The spread of low-credibility content by social bots. Nature communications 9(1), 1–9 (2018)
- (42) Varol, O., Ferrara, E., Davis, C.A., Menczer, F., Flammini, A.: Online human-bot interactions: Detection, estimation, and characterization. In: Proceedings of the Eleventh International Conference on Web and Social Media, ICWSM 2017, Montréal, Québec, Canada, May 15-18, 2017., pp. 280–289 (2017). https://aaai.org/ocs/index.php/ICWSM/ICWSM17/paper/view/15587
- (43) Yang, K., Varol, O., Davis, C.A., Ferrara, E., Flammini, A., Menczer, F.: Arming the public with AI to counter social bots. CoRR abs/1901.00912 (2019)
- (44) Sayyadiharikandeh, M., et al.: Detection of novel social bots by ensembles of specialized classifiers. In: CIKM ’20: The 29th ACM International Conference on Information and Knowledge Management, pp. 2725–2732 (2020)
- (45) Yang, K.-C., Varol, O., Hui, P.-M., Menczer, F.: Scalable and generalizable social bot detection through data selection. In: Proceedings of the AAAI Conference on Artificial Intelligence, vol. 34, pp. 1096–1103 (2020)
- (46) Breiman, L.: Random forests. Machine Learning 45(1), 5–32 (2001). doi:10.1023/A:1010933404324
- (47) Pearson, K.: On the criterion that a given system of deviations from the probable in the case of a correlated system of variables is such that it can be reasonably supposed to have arisen from random sampling. Philosophical Magazine Series 5(50), 157–175 (1900)
- (48) Mann, H.B., Whitney, D.R.: On a Test of Whether one of Two Random Variables is Stochastically Larger than the Other. The Annals of Mathematical Statistics 18(1), 50–60 (1947)
- (49) Smirnov, N.: Estimate of deviation between empirical distribution functions in two independent samples. Bull. Moscow Univ. 2(2), 3–16 (1939)
- (50) Budak, C.: What happened? the spread of fake news publisher content during the 2016 us presidential election. In: The World Wide Web Conference, pp. 139–150 (2019)
- (51) Mattei, M., et al.: Bow-tie structures of twitter discursive communities. Scientific Reports 12 (2022)
Figure Legends and Table Legends
-
•
Table 1: Tags are inherited from NewsGuard, the UNC tag indicates that NewsGuard has not yet tagged that domain.
-
•
Table 4: Two main communities emerge, Rep and Rep-Dem-Journ. With Others we characterize all the accounts that do not belong to the giant component: their contribution is going to be disregarded in the following, since they do not contribute to the entire debate.
-
•
Figure 2: The two main communities that emerge are the red one, characterized by Republican supporters, and the blue one, a mix of Republicans, Democrats, and journalists of various affiliations.
-
•
Figure 3: trustworthy news publisher (T); untrustworthy news publisher (N); not a news site, e.g. platforms as amazon.com (P); link corresponding to a domain not classified by NewsGuard (UNC).
-
•
Figure 4: Values are normalized applying a log function. The green line is the mean, the purple line is the median; outliers are not reported. The box extends from the first quartile to the third quartile. The whiskers extend from the box to the outermost data point within 1.5 times the interquartile range from the box.
-
•
Figure 5: Values are normalized applying a log function. The green line is the mean, the purple line is the median.The box extends from the first quartile to the third quartile. The whiskers extend from the box to the outermost data point within 1.5 times the interquartile range from the box.
-
•
Figure 6: The green line is the mean, the purple line is the median. The box extends from the first quartile to the third quartile. The whiskers extend from the box to the outermost data point within 1.5 times the interquartile range from the box.
List of abbreviations
| Abbreviation | Definition |
|---|---|
| API | Application Programming Interface |
| BiCM | Bipartite Configuration Model |
| MEP | Member of the European Parliament |
| MWU | Mann-Whitney U test |
| N | Untrustworthy news domain |
| No. | Number |
| P | Platform domain (e.g., reddit.com, twitter.com) |
| QAnon | American political conspiracy theory and political movement |
| Rep-Dem-Journ | Community of mixed users, comprising journalists as well as both Republican and Democratic supporters |
| Rep | Community of Republican supporters |
| S | Satire domain |
| T | Trustworthy news domain |
| U.S. | United States |
| UNC | Unclassified domain |
| URL | Uniform Resource Locator |
| VIP | Very Important People |